
Last Elliott wave analysis concluded that upwards movement was most likely. This is what happened for Friday. Upwards movement was confirmed early in the session with a new high above 2,178.29.
Summary: The upwards trend is continuing after a sideways consolidation, which is now complete. Corrections are an opportunity to join the trend. The short term target is 2,192. The first mid term target is at 2,332. If price rises through this target, the next mid term target is at 2,445. The long term target for this bull market to end remains at 2,500.
Last monthly chart for the main wave count is here.
New updates to this analysis are in bold.
MAIN WAVE COUNT
WEEKLY CHART
Click chart to enlarge.
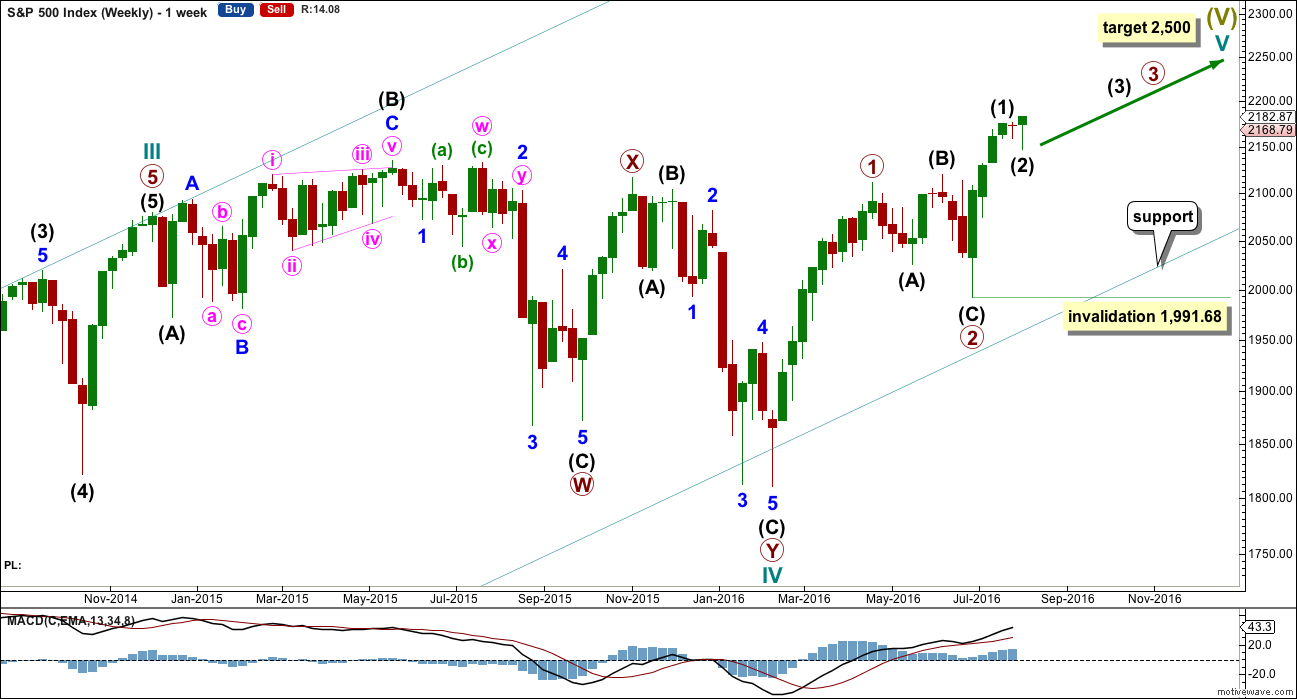
Cycle wave II was a shallow 0.41 zigzag lasting three months. Cycle wave IV is now seen as a more shallow 0.28 double combination lasting 15 months. With cycle wave IV five times the duration of cycle wave II, it should be over there.
Cycle wave I lasted 28 months (not a Fibonacci number), cycle wave II lasted a Fibonacci 3 months, cycle wave III lasted 38 months (not a Fibonacci number), and cycle wave IV lasted 15 months (two more than a Fibonacci 13).
If the target for cycle wave V is for it to be equal in length with cycle wave I, then it may also be expected to be about equal in duration. So far cycle wave V is in its sixth month. After this month, a further 22 months to total 28 seems a reasonable expectation, or possibly a further 15 months to total a Fibonacci 21.
This first weekly wave count expects the more common structure of an impulse is unfolding for cycle wave V. Within cycle wave V, primary waves 1 and now 2 should be over. Within primary wave 3, no second wave correction may move beyond its start below 1,991.68.
There is one other possible structure for cycle wave V, an ending diagonal. This is covered in an alternate.
DAILY CHART
Click chart to enlarge.
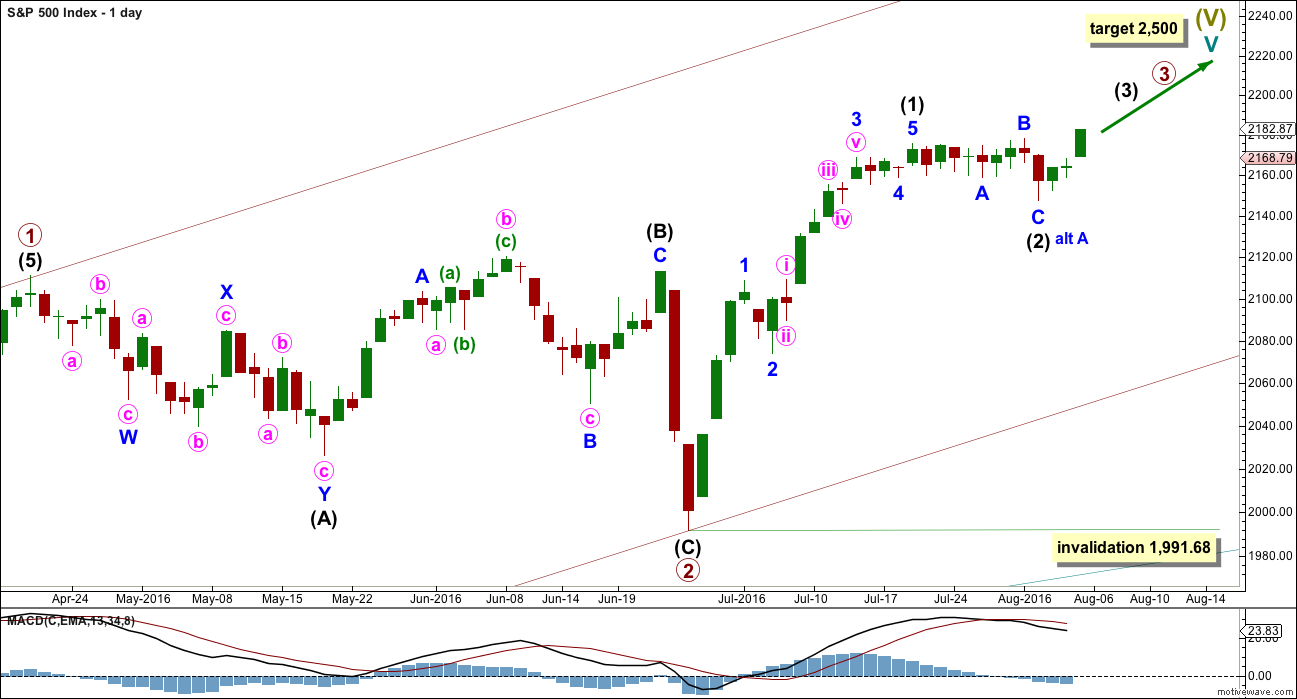
Primary wave 2 is complete as a shallow regular flat correction. Primary wave 3 is underway.
Within primary wave 3, intermediate wave (1) is a complete impulse. Intermediate wave (2) may now be a complete flat correction.
If the degree of labelling within intermediate wave (2) is moved down one degree (alternate labelling), then it is still possible that only minor wave A is complete as a flat correction. It is possible that intermediate wave (2) may complete further sideways as a longer lasting flat correction, or a double flat or double combination. All options would expect sideways movement though, not a deep pullback.
Within a possible continuation of intermediate wave (2), there is no upper invalidation point for the idea because there is no rule stating a limit for a B wave within a flat. There is a convention within Elliott wave that states once the possible B wave is longer than twice the length of the A wave the probability that a flat is unfolding is so low the idea should be discarded. Here that price point would be at 2,203.68.
Above 2,203.68 more confidence in this wave count and the targets may be had.
Intermediate wave (2) may not move beyond the start of intermediate wave (1) below 1,991.68.
HOURLY CHART
Click chart to enlarge.
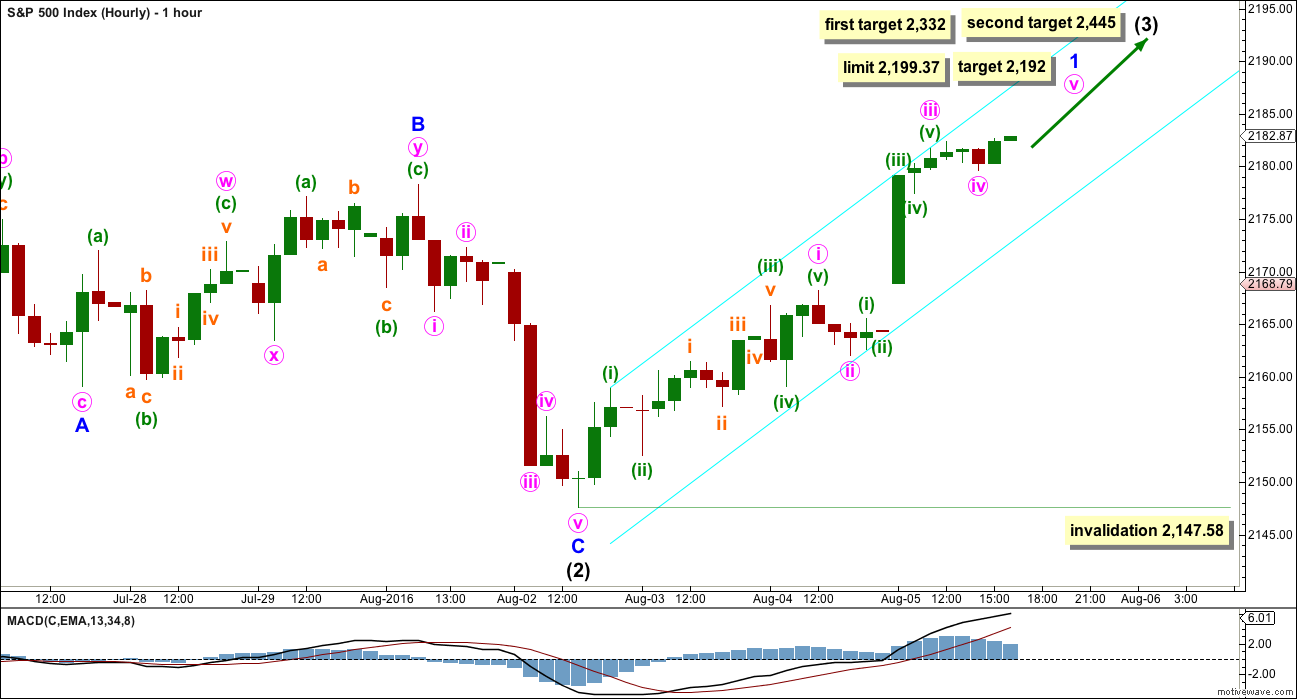
Upwards movement for Friday looks like a third wave for minute wave iii. On the five minute chart, minute wave v looks incomplete.
Minute wave iii is slightly shorter than minute wave i. This limits minute wave v to no longer than equality in length with minute wave iii, so that minute wave iii is not the shortest and the core Elliott wave rule is met. At 2,199.37 minute wave v would reach equality in length with minute wave iii. It must end at or before this point.
At 2,192 minute wave v would reach 0.618 the length of minute wave i.
When minor wave 1 is complete, then a small correction for minor wave 2 should unfold. It may not be deep but should show up on the daily chart. The S&P500 tends to show the subdivisions of the second and fourth waves within its third waves at the daily chart level.
The cyan trend channel is a best fit. When this is breached by downwards movement, it would be indicating an end to minor wave 1 and the beginning of minor wave 2. At that stage, a Fibonacci retracement would be drawn along the length of minor wave 1. The 0.236 and 0.382 Fibonacci ratios would be the more likely targets for minor wave 2, with the 0.618 Fibonacci ratio less likely. This is because so far within cycle wave V there is a pattern of shallow second wave corrections and this is likely to continue for lower degrees.
At 2,332 intermediate wave (3) would reach equality in length with intermediate wave (1). This is a reasonable Fibonacci ratio to use for the target because intermediate wave (2) would be very shallow at only 0.15 of intermediate wave (1).
At 2,445 intermediate wave (3) would reach 1.618 the length of intermediate wave (1).
Intermediate wave (3) may only subdivide as an impulse. Minor wave 1 would still be incomplete within intermediate wave (3). Minor wave 2 may not move beyond the start of minor wave 1 below 2,147.58.
ALTERNATE WAVE COUNT
At this stage, the alternate wave count now needs an impulse to complete upwards. As there is no divergence between the main and alternate wave counts at this stage, and there won’t be for weeks probably, charts for the alternate will not be published as this time. It adds nothing of use to the analysis.
The alternate idea of an ending diagonal for cycle wave V will be followed and published again when it diverges from the main wave count.
TECHNICAL ANALYSIS
WEEKLY CHART
Click chart to enlarge. Chart courtesy of StockCharts.com.
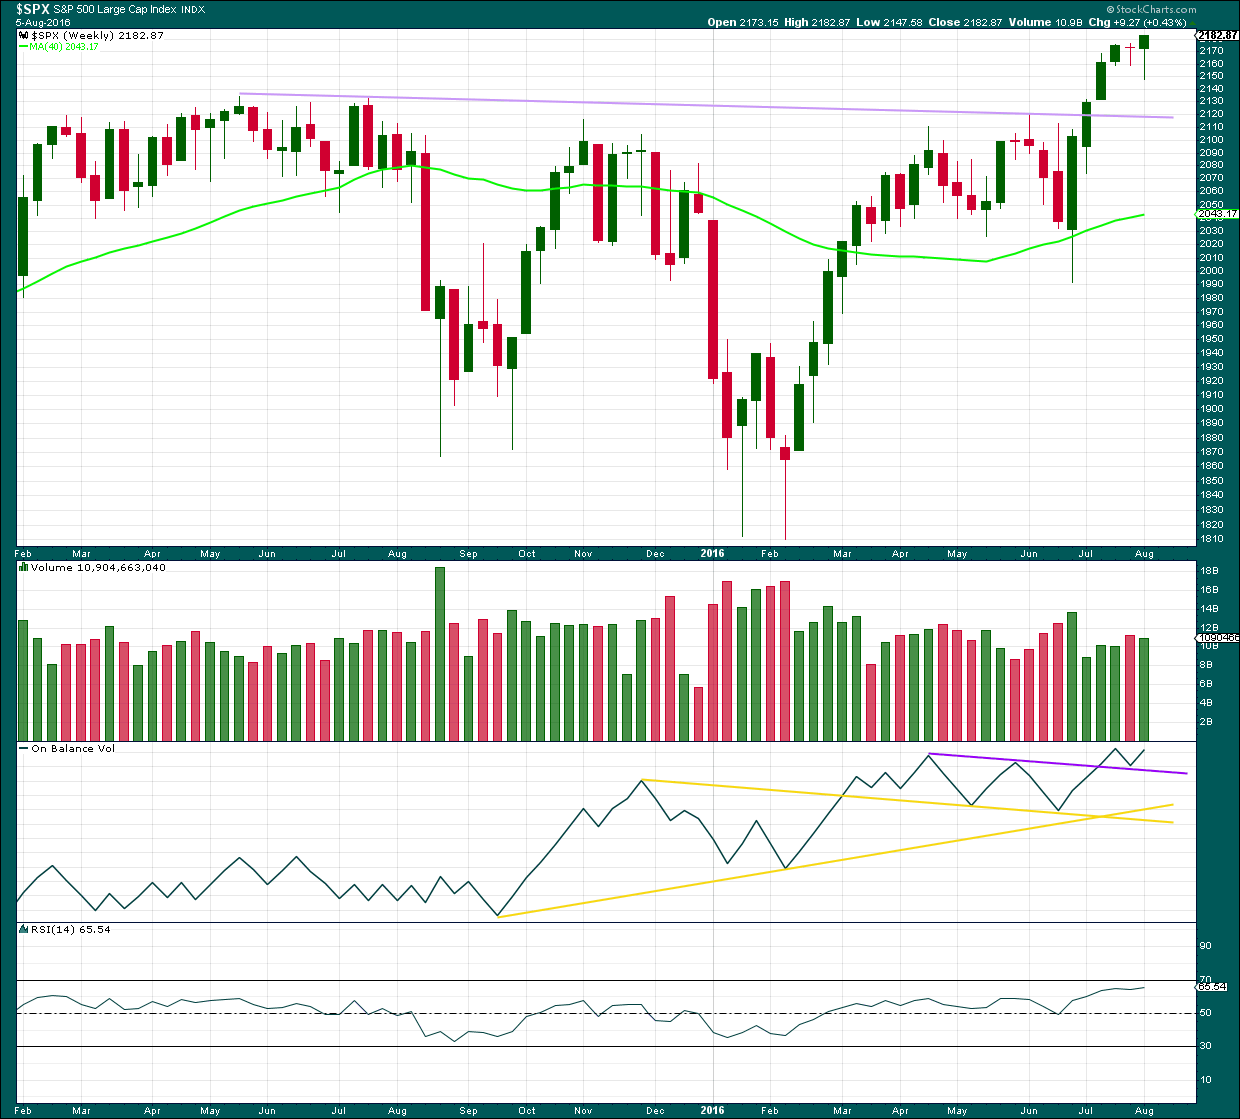
The bearish implications of the stalled candlestick pattern should now be fulfilled with two weeks of a small consolidation.
This week ended with a new high at the close. The weekly candlestick is a hanging man, but due to the bullish implications of the long lower wick and the green real body this requires confirmation with a downwards week before the bearish implications can be considered seriously.
At this stage, any deeper pullback should find strong support at the lilac trend line. Support at this line should stop any pullback from being very deep.
This week the bulls were dominant. They rallied to push price out of a consolidation and managed to hold price above prior resistance to close above on Friday. The long lower wick of this weekly candlestick is bullish.
The weekly candlestick comes with slightly lighter volume than last downwards week. The rise in price was not well supported by volume. But that has been a common pattern in recent months, so perhaps not too much bearishness should be read in to this here.
On Balance Volume is still bullish as it remains above the purple trend line.
RSI is not yet overbought. There is room yet for a further rise in price.
DAILY CHART
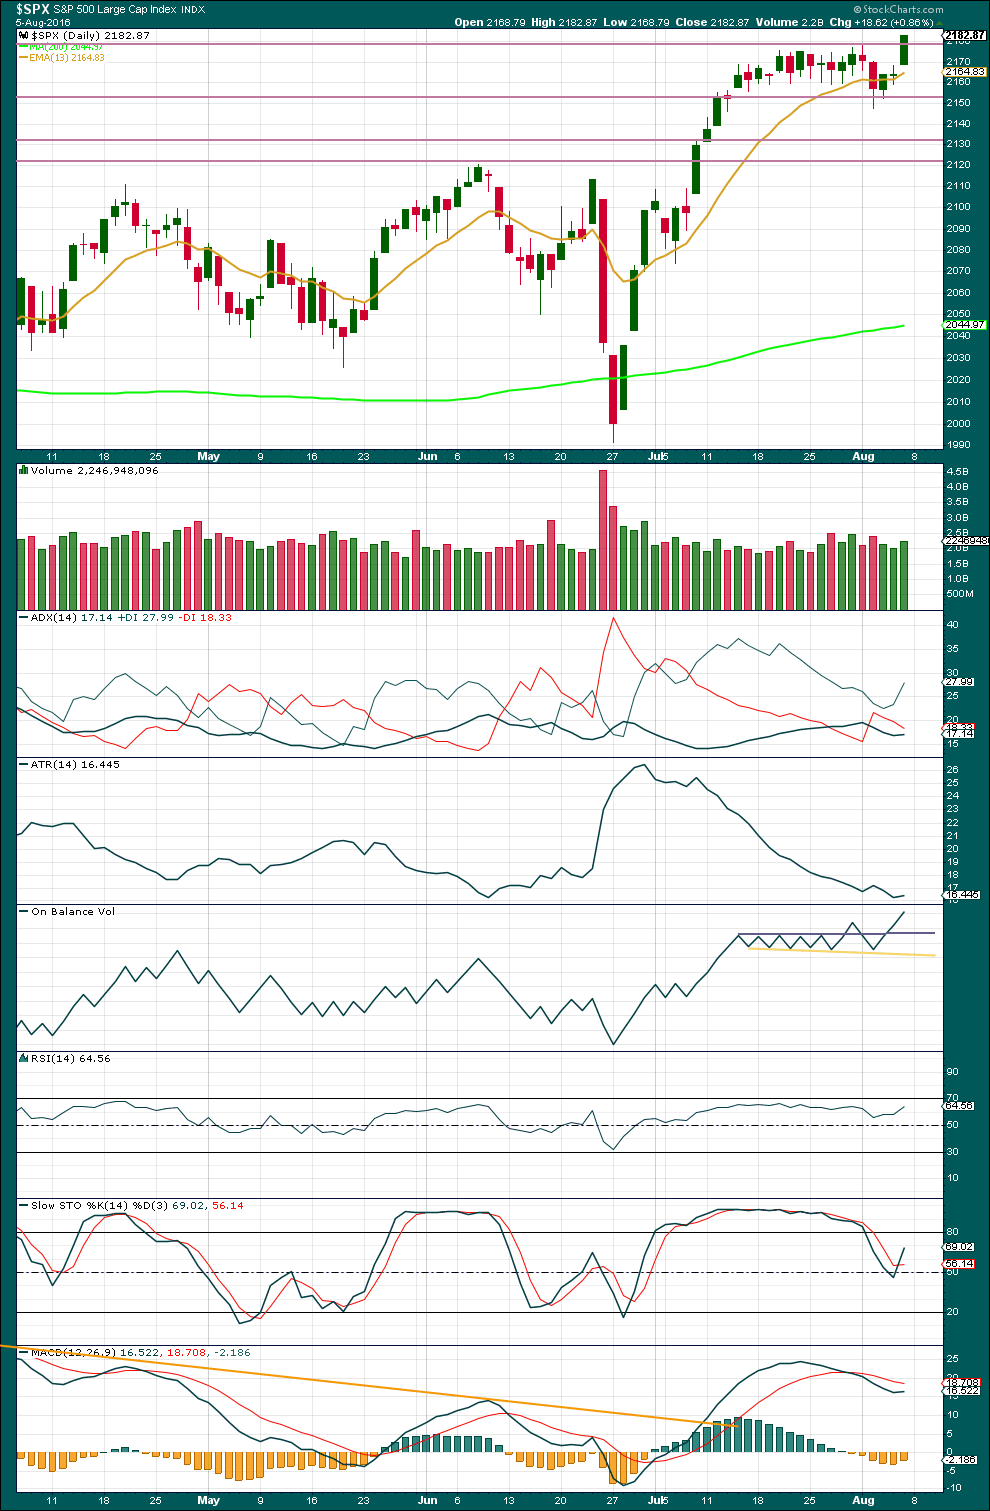
Click chart to enlarge. Chart courtesy of StockCharts.com.
A sideways consolidation has ended. Price has broken above resistance and closed above that point for Friday’s session. The horizontal line about 2,175 should now provide support. It would be typical behaviour to see a little downwards movement to this point, maybe on Monday, for a back test. Thereafter, upwards movement should keep on going.
Friday had some support for the rise in price from volume.
ADX turned upwards on Friday. The +DX line is above the -DX line. An upwards trend is again indicated.
ATR turned upwards on Friday as well, but for this indicator more than one day is needed before confidence may be had that range is increasing.
On Balance Volume is bullish above the grey line. There is no divergence with price and OBV.
RSI is not yet overbought. There is room for price to rise. There is today divergence between price and RSI at the high of Friday and the high of 20th of July, indicating some weakness in price. But recently divergence between price and indicators has proven to be unreliable. It is treated with some suspicion here. It may disappear again.
Stochastics also shows strong divergence, but this is even less reliable than RSI and divergence, so it is given zero weight in this analysis. Stochastics is not extreme. There is plenty of room for price to rise.
Lowry Research shows this rise comes with increasing market breadth. There is not enough selling pressure for price to fall; the consolidation looks like a period of accumulation. With a breakout on slightly higher volume for Friday, this accumulation phase looks to be over and the sideways range was a pause in an upwards trend and not the start of a new downwards trend. With broad agreement between Lowry’s analysis and this analysis presented here, I have more confidence in the upwards trend continuing next week.
VOLATILITY – INVERTED VIX MONTHLY CHART
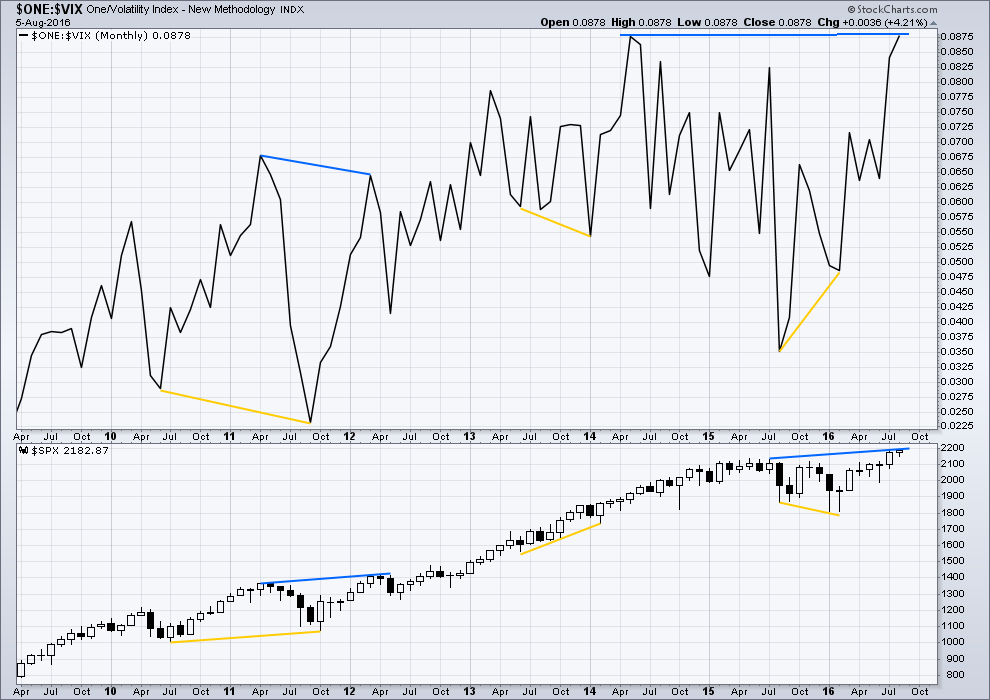
Click chart to enlarge. Chart courtesy of StockCharts.com.
VIX from StockCharts is inverted. As price moves higher, inverted VIX should also move higher indicating a decline in volatility which is normal as price moves higher. As price moves lower, inverted VIX should also move lower indicating an increase in volatility which is normal with falling price.
There is no longer strong multi month divergence with price and VIX (blue lines to current highs). The divergence noted in past analysis has now, at the end of this week, disappeared. Currently, divergence between price and VIX, previously so reliable, is not working. It is not working at the daily nor monthly chart level.
VIX will be still watched as a measure of volatility and divergence will be noted when it appears, but it will not be given weight until it shows itself to be working again.
DOW THEORY
Major lows within the prior bull market:
DJIA: 15,855.12 (15th October, 2014) – closed below on 25th August, 2015.
DJT: 7,700.49 (12th October, 2014) – closed below on 24th August, 2015.
S&P500: 1,821.61 (15th October, 2014) – has not closed below this point yet.
Nasdaq: 4,117.84 (15th October, 2014) – has not closed below this point yet.
Major highs within the new bear market:
DJIA: 17,977.85 (4th November, 2015) – closed above on 18th April, 2016.
DJT: 8,358.20 (20th November, 2015) – has not closed above this point yet.
S&P500: 2,116.48 (3rd Nobember, 2015) – has now closed above this point on 8th June, 2016.
Nasdaq: 5,176.77 (2nd December, 2015) – has not closed above this point yet.
Dow Theory Conclusion: Original Dow Theory still sees price in a bear market because the transportations have failed to confirm an end to that bear market. Modified Dow Theory (adding S&P and Nasdaq) has failed still to confirm an end to the old bull market, modified Dow Theory sees price still in a bull market.
This analysis is published @ 09:15 p.m. EST.
This is getting long in the tooth for a minute four. Maybe minor two underway already?
Looking like it’s about to be one of those hold your nose and buy moments. Still flat currently and looking for a break out (up or down) to join…only for a scalp, but with everything I currently see…I think break out and up is coming this pm.
I think you are right. I am not sure if it will be the start of a third up or just the final leg of minor one- a fifth wave up before minor two down…I suspect it is the latter so I think I am going to sit it out and wait for a second wave correction before trying to scalp a move to the upside…
Absolutely fascinating comments about the break-down in this market of what used to be reliable technical signals. About three years ago a hedge fund manager I know closed his fund out of complete frustration when signals and triggers he had used reliably for years no longer worked. It is quite eerie to actually hear an experienced analyst confirm what so many traders the last several years have had a sneaky feeling was indeed the case, i.e. that normal price discovery mechanisms were breaking down. I think it is very important for those of us who have traded the markets for many years recognize and adjust to this rather unsettling reality. The one thing I find quite sobering is the fact that just as some bearish triggers and signals seem to have become unreliable and somehow disconnected from reality, it it possible that bullish ones could as well? Have central banks (at least in US markets) now achieved what we all thought was not achievable, namely the ability to power markets higher by brute monetary force? Tim Knight in his comments tonight seems to have arrived at that conclusion. He notes that we are not trading in an area with no overhead resistance and there is nothing to stop price continuing to rise on low volume into the distant future. In a strange was I am hoping that he is right. If TA signals on both the bearish and bullish side of the ledger implode, we will all literally be flying, or rather trading, blind. Here’s to the reliable, and tradable unfolding of a third of a third up…
Thanks for another stellar analysis Lara, and for posting it early! 🙂
Ditto Verne. Thanks Lara. I greatly appreciate your objectivity in the face of having experienced ‘shell shock’ as we crossed and broke out above SPX 2134. If long help TA is losing its ability to forecast movement in the markets, it demonstrates how very valuable is Elliott Wave analysis because it is right on in its current forecast. Price is always the #1 indicator and EW makes absolute use of price thus allowing it to recently shift from bearish to bullish.
Because of EW analysis I have been 50% long in my short term trading account for the past three weeks or so. I have been in cash in my intermediate term and long term accounts since May of 2015. In the next week or two because of EW analysis, I will go 100% long in ST and at least 50% long in IT and LT accounts. All accounts are cash (no margin ever) and leveraged vehicles are used only in my short term trading accounts.
The battle cry must now be, “Go bulls.”
CORRECTION
Above I wrote, “If long help TA is losing its ability to forecast movement in the markets”
It should read, “If TA is losing its ability to forecast ….”
Neatly done Rodney.
It’s hard psychologically to switch from bear to bull or vice versa, on a big scale as we had to recently.
It’s one thing to change the wave count, and another to follow through with trading in a new direction.
Overcoming psychology is impressive.
Well said Verne. Nothing I used successfully over the years has worked as of late. Heck, I can remember some days in early Q2 where I could catch a strong 20-30 point move on a breakdown or a break out. Now there is no such move. It’s hard to be a momentum trend trader when the trend is side ways and there’s no follow through behind these moves. Break outs to the upside are sold into, breakdowns to the downside are bidded up.
I am reduced to intraday scalping, and find that this style of trading not as fruitful. I can only harvest what the markets give me and I am looking forward to the day manipulation evaporates and free markets return.
F I R S T
I am first again,, because you are disqualified for using all caps on the word first.(the use of all caps is frowned upon) and since Verne and Rodney didnt claim first, I am again first,,, woo hoo
Okay Doc… now you’re stretching credulity….
But yes. To be fair, the excessive use of all caps is frowned upon 🙂 🙂 🙂