
Yesterday’s main Elliott wave count expected upwards movement, which is what has happened so far.
Summary: Upwards movement is most likely next week. A new high above 2,178.29 would add confidence to this view. Alternatively, a new low now below 2,147.58 would indicate a deeper pullback may be developing.
Last monthly chart for the main wave count is here.
New updates to this analysis are in bold.
MAIN WAVE COUNT
WEEKLY CHART
Click chart to enlarge.
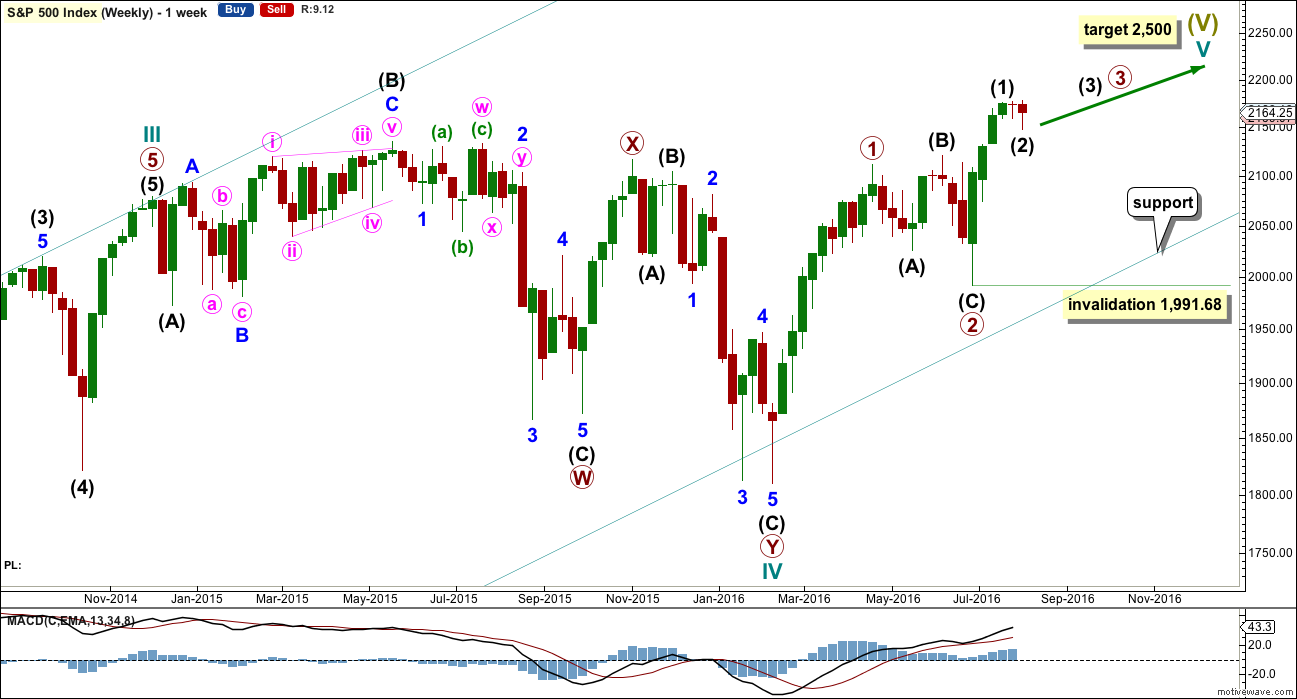
Cycle wave II was a shallow 0.41 zigzag lasting three months. Cycle wave IV is now seen as a more shallow 0.28 double combination lasting 15 months. With cycle wave IV five times the duration of cycle wave II, it should be over there.
Cycle wave I lasted 28 months (not a Fibonacci number), cycle wave II lasted a Fibonacci 3 months, cycle wave III lasted 38 months (not a Fibonacci number), and cycle wave IV lasted 15 months (two more than a Fibonacci 13).
If the target for cycle wave V is for it to be equal in length with cycle wave I, then it may also be expected to be about equal in duration. So far cycle wave V is in its sixth month. After this month, a further 22 months to total 28 seems a reasonable expectation, or possibly a further 15 months to total a Fibonacci 21.
This first weekly wave count expects the more common structure of an impulse is unfolding for cycle wave V. Within cycle wave V, primary waves 1 and now 2 should be over. Within primary wave 3, no second wave correction may move beyond its start below 1,991.68.
There is one other possible structure for cycle wave V, an ending diagonal. This is covered in an alternate.
DAILY CHART
Click chart to enlarge.
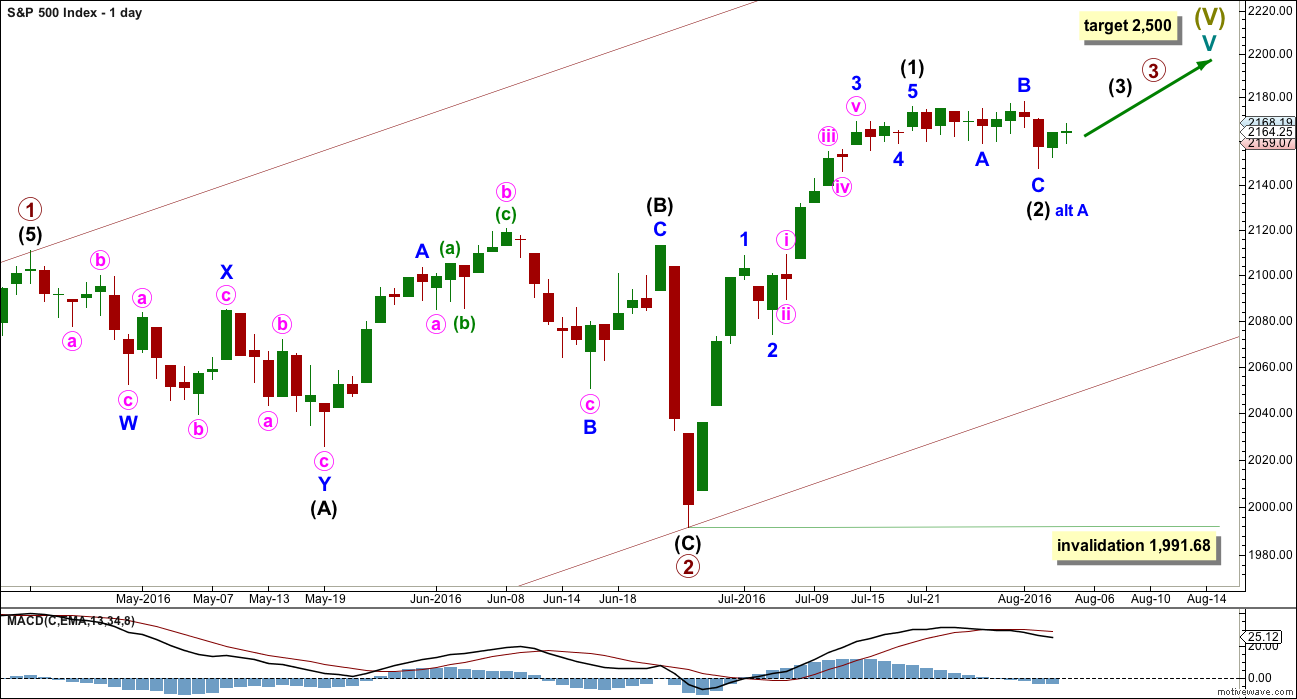
It is most likely that primary wave 2 is already complete as a shallow regular flat correction. Primary wave 3 is most likely underway.
Within primary wave 3, intermediate wave (1) is a complete impulse. Intermediate wave (2) may now be a complete flat correction. While there is no confirmation that intermediate wave (2) is over, it may yet move further sideways / lower.
Intermediate wave (2) may not move beyond the start of intermediate wave (1) below 1,991.68.
Intermediate wave (2) is expected to be shallow and not a deep pullback when it is done.
HOURLY CHART
Click chart to enlarge.
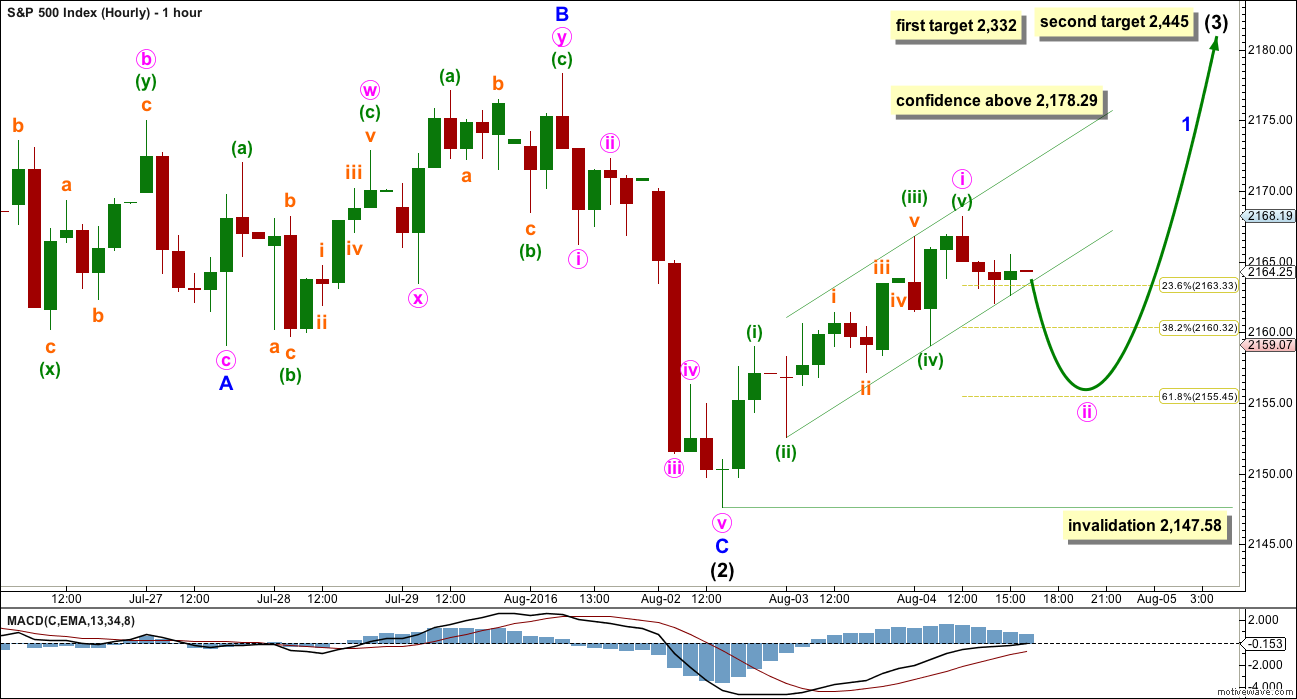
Minor wave A fits as a regular flat. Minute wave c within it ends slightly below the end of minute wave a; a truncation is avoided.
Minor wave B fits as a double zigzag. Minor wave B is a 1.16 length of minor wave A, within the normal range of 1 to 1.38. Intermediate wave (2) is an expanded flat.
There is no Fibonacci ratio between minor waves A and C.
Minor wave C is a complete five wave structure. This fits on the hourly and five minute charts.
A new high above 2,178.29 would provide confidence in this wave count. At that stage, a third wave up at two degrees would be indicated.
At this stage, a five wave impulse upwards looks to be complete on the five minute and hourly charts. This may be minute wave ii. So far this movement fits perfectly within an Elliott channel, drawn here in green. If this channel is breached to the downside, then minute wave ii would be confirmed as underway. A target for it would be the 0.618 Fibonacci ratio at 2,155.
At 2,332 intermediate wave (3) would reach equality in length with intermediate wave (1). This is a reasonable Fibonacci ratio to use for the target because intermediate wave (2), if it is over, would be very shallow at only 0.15 of intermediate wave (1).
At 2,445 intermediate wave (3) would reach 1.618 the length of intermediate wave (1).
Intermediate wave (3) may only subdivide as an impulse. Minor wave 1 would still be incomplete within intermediate wave (3). Minor wave 2 may not move beyond the start of minor wave 1 below 2,147.58.
ALTERNATE WAVE COUNT
WEEKLY CHART
Click chart to enlarge.
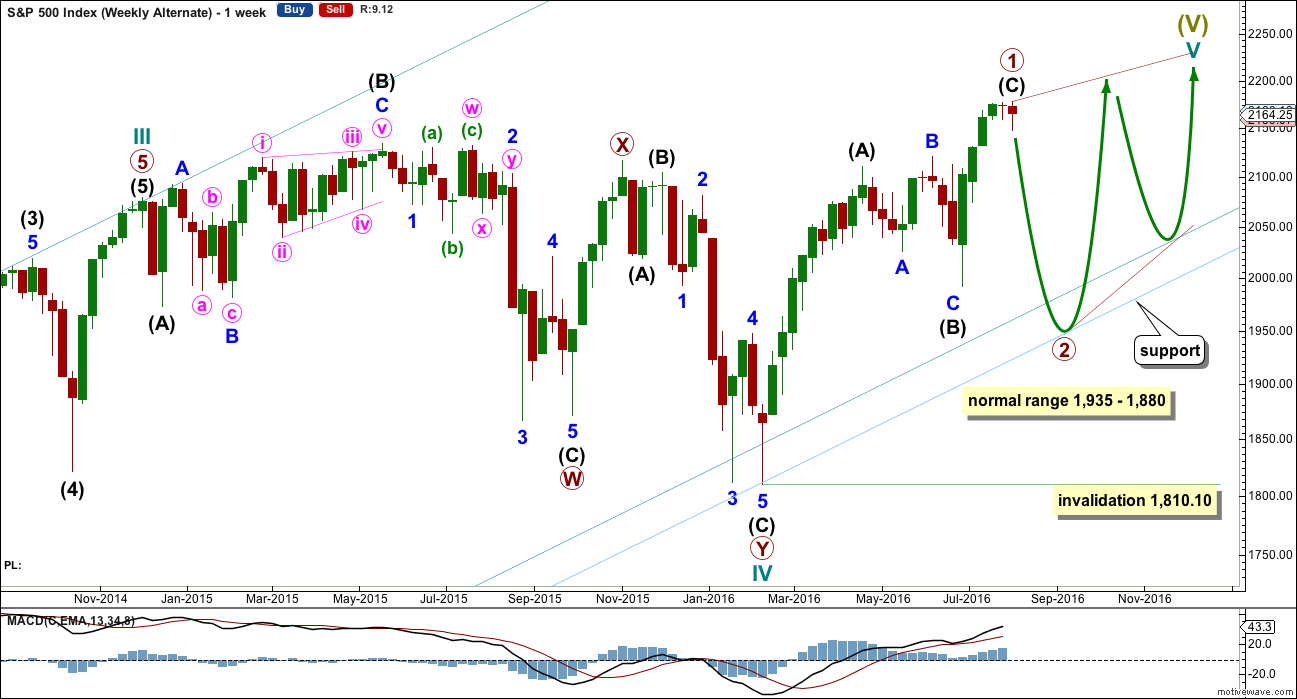
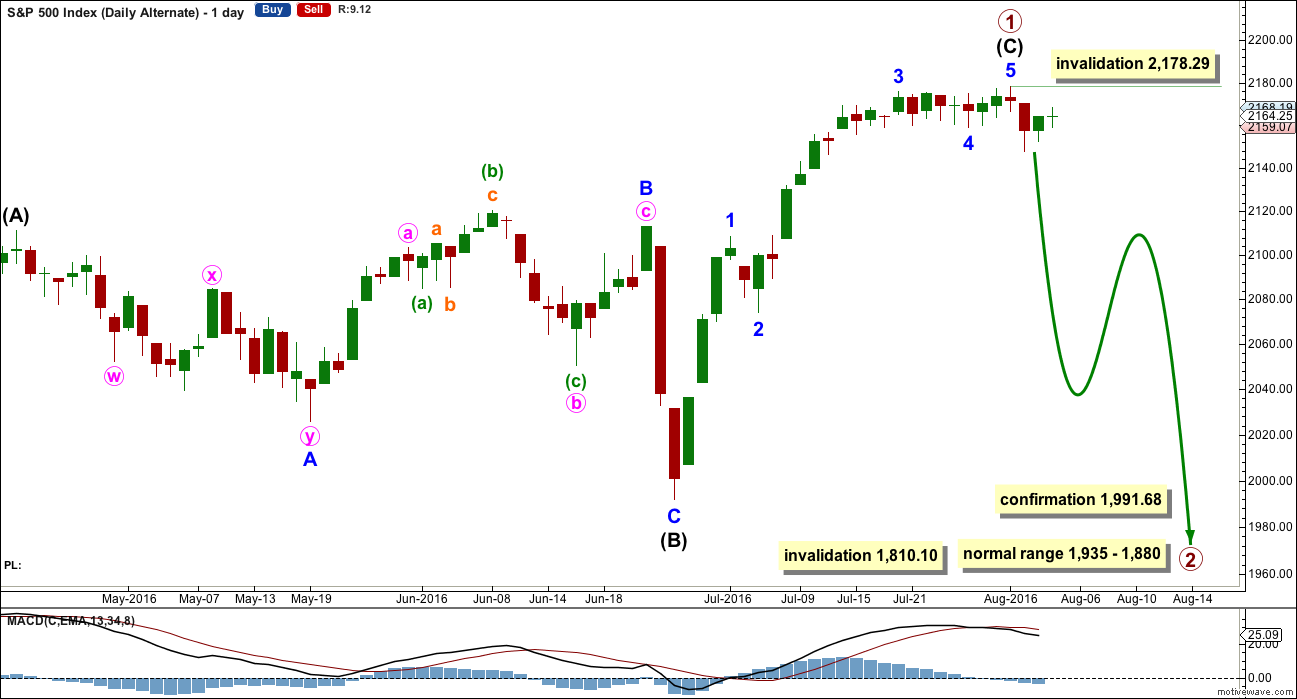
Cycle wave V may be unfolding as an ending diagonal. The most common type of diagonal by a reasonable margin is a contracting diagonal. When primary waves 1 and 2 are complete, then primary wave 3 would most likely be shorter than primary wave 1. If primary wave 3 were to be longer than primary wave 1, then the less common variety of an expanding diagonal would be indicated.
Within an ending diagonal, all the sub-waves must subdivide as zigzags and the fourth wave must overlap back into first wave price territory. The whole structure is choppy and overlapping with a gentle slope. The classic pattern equivalent is a rising wedge.
Primary wave 1 may now be a complete zigzag. Within primary wave 1, intermediate wave (C) may be a complete five wave impulse. Primary wave 2 downwards must be a zigzag, and it is most likely to be very deep.
The normal range of a second and fourth wave within a diagonal is from 0.66 to 0.81 the first or third wave. This gives a range for primary wave 2 from 1,935 to 1,880.
Primary wave 2 may not move beyond the start of primary wave 1 below 1,810.10.
Ending diagonals have corrective characteristics as they subdivide into a series of zigzags. Ending diagonals contain uncertainty; the trend is unclear as they unfold due to the deep corrections of their second and fourth waves. They are terminal and doomed to full retracement. This may explain some persistent weakness to this upwards trend at this time. The final target at 2,500 for the main wave count would be far too optimistic if this alternate is correct and the diagonal is contracting.
Third waves of even diagonals should still be supported by volume and should still exhibit stronger momentum than the first wave.
For this alternate wave count, a deep pullback could very soon be expected for primary wave 2 to last several weeks.
DAILY CHART
Click chart to enlarge.
If this wave count is confirmed by a new low below 1,991.68, then confidence would be had in price moving lower to the target range.
It should be clear from structure and momentum that a deeper pullback is underway for this alternate wave count before that confidence point is passed though.
Primary wave 2 should be a big obvious three wave structure.
At this stage, a new low below 2,147.58 would give some confidence to this alternate wave count. If that happens, the probability would increase and this wave count would be swapped over to be the main wave count.
TECHNICAL ANALYSIS
WEEKLY CHART
Click chart to enlarge. Chart courtesy of StockCharts.com.
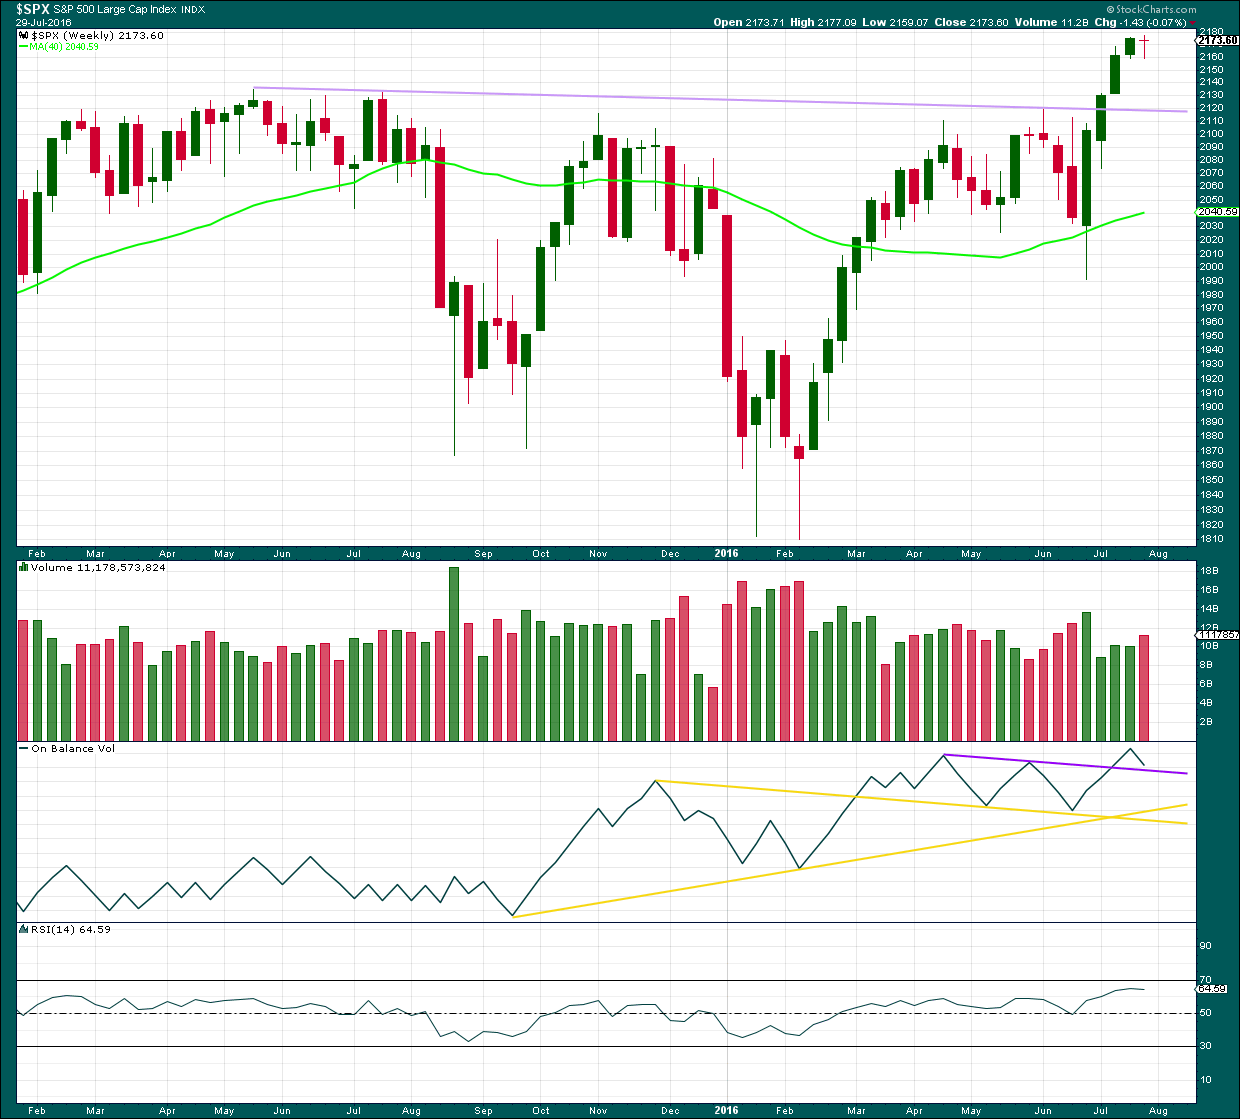
The week before last week completed a stalled candlestick pattern. This indicated a trend change from up to either down or sideways. Last week completed a small red doji, so the trend may have changed from up to sideways. It may still yet turn down.
The bearish implications of the stalled candlestick pattern may now be fulfilled, or more downwards / sideways movement may continue.
Last week’s red doji comes with an increase in volume. This short term volume profile is slightly bearish. Only slightly because the candlestick is a doji and not a regular candlestick with a red body.
On Balance Volume has come down to almost touch the upper purple line. It may find support here. If this line is breached, then some support may be expected at the next trend line.
RSI is not extreme and is flattening off. There is still room for price to rise.
DAILY CHART
Click chart to enlarge. Chart courtesy of StockCharts.com.
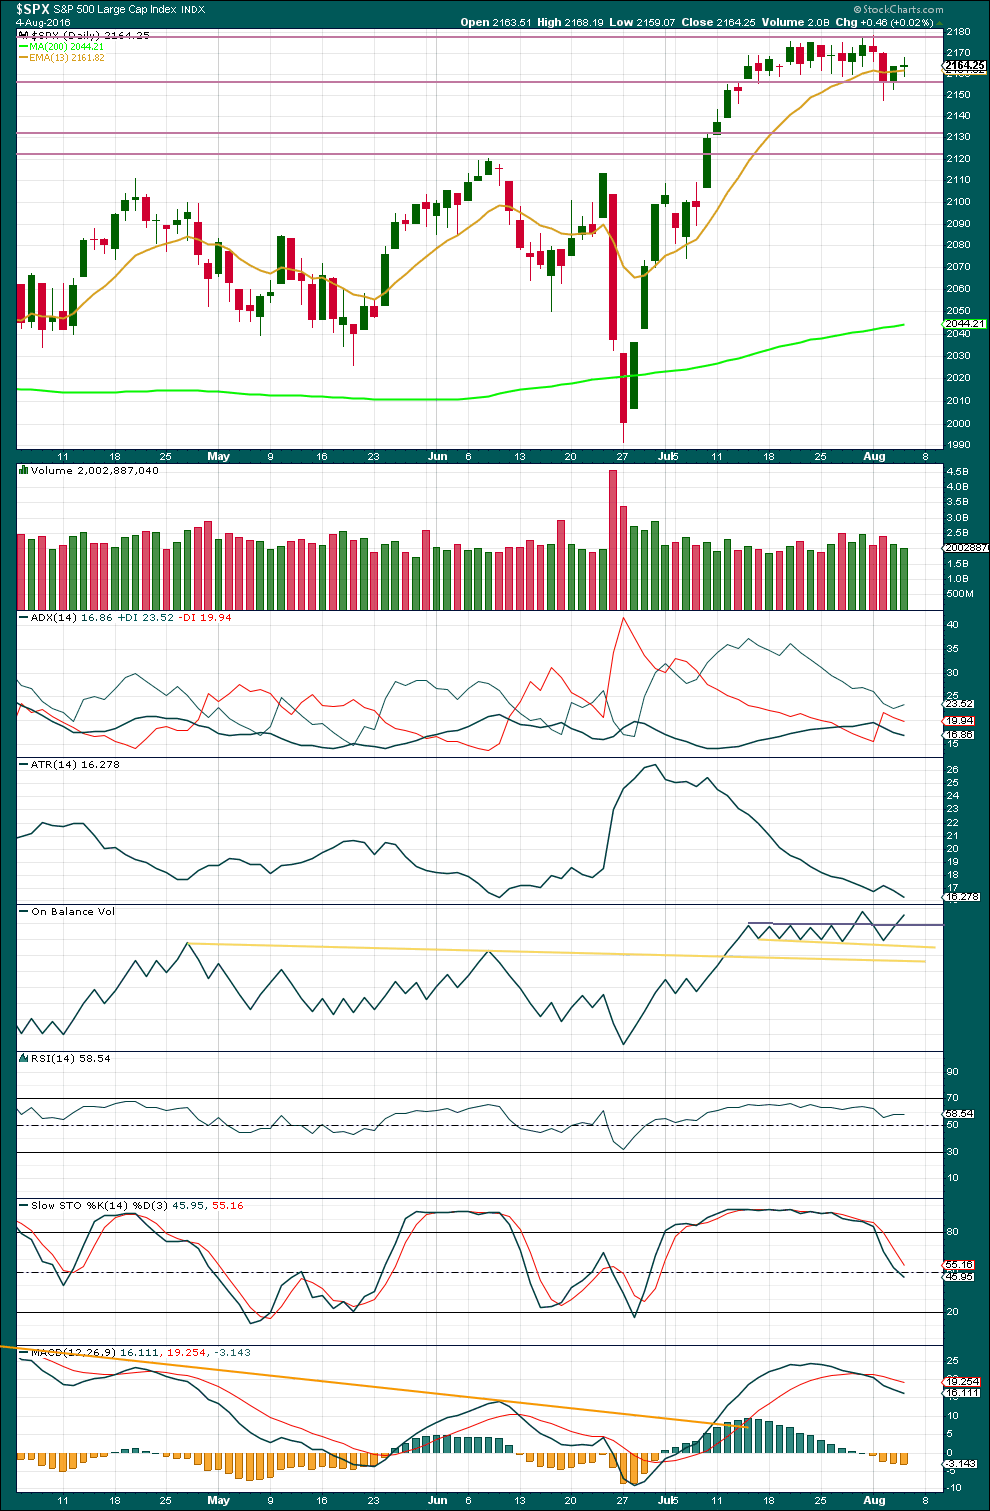
Price is back within the consolidation zone. The zone trend lines have been widened to reflect this week’s movement. Price is finding resistance about 2,180 and support about 2,150. A breakout will happen and the market will begin trending again, but the breakout has not happened yet.
It is still a downwards day which has strongest volume during this consolidation. This indicates a downwards breakout may be more likely than upwards. This supports the alternate Elliott wave count over the main Elliott wave count.
Upwards movement for the last two days was not supported by volume, so it is suspicious. This also supports the alternate Elliott wave count over the main Elliott wave count.
However, volume during consolidations as an indicator of breakout direction has not worked well recently. Some caution is advised with this data now. It is indicative only and may not prove to be correct for price direction.
ADX is decreasing, indicating the market is not currently trending. ATR is also decreasing, in agreement with ADX. The market is consolidating.
Stochastics is returning from overbought. Some more downwards movement may be expected until Stochastics is oversold and price finds support. Price may find support about 2,134, the prior all time high, as the consolidation widens.
On Balance Volume broke above the grey line giving a bullish signal, but that signal was negated by OBV returning to back below this line. Another break above the grey line today from OBV is a weak bullish signal, weak because the strength of this line has been recently weakened.
RSI is not extreme. There is plenty of room for price to rise or fall.
At this time, the conclusion from Lowry Research is there is not enough evidence of selling pressure to push price lower for a deeper decline. This supports the main Elliott wave count over the alternate.
VOLATILITY – INVERTED VIX MONTHLY CHART
Click chart to enlarge. Chart courtesy of StockCharts.com.
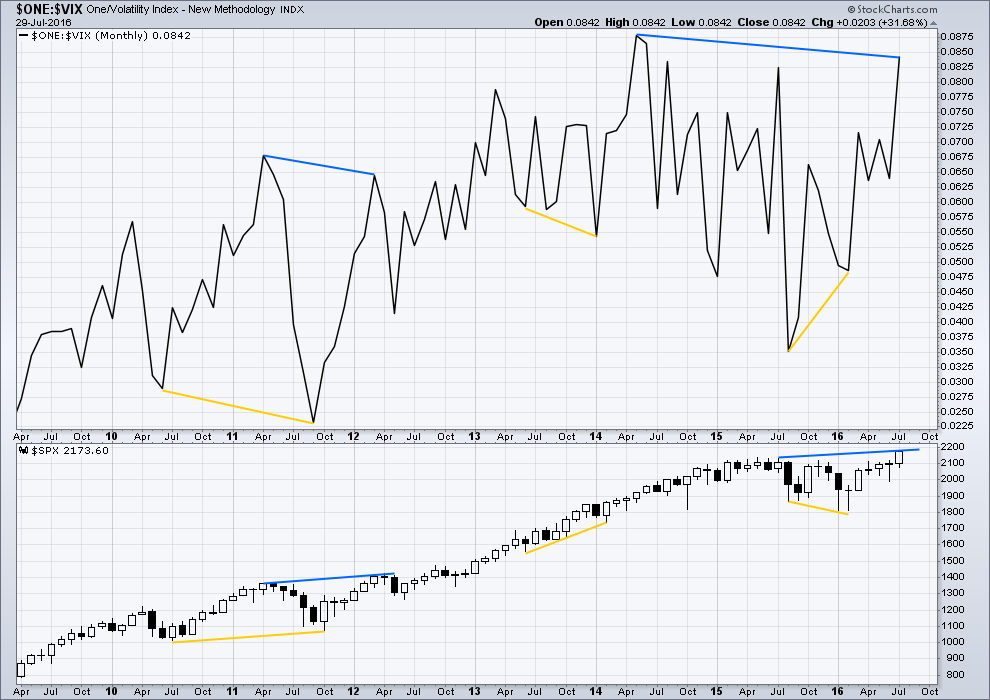
VIX from StockCharts is inverted. As price moves higher, inverted VIX should also move higher indicating a decline in volatility which is normal as price moves higher. As price moves lower, inverted VIX should also move lower indicating an increase in volatility which is normal with falling price.
There is still strong multi month divergence with price and VIX. While price has moved to new all time highs, this has not come with a corresponding decline in volatility below the prior all time high at 2,134. This strong multi month divergence between price and VIX indicates that this rise in price is weak and is highly likely to be more than fully retraced. However, this does not tell us when and where price must turn; it is a warning only and can often be a rather early warning.
At this time, although divergence with price and VIX at the daily chart level has been recently proven to be unreliable (and so at this time will no longer be considered), I will continue to assume that divergence with price and VIX at the monthly chart level over longer time periods remains reliable until proven otherwise.
This supports the idea that price may be in a fifth wave up. Divergence between the end of a cycle degree wave III and a cycle degree wave V would be reasonable to see. Fifth waves are weaker than third waves. This strong divergence indicates that price targets may be too high and time expectations may be too long. However, it remains to be seen if this divergence will be reliable.
DOW THEORY
Major lows within the prior bull market:
DJIA: 15,855.12 (15th October, 2014) – closed below on 25th August, 2015.
DJT: 7,700.49 (12th October, 2014) – closed below on 24th August, 2015.
S&P500: 1,821.61 (15th October, 2014) – has not closed below this point yet.
Nasdaq: 4,117.84 (15th October, 2014) – has not closed below this point yet.
Major highs within the new bear market:
DJIA: 17,977.85 (4th November, 2015) – closed above on 18th April, 2016.
DJT: 8,358.20 (20th November, 2015) – has not closed above this point yet.
S&P500: 2,116.48 (3rd Nobember, 2015) – has now closed above this point on 8th June, 2016.
Nasdaq: 5,176.77 (2nd December, 2015) – has not closed above this point yet.
Dow Theory Conclusion: Original Dow Theory still sees price in a bear market because the transportations have failed to confirm an end to that bear market. Modified Dow Theory (adding S&P and Nasdaq) has failed still to confirm an end to the old bull market, modified Dow Theory sees price still in a bull market.
This analysis is published @ 09:58 p.m. EST.
Why oh why is anyone short here?
The main wave count says price should go up. Above 2,178.29 when the main wave count was confirmed, no one should be short.
You don’t need me to chime in here I know, the balances on your accounts are telling you you’re wrong.
But I’m quite frustrated too with this.
If members, new and old, learn nothing else from me it should be this:
Risk management. It’s the single most important aspect of trading. Learn how to manage it and you can turn even a poor strategy into a profitable strategy.
Always have an exit strategy before a trade is entered. And then do it if the market proves you wrong!
Too many members have been waiting for a deep pullback to get out. But if you had all taken a loss and gotten out when a new ATH was made above 2,135 then calculate how much better off you would all have been. Not taking the loss when the market proved you wrong has lead to uncontrollable losses. That’s the route to ruin. And the decision was made because of greed.
Fear and greed are our enemies as traders. Be very aware of them, manage it by having an objective strategy and following it though.
I warned weeks ago that a deeper pullback may not materialise. There is no resistance, this market can and is rising on light volume. It will keep doing that.
I am frustrated. I cannot help you. Why give invalidation points if they are ignored?
I also have sympathy for members still short. I really do. But I cannot help at this stage. It’s up to each member to bear the full responsibility of a lack of risk management.
Think of losses as $$ paid to learn valuable lessons. Learn, don’t repeat the same mistakes, and move on. That’s the only advice I have to members still short.
I am going down with the Ship!
Financially that is!
$%&#&!% … &%$#@! … $%^&#$
Joseph, you are not alone.
Lara is absolutely right: never ever trade without stop losses ! She is crystal clear about that!
Nevertheless, as a (stupid) beginner, I traded short when the SPX was 2100, without any stop-loss… my fault and my own fault! I don’t want to do the maths…but I have potentially lost one full year of gains…my nights are nightmares.
I understand everybody’s feelings here, saying the Market shouldn’t rally that way, nevertheless it does, day after day … relentlessly….
Don’t feel bad… I am not a beginner and I never use stops on all cash position.
I only use stops when I use margin or when I am looking for a scalp or a 1 to 2 day trade.
But… you should listen to Lara’s advice on that.
Day after day after day! The markets don’t make any sense… nothing is as it appears… NOTHING!
If you’re a beginner, you should be very careful! If fact everyone no matter what you’re experience should be very careful!
Markets are broken!
“the market can remain irrational longer than you can remain solvent”
not sure who said that, but I think you’re learning its true
contain the loss, start to make some profits
there is a trend, it is up, profit from that
Lara has an extremely cogent point folks. Everyone should have had (and still do) an opportunity to recoup (and more) any losses we suffered at the last invalidation of the expected bearish count. I took me a long time to divorce my own expectations of what the market should be doing, from what the market actually did. My problem was compounded by trying to follow EW analysis that also seemed not to know the difference. The great strength of Lara’s analysis is she always has a number that tells us we are wrong. It is this ability to pivot and get us on the right side of the trend at each turn that in my opinion makes the service so valuable. Nothing is more important, other than position size, than having clearly etched in your mind when you trade, a number that says you are wrong, and taking immediate action when that number presents itself.
I want to add one caveat about the possibility of still profiting on the long side. DJI did not confirm the SPX ATH today but that is only a very slight cautionary note. If we see the July 20 DJI high taken out on Monday, I think it would put Lara’s upside targets firmly in play and afford those of you still on the short side opportunity to repair most, if not all of the damage done to your accounts. The first and most important thing to do is exit your short positions immediately to avoid additional losses and preserve capital. Have a great and restful weekend everyone.
One final thing about my own VIX long position. This is a trade with a multi month perspective and is a kind perpetual RTM trade that avoids the time decay of options. It is the only position I have without a stop although a trade under the all time low of around 10 would certainly get my attention. Selling calls against the long position means a cost basis around 10.25 and the strategy has been to sell half over 13 and repurchase under 12.00 If you are patient, buying vol when cheap and selling when less cheap is one of the easiest bread and butter trades one can make.
The wave counts calls for a move of SPX higher, and I’m hoping that the action around the upper BB will confirm a third up at several degrees. SPX does not usually spike above it and it is hard to see how that could be avoided if we were approaching the strongest portion of a third wave up. Price action can stay pinned at the upper BB for several sessions as happened in April, May, and July of this year but I would expect a third wave at this many degrees to show greater momentum than those instances and punch through to the upside. If not today, then futures Sunday evening should be really ramped…
Rolling profits into additional VIX shares at 11.25…
Truly remarkable how we continue to have these gaps up on mediocre volume. Of course this has been the case for many years now so it is totally lacking in any probative value so far as future price action is concerned. That makes it no less remarkable….
Trading action looks like we will not get a fade today. I expect to see an acceleration to the upside into the close. Picked up a few more calls I intend to hold the rest of the session…not interested in going into the week-end long and quite content to scalp any further upside moves on Monday…
A number of insurance companies (MET, PRU, MFC) that got bludgeoned yesterday are showing a nice pop today. These companies also function as canaries in the coal mine to the larger equity landscape. Remember the tremors caused by AIG’s meltdown during the last crisis? The plunge yesterday was attributed to MET’s earnings miss but I think these companies are telegraphing serious headwinds ahead for the entire financial sector. If they reverse to the downside today, I suspect that will be a clue to the longevity of the current rally…
With continued low interest rates and IMO going lower… Insurance Companies (Life & Annuity Ins. Co’s) are going to have contracting margins and therefore decreasing profits. They need to cut jobs, streamline and update yet again their computer systems to at least stop the margin contraction. This will take 2 to 3 years to accomplish. They must do that up until the point that interest rates enter an extended period (2-5 Years) of interest rate rises.
Their Stock prices will trend lower for the next two years at least. Cutting per share dividends will also be in play at some point.
Today’s move up gives the SPX weekly candlestick a very bullish look. There is a long lower handle and it looks like a hammer. I say it looks like a hammer rather than is a hammer because it is not following a longer decline which is where one looks for a hammer. In any event, it is a bullish candlestick.
Once again the “Fantasy and Fabrication Farce” holds sway. If you believe those job numbers I have a bridge in Brooklyn for sale. There are so many indicators that this economy is already in recession, namely inventory draw-down, collapsing retail sector, dearth of Americans enjoying the luxury of eating out, and a host of other indicators all attendant to conditions in 2000 and 2007, and all being harbingers of recessionary times. I cannot believe the public is this gullible, but judging from the market’s reaction they clearly are. The pop today while tradeable, I think will be short-lived. I view this as a fantastic opportunity to get into precious metals and the miners – never look a gift horse in the mouth. Hillary Clinton will be ecstatic. 🙂
Just hold your nose and buy the dip. That’s what I’m gonna start doing. Tired of getting pin pricked.
There are no limits to their constant manipulation. BLS stands for Bureau of Lies and Statistics.
Yes indeed my friends. I bought the SPY 216.50 calls at the open this morning for 0.85 and just sold em for 1.50. I am holding my nose and following our faithful leader’s wave count on the final ride up, scalping all the way….
I have my very extensive list of Gold producers and royalty companies in hand and have embarked on a long-delayed shopping spree. We are looking at the opportunity of a life-time to buy some names destined to go parabolic in the not too distant future. I will be sharing my list with the other folk on the Gold analysis site to elicit some feed-back and find out who also own the ones I am snatching.
They probably saved (deferred) these job numbers from the spring to report today so a great number can be talked about here in August to immediately follow the DNC Convention… Mission Accomplished! The current establishment corrupt powers in both parties will stoop to anything!
NONE of the other economic numbers line up with this employment report either! I think we are now China… when it comes to economic data!
The jobs report will probably co-incide with some decisive movement out of the consolidation area. Unlike the last report which kicked of a multi week rally, a good report may have the opposite effect this time as it would in some folk minds bolster the case for a rate hike this year ( which is of course a crock). Either way, the initial reaction will most likely be a mis-direction move with a rapid reversal in the other direction. Trading around various announcements seem to have that outcome lately.
I am having internet connection issues. I may not be able to provide a comment or update before market close tomorrow.
If I can I will. But it might not happen. Just so everyone knows.
First!!!!!!!
no way , I am first,, pay no attention to that time stamp…
and it’s an optical illusion that your comment looks like a reply to Jules….
🙂
Lara, quick question: do you still think 2196ish might be a reasonable target for spx before some pullback?
yes,, I’m glad you picked up on that… optical illusion for sure.