The main Elliott wave count expected upwards movement for Wednesday’s session, which is what happened.
Summary: This pullback is more likely to be over than to continue lower. A new high above 2,178.29 would add confidence to this view. Alternatively, a new low now below 2,147.58 would indicate a deeper pullback may be developing.
Last monthly chart for the main wave count is here.
New updates to this analysis are in bold.
MAIN WAVE COUNT
WEEKLY CHART
Cycle wave II was a shallow 0.41 zigzag lasting three months. Cycle wave IV is now seen as a more shallow 0.28 double combination lasting 15 months. With cycle wave IV five times the duration of cycle wave II, it should be over there.
Cycle wave I lasted 28 months (not a Fibonacci number), cycle wave II lasted a Fibonacci 3 months, cycle wave III lasted 38 months (not a Fibonacci number), and cycle wave IV lasted 15 months (two more than a Fibonacci 13).
If the target for cycle wave V is for it to be equal in length with cycle wave I, then it may also be expected to be about equal in duration. So far cycle wave V is in its sixth month. After this month, a further 22 months to total 28 seems a reasonable expectation, or possibly a further 15 months to total a Fibonacci 21.
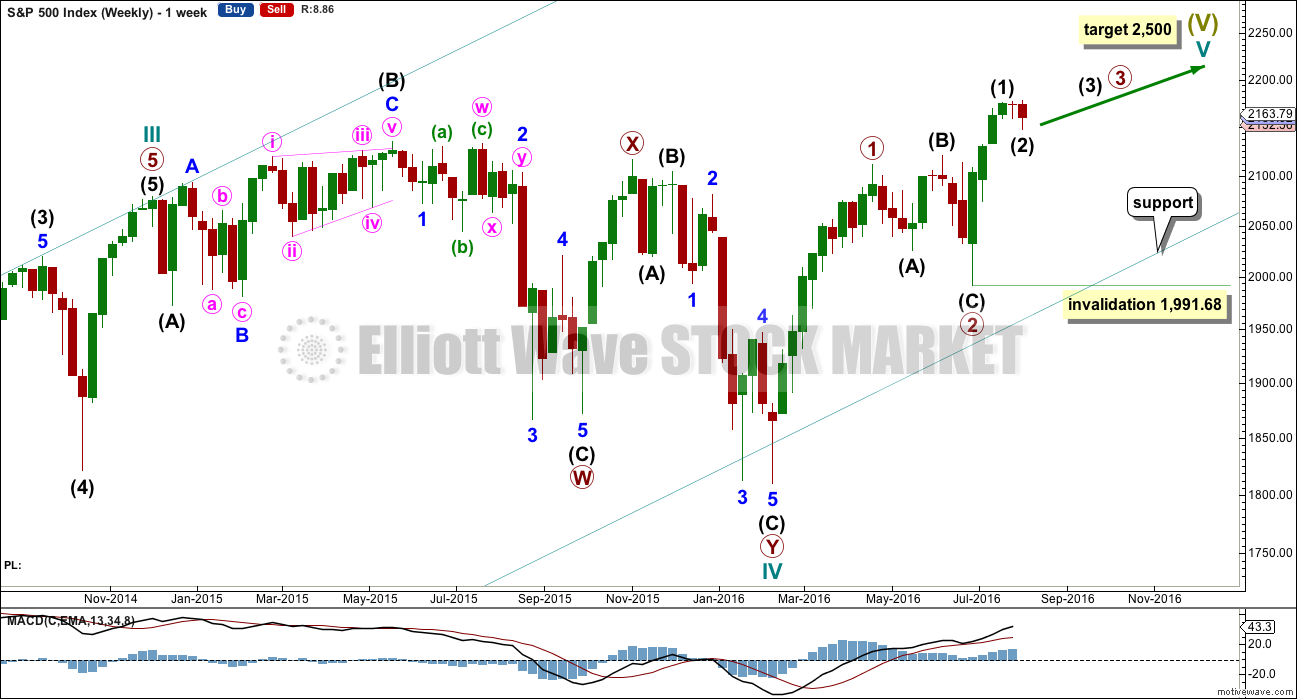
This first weekly wave count expects the more common structure of an impulse is unfolding for cycle wave V. Within cycle wave V, primary waves 1 and now 2 should be over. Within primary wave 3, no second wave correction may move beyond its start below 1,991.68.
There is one other possible structure for cycle wave V, an ending diagonal. This is covered in an alternate.
DAILY CHART
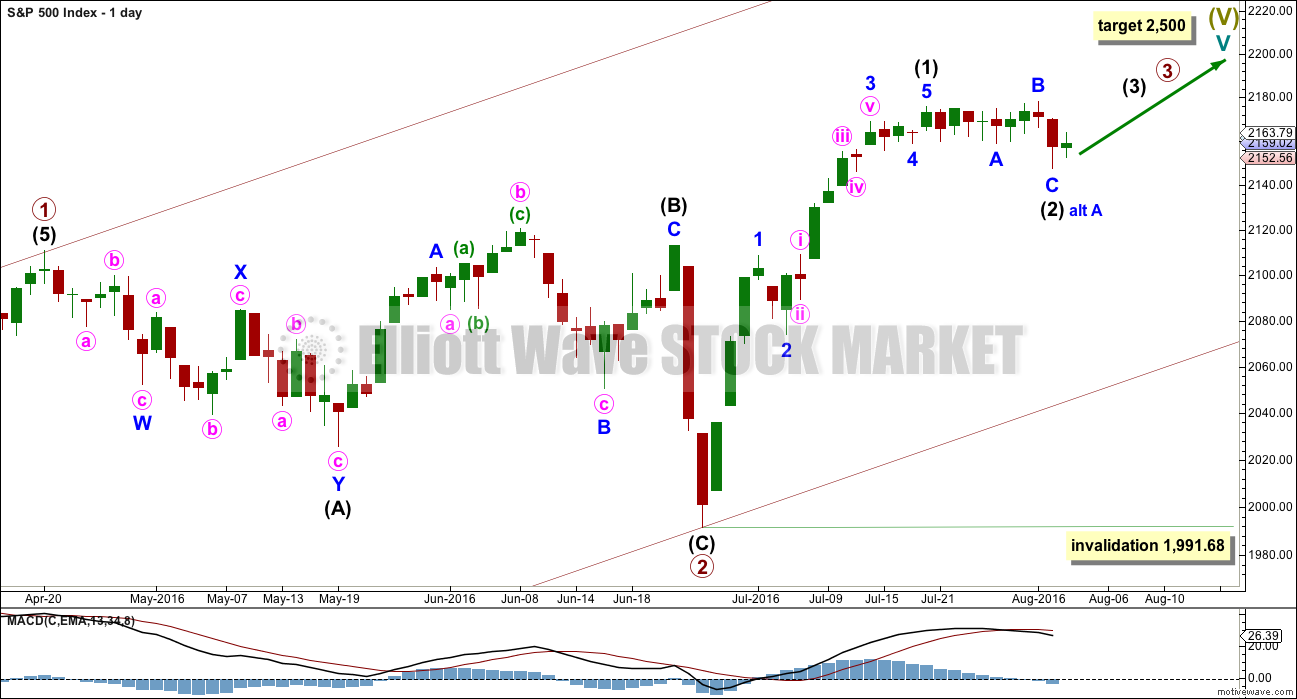
It is most likely that primary wave 2 is already complete as a shallow regular flat correction. Primary wave 3 is most likely underway.
Within primary wave 3, intermediate wave (1) is a complete impulse. Intermediate wave (2) may now be a complete flat correction. While there is no confirmation that intermediate wave (2) is over, it may yet move further sideways / lower.
Intermediate wave (2) may not move beyond the start of intermediate wave (1) below 1,991.68.
Intermediate wave (2) is expected to be shallow and not a deep pullback when it is done.
HOURLY CHART
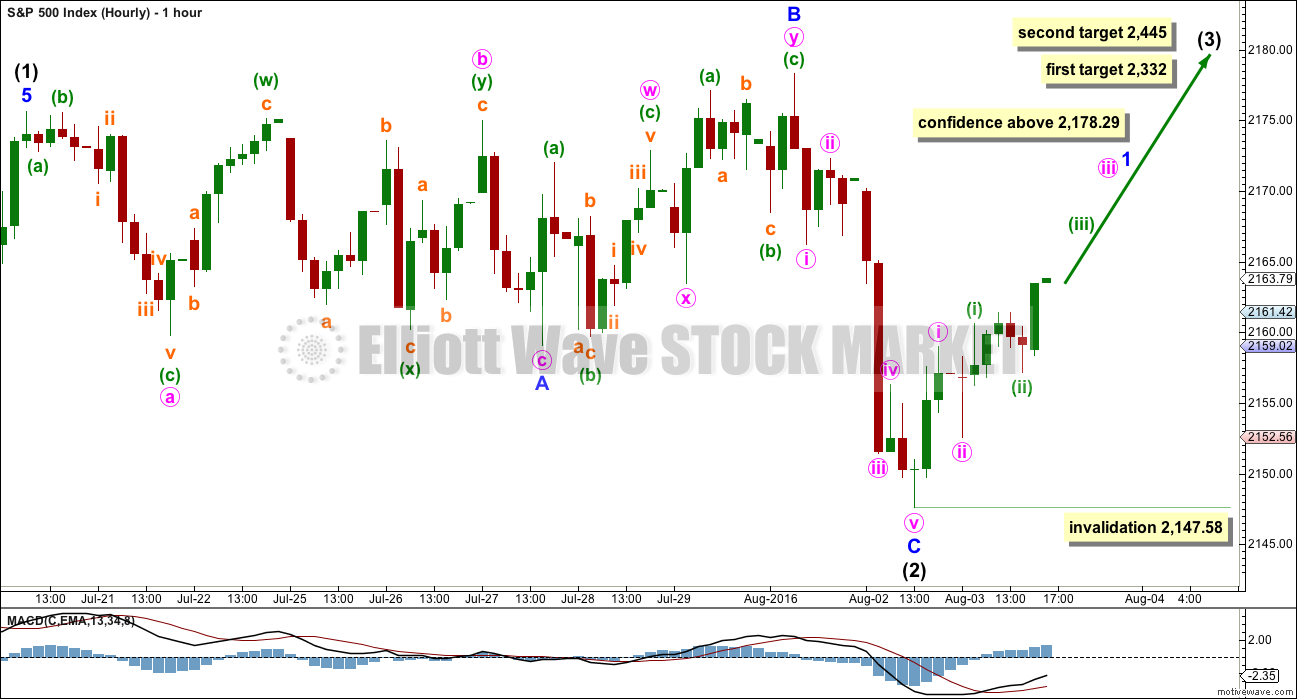
Minor wave A fits as a regular flat. Minute wave c within it ends slightly below the end of minute wave a; a truncation is avoided.
Minor wave B fits as a double zigzag. Minor wave B is a 1.16 length of minor wave A, within the normal range of 1 to 1.38. Intermediate wave (2) is an expanded flat.
There is no Fibonacci ratio between minor waves A and C.
Minor wave C is a complete five wave structure. This fits on the hourly and five minute charts.
A new high above 2,178.29 would provide confidence in this wave count. At that stage, a third wave up at two degrees would be indicated.
At 2,332 intermediate wave (3) would reach equality in length with intermediate wave (1). This is a reasonable Fibonacci ratio to use for the target because intermediate wave (2), if it is over, would be very shallow at only 0.15 of intermediate wave (1).
At 2,445 intermediate wave (3) would reach 1.618 the length of intermediate wave (1).
Two first and second waves may have unfolded so far within upwards movement. This fits on the five minute chart.
Intermediate wave (3) may only subdivide as an impulse. Minor wave 1 would be incomplete within intermediate wave (3). Minor wave 2 may not move beyond the start of minor wave 1 below 2,147.58.
ALTERNATE WAVE COUNT
WEEKLY CHART
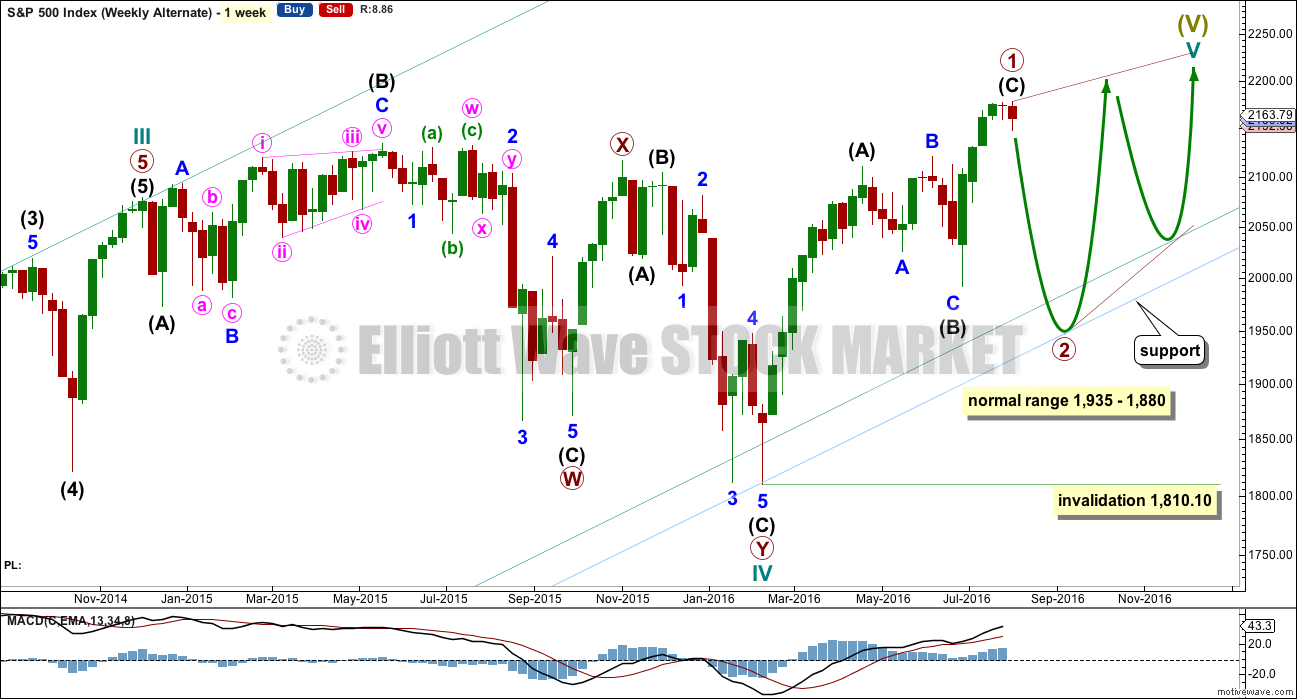
Cycle wave V may be unfolding as an ending diagonal. The most common type of diagonal by a reasonable margin is a contracting diagonal. When primary waves 1 and 2 are complete, then primary wave 3 would most likely be shorter than primary wave 1. If primary wave 3 were to be longer than primary wave 1, then the less common variety of an expanding diagonal would be indicated.
Within an ending diagonal, all the sub-waves must subdivide as zigzags and the fourth wave must overlap back into first wave price territory. The whole structure is choppy and overlapping with a gentle slope. The classic pattern equivalent is a rising wedge.
Primary wave 1 may now be a complete zigzag. Within primary wave 1, intermediate wave (C) may be a complete five wave impulse. Primary wave 2 downwards must be a zigzag, and it is most likely to be very deep.
The normal range of a second and fourth wave within a diagonal is from 0.66 to 0.81 the first or third wave. This gives a range for primary wave 2 from 1,935 to 1,880.
Primary wave 2 may not move beyond the start of primary wave 1 below 1,810.10.
Ending diagonals have corrective characteristics as they subdivide into a series of zigzags. Ending diagonals contain uncertainty; the trend is unclear as they unfold due to the deep corrections of their second and fourth waves. They are terminal and doomed to full retracement. This may explain some persistent weakness to this upwards trend at this time. The final target at 2,500 for the main wave count would be far too optimistic if this alternate is correct and the diagonal is contracting.
Third waves of even diagonals should still be supported by volume and should still exhibit stronger momentum than the first wave.
For this alternate wave count, a deep pullback could very soon be expected for primary wave 2 to last several weeks.
DAILY CHART
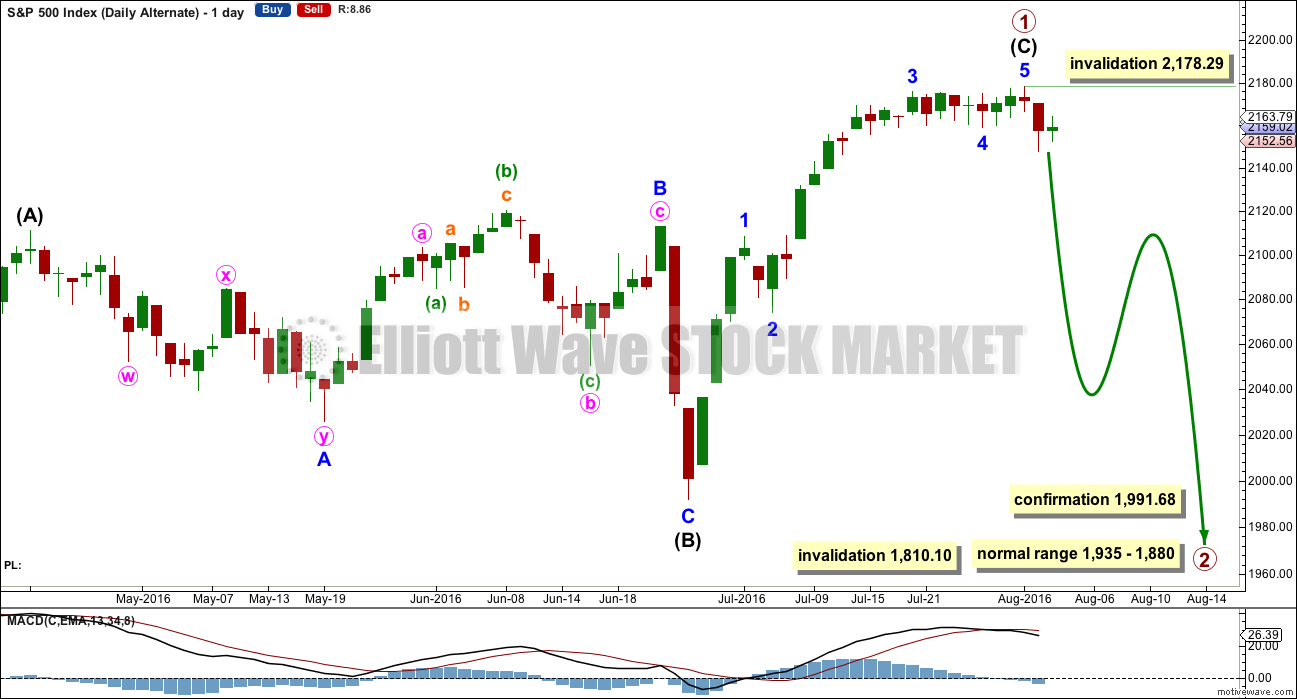
If this wave count is confirmed by a new low below 1,991.68, then confidence would be had in price moving lower to the target range.
It should be clear from structure and momentum that a deeper pullback is underway for this alternate wave count before that confidence point is passed though.
Primary wave 2 should be a big obvious three wave structure.
At this stage, a new low below 2,147.58 would give some confidence to this alternate wave count. If that happens, the probability would increase and this wave count would be swapped over to be the main wave count.
TECHNICAL ANALYSIS
WEEKLY CHART
Click chart to enlarge. Chart courtesy of StockCharts.com.
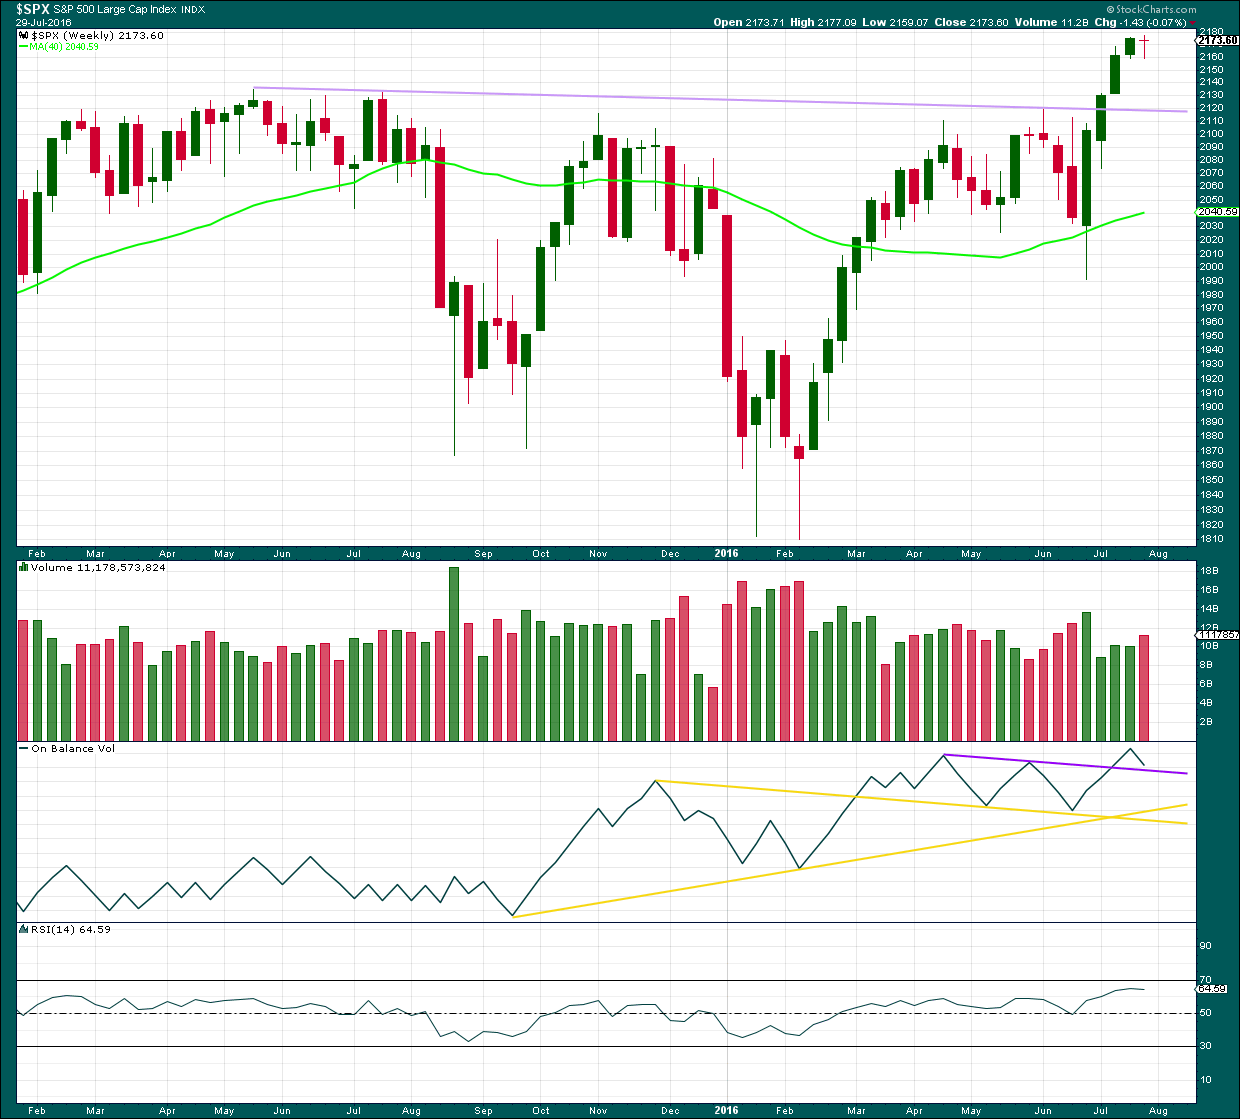
The week before last week completed a stalled candlestick pattern. This indicated a trend change from up to either down or sideways. Last week completed a small red doji, so the trend may have changed from up to sideways. It may still yet turn down.
The bearish implications of the stalled candlestick pattern may now be fulfilled, or more downwards / sideways movement may continue.
Last week’s red doji comes with an increase in volume. This short term volume profile is slightly bearish. Only slightly because the candlestick is a doji and not a regular candlestick with a red body.
On Balance Volume has come down to almost touch the upper purple line. It may find support here. If this line is breached, then some support may be expected at the next trend line.
RSI is not extreme and is flattening off. There is still room for price to rise.
DAILY CHART
Click chart to enlarge. Chart courtesy of StockCharts.com.
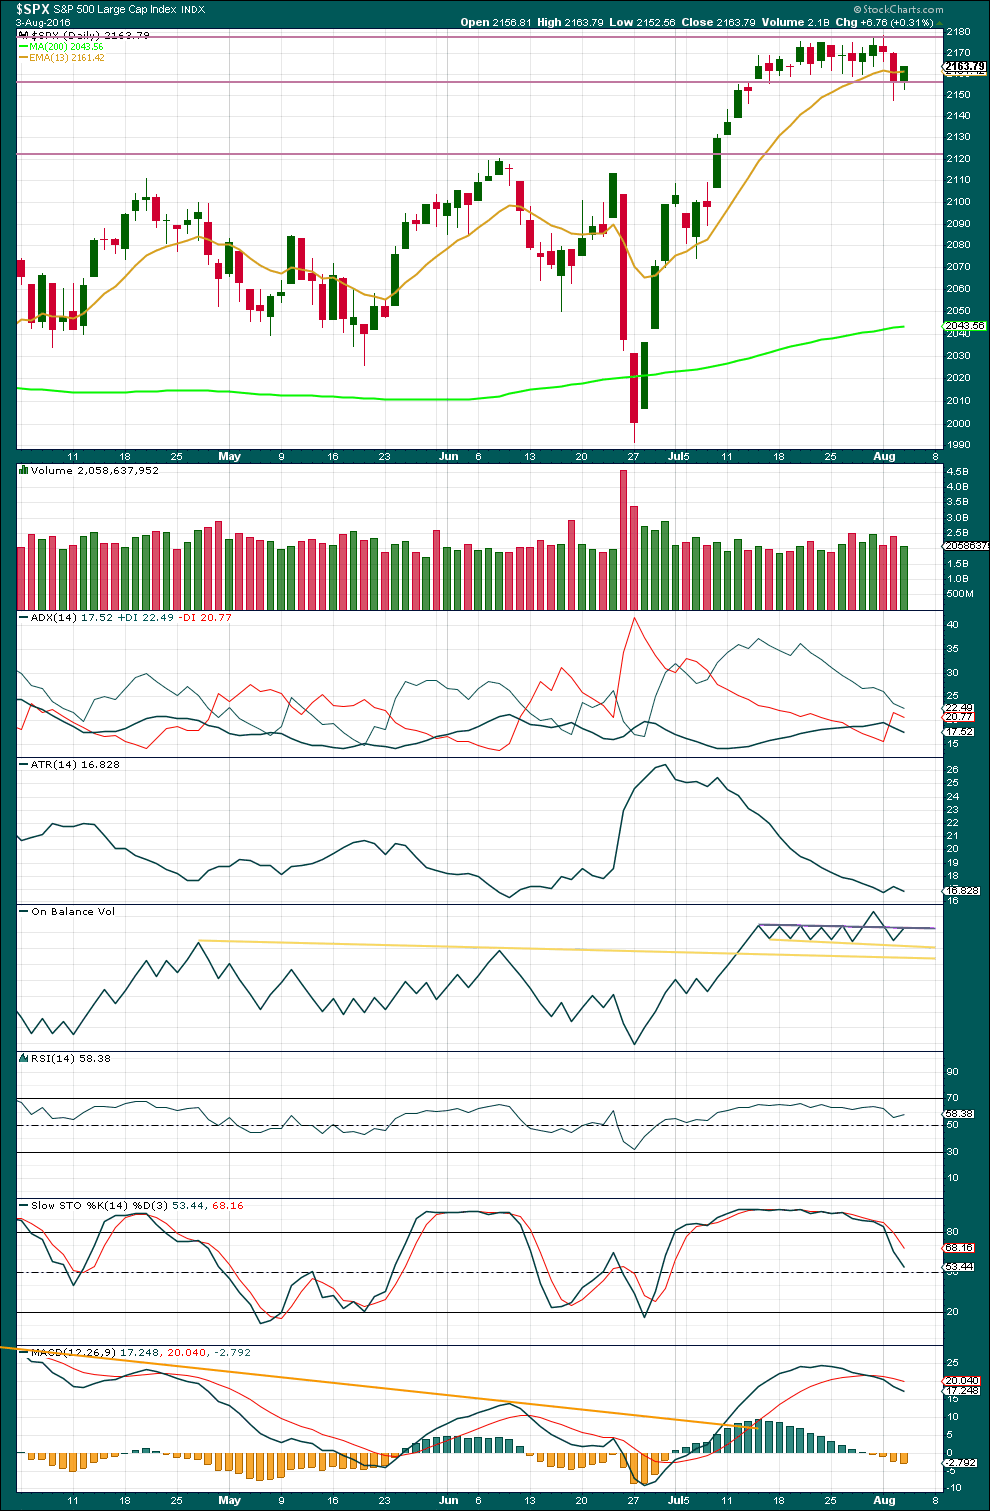
Price did not manage to close below the recent consolidation. Yyesterday’s red daily candlestick closed back just above the horizontal trend line about 2,155. Now the next daily candlestick takes price up well within the consolidation zone.
It is still a downwards day which has strongest volume during this consolidation. This indicates a downwards breakout may be more likely than upwards. This supports the alternate Elliott wave count over the main Elliott wave count.
Today’s upwards movement was not supported by volume, so it is suspicious. This also supports the alternate Elliott wave count over the main Elliott wave count.
However, volume during consolidations as an indicator of breakout direction has not worked well recently. Some caution is advised with this data now. It is indicative only and may not prove to be correct for price direction.
ADX is decreasing, indicating the market is not currently trending. ATR is also decreasing, in agreement with ADX. The market is consolidating.
Stochastics is returning from overbought. Some more downwards movement may be expected until Stochastics is oversold and price finds support. Price may find support about 2,134, the prior all time high, as the consolidation widens.
On Balance Volume broke above the grey line giving a bullish signal, but that signal was negated by OBV returning to back below this line. OBV is now again finding resistance at this line but resistance here is weakened. A break below either yellow line would now be a strong bearish signal from OBV.
RSI is not extreme. There is plenty of room for price to rise or fall.
At this time, the conclusion from Lowry Research is there is not enough evidence of selling pressure to push price lower for a deeper decline. This supports the main Elliott wave count over the alternate.
VOLATILITY – INVERTED VIX MONTHLY CHART
Click chart to enlarge. Chart courtesy of StockCharts.com.
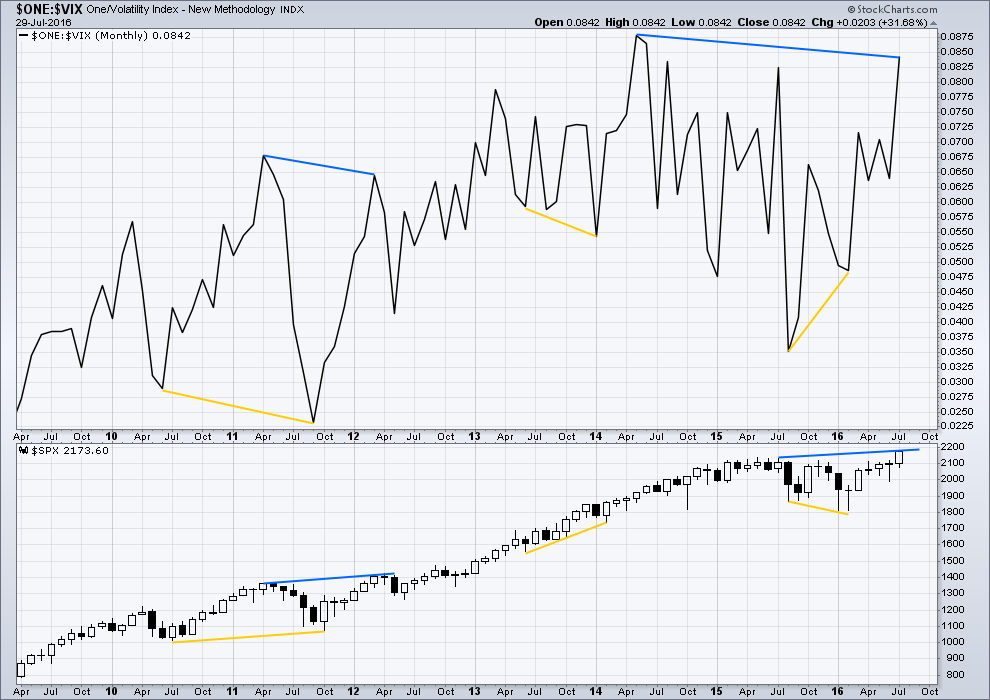
VIX from StockCharts is inverted. As price moves higher, inverted VIX should also move higher indicating a decline in volatility which is normal as price moves higher. As price moves lower, inverted VIX should also move lower indicating an increase in volatility which is normal with falling price.
There is still strong multi month divergence with price and VIX. While price has moved to new all time highs, this has not come with a corresponding decline in volatility below the prior all time high at 2,134. This strong multi month divergence between price and VIX indicates that this rise in price is weak and is highly likely to be more than fully retraced. However, this does not tell us when and where price must turn; it is a warning only and can often be a rather early warning.
At this time, although divergence with price and VIX at the daily chart level has been recently proven to be unreliable (and so at this time will no longer be considered), I will continue to assume that divergence with price and VIX at the monthly chart level over longer time periods remains reliable until proven otherwise.
This supports the idea that price may be in a fifth wave up. Divergence between the end of a cycle degree wave III and a cycle degree wave V would be reasonable to see. Fifth waves are weaker than third waves. This strong divergence indicates that price targets may be too high and time expectations may be too long. However, it remains to be seen if this divergence will be reliable.
DOW THEORY
Major lows within the prior bull market:
DJIA: 15,855.12 (15th October, 2014) – closed below on 25th August, 2015.
DJT: 7,700.49 (12th October, 2014) – closed below on 24th August, 2015.
S&P500: 1,821.61 (15th October, 2014) – has not closed below this point yet.
Nasdaq: 4,117.84 (15th October, 2014) – has not closed below this point yet.
Major highs within the new bear market:
DJIA: 17,977.85 (4th November, 2015) – closed above on 18th April, 2016.
DJT: 8,358.20 (20th November, 2015) – has not closed above this point yet.
S&P500: 2,116.48 (3rd Nobember, 2015) – has now closed above this point on 8th June, 2016.
Nasdaq: 5,176.77 (2nd December, 2015) – has not closed above this point yet.
Dow Theory Conclusion: Original Dow Theory still sees price in a bear market because the transportations have failed to confirm an end to that bear market. Modified Dow Theory (adding S&P and Nasdaq) has failed still to confirm an end to the old bull market, modified Dow Theory sees price still in a bull market.
This analysis is published @ 07:20 p.m. EST.

The consolidation continues. The absence of any follow trough to the downside means chances are that the move continues in the prior direction which is up. Not sure where it will ultimately end but my plan is to use upward moves to accumulate volatility. ‘Bye all!
The more I watch this price action, the more convinced I become that what the banksters are doing with this kind of relentless market intervention is going to ultimately result in a crash unlike any we have seen before. For many months now what they have been doing has resulted in violent, swift impulses down completing intra-day and I suspect that is how their years of attempts at market manipulation will end. If what I am thinking turns out to be the case, Joe’s contention of 30% down days could end up being conservative…
I don’t know about 30% days. There are regulations in place that will halt trading at 7%, 13%, and 20% moves in the S&P from my understanding. If these down days do happen, it’s likely that trading sites will be moving very slowly so it will be time consuming to get in and out of trades on your trading platform depending on what you choose to use. This happened to me a few years back, so stops definitely help in this instance if you find yourself on the wrong side.
I think the point of the comment was precisely to point out that getting into short trades and out of long ones if that happens would be all but impossible. When markets are manipulated for as long as these have been, I would not be surprised to see the implosion come with little or no warning. Of course there will be some exogenous proximate cause that folk will cite to explain why the market did what it did but I think the gist of the matter is that one has to be anticipating this event and not responding to it.
I for one am getting tired of their shenanigans …..
Vern,
I added VIX as a hedge as well.
I just got very very very short. Let’s see if this sells off here.
I added to my hoard of VIX shares. Anything under 13 I am prepared to accumulate for the long haul….
On 15 minute chart it does look like an impulse down and a long, slow zig zig up for a second wave. If that is right, we should swiftly take out this morning’s low on a third wave down…
still don’t trust these moves. Lowering stop…just in case.
The trend is probably still up. I won’t be going short here. I’ll be going long if I enter this market at all.
Underside of channel of last several weeks still providing resistance to upwards movement. VIX and UVXY showing high complacency (new 52 week low in UVXY) even though no we have no break out from channel and that is bearish imo. Traders may be waiting for job report tomrrow so nothing to do at this point but wait for Mr. Market to make his intentions clear with a move above 2178.28 or below 2147.58.
I agree with High Yield bubble popping and so on and so forth. At some point markets will follow as well. But not now. The funny thing is that you can say all these things as most bears have been saying for years, yet nothing has happened. Of course it will happen as some point. But until then, play the hand dealt rather than fighting the tape. I agree with Lara assessment and her year end target.
Normally I would agree with that. But NO WAY at this time.
When this starts the entry to play it or to exit if long will be difficult… both sides will be trapped or blocked for a bit.
Plus and more importantly everything I know and feel tells me I am right. So I can’t go against that. So I wait.
Joseph —
I take it you are a Trump supporter.
I rather not say in this forum.
You can say it, but be prepared for a response.
My POV from the other side of the world is very different.
This membership is global. There are many different POVs here.
Levitation continues… Houdini is alive and well!!!
Joseph,
Completely disagree. This is more of a reason for Fed to increase rates (at least once this year or maybe even twice). They have a few bullets left and they don’t want to go to -ve interest rates. US economy is still (relatively speaking) performing better than most other developed markets. if you think stocks are a bubble, then the bond market is a gigantic bubble and 30 year cycles indicate that we have seen the highs (barring any war or major shock) in the bond market. Inflation is slowly creeping into US economy and labor market is tight. Some on you may not agree with that assessment, but that is what makes a market.
They ain’t doing sh_t before the election! Anyone who thinks they will is delusional!
Their mission is to elect Clinton!
December is the only opportunity and if things play out economically as I believe… They will not raise. If Trump is elected they will raise and blame all the consequence’s of normalizing on him. The narrative to come is as clear as day to me.
Yes bonds are in a bubble but the yields on US Treasuries and the 30 Year Bond will go below 2.00% before that bubble bursts.
The bubble in High Yield Debt will POP 1st followed by investment grade corporate debt & muni’s and then last will be US Treasuries after the safe haven trade plays out.
Sunny, I don’t think they are raising rates. I read somewhere that an and average 1% increase in rates, will cost an extra trillion dollars to service. Now I don’t know how accurate that number is, but I do believe they are caught between a rock and a hard place.
Now if you look at the velocity of money for the US, it’s telling you that all this liquidity hasn’t done it’s job, as velocity of money is at multi decade lows. I think it’s the velocity of money that scares the banksters the most, and all they have done in the past 8 years, is make our situation worse.
And they really need inflation to reduce the value of the debt in real terms…
Or Debt can deflate via defaults or Chapter 11 or Chapter 9
Everyone takes a 50 to 70% haircut!
Corporate Free Cash Flows have been going negative at increasing rates.
Governments? There cash flows are always negative. When they can no longer issue debt… It’s Game Over!
With the moves this morning by the BOE…
The 30 Year US Treasury Bond is a “Sure Thing” to now go below a 2.00% Yield in the not too distant future. I have been saying it may for some time now. IMO it is now a certainty!
Below 2159.07 looks like impulse down followed by 5,3,5 ZZ upwards correction..
Caveat is that I personally no longer have confidence in these initial impulses down. Bankster intervention frequently negates them so we will just have to see how this one develops…may be morphing into a double ZZ…
BOE… Cuts rates and more QE.
The spiral down continues! The evidence is as clear as day… World Wide Recession is here… but the dumb a_s markets don’t want to believe it!
NO WAY OUT NOW… Deflation will soon accelerate! The ONLY remaining inflation has been and IS in Asset Prices (Stocks, High Yield Debt and Sovereign Debt! The Bubble has been pricked and will soon POP! In that order.
Factory Orders Down 1.50% in June after being Down 1.20% in May
No US Growth! No Corporate Revenue Growth! Profits Down… Year over Year! The Profit Margin Bubble has POPED!
S&P Fair Market Value with all this factored in is less than 1050… yes ONE 050!
Do the Math using GAAP 12 month trailing Earnings, Revenue and other GAAP metrics! Forget non-gaap made up garbage and the fictional Forward Analysts Estimates because it’s all fictional and will be revised much lower… You all just don’t know it yet!
Valuations are north of 24 times earnings… It will swing the other way to below 10.
Debt-To-EBITDA Ratios Are Now The Highest In History
[A] prominent feature of extended bull markets is higher levels of leverage, as measured by the ratio of debt to equity. We found that the debt-to-equity ratio went up during every late-cycle bull market since 1980. Advances in debt and more efficient use of capital structures are obvious ways for companies to offset the economic malaise that sets in toward the end of business cycles and continue to drive stock prices higher. It is when companies stop borrowing because they become more cautious on their capital structures or credit markets tighten that bull markets fail to get extended.
Total debt for non-financial companies in the S&P 500 has increased by more than $1tn since the beginning of 2010. This has fueled the surge in payouts… Companies in the S&P 500 have a cash flow deficit of approximately $150bn per year that must be funded in the investment grade credit market to maintain the current level of share repurchases. While this may be a sustainable amount given the easy conditions and low rates in high grade credit, the days of accelerating growth in borrowings are likely in the past, in our view. This is because some important measures of debt sustainability, such as the ratio of debt-to-EBITDA are already elevated, as shown in Figure 9. The median debt-to-EBITDA ratio of the non-financial companies in the S&P 500 has reached 2.3x, a measure unmatched since 2000, which is the earliest year that we have reliable data.
http://www.zerohedge.com/news/2016-08-04/debt-ebitda-ratios-are-now-highest-history
We have known for some time that equity evaluations bear absolutely no relation to economic reality Joe so nothing new there. It is difficult to say how long the insanity can go on. Speaking of insanity and its definition, Japan has now decided that doubling down on their approach with regard to buying their own market ETFs will now work, such efforts having failed to produce desired results the last few decades…
Maybe here most know that… But the vast majority of 401K & IRA (Bulk of Investable Funds in USA) and other investors who are on auto pilot don’t because of the disinformation campaign in the media, financial press and other.
These people need to be fully informed so that they can make an informed decision on what to do before it’s too late for them. They will be left holding the bag!
I know, I sound like a broken record… but this is just too important to go silent on!
Go ahead… make my day!
Sorry, I must post this because this is 100% true and exactly how I also feel! This PC BULL Crap must end once & for all!
“It’s A Sad Time In History” Clint Eastwood Rages “We’re Really A Pussy Generation… F##king Get Over It”
“[Trump’s] onto something, because secretly everybody’s getting tired of political correctness, kissing up… We’re really in a pussy generation. Everybody’s walking on eggshells… Just fucking get over it. It’s a sad time in history.”
http://www.zerohedge.com/news/2016-08-04/its-sad-time-history-clint-eastwood-rages-%E2%80%9Cwere-really-pussy-generation-fking-get-ov
Good day Lara,
In your daily TA section, you mention “Lowry Research”. I may have missed some earlier introduction of Lowry. I looked them up on the internet and learned a bit about them and their services. But I am not sure why you are including them in your analysis at this time. Please give me some insight.
Thank you,
Rodney
The AD line you can see from StockCharts isn’t very reliable because it includes many non operating companies. I wanted a better measure of market breadth. Lowrys give that, they have an Operating Companies Only AD line, they also provide measures of selling and buying pressure and a great weekly summary.
It gives a bit more info on which I can make my end of week analysis
First.
Oh oh, my name was changed since I last posted.
Lara, appreciate if you could change it to Alan Tham.
I am first by default,, posting under an incorrect name is illegal,, woo hoo
Haha 🙂
Hee hee. Remember one person by the name of Thomas Cruise Mapother. Hollywood decided to jazz up his name to give it more pizazz. The rest is history.
Probably the website decided to treat me the same way — a celeb in the making.
LMAO
We may just have to give you this one Doc…