
Upwards movement is choppy and overlapping indicating a diagonal.
Summary: A consolidation may be completing for intermediate wave (2). Price should move overall upwards before turning and moving lower for a few days to end below 2,159.07.
Last monthly chart for the main wave count is here.
New updates to this analysis are in bold.
MAIN WAVE COUNT
WEEKLY CHART
Click chart to enlarge.
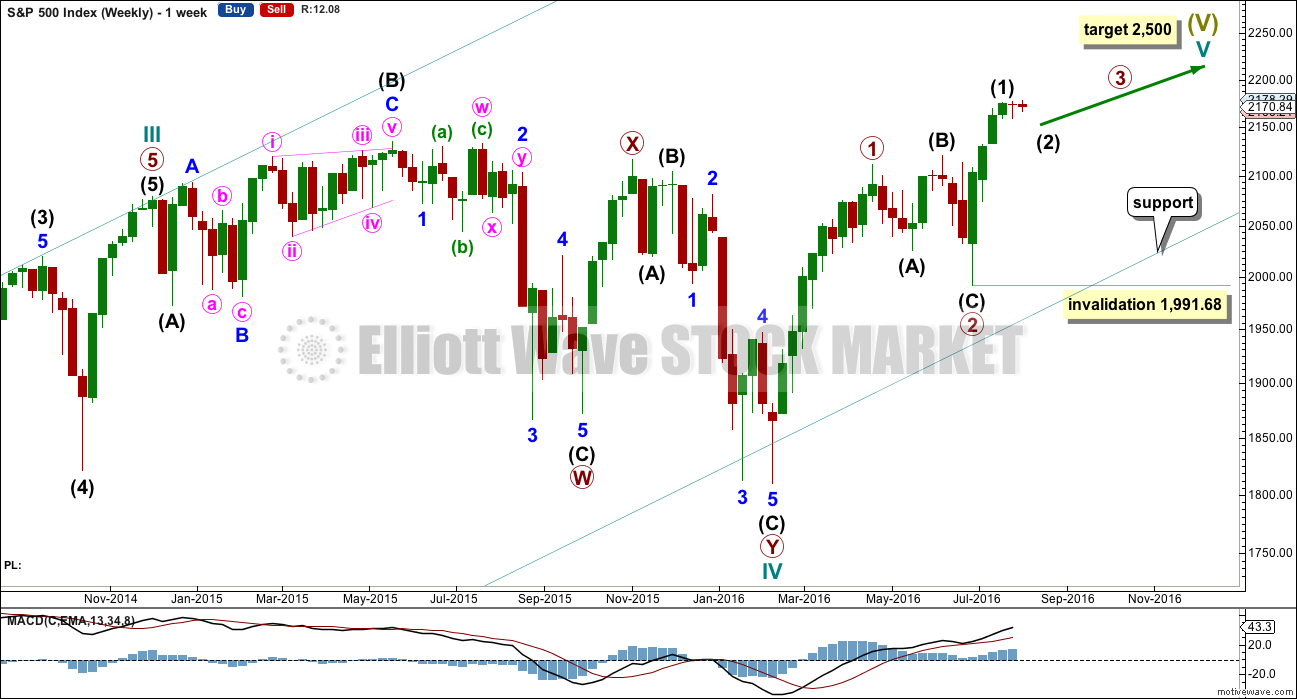
Cycle wave II was a shallow 0.41 zigzag lasting three months. Cycle wave IV is now seen as a more shallow 0.28 double combination lasting 15 months. With cycle wave IV five times the duration of cycle wave II, it should be over there.
Cycle wave I lasted 28 months (not a Fibonacci number), cycle wave II lasted a Fibonacci 3 months, cycle wave III lasted 38 months (not a Fibonacci number), and cycle wave IV lasted 15 months (two more than a Fibonacci 13).
If the target for cycle wave V is for it to be equal in length with cycle wave I, then it may also be expected to be about equal in duration. So far cycle wave V is in its fifth month. After this month, a further 23 months to total 28 seems a reasonable expectation, or possibly a further 16 months to total a Fibonacci 21.
This first weekly wave count expects the more common structure of an impulse is unfolding for cycle wave V. Within cycle wave V, primary waves 1 and now 2 should be over. Within primary wave 3, no second wave correction may move beyond its start below 1,991.68.
There is one other possible structure for cycle wave V, and ending diagonal. This is covered in an alternate.
DAILY CHART
Click chart to enlarge.
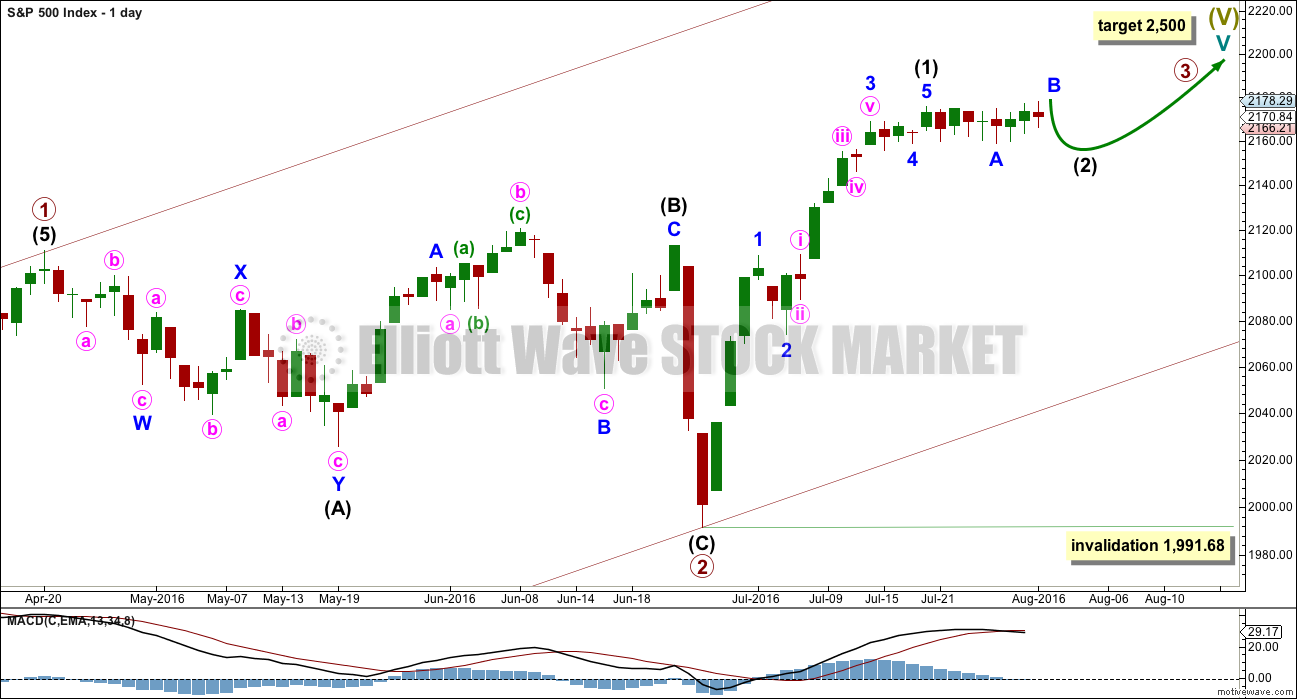
It is most likely that primary wave 2 is already complete as a shallow regular flat correction. Primary wave 3 is most likely underway.
Sideways movement over the last twelve sessions is now too far outside of a channel containing prior upwards movement. This sideways movement looks like a separate wave and not a correction within prior upwards movement. For this reason today this wave count, which was an alternate up to last analysis, is now the main wave count.
Within primary wave 3, intermediate wave (1) is a complete impulse. Intermediate wave (2) is incomplete and so far looks like it is unfolding as a flat correction.
Intermediate wave (2) may not move beyond the start of intermediate wave (1) below 1,991.68.
Intermediate wave (2) is expected to be shallow and not a deep pullback when it is done.
HOURLY CHART
Click chart to enlarge.
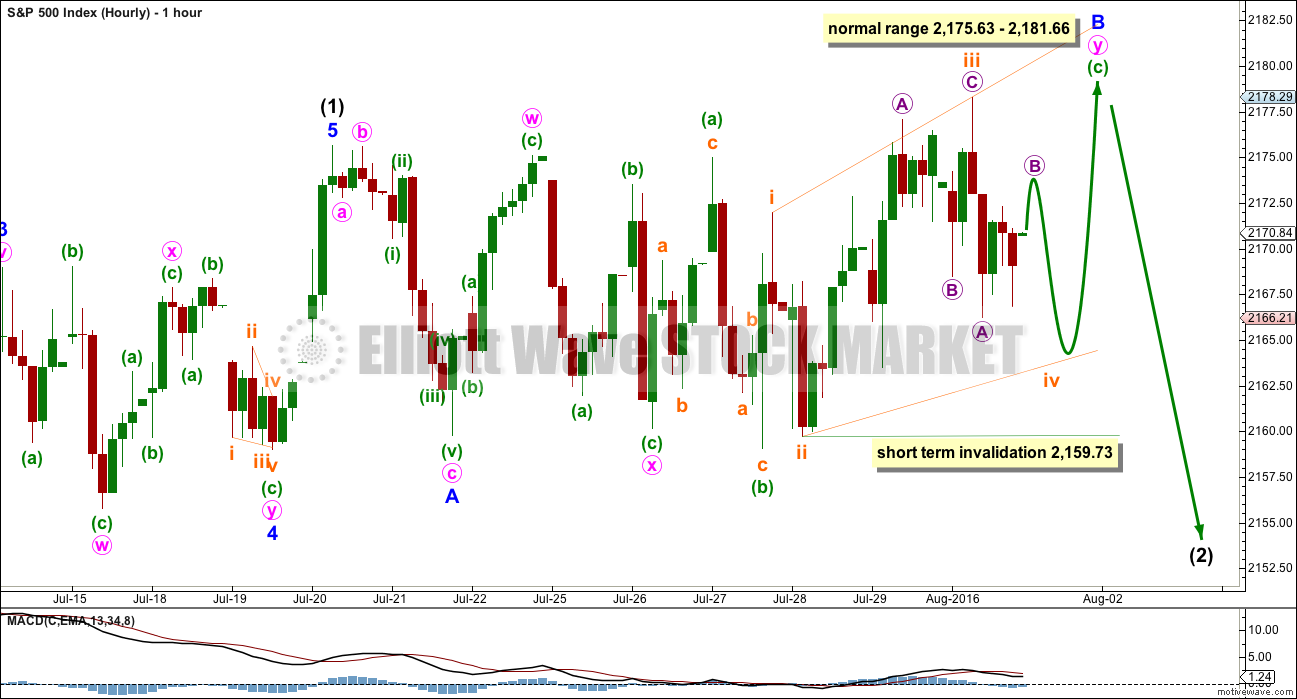
Within intermediate wave (2), so far minor wave A down subdivides as a three. Minor wave B upwards looks still to be incomplete. It may be subdividing as a double combination: zigzag – X – flat.
With both waves A and B subdividing as threes, this indicates a possible flat for intermediate wave (2). Within a flat correction, the normal range for minor wave B is from 1 to 1.38 the length of minor wave A. This gives a normal range from 2,175.63 to 2,181.66.
Within the second structure of the combination for minor wave B, minuette wave (c) must subdivide as a five. This may be either an impulse or an ending diagonal. There is too much overlapping within this movement so far for an impulse. It looks like an ending diagonal.
The diagonal would be expanding because subminuette wave iii is longer than equality in length with subminuette wave i. Subminuette wave iv must be longer than equality in length with subminuette wave ii to meet the rules regarding wave lengths for expanding diagonals. It must reach below 2,166.04.
The normal range for subminuette wave iv within the diagonal is from 0.66 to 0.81 the length of subminuette wave iii. This gives a range from 2,166.04 to 2,163.26.
Subminuette wave iv may not move beyond the end of subminuette wave ii below 2,159.73.
When subminuette wave iv is complete, then subminuette wave v upwards should be longer than 18.56 points.
Within an ending diagonal, all the sub-waves must subdivide as zigzags and the fourth wave must overlap first wave price territory.
ALTERNATE WAVE COUNT
WEEKLY CHART
Click chart to enlarge.
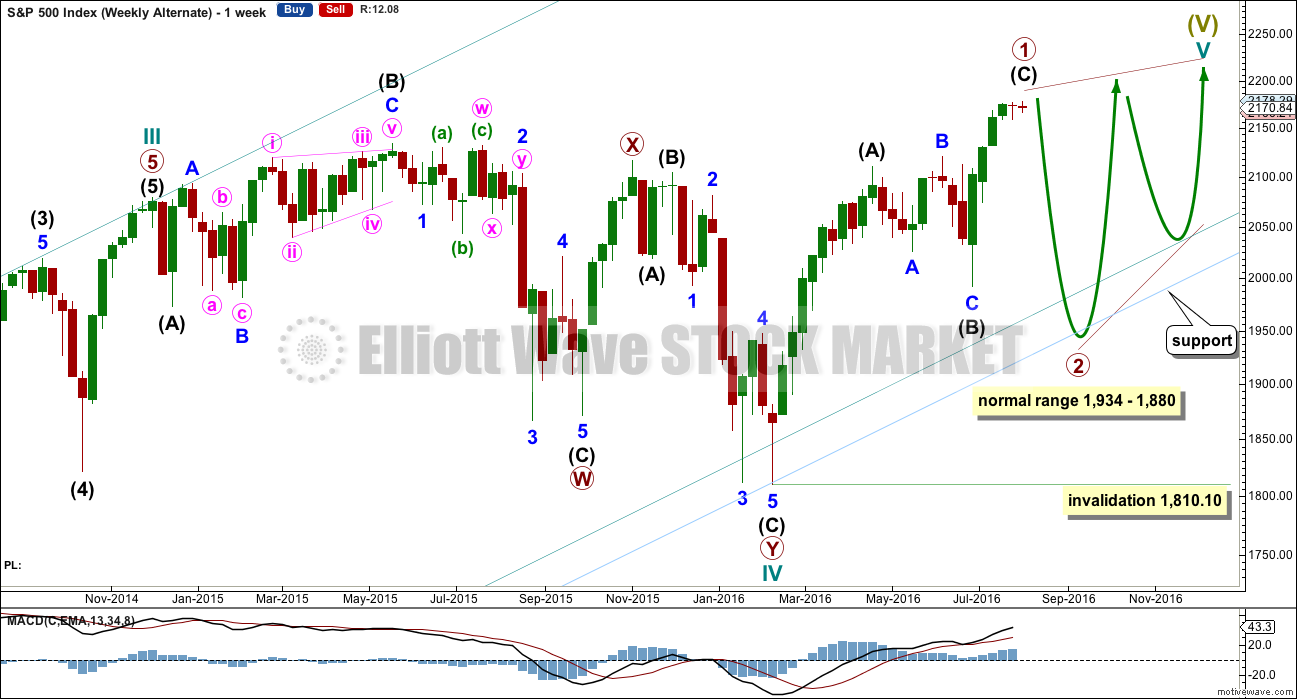
Cycle wave V may be unfolding as an ending diagonal. The most common type of diagonal by a reasonable margin is a contracting diagonal. When primary waves 1 and 2 are complete, then primary wave 3 would most likely be shorter than primary wave 1. If primary wave 3 were to be longer than primary wave 1, then the less common variety of an expanding diagonal would be indicated.
Within an ending diagonal, all the sub-waves must subdivide as zigzags and the fourth wave must overlap back into first wave price territory. The whole structure is choppy and overlapping with a gentle slope. The classic pattern equivalent is a rising wedge.
The zigzag of primary wave 1 upwards may now be complete as per labelling for the alternate daily wave count above in terms of seeing the impulse of intermediate wave (C) complete.
A target range for primary wave 2 may be calculated. It would most likely be between 0.66 to 0.81 the length of primary wave 1. This gives a range from 1,934 to 1,880. It may find support at a lower parallel copy of the channel about Super Cycle wave (V) copied over from the monthly chart.
Primary wave 2 may not move beyond the start of primary wave 1 below 1,810.10.
Ending diagonals have corrective characteristics as they subdivide into a series of zigzags. Ending diagonals contain uncertainty; the trend is unclear as they unfold due to the deep corrections of their second and fourth waves. They are terminal and doomed to full retracement. This may explain some persistent weakness to this upwards trend at this time. The final target at 2,500 for the main wave count would be far too optimistic if this alternate is correct and the diagonal is contracting.
Third waves of even diagonals should still be supported by volume and should still exhibit stronger momentum than the first wave.
For this alternate wave count, a deep pullback could very soon be expected for primary wave 2 to last several weeks.
TECHNICAL ANALYSIS
WEEKLY CHART
Click chart to enlarge. Chart courtesy of StockCharts.com.
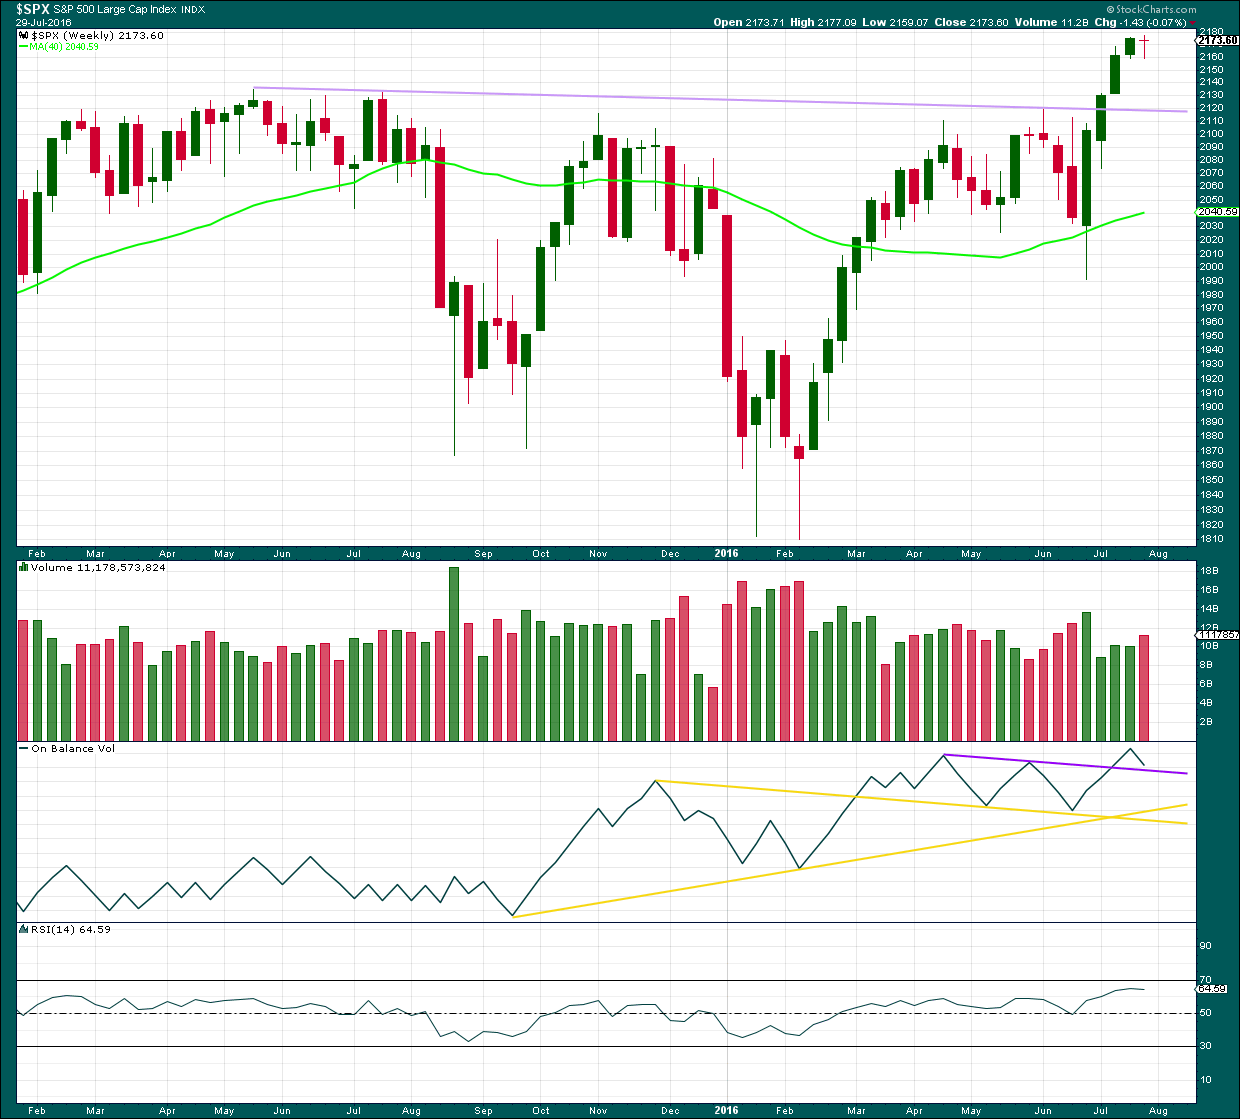
The week before last week completed a stalled candlestick pattern. This indicated a trend change from up to either down or sideways. Last week completed a small red doji, so the trend may have changed from up to sideways. It may still yet turn down.
The bearish implications of the stalled candlestick pattern may now be fulfilled, or more downwards / sideways movement may continue.
Last week’s red doji comes with an increase in volume. This short term volume profile is slightly bearish. Only slightly because the candlestick is a doji and not a regular candlestick with a red body.
On Balance Volume has come down to almost touch the upper purple line. It may find support here. If this line is breached, then some support may be expected at the next trend line.
RSI is not extreme and is flattening off. There is still room for price to rise.
DAILY CHART
Click chart to enlarge. Chart courtesy of StockCharts.com.
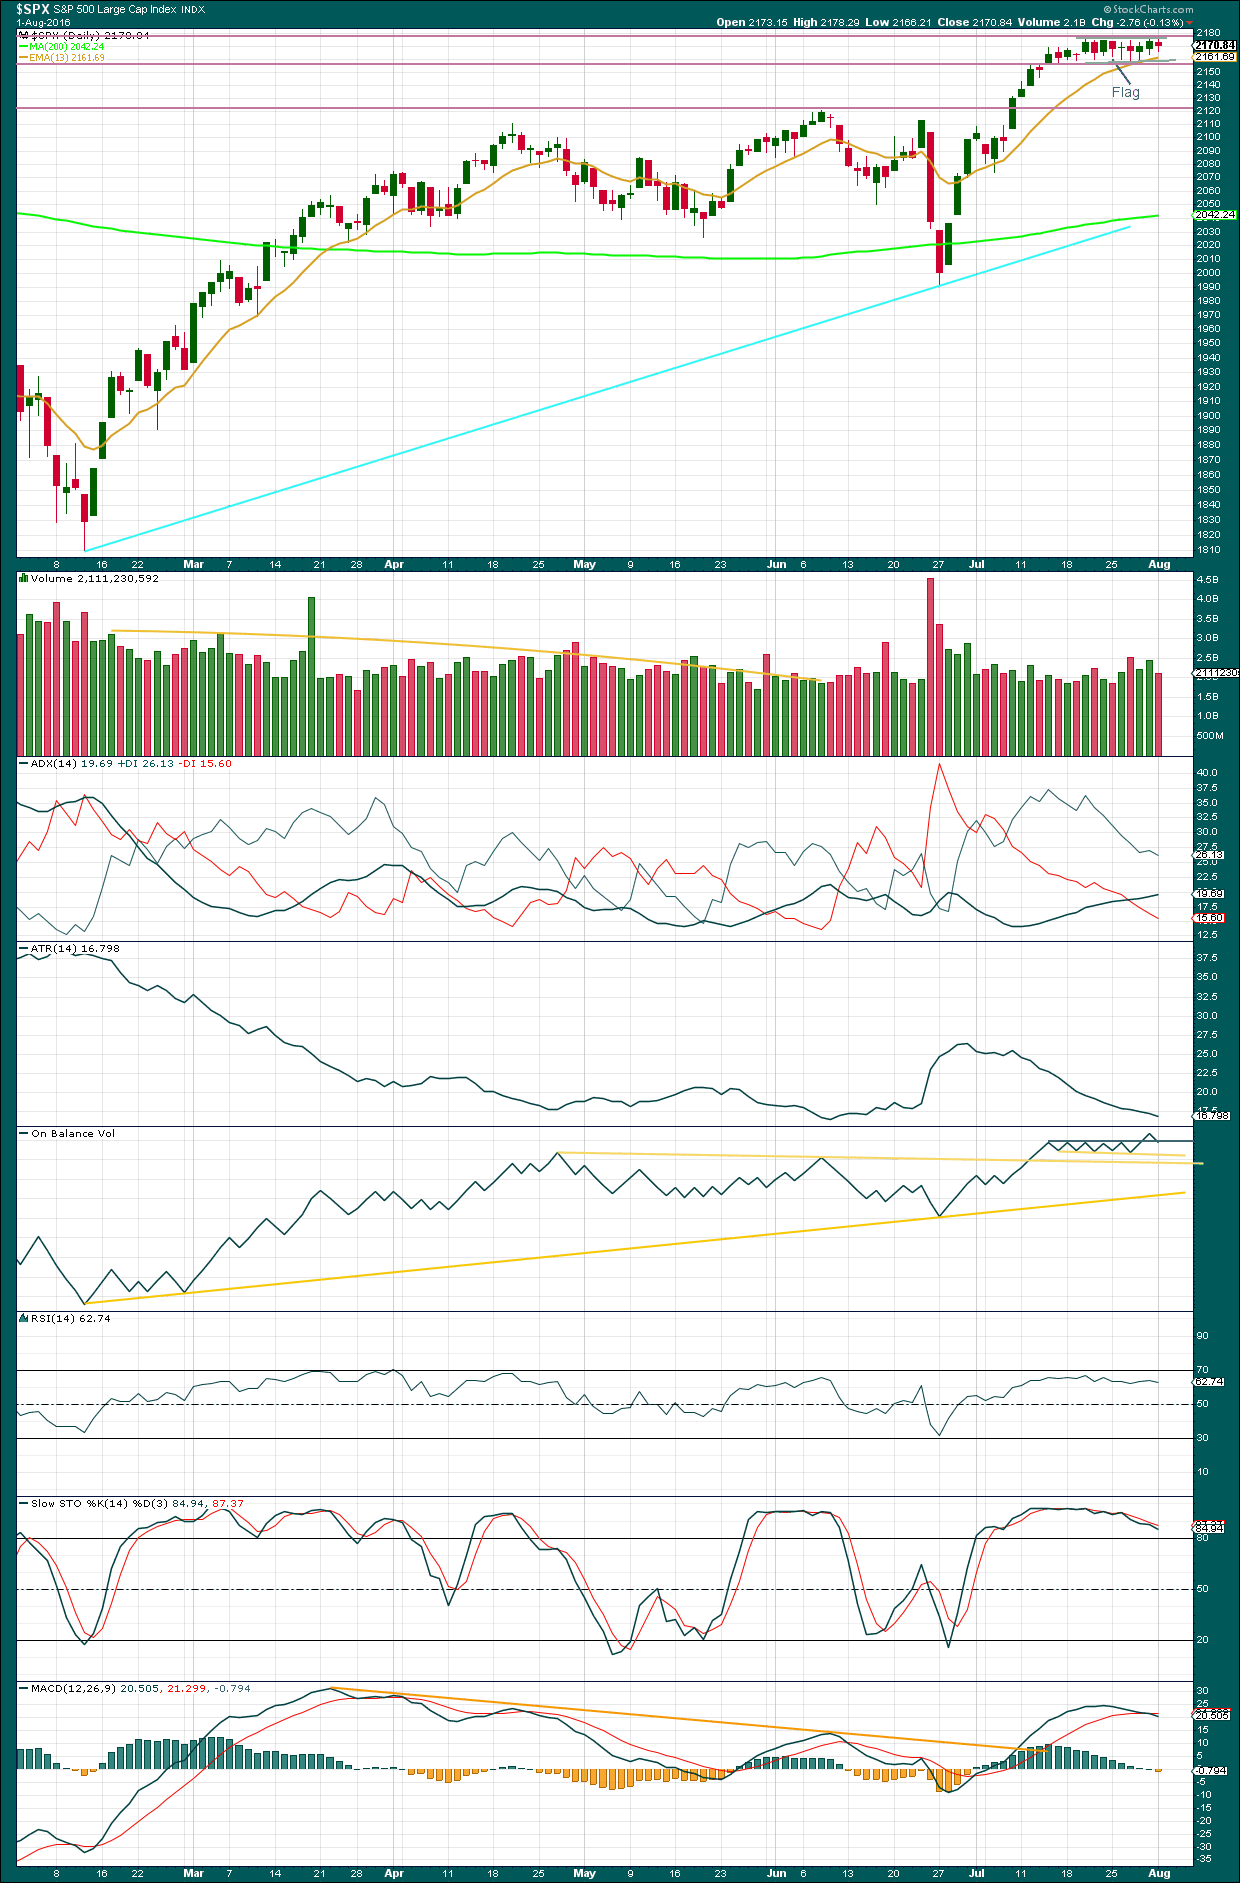
Price remains constrained within a small consolidation, but On Balance Volume may be indicating a breakout direction. OBV broke out of its corresponding consolidation upwards. The direction for price this week now looks most likely to be upwards.
A small red candlestick comes with lighter volume today. There is less support for downwards movement from volume than there was for the two prior upwards days. The volume profile here looks bullish for the last three days’ price movement.
During this consolidation, it is still a downwards day which has strongest volume suggesting a downwards breakout is more likely. However, this trick has recently been proven to not work at the weekly chart level, so it is approached with some suspicion at this time. More weight will be given to On Balance Volume.
ADX is above 15 and increasing. The +DX line is above the -DX line. ADX is indicating an upwards trend is in place.
ATR still disagrees as it is declining. There is something wrong with this trend. It does not look to be normal and healthy.
RSI is not yet overbought. There is room for price to rise further.
Stochastics is declining as price is rising but divergence is not currently working, so at this time this shall be given no weight at all. It will not be useful to assist in showing where this trend may end.
MACD is declining and may be about to indicate a trend change from up to down, but this too may not be reliable at this time.
At this time, the most reliable classic analysis still seems to be volume, short and mid term.
VOLATILITY – INVERTED VIX MONTHLY CHART
Click chart to enlarge. Chart courtesy of StockCharts.com.
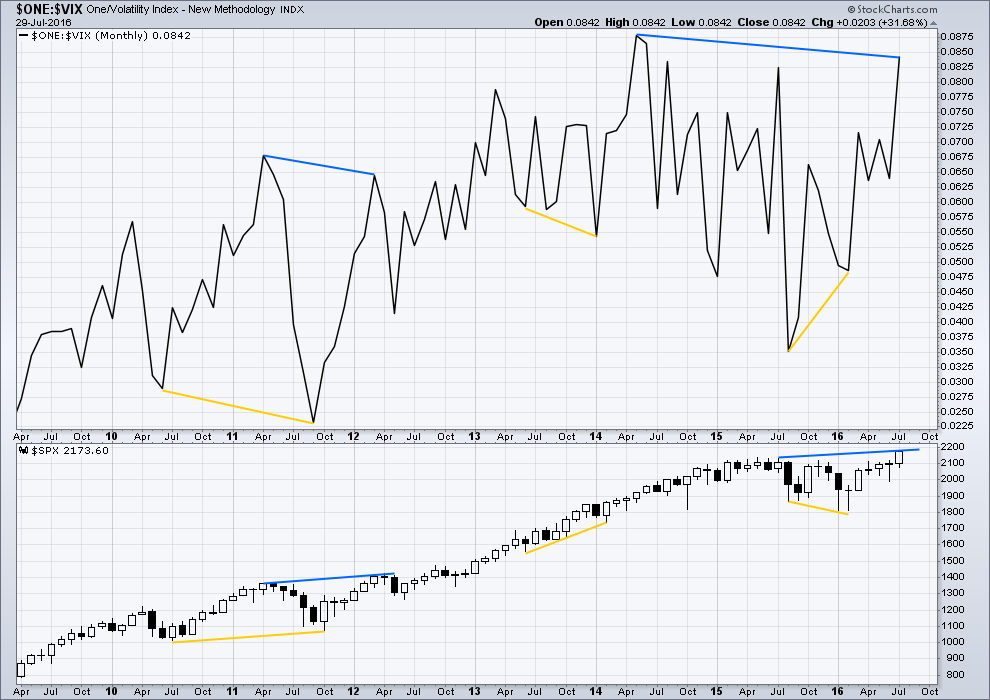
VIX from StockCharts is inverted. As price moves higher, inverted VIX should also move higher indicating a decline in volatility which is normal as price moves higher. As price moves lower, inverted VIX should also move lower indicating an increase in volatility which is normal with falling price.
There is still strong multi month divergence with price and VIX. While price has moved to new all time highs, this has not come with a corresponding decline in volatility below the prior all time high at 2,134. This strong multi month divergence between price and VIX indicates that this rise in price is weak and is highly likely to be more than fully retraced. However, this does not tell us when and where price must turn; it is a warning only and can often be a rather early warning.
At this time, although divergence with price and VIX at the daily chart level has been recently proven to be unreliable (and so at this time will no longer be considered), I will continue to assume that divergence with price and VIX at the monthly chart level over longer time periods remains reliable until proven otherwise.
This supports the idea that price may be in a fifth wave up. Divergence between the end of a cycle degree wave III and a cycle degree wave V would be reasonable to see. Fifth waves are weaker than third waves. This strong divergence indicates that price targets may be too high and time expectations may be too long. However, it remains to be seen if this divergence will be reliable.
DOW THEORY
Major lows within the prior bull market:
DJIA: 15,855.12 (15th October, 2014) – closed below on 25th August, 2015.
DJT: 7,700.49 (12th October, 2014) – closed below on 24th August, 2015.
S&P500: 1,821.61 (15th October, 2014) – has not closed below this point yet.
Nasdaq: 4,117.84 (15th October, 2014) – has not closed below this point yet.
Major highs within the new bear market:
DJIA: 17,977.85 (4th November, 2015) – closed above on 18th April, 2016.
DJT: 8,358.20 (20th November, 2015) – has not closed above this point yet.
S&P500: 2,116.48 (3rd Nobember, 2015) – has now closed above this point on 8th June, 2016.
Nasdaq: 5,176.77 (2nd December, 2015) – has not closed above this point yet.
Dow Theory Conclusion: Original Dow Theory still sees price in a bear market because the transportations have failed to confirm an end to that bear market. Modified Dow Theory (adding S&P and Nasdaq) has failed still to confirm an end to the old bull market, modified Dow Theory sees price still in a bull market.
This analysis is published @ 08:00 p.m. EST.
One more thing…the reason I just LOVE! the possibility of an ending diagonal at primary degree is we know exactly how it is going to behave when it’s done and I know our Lara will be way ahead of the game. It is a joy trading these animals as they reliably swiftly and relentlessly retrace the entire movement from their inception. Remember all the heart-break we endured the last year or so over all those elusive third waves??!! Well, hear me now and believe me later…if this is indeed and ending diagonal developing….those days are OVER!! Cheerio!!! 🙂
Futures so far down around 70. If P2 down is on deck, it will be triple digits by the open. Watch the tape overnight and see the banksters pump! (all to no avail) 🙂
70???
I don’t have a solution yet for minor B, but pretty obviously it’s over.
This downwards wave is either minor C to complete intermediate (2), and it’s probably over, or it’s the start of a larger pullback for primary 2 (alternate wave count).
Wow! Just got an interim report from the guys at EWI and things are starting to coalesce it would seem. Bob also sees a correction continuing now that is either a two of a wave three (he does not specify degree) or a two of an ending diagonal which he thinks would be neat as the wave movements would be easier to track. He also states that there is a “slim” chance that a top may be in…
I previously dismissed his earlier call of a wave four and he was right and I was wrong. I think I will hold off on my bullish calls and hang on to my VIX position for the time being….’Bye all!
I don’t blame you for holding off on those calls. From an old school TA standpoint, we were in a 13 day sideways pattern and when we broke out to the upside, it was brief, and was immediately sold into. Then there’s today….with prices falling below the lows of that 13 day sideways pattern. Which is very bearish IMO and making yesterday’s break out to the new highs in the SP a head fake….at least, so far.
Right now, with what I just described above, I believe he trend is down and I will be shorting all rallies….but only after the move starts rolling over and I have some momentum on my side.
Very conflicted. We are seeing the biggest VIX candle since June 7, ahead of a multi-week run toward the upper BB. I don’t think we can completely rule out a P2 wave down…if VIX closes above 14, I would be most cautious about the bullish case…ahead of a third wave up VIX should head back below 13.00 imo…
Trump continues to look out for the well being of the average USA worker and all his supporters… Nobody telling the average worker & others this information… not even their own advisors!
Taken for an article on Zero Hedge:
{Trump on Tuesday urged his supporters holding 401-(k) to get out of equities as interest rates set by the Federal Reserve are inflating the stock market.
“I did invest and I got out, and it was actually very good timing,” the Republican presidential nominee said in a phone interview with Fox Business. “But I’ve never been a big investor in the stock market.” “Interest rates are artificially low,” Trump said. “The only reason the stock market is where it is is because you get free money.”
Trump also warned of “very scary scenarios” ahead for investors.}
Philip Davis:
“if the components that get kicked out are any indication of where countries are declining, we should be a bit concerned that Euro Stoxx 50 were kicked out Deutsche Bank (NYSE:DB) and Credit Suisse (NYSE:CS) this morning”
The lower wick today is not very long but we have seen this kind of action so frequently in the past that it is a safe bet that this move down is done and that we had a completion of an intermediate two wave down via minor C today. If that is true, and I imagine we should now see a slow and persistent crawl back up for the indices, it may be time to pick up a few calls for the final ride up…
vern– when you say bulls are all in — what data are you using to say that — or is that just a rant.
There are a few indicants that indicate bullishness of market participants such as bullish per cent index, AAII surveys, and of course if you have been observing the action in VIX. the put/call ratio; absolutely no need for a rant on that score Sunny… 🙂
It’s nice to see the market trending again. Two questions come to my mind:
1) Does this mean the Fed is done with their supporting this market…at least for now?
2) I count the 5 waves off the top, does this mean the top is in and this is an impulse down, or was that a c wave of some sort? Looking forward to Lara’s analysis tonight.
In my opinion, this market is NOT being sold. It seems to be falling under its own weight. The banksters are going to have to really ramp up their pumping to arrest this slow sinking decline. I suspect the multi-decades record sideways movement we saw the last few weeks was them pumping just enough to stay above water. The problem is that the bulls are already all in….not sure how this affects the wave count….
I agree there’s no buyers left…except maybe the Fed.
I’ll tell you what Verne, I for one…. hope that they are done. There was no doubt there was a “supportive” bid there for a couple of weeks. I just want the markets to return to normal trading tendencies. Even with this move today, I caught it on the short side, but with 1/4 position and I still came out too early because I’m still a little gun shy of the banksters recent manipulation.
The sideways action the last few weeks is totally unprecedented. And you are right, folk are rightly afraid to aggressively sell the market so the languid drift lower. The move down is probably corrective so they will in all likelihood unleash at least one final cash dump for the last move up. I will probably pick up a few calls at the close if we hold 2150.00…
Well…could we be seeing a more complicated second wave correction in volatility…?
Looks like this move down is toast. Shooting star in UVXY on five minute in what may be a truncated fifth wave. I am voting for an intermediate two down completed at this morning’s lows…
OK folks, here we go; let’s see what the bears really have in their tanks- are they going to play with their food and eventually become bankster bait, or are they going on the prowl…??!!
Action in volatility starting to look like a second as opposed to a fourth wave correction. If that is the case, all hell is about to break loose to the downside…
The pattern for the past year has been impulses down completing in a day (it took two days during Brexit) so odds are that is what we are again seeing today with a C wave down unfolding to complete intermediate two. It should be clear by the close which of the scenarios of playing out- intermediate two or primary two…
Looking for a shooting star or doji on this move up in VIX or UVXY to give some clue that we may be finished with this move down…
Fifth wave of an impulse down coming up. Let’s see how hard the bounce is off the new intra-day low…If it’s over UVXY should collapse and print a red candle today…
3,3,5 flat correction for UVXY. We take out 27.62 and its off to the races….26.30 should hold…
VIX needs to hold the 13.50 wave four pivot area on pull-back and then do a moon shot to confirm breakdown…
Does anyone have a count where it is possible and probable that Monday for the S&P *could* mark a final high?
Curious as the last two weeks shows some serious distribution…right before the rug gets pulled.
I have seen an analyst or two who think a top is in. I have not seen a specific wave count to that effect though…I guess one could simply move Lara’s count up one degree…
Double Diag II’s at daily and monthly levels is all I have seen.
But NOT true Orthodox EW. Just an “enhanced variation of EW” that is not yet proven to be valid.
I haven’t found a solution which sees a high in place and a multi year bear market beginning right now.
We have a five wave impulse up in VIX. Looking for a three wave correction and a continued march higher to confirm breakdown….
Dumping SPY calls. I think we’re going lower…
Looking like a small third wave down after a 100% wave two re-tracement on the five minute chart. Either this is a terminal wave C down and should reverse after a fourth and fifth wave or it’s time to enter on the short side as we are going much lower. We should know in the next hour or two…watching VIX for clues…
We will have a confirmation of a P2 down unfolding from overnight futures. There is plenty of time to short this baby if that is the case…no need to jump the gun…
If overnight futures tank, loading up on puts at least a minute or two AFTER the opening tomorrow should be an easy double or triple (for option traders) depending on your risk appetite…
Overnight Futures will NOT Tank…
That is the market the manipulators are controlling tightly! They can control the overnight with very little capital and they will do so!
This whole move to new highs and new all time highs was orchestrated in the overnight markets!
The morons during the day just blindly follow the momentum like brain dead idiots!
And make NO mistake… they all are moronic brain dead idiots!
It’s just pure magic!!!! Houdini is alive and well!!!
I don’t think so Joe. The futures ALWAYS betray primary wave degree events. If it is P2 down they are not going to be able to camouflage it. Now I am not saying they are not going to try, mind you, but if you watch the overnight price action you will see every attempt to pump price get hammered with a gap down tomorrow at the open.
Any big decline will occur during normal trading hours… that’s any primary wave down.
I will give you only one exception… Down Overnight ONLY IF the manipulators or the powers that be orchestrate a move lower. Meaning only if they are ready for one…
If no big follow through down during normal trading hours for an extended period of time (multiple days/weeks), they then will orchestrate the overnight rally’s again back to new highs.
The puppet masters are in full control… until they are all overwhelmed during normal trading hours… meaning DOWN 20% to 30% in one day or a couple of day’s back to back!
This is how it will all unfold!
Any continued levitation and/or continuation of new ATH’s… Is all just pure magic!!!! Houdini is alive and well!!!
Taking profits on my big long VIX position entered at average cost of 12.25 per share. Holding remaining half in case P2 down developing. Will sell remaining half and switch to UVXY options if we break 2150 and VIX closes at day’s high or close to it…
This could be a fairly serious downside move. VIX is showing no sign (via long upper wick) that it plans any kind of retreat in the near future…
Sub-min four has moved below sub-min 2 at 2159.73 thus invalidating the expanding diagonal posited by the main count…
If the alternate count of a beginning P2 to the downside is unfolding, look for VIX to confirm with a big, fat, husky green candle and a close at the day’s highs…
Vern, Thanks for pointing this out….plus all of your other insights.
Holding my nose and buying SPY 216 calls expiring Friday for a buck; 1/4 full compliment. Will add additional quarter when SPY prints green, and final half with a green close…any move below 215 and I fold like a wet blanket… 🙂
Peter Temple of World Cycles Institute has written a fascinating article on diagonals. He notes that while Robert Prechter states that they are rare structures, he has lately been seeing them everywhere and believes several of the major indices are tracing out ending diagonals. He anticipates tops all around by sometime in September. I think he is on to something, as the personality of ending diagonals (to say nothing of the name of the structure itself!) would seem a fitting way to conclude the last several incredible years. I really had to smile at Tim Knight’s comment on “Trading the Close” yesterday, that crude oil seems to be the only asset that is telling the truth about the actual state of the economy. He is right on the money. It is such fun to finally see a price that the banksters cannot manipulate. I think they will shortly be facing the same dilemma with the Gold price. If Lara’s wave count on the Gold service is correct, and I believe it is, we are looking at a historic opportunity!
I have an extensive shopping list I hope to have filled by the end of this week GW… 🙂
I forgot to post the link to Peter Temple’s article. Here it is:
http://worldcyclesinstitute.com/ending-diagonals/
1987!!!
Take what you post a bit further to “Impending Tops”…
http://worldcyclesinstitute.com/wp-content/uploads/2016/07/1987crash-web.jpg
Above is a daily chart of the year leading up to the 1987 DOW top. This wave down was a fourth wave. It was an ABC corrective wave. As such, it came down in an A wave of 3 waves (the A wave down was in 5 waves but the 4th (or b wave) was way out of proportion to the tiny 2nd wave, and so this made it a “3”). Then we had a B wave, which retraced 62%, which is typical. The final wave down was unmistakably a C wave.
The wave leading up to the top was an ending wave of a set of motive waves that began in 1974. Ending waves are either in 5 waves or they’ll be a triangle of some sort (either a traditional fourth wave triangle, or a fifth wave ending diagonal).
Full Article: http://worldcyclesinstitute.com/impending-tops/
My post is awaiting moderation so I will try this… why??? … “Impending Tops” 1987
Full Article: http://worldcyclesinstitute.com/impending-tops/
Peter Temple has made two additional thought-provoking observations about the situation at Deutsche Bank.
First, that their capital ratio is less than 3% ( think Lehman).
Second, their derivative exposure, reportedly at 70T, is just about total global GDP.
Talk about the mother of all bailouts…
There will be NO more bail outs! TOO BIG to Bail Out!!!!
Funny how the Deutsche Bank financials have been swept under the rug! It is barely discussed or covered by the media.
That will be when you get interest rates exploding higher… because no sane person or institution will put up funds for that specific effort… nor will sovereign government’s be able to issue bonds to fund that effort! It’s the point where all will implode!!!
My bailout comment was wholly tongue in cheek!
How on earth would the German bankster class convince the rest of the world to pool all their resources to rescue DB??
Clearly it ain’t gonna happen, not in this life. The share price is going to zero, and you take that to the bank (not DB!)
Now here is the key point – if their exposure is truly that big, and I would not for a minute doubt that it could be underestimated, it means the ENTIRE financial sector is toast. And I don’t mean a light brown. I am talking crispy carbon black.
Can somebody tell me why in the hell equity markets are trading near to all time highs???!!! 🙂
ps. holding FAZ leaps and quietly waiting STHTF…
“Can somebody tell me why in the hell equity markets are trading near to all time highs???!!! :)”
I have been asking myself this question every single day for a very long time!
I can’t come up with an answer that is based in any form of reality!
It’s just pure magic!!!! Houdini is alive and well!!!
If (or rather when) DB fails, it takes Italy down and then the rest of Europe with it. All that ECB money spent on propping up their markets is cut in half. With that money down the drain there isn’t the money necessary to rescue the EU banking system. No recourse. That is why the crash will be so bad.
By the way, the extra “T” stands for “Totally!”
The fact is the DB derivative tentacles reach much farther than EU financial markets. That 70T ticking time bomb will have a blast radius that is literally global…!
Vern, Thanks for the Peter Temple articles. Fantastic.
Most welcome David!
All about Yen and Abe again. Helicopter money.
first?????