
Upwards movement to about 2,175 or a little above was expected for Friday’s session.
Price moved higher to reach 2,177.09.
Summary: Upwards movement next week to a target at 2,231 is expected. This is supported by a short term bullish volume profile and an upwards breakout by On Balance Volume. If the target is wrong though, it may be too high.
Last monthly chart for the main wave count is here.
New updates to this analysis are in bold.
MAIN WAVE COUNT
WEEKLY CHART
Click chart to enlarge.
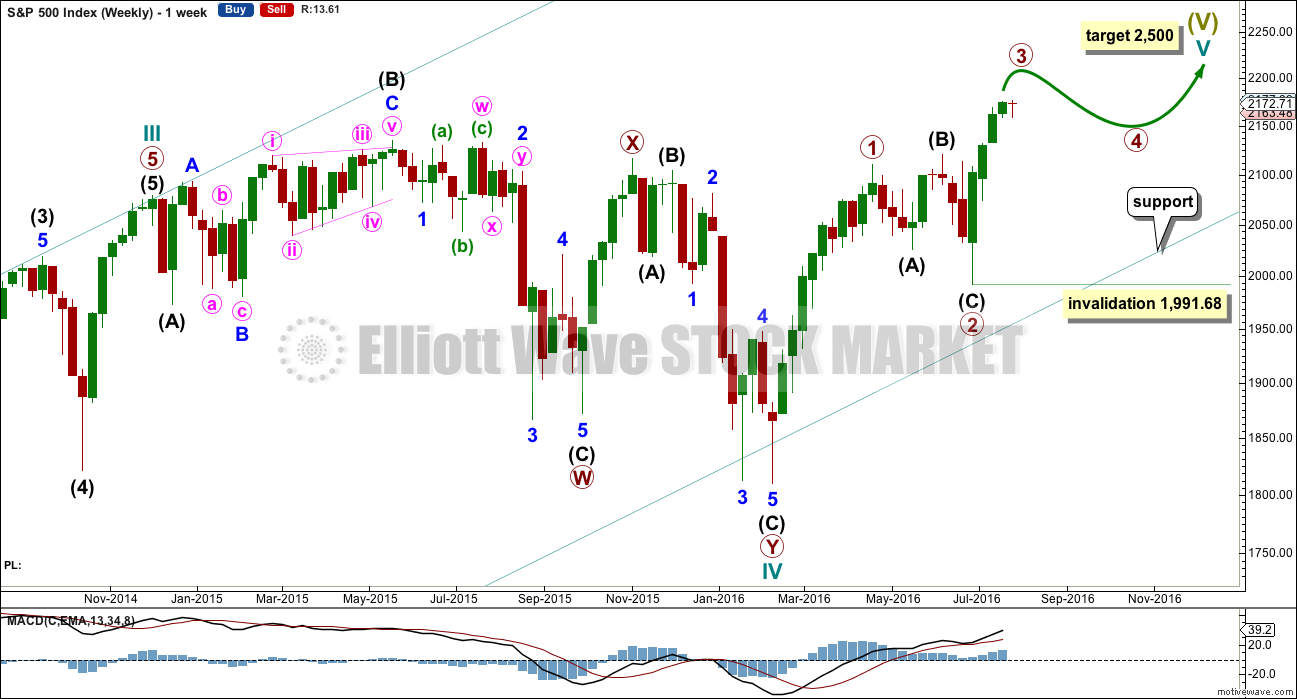
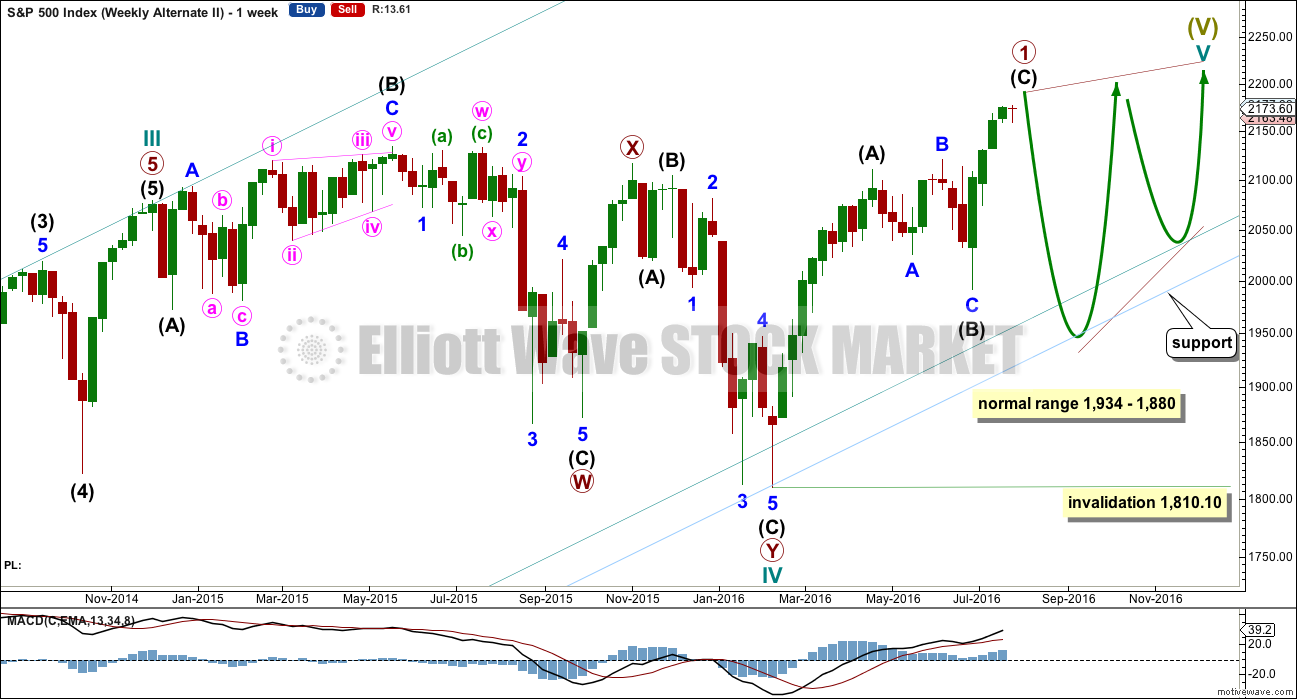
Cycle wave II was a shallow 0.41 zigzag lasting three months. Cycle wave IV is now seen as a more shallow 0.28 double combination lasting 15 months. With cycle wave IV five times the duration of cycle wave II, it should be over there.
Cycle wave I lasted 28 months (not a Fibonacci number), cycle wave II lasted a Fibonacci 3 months, cycle wave III lasted 38 months (not a Fibonacci number), and cycle wave IV lasted 15 months (two more than a Fibonacci 13).
If the target for cycle wave V is for it to be equal in length with cycle wave I, then it may also be expected to be about equal in duration. So far cycle wave V is in its fifth month. After this month, a further 23 months to total 28 seems a reasonable expectation, or possibly a further 16 months to total a Fibonacci 21.
This first weekly wave count expects the more common structure of an impulse is unfolding for cycle wave V. Within cycle wave V, primary waves 1 and now 2 should be over. Within primary wave 3, no second wave correction may move beyond its start below 1,991.68.
There is one other possible structure for cycle wave V, and ending diagonal. This is covered in an alternate.
DAILY CHART
Click chart to enlarge.
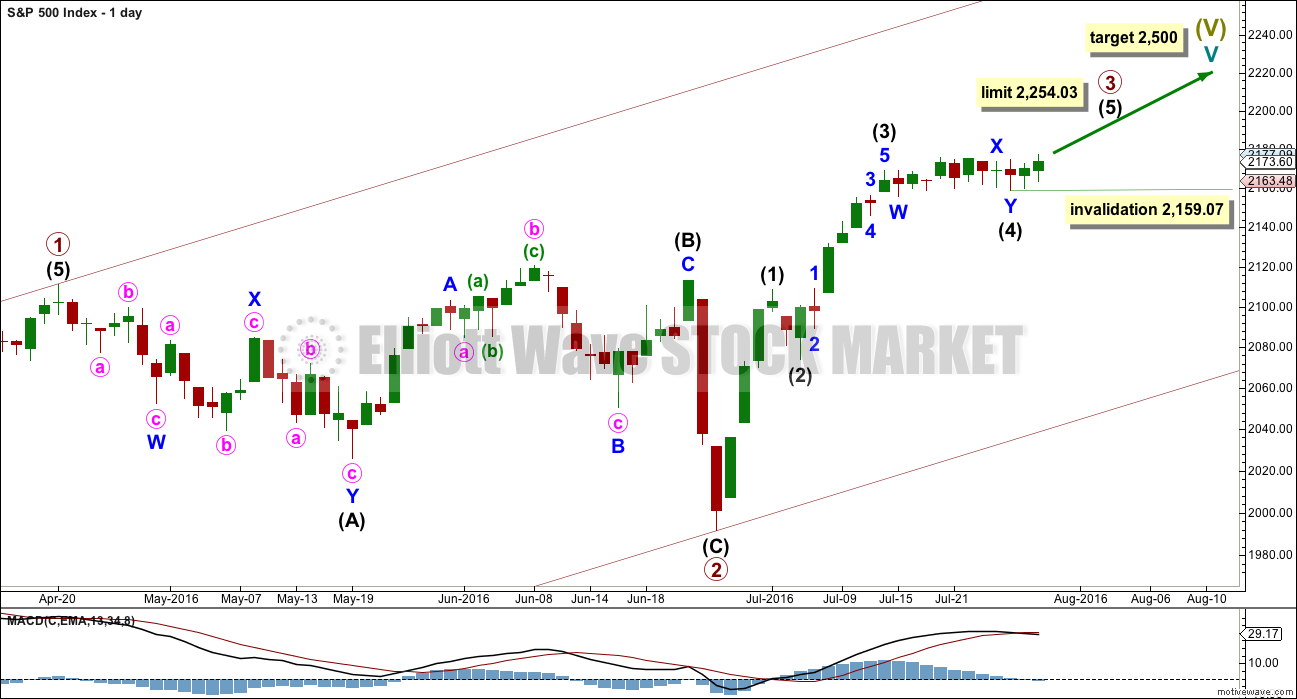
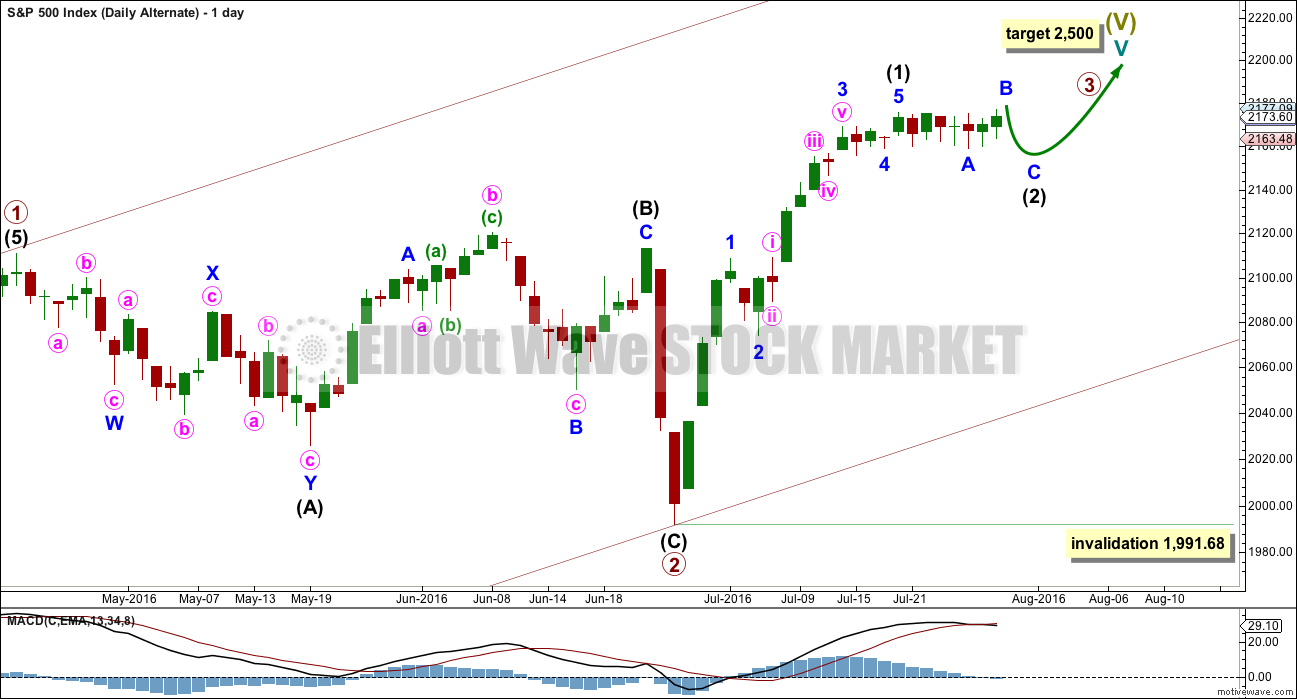
It is most likely that primary wave 2 is already complete as a shallow regular flat correction. Primary wave 3 is most likely underway.
A five wave impulse is almost complete within primary wave 3. This impulse may be primary wave 3 in its entirety, or the degree of labelling within primary wave 3 may all be moved down one degree and this may only be intermediate wave (1). The alternate looks at the possibility that a five wave impulse upwards for intermediate wave (1) only may be complete.
The labelling on the daily and hourly charts will consider primary wave 3 almost complete.
Intermediate wave (3) is shorter than intermediate wave (1) within the upwards impulse. Because a core Elliott wave rule states a third wave may not be the shortest actionary wave within an impulse, this limits intermediate wave (5) to no longer than equality in length with intermediate wave (3) at 2,254.03.
When primary wave 3 is complete, then the following correction for primary wave 4 may not move back down into primary wave 1 price territory below 2,111.05.
Within intermediate wave (5), no second wave correction may move beyond the start of its first wave below 2,159.07.
Intermediate wave (1) lasted four days, intermediate wave (2) was a quick zigzag over in just two days, and intermediate wave (3) may have been over in six days. Intermediate wave (4) may have lasted nine days. Intermediate wave (5) may be close to completion; so far it has lasted two days.
There are two possible structures for intermediate wave (5). The first hourly chart below looks at the more likely and more common impulse and the second idea looks at a less likely ending diagonal.
HOURLY CHART
Click chart to enlarge.
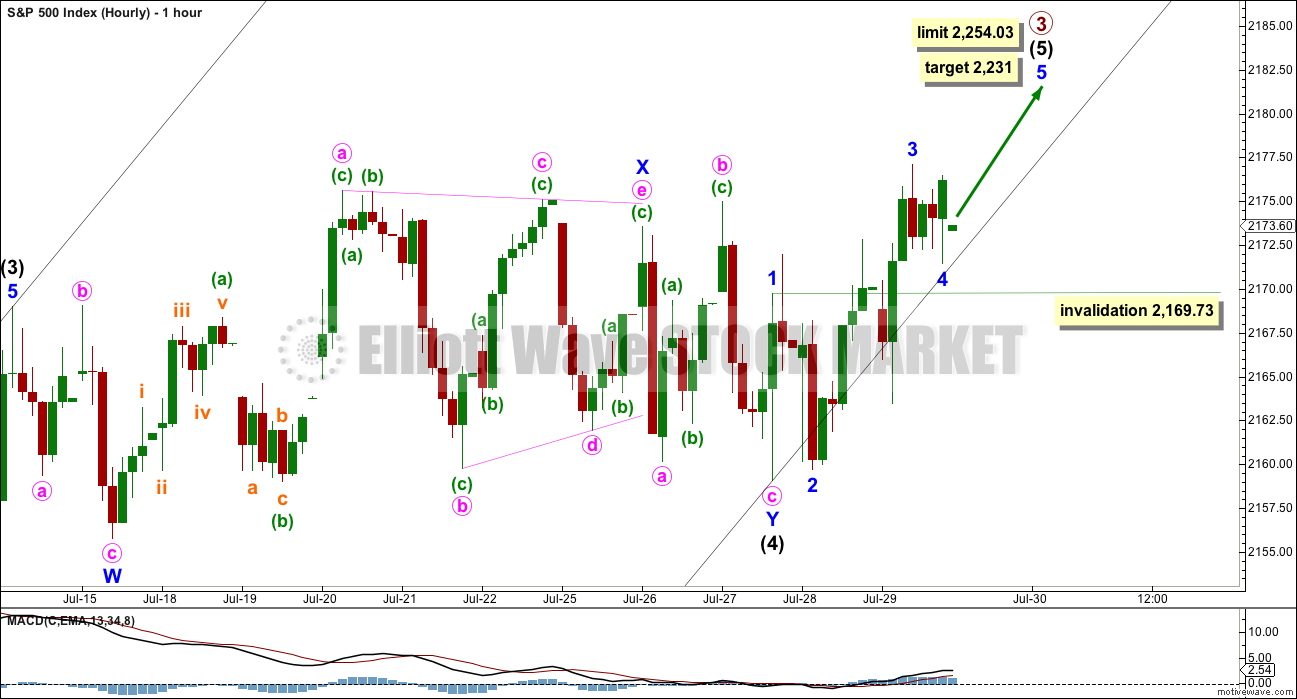
Intermediate wave (4) may be a complete double flat correction.
Intermediate wave (5) may have begun. The most likely structure would be an impulse.
Minor waves 1 through to 3 may be complete so far within this possible impulse. Minor wave 2 fits as an expanded flat and minor wave 4 fits as a zigzag. If minor wave 4 continues further, then it may not move into minor wave 1 price territory below 2,169.73.
Minor wave 3 fits as an impulse on the five minute chart, although it looks like a three wave structure on the hourly chart. Minor wave 3 is just 0.11 points short of 1.618 the length of minor wave 1.
If the target for intermediate wave (5) is wrong, it may be too high. At 2,231 intermediate wave (5) would reach 0.618 the length of intermediate wave (1).
HOURLY CHART II
Click chart to enlarge.
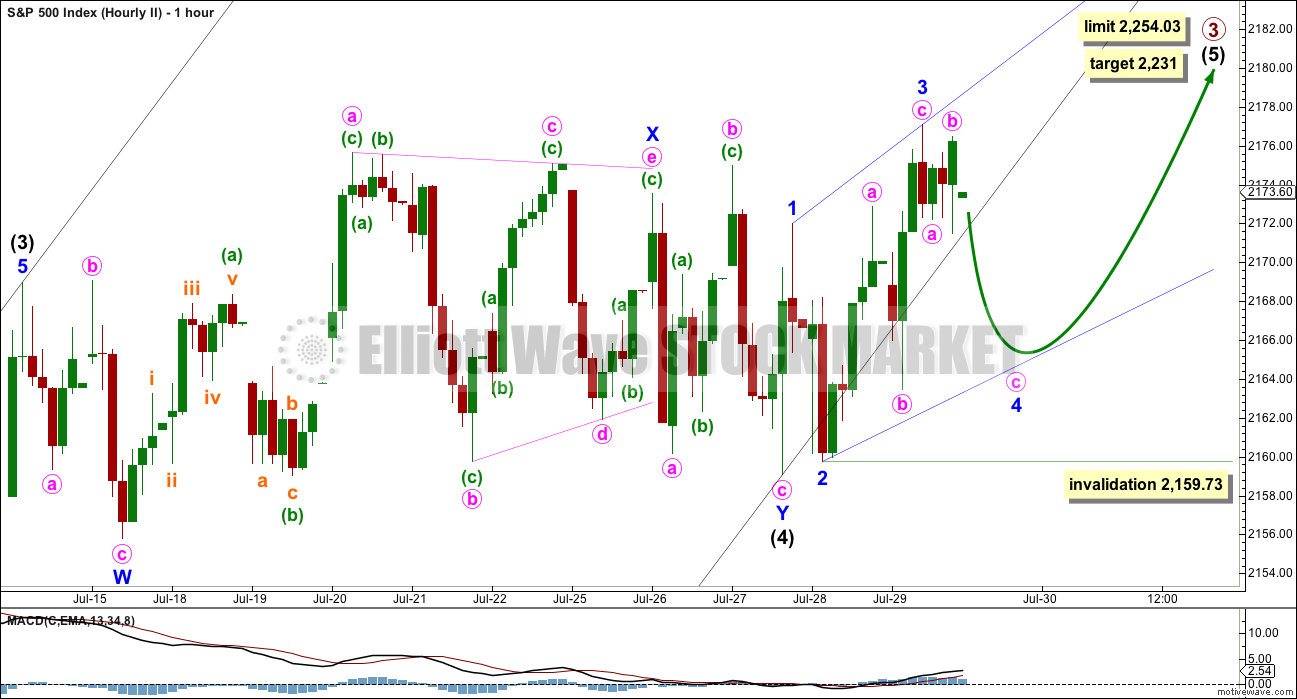
This hourly chart is identical to the first hourly chart up to the end of intermediate wave (4).
Thereafter, this idea looks at the other structural possibility for intermediate wave (5) of an ending diagonal.
The diagonal would be expanding because the third wave would be longer than the first wave. The fourth wave must be longer than the second wave, so it must move lower to at least slightly below 2,164.84. Minor wave 4 may not move beyond the end of minor wave 2 below 2,159.73.
Within an ending diagonal, all sub-waves must subdivide as zigzags. The fourth wave must overlap first wave price territory but may not move beyond the end of the second wave.
When minor wave 4 is complete, then minor wave 5 upwards must be longer than minor wave 3 which was 17.36 points.
While ending diagonals are reasonably common structures, expanding diagonals are less common. This slightly reduces the probability of this idea.
Price would need to breach the channel about primary wave 3 and still continue higher. This is possible; it is somewhat typical behaviour of the S&P.
DAILY CHART – ALTERNATE
Click chart to enlarge.
A five wave impulse upwards from the end of primary wave 2 can now be seen as complete on the hourly chart. This looks too short to be primary wave 3 in its entirety, so the degree of labelling within it is moved down one degree from the main wave count.
Within the impulse of primary wave 3, it may be only intermediate wave (1) now complete. Intermediate wave (2) may be underway.
Intermediate wave (2) may not move beyond the start of intermediate wave (1) below 1,991.68.
HOURLY CHART – ALTERNATE
Click chart to enlarge.
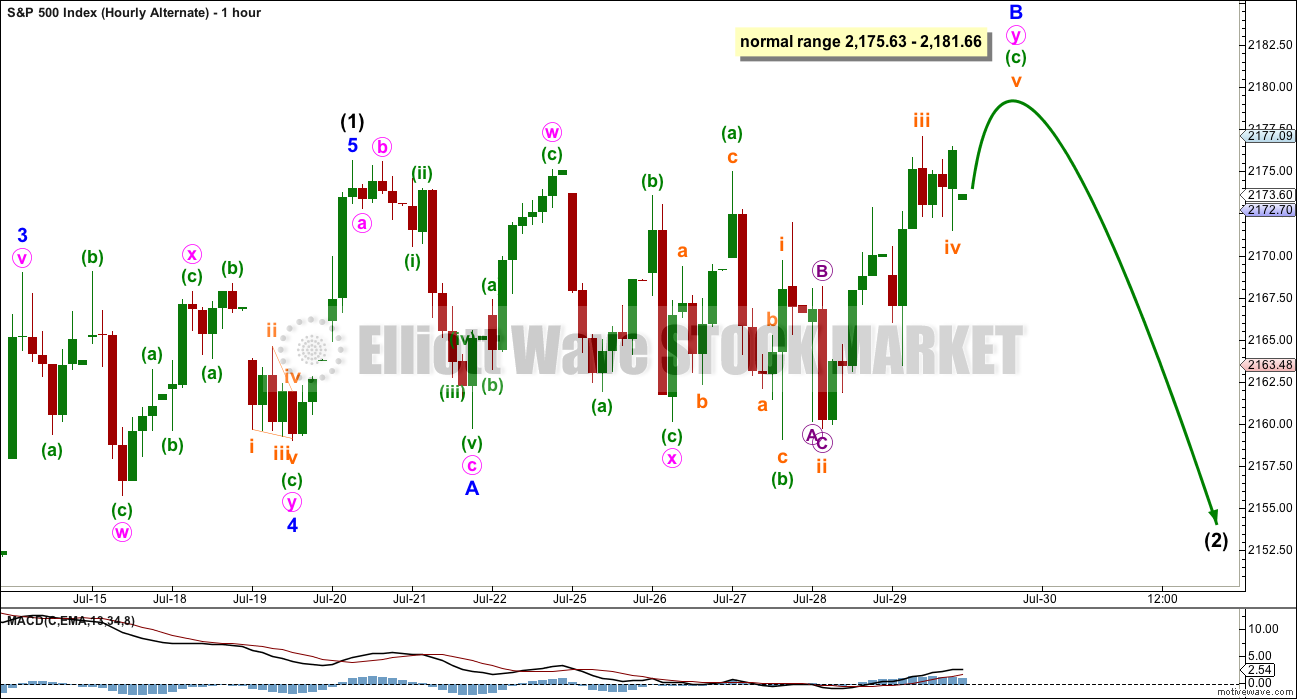
If intermediate wave (1) was over on 20th of July, then intermediate wave (2) begins there. The movement from the last high is very choppy and overlapping, and difficult to analyse.
The downwards wave labelled minor wave A looks best as a three wave zigzag. With a new high above its start, this view is confirmed as correct.
If minor wave A is a three, then minor wave B may make a new price extreme beyond the start of minor wave A at 2,175.63 as in an expanded flat correction.
Intermediate wave (2) may be a flat, and it may also be relabelled minor waves W-X-Y as a double combination.
Within minor wave B, so far the structure looks like a combination: zigzag – X – flat. Within the second structure in this double, labelled minute wave y, the downwards wave of minuette wave (b) is a 1.07 length of minuette wave (a) indicating the most common type of flat, an expanded flat. Both waves labelled minuette wave (a) and (b) are seen as threes.
Minuette wave (c) has now made a slight new high above the end of minuette wave (a) at 2,174.98 to avoid a truncation and a very rare running flat. Minuette wave (c) must subdivide as a five wave structure. That structure may be close to completion.
Within the possible larger flat of intermediate wave (2), the normal range for minor wave B is between 1 to 1.38 the length of minor wave A, giving a range of 2,175.63 to 2,181.66.
When minor wave B is a complete structure, then a target for minor wave C to end may be calculated. At this stage an expanded flat, the most common type, is now indicated because so far minor wave B has moved over 1.05 the length of minor wave A. Minor wave C would be very likely to make a new low below the end of minor wave A at 2,159.75 to avoid a truncation.
Overall, intermediate wave (2) may be a sideways structure and not a deep pullback.
ALTERNATE WAVE COUNT
WEEKLY CHART
Click chart to enlarge.
Cycle wave V may be unfolding as an ending diagonal. The most common type of diagonal by a reasonable margin is a contracting diagonal. When primary waves 1 and 2 are complete, then primary wave 3 would most likely be shorter than primary wave 1. If primary wave 3 were to be longer than primary wave 1, then the less common variety of an expanding diagonal would be indicated.
Within an ending diagonal, all the sub-waves must subdivide as zigzags and the fourth wave must overlap back into first wave price territory. The whole structure is choppy and overlapping with a gentle slope. The classic pattern equivalent is a rising wedge.
The zigzag of primary wave 1 upwards may now be complete as per labelling for the alternate daily wave count above in terms of seeing the impulse of intermediate wave (C) complete.
A target range for primary wave 2 may be calculated. It would most likely be between 0.66 to 0.81 the length of primary wave 1. This gives a range from 1,934 to 1,880. It may find support at a lower parallel copy of the channel about Super Cycle wave (V) copied over from the monthly chart.
Primary wave 2 may not move beyond the start of primary wave 1 below 1,810.10.
Ending diagonals have corrective characteristics as they subdivide into a series of zigzags. Ending diagonals contain uncertainty; the trend is unclear as they unfold due to the deep corrections of their second and fourth waves. They are terminal and doomed to full retracement. This may explain some persistent weakness to this upwards trend at this time. The final target at 2,500 for the main wave count would be far too optimistic if this alternate is correct and the diagonal is contracting.
Third waves of even diagonals should still be supported by volume and should still exhibit stronger momentum than the first wave.
For this alternate wave count, a deep pullback could very soon be expected for primary wave 2 to last several weeks. The final fifth wave up within intermediate wave (C) would need to complete first.
TECHNICAL ANALYSIS
WEEKLY CHART
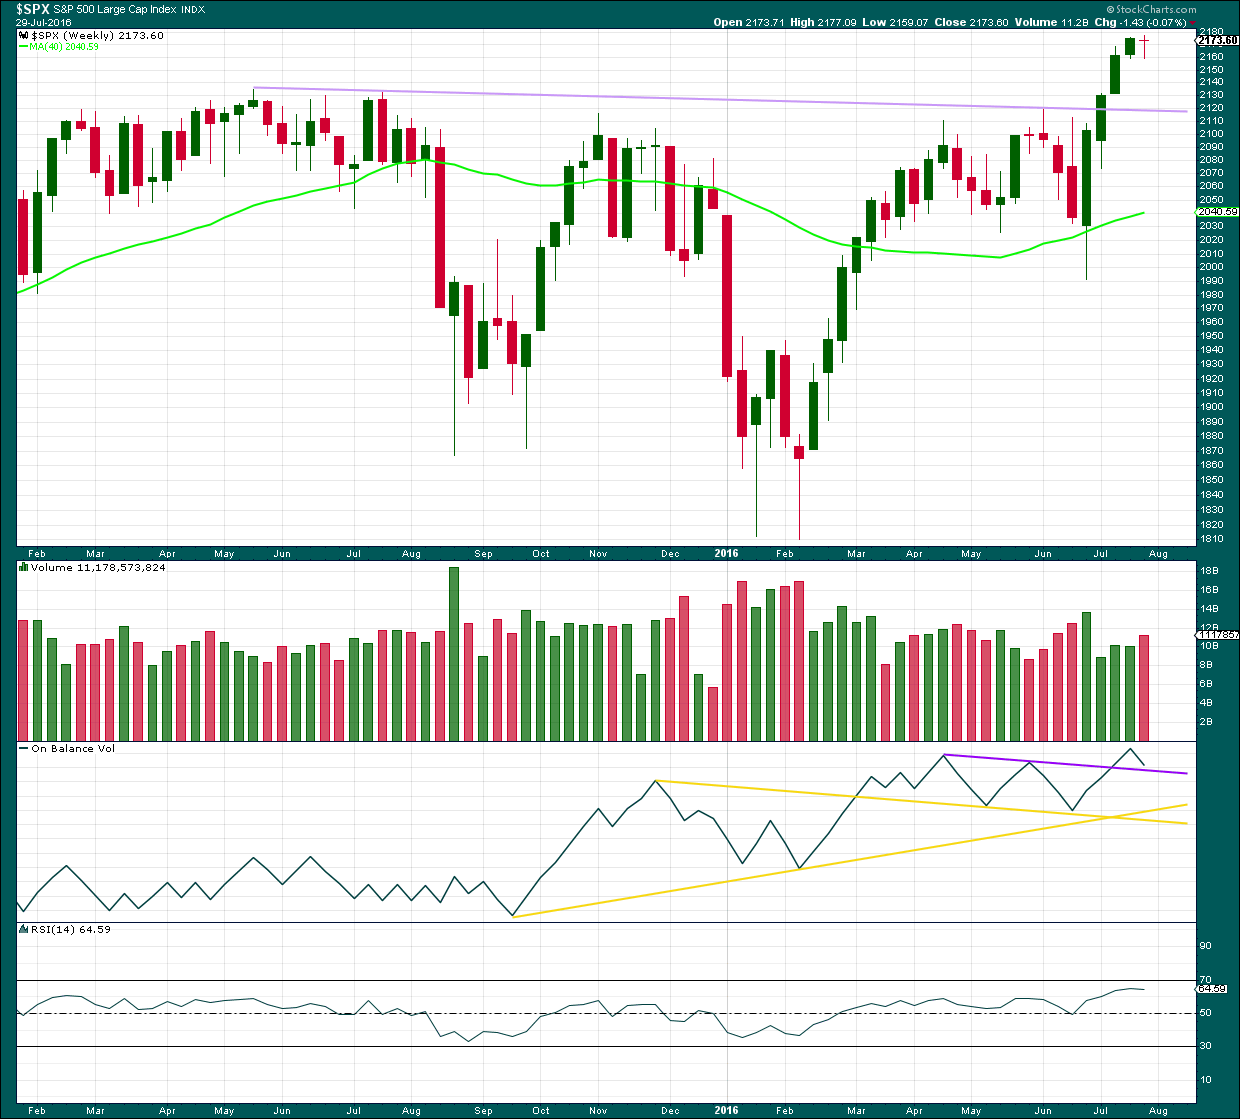
Click chart to enlarge. Chart courtesy of StockCharts.com.
Last week completed a stalled candlestick pattern. This indicated a trend change from up to either down or sideways. This week completed a small red doji, so the trend may have changed from up to sideways. It may still yet turn down.
The bearish implications of the stalled candlestick pattern may now be fulfilled, or more downwards / sideways movement may continue.
This week’s red doji comes with an increase in volume. This short term volume profile is slightly bearish. Only slightly because the candlestick is a doji and not a regular candlestick with a red body.
On Balance Volume has come down to almost touch the upper purple line. It may find support here. If this line is breached, then some support may be expected at the next trend line.
RSI is not extreme and is flattening off. There is still room for price to rise.
DAILY CHART
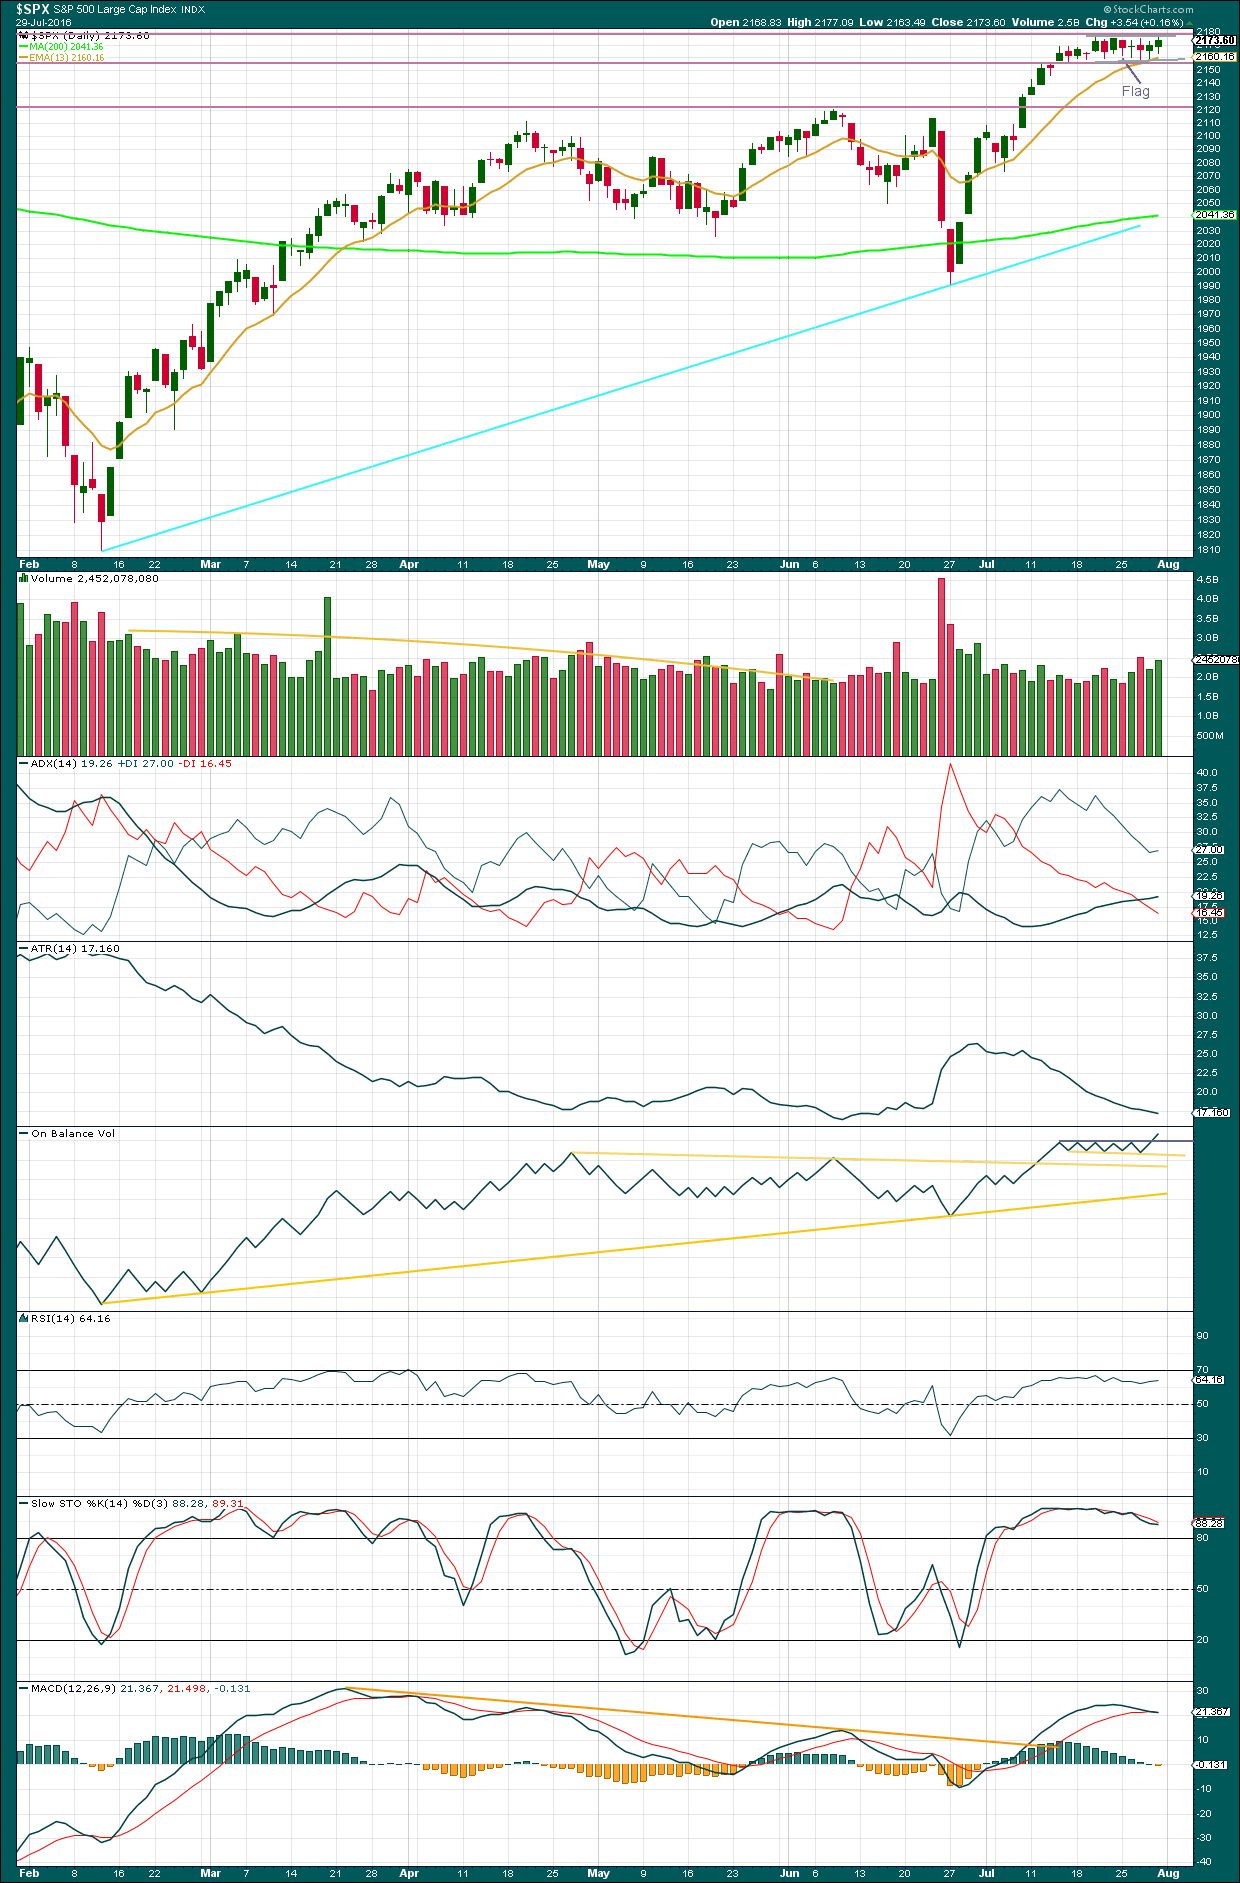
Click chart to enlarge. Chart courtesy of StockCharts.com.
Price remains constrained within a small consolidation, but today On Balance Volume may be indicating a breakout direction. OBV broke out of its corresponding consolidation upwards. The direction for price next week now looks most likely to be upwards.
The last session of upwards movement come with an increase in volume. However, this is still lighter than the last downwards session. During this consolidation, it is still a downwards day which has strongest volume suggesting a downwards breakout is more likely. However, this trick has recently been proven to not work at the weekly chart level, so it is approached with some suspicion at this time. More weight will be given to On Balance Volume.
ADX is above 15 and increasing. The +DX line is above the -DX line. ADX is indicating an upwards trend is in place.
ATR still disagrees as it is declining. There is something wrong with this trend. It does not look to be normal and healthy.
RSI is not yet overbought. There is room for price to rise further.
Stochastics is declining as price is rising but divergence is not currently working, so at this time this shall be given no weight at all. It will not be useful to assist in showing where this trend may end.
MACD is declining and may be about to indicate a trend change from up to down, but this too may not be reliable at this time.
At this time, the most reliable classic analysis still seems to be volume, short and mid term.
VOLATILITY – INVERTED VIX MONTHLY CHART
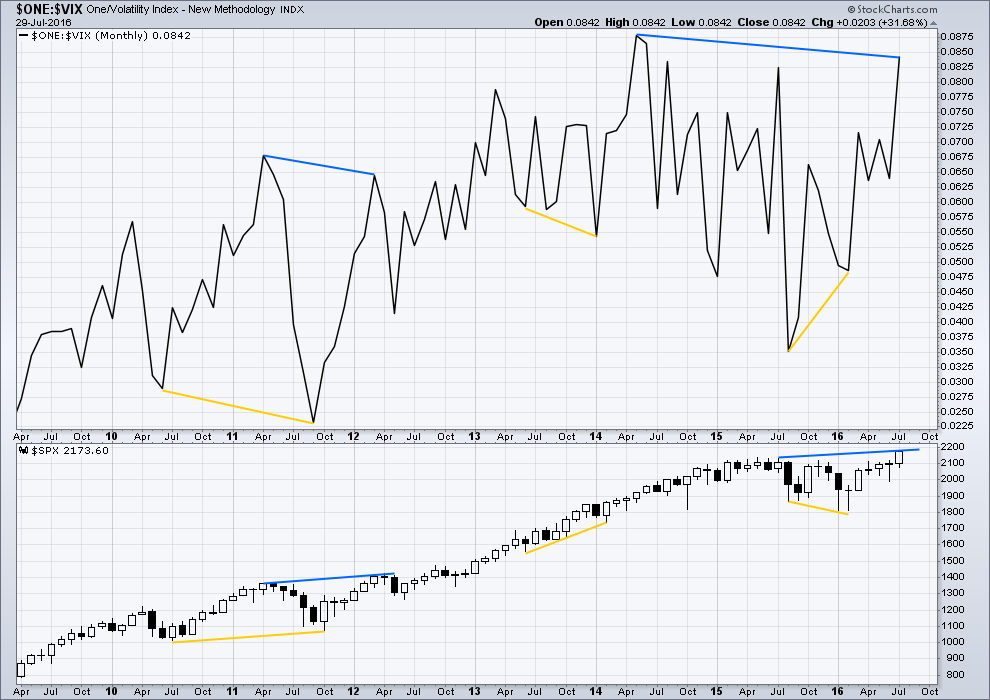
Click chart to enlarge. Chart courtesy of StockCharts.com.
VIX from StockCharts is inverted. As price moves higher, inverted VIX should also move higher indicating a decline in volatility which is normal as price moves higher. As price moves lower, inverted VIX should also move lower indicating an increase in volatility which is normal with falling price.
There is still strong multi month divergence with price and VIX. While price has moved to new all time highs, this has not come with a corresponding decline in volatility below the prior all time high at 2,134. This strong multi month divergence between price and VIX indicates that this rise in price is weak and is highly likely to be more than fully retraced. However, this does not tell us when and where price must turn; it is a warning only and can often be a rather early warning.
At this time, although divergence with price and VIX at the daily chart level has been recently proven to be unreliable (and so at this time will no longer be considered), I will continue to assume that divergence with price and VIX at the monthly chart level over longer time periods remains reliable until proven otherwise.
This supports the idea that price may be in a fifth wave up. Divergence between the end of a cycle degree wave III and a cycle degree wave V would be reasonable to see. Fifth waves are weaker than third waves. This strong divergence indicates that price targets may be too high and time expectations may be too long. However, it remains to be seen if this divergence will be reliable.
DOW THEORY
Major lows within the prior bull market:
DJIA: 15,855.12 (15th October, 2014) – closed below on 25th August, 2015.
DJT: 7,700.49 (12th October, 2014) – closed below on 24th August, 2015.
S&P500: 1,821.61 (15th October, 2014) – has not closed below this point yet.
Nasdaq: 4,117.84 (15th October, 2014) – has not closed below this point yet.
Major highs within the new bear market:
DJIA: 17,977.85 (4th November, 2015) – closed above on 18th April, 2016.
DJT: 8,358.20 (20th November, 2015) – has not closed above this point yet.
S&P500: 2,116.48 (3rd Nobember, 2015) – has now closed above this point on 8th June, 2016.
Nasdaq: 5,176.77 (2nd December, 2015) – has not closed above this point yet.
Dow Theory Conclusion: Original Dow Theory still sees price in a bear market because the transportations have failed to confirm an end to that bear market. Modified Dow Theory (adding S&P and Nasdaq) has failed still to confirm an end to the old bull market, modified Dow Theory sees price still in a bull market.
This analysis is published @ 05:31 p.m. EST on 30th July, 2016.
The short ending diagonal on hourly II looks correct so far. Minor 4 down can’t yet be done though, it needs to be longer than minor 3. It has to move below 2,166.04.
Normal range for minor 4 would be between 0.66 to 0.81 of minor 3; that’s 2,166.04 to 2,163.26.
oops… it would help if I put a chart up wouldn’t it!
I think minute wave a of minor 3 may be a leading expanding diagonal
Lara, quick question:
so your target of 2231 still holds on SPX or you now think it will be 2182 ish based on your latest chart?
I think it’s more likely to be about 2,182ish now.
2,231 looks too high for an ending diagonal.
thank you!
Lara,
I am confused by your above comments: “Minor 4 needs to be longer than Minor 3”, and “Minor 4 would be between 0.66 to 0.81 of Minor 3”.
I am wondering if you mean Minor 4 will be longer or smaller than Minor 3.
sorry! minor 4 needs to be longer than minor 2.
not minor 3
Vern,
I agree with your analysis of Parabolic move higher. I thank Lara for pointing us in that direction with constantly having the alternative bull count and 2500 target. The reason this market goes higher is that this is one of the most hated rallies. No exuberance yet. Further more, most expect that we will have a fiscal stimulus (whether we get Hillary or Trump). Sure we will have some corrections on the way but end of the year will be lot higher than where it is today. However really (more than 2 yrs) long term — we will have a day of reckoning. But not yet.
Yes Sunny-it is one of the things I have always deeply appreciated about Lara’s approach to EW analysis, and that is her unflinching objectivity. I know it was really hard for a lot us to change our perspective when the market turned around and headed higher contrary to all the bearish evidence. It was a great reminder not to underestimate the central banks. I am leaning toward the ending diagonal possibility and am thinking we will see a top closer to 2300 than 2500. The unfolding zig zags will be quite effective in keeping both bear and bull off-balance.
thanks guys!
I’ve been kicking myself for not having a clear trading plan in the event of a new ATH after 2,134.
What I should have done is not only close shorts (stopped out) I should have immediately opened longs. That would have been a great plan, and objective.
Oh well. We live and learn.
I went back and took another look at a few PM charts after starting to read Lara’s GOLD analysis and saw something really interesting in quite a few silver charts. It is one of the few assets that seems to have the ability to penetrate its upper BB and remain above, or closely pinned to the upper band for an extended period of time. Assuming an upper BB penetration is necessarily about to lead to a decline in price would be quite a mistake. I think this may be the same kind of error EWI is making by telling its readers the extreme COT data must be interpreted as being bearish.
You know this market is strange when we break out of a 13 day sideways pattern and can’t hold it. Another technical pattern that is failing.
A contrarian signal or…
“”SELL EVERYTHING!”
That’s what Jeff Gundlach of DoubleLine Capital is telling people this morning as he said many asset classes look frothy and his firm is hanging onto gold to hedge their cash, saying:
“The artist Christopher Wool has a word painting, ‘Sell the house, sell the car, sell the kids.’ Thats exactly how I feel sell everything. Nothing here looks good, Gundlach said in a telephone interview. “The stock markets should be down massively but investors seem to have been hypnotized that nothing can go wrong.”
Well, halfway through summer vacation, he had me at “sell the kids!” Gundlach is not alone, however. Now Goldman Sach’s (NYSE:GS) Christian Mueller-Glissmann has gone outright bearish, with a “tactical downgrade to equities for the next 3 months.” Here is the reasoning behind Goldman’s creeping sense of gloom…”
Philip Davis on SeekingAlpha
http://seekingalpha.com/article/3994103-just-another-manic-monday?app=1&uprof=44&isDirectRoadblock=false
Dan Ferris of Stansberry Research agrees and cites two important metrics that gauge future returns in equities, and both are now saying market (SPX) is overvalued. The first is P/E ratio is now at 24 versus a historical average of 16, and the ratio of market value to the nation’s GDP is around 140%. He considers anything over 100% to be an over-evaluation. This all seems to point to a very short fifth wave up according to the EW count.
Great to have you back Rod and Joe! I really missed you both.
Collins sent an interesting chart of the 17 Month MA that shows it so far holding a three months buy signal. Although this double reversal is unprecedented, he is now long term bullish.
So many cross-currents flowing these days. The COT data had me convinced that PM were due for a big pullback in a possible C wave down (the guys at EWI have been adamantly insisting on it for weeks now.) Then I started to follow Lara’s GOLD analysis and she has totally changed my thinking with her typically stellar chart work. Many other folk in the know in the PM arena are saying that we are on the threshold of a possible parabolic move higher. I think they are right.
Yes, Verne, the COT data throws a lot of people off. It only seems to work well as a predictor in LT bear markets. If you look at the historical data, the commercials are often wildly short just before a big rise when you are in a LT bull market.
A better predictor of gold is the dollar index. Gold tends to be strongly inversely correlated to it. And it you look at the UUP chart, you can see that the index is looking sickly lately–a big plus for gold. However, what is even more interesting is that gold has often been moving up even on days when the dollar is up. That’s a hint that something big is happening. Its really looking like a major opportunity is upon us.
Interesting Thomas that you mention the comparative moves of Gold and the dollar.
During the Brexit brouhaha the were both atypcially moving in tandem. It will be interesting to see if that starts happening again.
Back from vacation…. 2nd… 1987!
Me too! Welcome back Joe.
And in the spirit of full disclosure, I have been long the RUT for a two weeks.
Good to see you back, it’s been quiet around here!
Welcome back guys!
WooHoo! First 🙂