
Upwards movement was expected for Thursday’s session.
Overall, price moved higher to print a green daily candlestick.
Summary: In the short term, an upwards swing should take price back up to about 2,175 or a little above. Thereafter, the wave counts diverge. Volume analysis favours the alternate daily and alternate weekly. A new low now below 2,159.73 would be strong indication of a deeper pullback possibly beginning. At this stage, although the wave counts are labelled “main” and “alternate”, all three ideas have about an even probability. The direction of price when it breaks out of the consolidation should indicate which wave count is correct.
Last monthly chart for the main wave count is here.
New updates to this analysis are in bold.
MAIN WAVE COUNT
WEEKLY CHART
Click chart to enlarge.
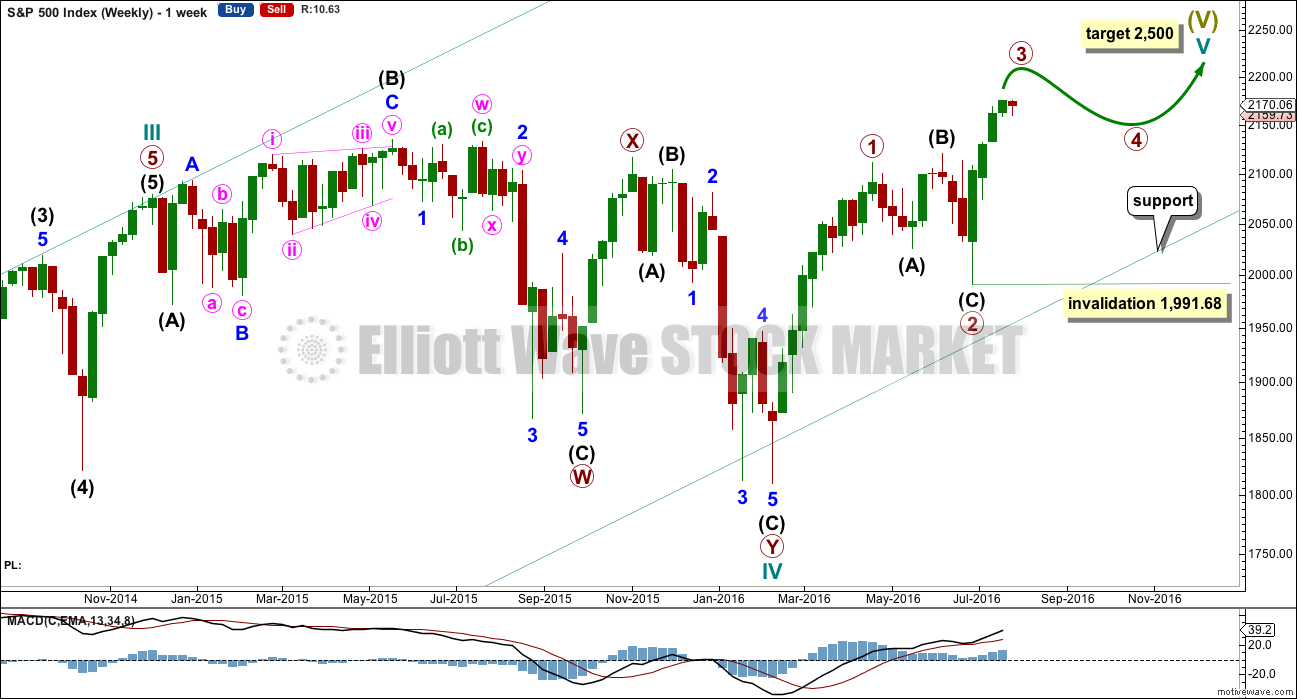
Cycle wave II was a shallow 0.41 zigzag lasting three months. Cycle wave IV is now seen as a more shallow 0.28 double combination lasting 15 months. With cycle wave IV five times the duration of cycle wave II, it should be over there.
Cycle wave I lasted 28 months (not a Fibonacci number), cycle wave II lasted a Fibonacci 3 months, cycle wave III lasted 38 months (not a Fibonacci number), and cycle wave IV lasted 15 months (two more than a Fibonacci 13).
If the target for cycle wave V is for it to be equal in length with cycle wave I, then it may also be expected to be about equal in duration. So far cycle wave V is in its fifth month. After this month, a further 23 months to total 28 seems a reasonable expectation, or possibly a further 16 months to total a Fibonacci 21.
This first weekly wave count expects the more common structure of an impulse is unfolding for cycle wave V. Within cycle wave V, primary waves 1 and now 2 should be over. Within primary wave 3, no second wave correction may move beyond its start below 1,991.68.
There is one other possible structure for cycle wave V, and ending diagonal. This is covered in an alternate.
DAILY CHART
Click chart to enlarge.
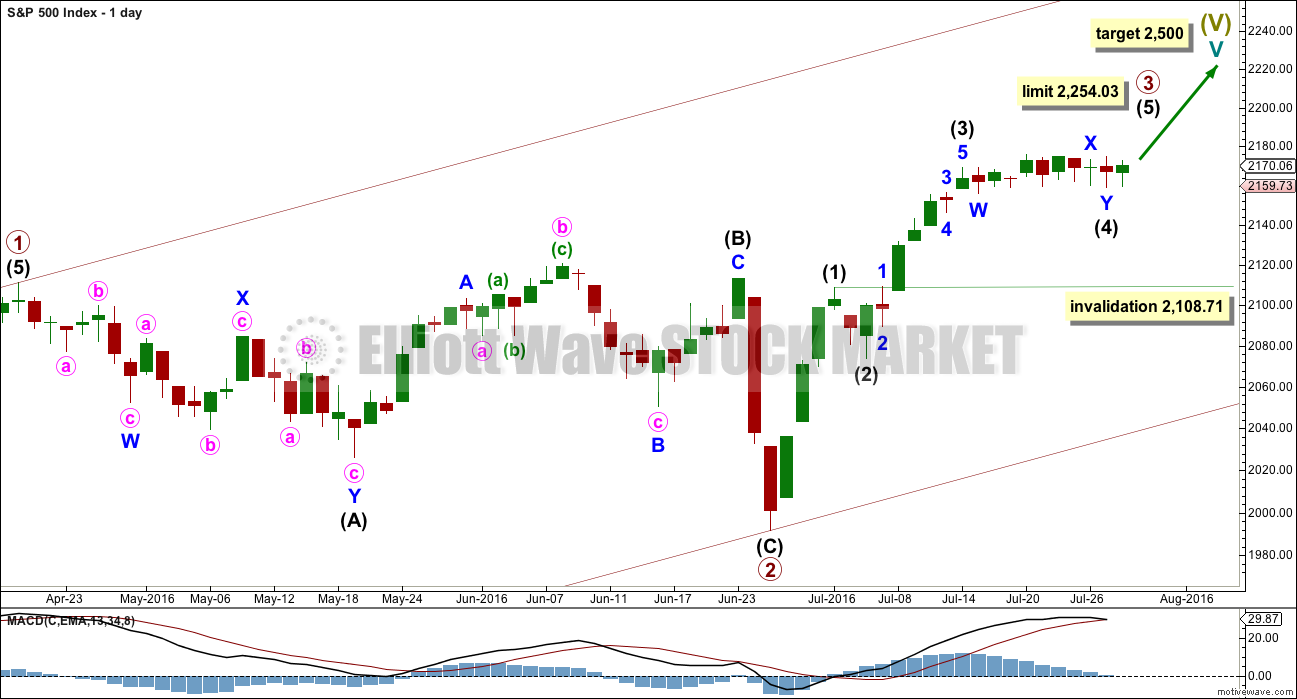
It is most likely that primary wave 2 is already complete as a shallow regular flat correction. Primary wave 3 is most likely underway.
A five wave impulse is almost complete within primary wave 3. This impulse may be primary wave 3 in its entirety, or the degree of labelling within primary wave 3 may all be moved down one degree and this may only be intermediate wave (1). The alternate looks at the possibility that a five wave impulse upwards for intermediate wave (1) only may be complete.
The labelling on the daily and hourly charts will consider primary wave 3 almost complete.
Intermediate wave (3) is shorter than intermediate wave (1) within the upwards impulse. Because a core Elliott wave rule states a third wave may not be the shortest actionary wave within an impulse, this limits intermediate wave (5) to no longer than equality in length with intermediate wave (3) at 2,254.03.
When primary wave 3 is complete, then the following correction for primary wave 4 may not move back down into primary wave 1 price territory below 2,111.05.
Intermediate wave (4) may not move into intermediate wave (1) price territory below 2,108.71.
Intermediate wave (1) lasted four days, intermediate wave (2) was a quick zigzag over in just two days, and intermediate wave (3) may have been over in six days.
HOURLY CHART
Click chart to enlarge.
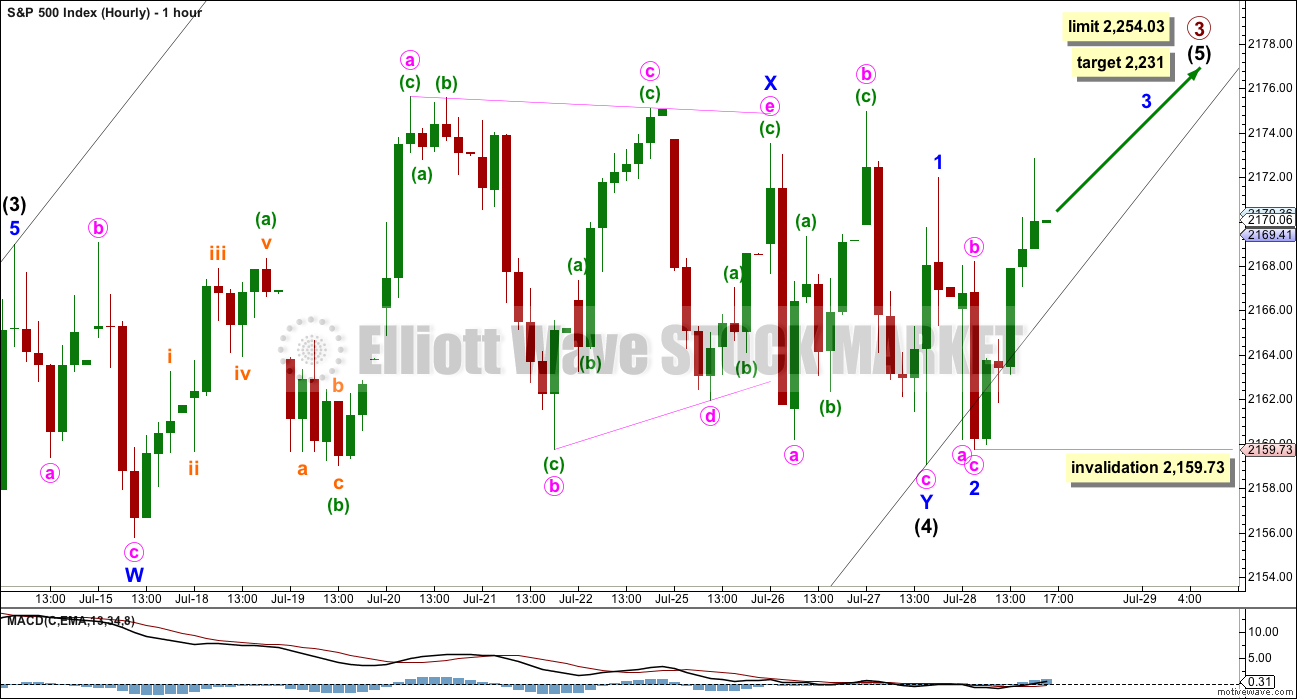
Intermediate wave (4) may be a complete double flat correction.
Within the double flat, the first flat is a regular flat labelled minor wave W. The double is joined by a three in the opposite direction, a regular contracting triangle labelled minor wave X. The second flat in the double may be a completed expanded flat labelled minor wave Y. There is alternation between the two types of flats: one is regular and the other expanded.
This wave count has to see the downwards wave labelled minute wave c of minor wave Y as a five wave impulse. This does not fit well on the five minute chart; this movement looks more like a three wave structure. This reduces the probability of this main wave count, so the alternate must be taken seriously.
If intermediate wave (4) is now complete, then intermediate wave (5) should move higher for a few days. Within intermediate wave (5), minor waves 1 and 2 may now be complete. Within minor wave 3, no second wave correction may move beyond its start below 2,159.73.
Intermediate wave (3) was shorter than intermediate wave (1) and it may not be the shortest, so intermediate wave (5) has a limit of no longer than equality in length with intermediate wave (3) at 2,254.03.
At 2,231 intermediate wave (5) would reach 0.618 the length of intermediate wave (1).
Intermediate wave (5) may be expected to last a few days. A Fibonacci five or eight would be the first expectation. So far it has only completed one daily candlestick.
This main wave count expects that the S&P will break out of the consolidation it has been in for eleven days now to the upside, but this view is not supported by volume. However, volume during consolidations has not been a reliable indicator of breakout direction recently. Although volume does not favour this main wave count, it must still be seriously considered.
DAILY CHART – ALTERNATE
Click chart to enlarge.
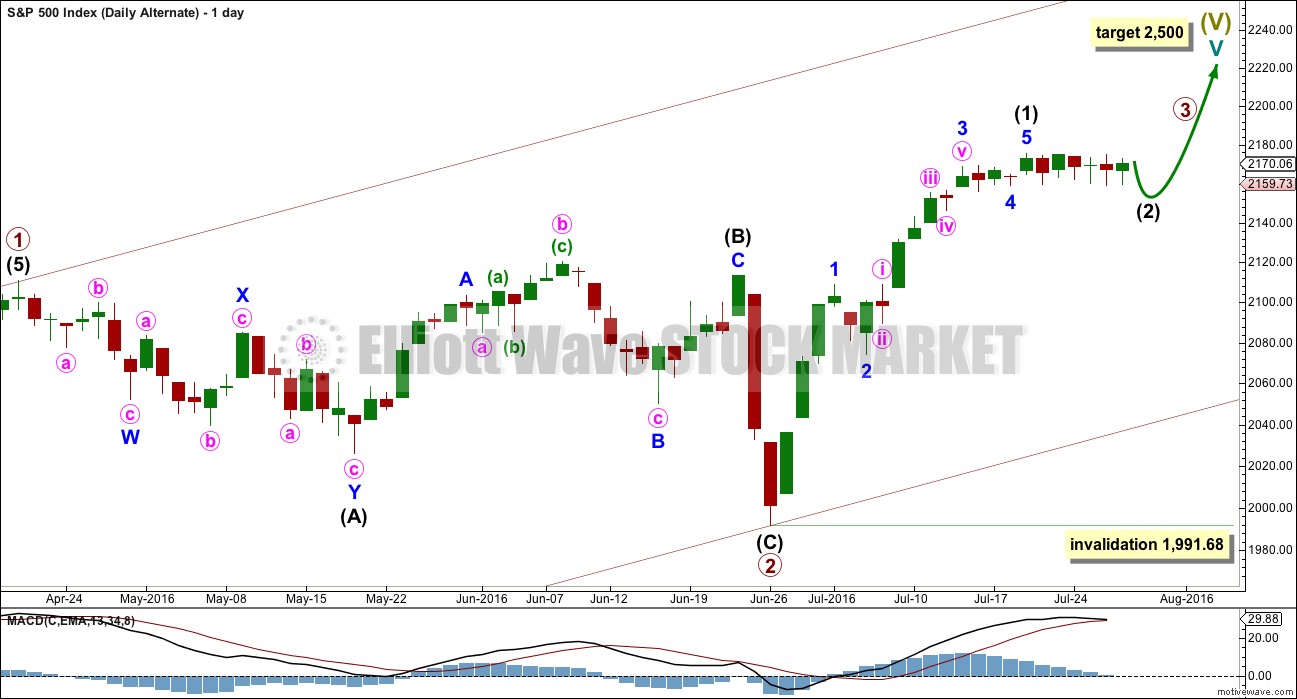
A five wave impulse upwards from the end of primary wave 2 can now be seen as complete on the hourly chart. This looks too short to be primary wave 3 in its entirety, so the degree of labelling within it is moved down one degree from the main wave count.
Within the impulse of primary wave 3, it may be only intermediate wave (1) now complete. Intermediate wave (2) may be underway.
Intermediate wave (2) may not move beyond the start of intermediate wave (1) below 1,991.68.
HOURLY CHART – ALTERNATE
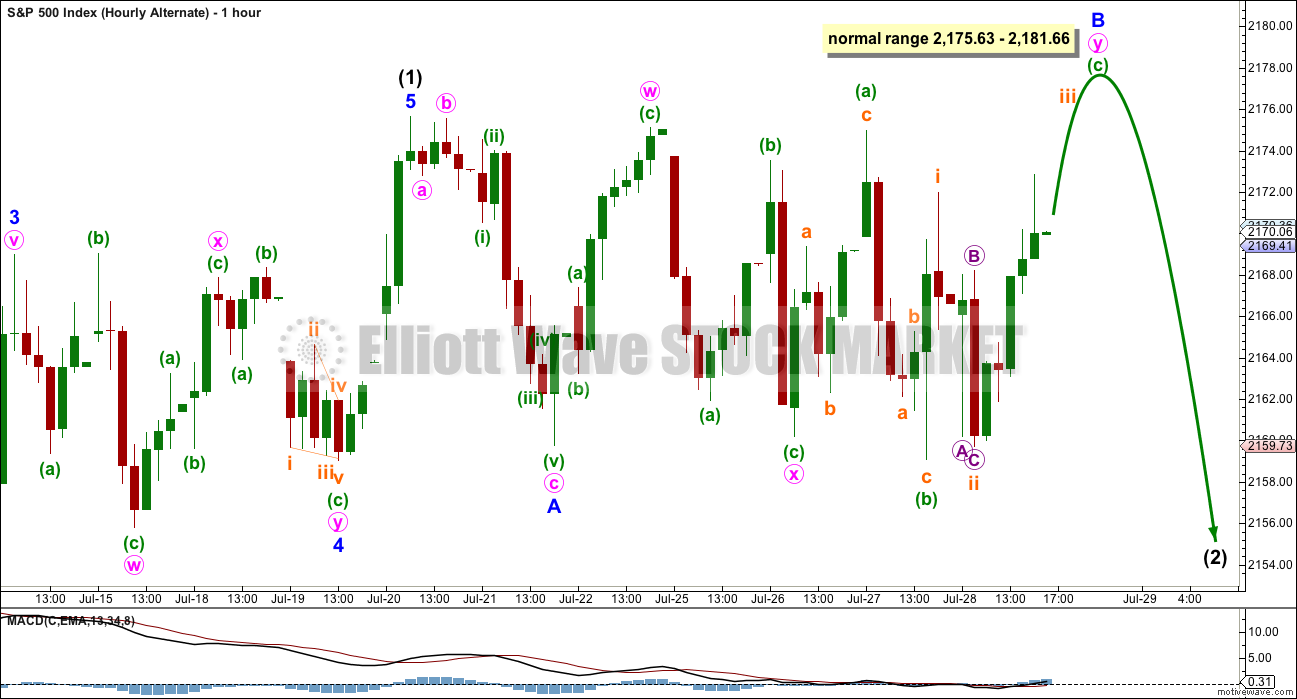
Click chart to enlarge.
If intermediate wave (1) was over at the last high, then intermediate wave (2) begins there. The movement from the last high is very choppy and overlapping, and difficult to analyse. So far this alternate has a better fit in terms of subdivisions of these overlapping waves than the main wave count does.
The downwards wave labelled minor wave A looks best as a three wave zigzag, but it may also be a five wave impulse.
If minor wave A is a three, then minor wave B may make a new price extreme beyond the start of minor wave A at 2,175.63 as in an expanded flat correction.
Intermediate wave (2) may be a flat, and it may also be relabelled minor waves W-X-Y as a double combination.
Within minor wave B, so far the structure looks like a combination: zigzag – X – flat. Within the second structure in this double, labelled minute wave y, the downwards wave of minuette wave (b) is a 1.07 length of minuette wave (a) indicating the most common type of flat, an expanded flat. Both waves labelled minuette wave (a) and (b) are seen as threes.
Minuette wave (c) would be very likely to make at least a slight new high above the end of minuette wave (a) at 2,174.98 to avoid a truncation and a very rare running flat. Minuette wave (c) must subdivide as a five wave structure.
Within the possible larger flat of intermediate wave (2), the normal range for minor wave B is between 1 to 1.38 the length of minor wave A, giving a range of 2,175.63 to 2,181.66.
When minor wave B is a complete structure, then a target for minor wave C to end may be calculated and the type of flat may be known. That cannot be determined yet. Minor wave C would be very likely to make a new low below the end of minor wave A at 2,159.75 to avoid a truncation.
Overall, intermediate wave (2) may be a sideways structure and not a deep pullback.
ALTERNATE WAVE COUNT
WEEKLY CHART
Click chart to enlarge.
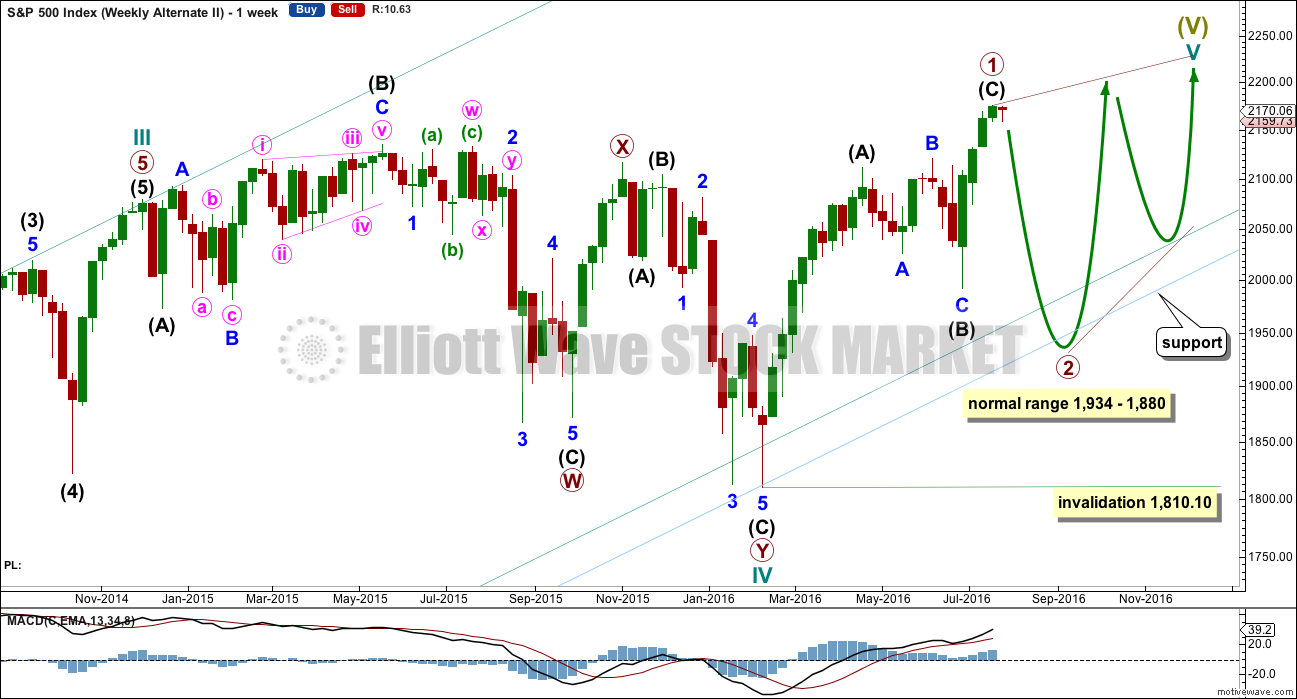
Cycle wave V may be unfolding as an ending diagonal. The most common type of diagonal by a reasonable margin is a contracting diagonal. When primary waves 1 and 2 are complete, then primary wave 3 would most likely be shorter than primary wave 1. If primary wave 3 were to be longer than primary wave 1, then the less common variety of an expanding diagonal would be indicated.
Within an ending diagonal, all the sub-waves must subdivide as zigzags and the fourth wave must overlap back into first wave price territory. The whole structure is choppy and overlapping with a gentle slope. The classic pattern equivalent is a rising wedge.
The zigzag of primary wave 1 upwards may now be complete as per labelling for the alternate daily wave count above in terms of seeing the impulse of intermediate wave (C) complete.
A target range for primary wave 2 may be calculated. It would most likely be between 0.66 to 0.81 the length of primary wave 1. This gives a range from 1,934 to 1,880. It may find support at a lower parallel copy of the channel about Super Cycle wave (V) copied over from the monthly chart.
Primary wave 2 may not move beyond the start of primary wave 1 below 1,810.10.
Ending diagonals have corrective characteristics as they subdivide into a series of zigzags. Ending diagonals contain uncertainty; the trend is unclear as they unfold due to the deep corrections of their second and fourth waves. They are terminal and doomed to full retracement. This may explain some persistent weakness to this upwards trend at this time. The final target at 2,500 for the main wave count would be far too optimistic if this alternate is correct and the diagonal is contracting.
Third waves of even diagonals should still be supported by volume and should still exhibit stronger momentum than the first wave.
For this alternate wave count, a deep pullback could now be expected for primary wave 2 to last several weeks.
TECHNICAL ANALYSIS
WEEKLY CHART
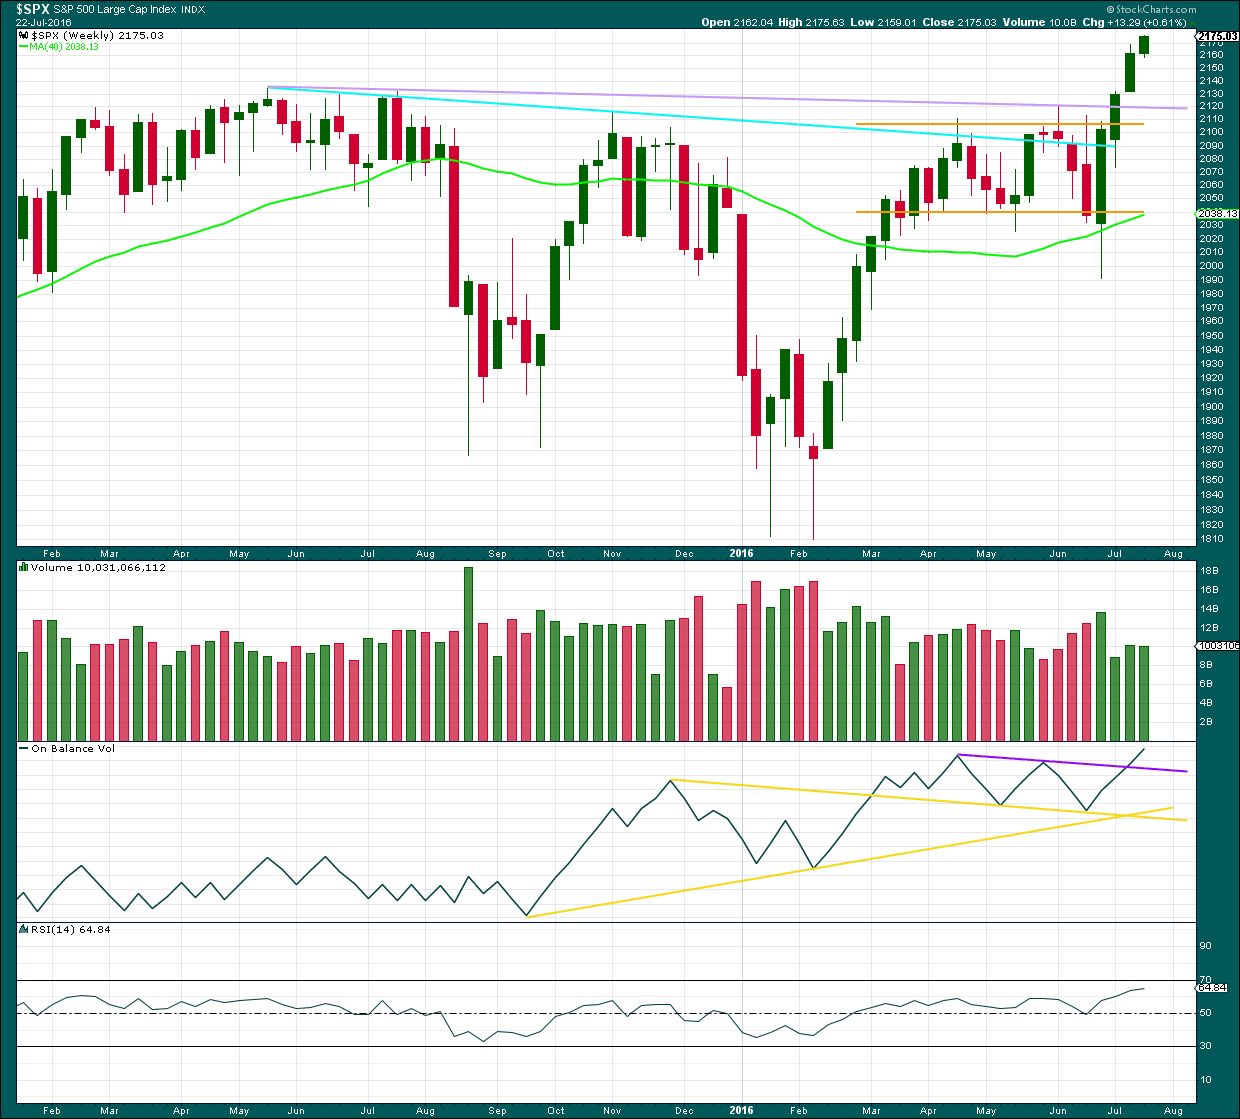
Click chart to enlarge. Chart courtesy of StockCharts.com.
At the end of last week, another green weekly candlestick completes with a slight decline in volume. The last three weekly candlestick patterns now complete a stalled pattern. This is a bearish reversal pattern, so some caution about this upwards trend is warranted. A trend change to either sideways or down may occur here.
On Balance Volume is still bullish at the weekly chart level. If OBV turns down and breaks below the purple line, that would be a bearish signal.
RSI is not yet overbought at the weekly chart level. There is still room for price to rise.
DAILY CHART
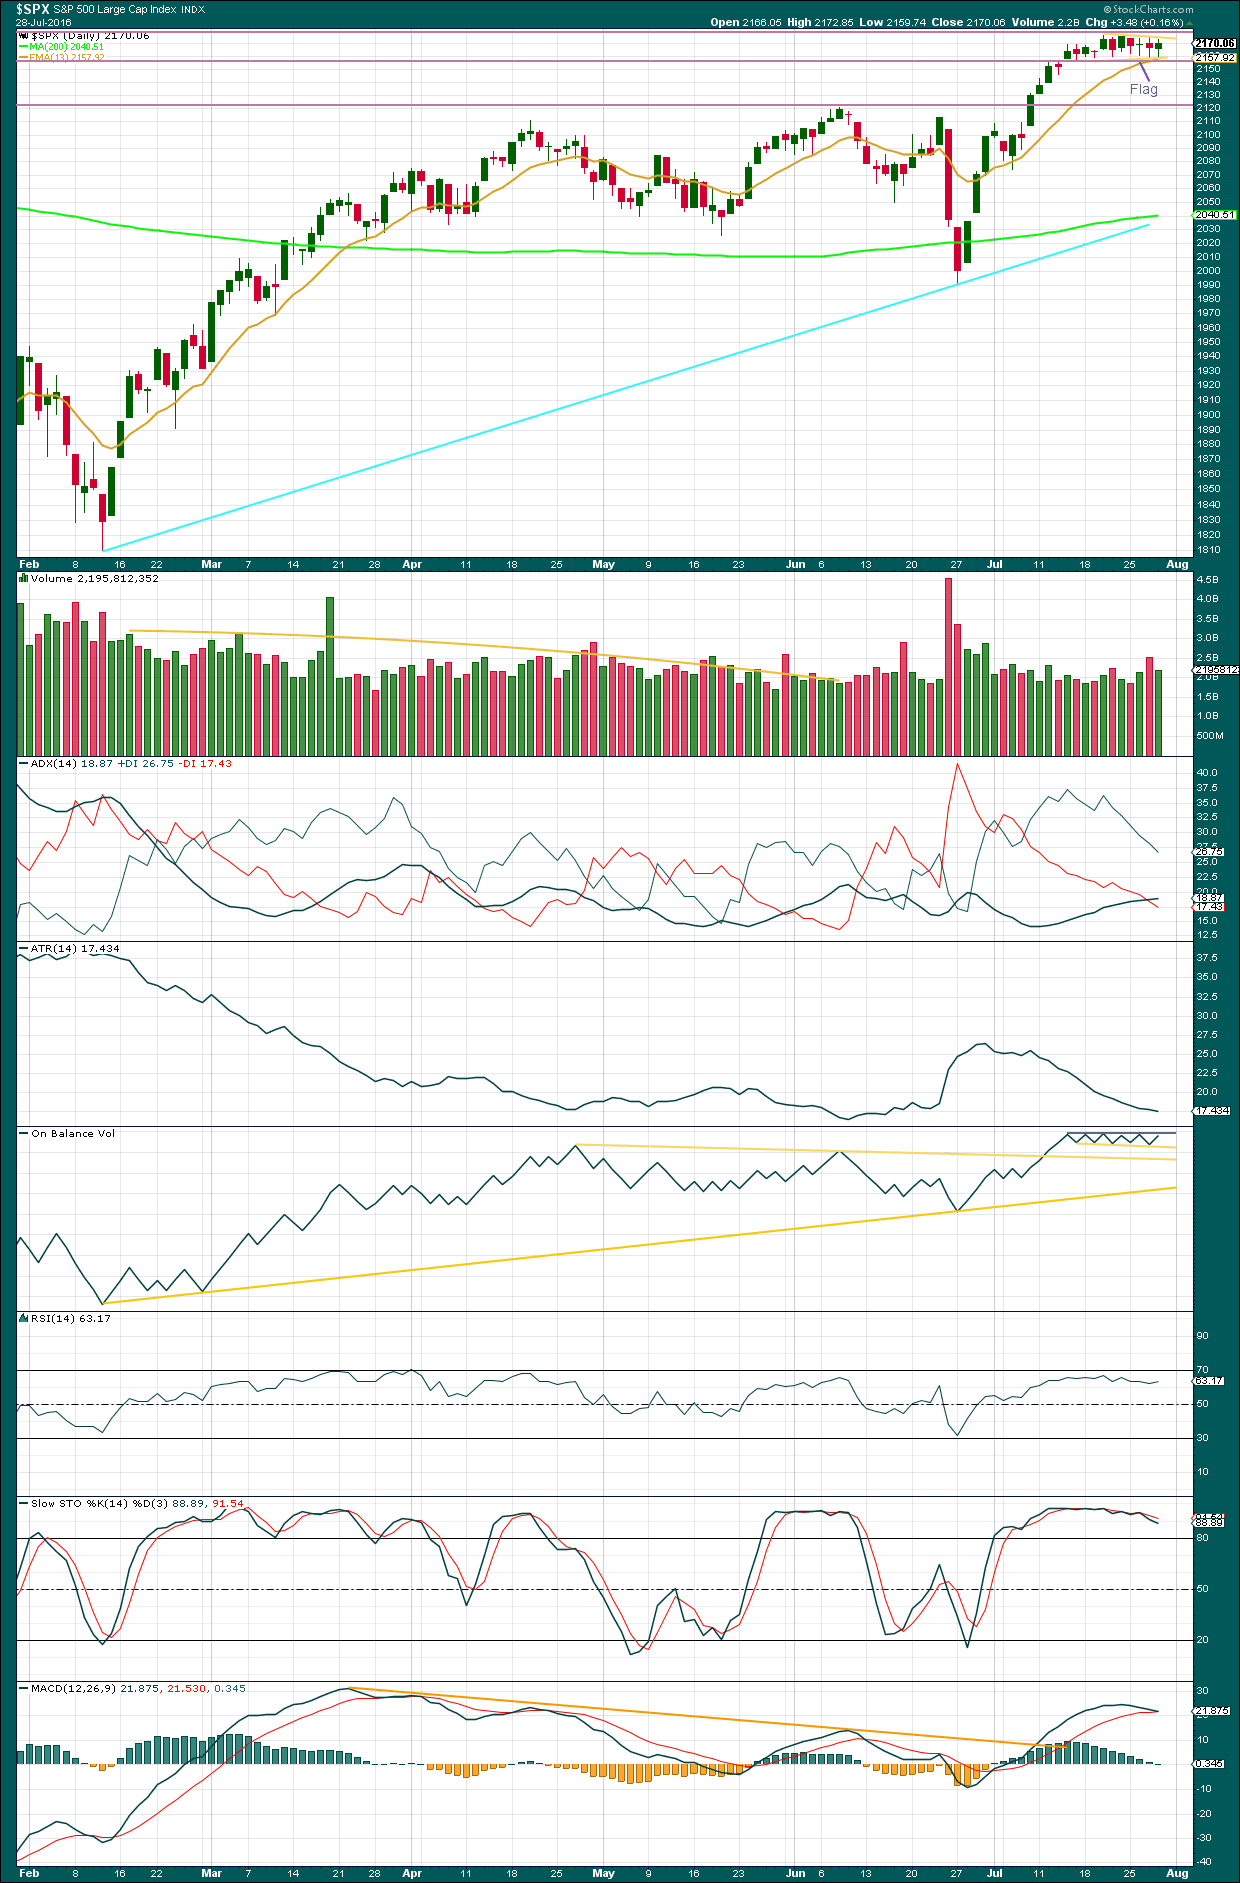
Click chart to enlarge. Chart courtesy of StockCharts.com.
Price is range bound between 2,175 and 2,160, delineated now by horizontal support and resistance lines. Price has now been within this range for about the last eleven days. During this period, it is two downwards days of 21st and 27th of July which have strongest volume. This indicates that a downwards breakout may be more likely than upwards.
However, at larger time frames recently for the S&P, this method of using volume to indicate price direction from a consolidation has proven unreliable. It may still be unreliable at this time on lower time frames. Above 2,175 the only resistance to price is round number pivots. There is no prior consolidation to offer resistance, so price may yet continue to drift up on light volume as it has done for some time.
Price continues sideways within a small flag pattern. This is a reliable continuation pattern. However, flags and pennants normally come with declining volume. It is concerning for the bullish implications of this pattern that volume is increasing, not declining.
A clear breakout above resistance is required for confidence in the bullish implications of this flag pattern, preferably on an upwards day with stronger volume for confidence in the trend. Using the measured rule, a possible target may be about 2,277.
Volume for Wednesday’s downwards day is the strongest since 30th of June. The short term volume profile is now bearish. With Thursday’s green candlestick coming on lighter volume than the last downwards day, this reinforces the bearishness of the short term volume profile.
ADX is still increasing: the +DX line is still above the -DX line. ADX still indicates an upwards trend is in place. ADX today may be flattening off as the rate of increase is slowing.
ATR still disagrees as it is declining. This is not a normal healthy trend.
On Balance Volume remains constrained within the lower yellow line and the upper grey line. A breakout by OBV may precede a breakout of price, but this has not happened yet. OBV is neutral.
RSI did not manage to reach overbought. This trend has not reached extreme yet. There is still room for price to rise.
Stochastics did reach overbought, but this oscillator may remain extreme for reasonable periods of time during a trending market.
MACD may be about to cross over indicating a possible trend change.
VOLATILITY – INVERTED VIX MONTHLY CHART
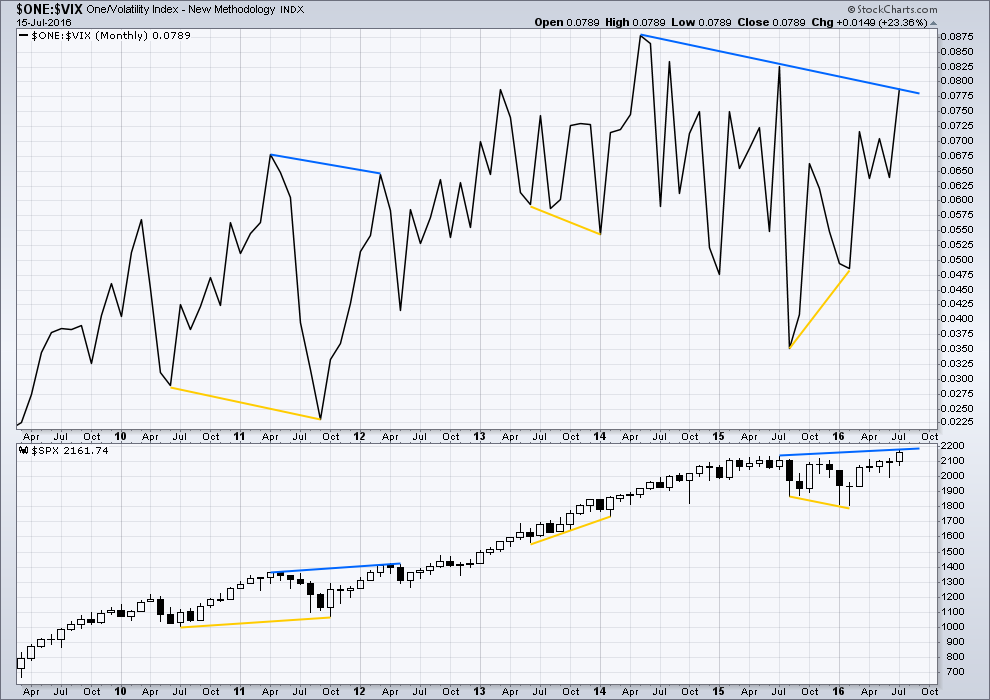
Click chart to enlarge. Chart courtesy of StockCharts.com.
VIX from StockCharts is inverted. As price moves higher, inverted VIX should also move higher indicating a decline in volatility which is normal as price moves higher. As price moves lower, inverted VIX should also move lower indicating an increase in volatility which is normal with falling price.
There is still strong multi month divergence with price and VIX. While price has moved to new all time highs, this has not come with a corresponding decline in volatility below the prior all time high at 2,134. This strong multi month divergence between price and VIX indicates that this rise in price is weak and is highly likely to be more than fully retraced. However, this does not tell us when and where price must turn; it is a warning only and can often be a rather early warning.
At this time, although divergence with price and VIX at the daily chart level has been recently proven to be unreliable (and so at this time will no longer be considered), I will continue to assume that divergence with price and VIX at the monthly chart level over longer time periods remains reliable until proven otherwise.
This supports the idea that price may be in a fifth wave up. Divergence between the end of a cycle degree wave III and a cycle degree wave V would be reasonable to see. Fifth waves are weaker than third waves. This strong divergence indicates that price targets may be too high and time expectations may be too long. However, it remains to be seen if this divergence will be reliable.
DOW THEORY
Major lows within the prior bull market:
DJIA: 15,855.12 (15th October, 2014) – closed below on 25th August, 2015.
DJT: 7,700.49 (12th October, 2014) – closed below on 24th August, 2015.
S&P500: 1,821.61 (15th October, 2014) – has not closed below this point yet.
Nasdaq: 4,117.84 (15th October, 2014) – has not closed below this point yet.
Major highs within the new bear market:
DJIA: 17,977.85 (4th November, 2015) – closed above on 18th April, 2016.
DJT: 8,358.20 (20th November, 2015) – has not closed above this point yet.
S&P500: 2,116.48 (3rd Nobember, 2015) – has now closed above this point on 8th June, 2016.
Nasdaq: 5,176.77 (2nd December, 2015) – has not closed above this point yet.
Dow Theory Conclusion: Original Dow Theory still sees price in a bear market because the transportations have failed to confirm an end to that bear market. Modified Dow Theory (adding S&P and Nasdaq) has failed still to confirm an end to the old bull market, modified Dow Theory sees price still in a bull market.
This analysis is published @ 09:03 p.m. EST.
This is what the wave count expected.
There’s too much overlapping though for a five up to be complete. So for both wave counts, main and alternate, more upwards movement should continue.
For the weekly alternate the impulse of (C) also needs more upwards movement.
Bottom line: more upwards movement, no deeper pullback yet.
LOL….I just had to do it. Passing time as I stand on the sidelines…
Silly, but very sad at the same time…..
http://www.usdebtclock.org/
Our US GDP is $17T, our debt is now $19T ……we’re done for.
US post WWII debt to GDP was more than 125%. We lived. Looking around the world, we are still the Leper with the most fingers.
Gary,
Bang on and that strength is being translated into the stock market as it is now attracting monies from overseas. Overseas investors are moving monies to protect their investments from devaluation losses as countries around the world are going to see their currencies drop relative to US Dollar.
I am not saying US is the best or bull markets and nothing else but we have to keep TA as well as reality in perspective all the times especially times like these.
At the last FXE punch through the upper BB on May 2, the banksters attempted to rattle the bears with another ramp still higher on May 3 before the decline got going. with that in mind, keeping 3/4 of FXE shorting powder dry to see what develops on Monday…I’m outta here!
Have a great week-end all!
Amazing, SP just hit a new 52 week high, absent the DOW and and the Transports on a missed GDP number……
Yeah, check out the transports – that is the truth serum of where the markets are heading.
Things that I have been learned about the market no longer apply.
Fundamentals…out the door.
Dow Theory….out the door.
Only thing left is to apply MA’s and trade in that direction.
Here’s the monkey wrench in the works – just as we are seeing totally broken markets and all sort of busted price discovery metrics as this upside march interminably unfolds, I expect we will see the same thing during the downside run…the implications are mind numbing…
Shooting star on FXE 15 minute chart…
Snagging first quarter of FXE Aug 12 109 strike puts for 0.65 per contract…will average down cost on any move higher up to 1/2 full load…
Can you believe the way they are pumping the Euro??!
It must setting up for quite a spectacular descent…Wow!
I wonder how long the banksters can pump this market? I can’t fathom how much money has been thrown at this already and how much more they have on the sidelines.
Is it as easy as Dudley calling up Yellen and asking her for anther trillion dollars? This money needs to show up on someone balance sheet.
No way they are doing this with cash Quang. They are using (probably illegal) ridiculous leverage. That is what is going to make the implosion truly stupendous. Few retail investors are leveraged in this market – it is the hedge funds drinking the kool-aid, and all the Central Banks working in collusion. These valuations are in no possible way justified by the ongoing quarterly declines in corporate revenues. It is complete insanity.
Meanwhile, corporate bond defaults just hit the 100 mark and nary a peep from the financial media. At the end of the last credit crisis they numbered 180 and we should at least double that this go round…it’s a 52T bubble…with a very hot pin on the horizon!
Looking for an impulse down on 5 min FXE chart to snag a mini truck load of August 12 108.50 puts…
Sold UVXY Aug 5 27 strike puts for 1.85. Unloaded earlier stash for nice 40% pop.
This market is getting scary. UVXY making a new 52 week low on a market decline. I continue to accumulate volatility (VIX) at these levels.
It may be getting close to time to start looking at UVXY on the long side…I expected it to go back to the teens but things are starting to get very dicey imo…in fact I would say things are getting quite dangerous in this ridiculous excuse for a market…
Dangerous is a fitting description. In my 20 years, I can’t remember a time when the market traded like this for this long. You can’t get any real momentum up or down. The candle spikes down are massive. Only to be reversed and grind higher.
Right when this market looks like its going to break down, it turns out to be the bottom. Right when the market looks like it could break up, it turns out to be the top. I don’t have the confidence in any of my trades because of all the cross currents. I think I’m gonna try to trade the 10 point range sideways.
However, the longer this market stays sideways, the more likely it breaks out to the upside. At least that’s what we’re supposed to think…..but like I said, no confidence in these moves/trades.
……5-6 point moves up within 3 five minute candles with the vix here? Dangerous is very accurate.
I doubt that there is a single trader out there is who is not expecting some kind of at least minimal move higher in these markets. After all, there are specific things that usually attend the topping process. What if Mr Market delivers a nasty surprise and instead gaps down massively? Lara’s ending diagonal count would be very much in keeping with that kind of price action as we head South in a primary degree second wave correction, possibly all the way down to 1880…!!
Vern, don’t forget the banksters have made billions by being aggressively long this market, and they don’t need leverage, they have cash …but the unravel will be huge as well.
Meanwhile a few traders I follow have gone short. And FWIW – last Friday permabear Doug Kass said he was “all in short”, so there are cracks appearing.
I do not believe they can move the market much at these levels without using leverage of some kind….just my humble opinion…
Yep! The banksters are definitely pumping for all they are worth to try and keep things propped up at least until closer to November. I must say it does appear as if they are having difficulties though. The market is trading heavier than I have seen in quite some time. The upward movement is becoming increasingly labored and we seem to be limping toward the finish line.
FXE jumped to the top of its BB this morning setting up an ideal RTM trade. You now have permission to take some coin from folk long the Euro. What on earth are they smoking??!! 🙂
I see where Hillary has accepted a lot of money from hedge funds and is buddies with the financial system. I think the levitation of the financial market around dnc may have been planned. I would think if the Donald overtakes Hillary a sell off may soon follow.
Most definitely. The fact that Bloomberg gave a speech at the DNC is evidence to that. Goldman Sachs paid Hil a quarter mil for a speech. There is a lot of fear on Wall Street about a Trump presidency.
The ending diagonal is a fascinating possibility. 30 Yr UST made a recent multi-decade top with the same structure. It would certainly require very nimble trading with deep second and fourth waves, and a possible fifth wave throw-over the 1-3 trendline to conclude the last remarkable seven years, and provide maximum chaos and confusion as traders try to keep up withe zigs and zags, so to speak. The next few weeks should be supremely interesting. I am so glad Lara is charting the course! 🙂
Indices may continue to fill open upside gaps today…
BOJ and Yen
Hi!
Gidday 🙂