
Sideways movement remained above the invalidation point on the main hourly Elliott wave count.
Summary: A small pennant or Elliott wave triangle may have ended today. This should be followed by a short fifth wave up to 2,205. The trend is up.
Last monthly chart for the main wave count is here.
New updates to this analysis are in bold.
MAIN WAVE COUNT
WEEKLY CHART
Click chart to enlarge.
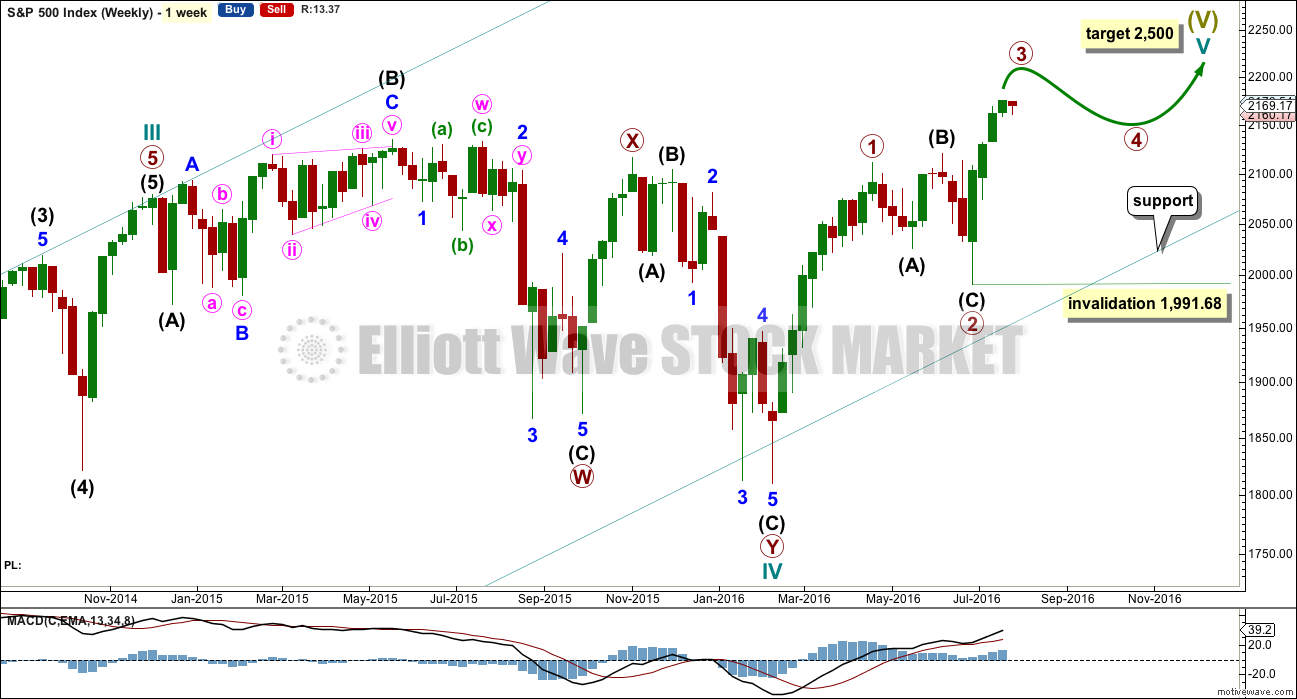
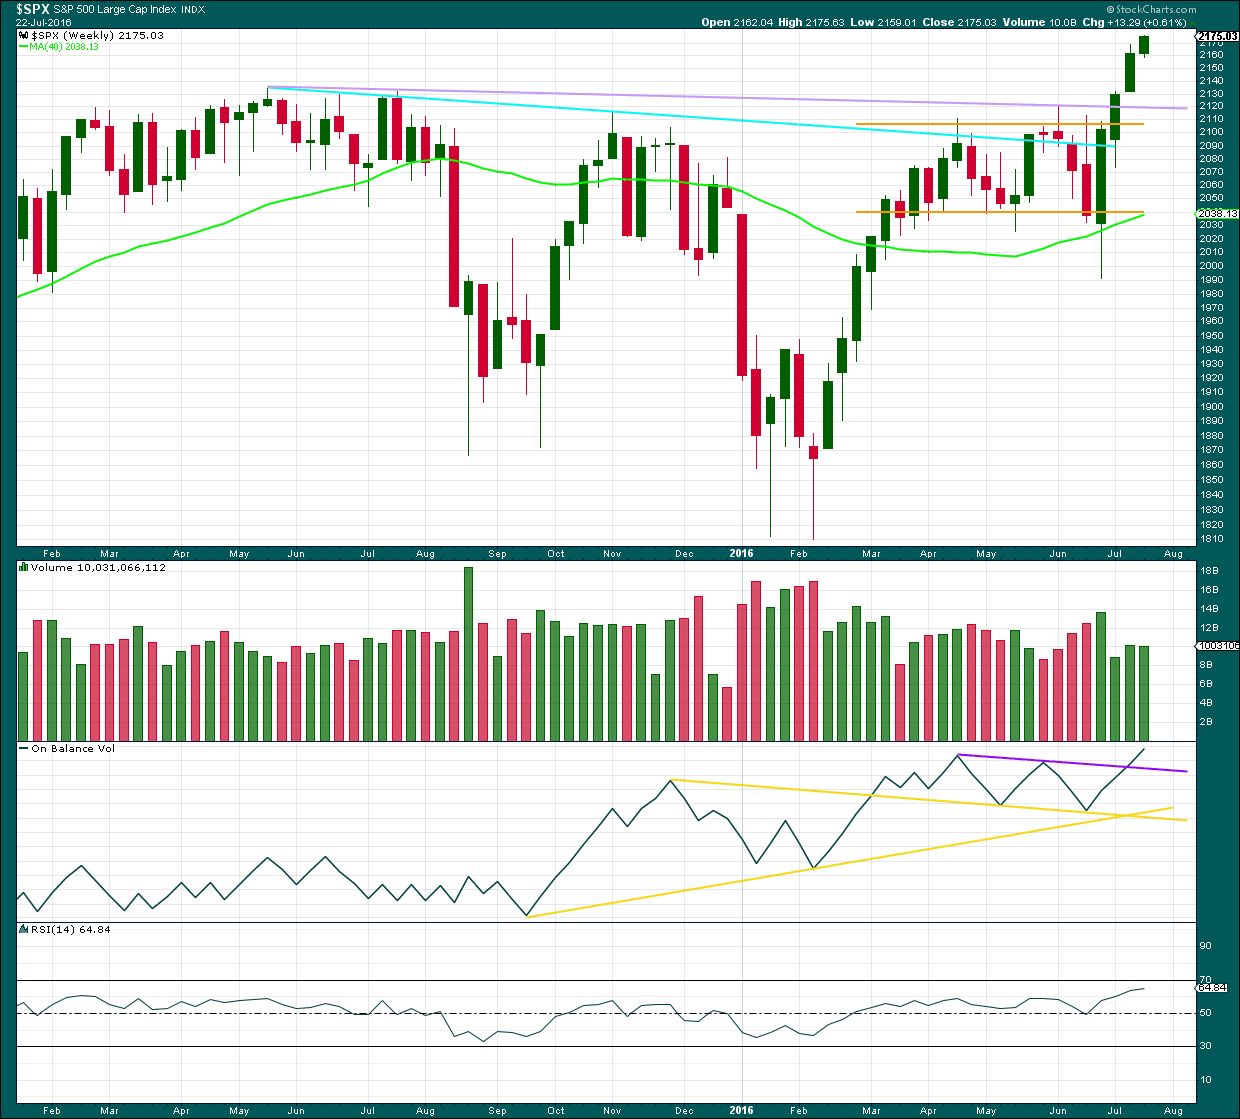
Cycle wave II was a shallow 0.41 zigzag lasting three months. Cycle wave IV is now seen as a more shallow 0.28 double combination lasting 15 months. With cycle wave IV five times the duration of cycle wave II, it should be over there.
Cycle wave I lasted 28 months (not a Fibonacci number), cycle wave II lasted a Fibonacci 3 months, cycle wave III lasted 38 months (not a Fibonacci number), and cycle wave IV lasted 14 months (one more than a Fibonacci 13).
If the target for cycle wave V is for it to be equal in length with cycle wave I, then it may also be expected to be about equal in duration. So far cycle wave V is in its fifth month. After this month, a further 23 months to total 28 seems a reasonable expectation, or possibly a further 16 months to total a Fibonacci 21.
This first weekly wave count expects the more common structure of an impulse is unfolding for cycle wave V. Within cycle wave V, primary waves 1 and now 2 should be over. Within primary wave 3, no second wave correction may move beyond its start below 1,991.68.
There is one other possible structure for cycle wave V, and ending diagonal. This is covered in an alternate.
DAILY CHART
Click chart to enlarge.
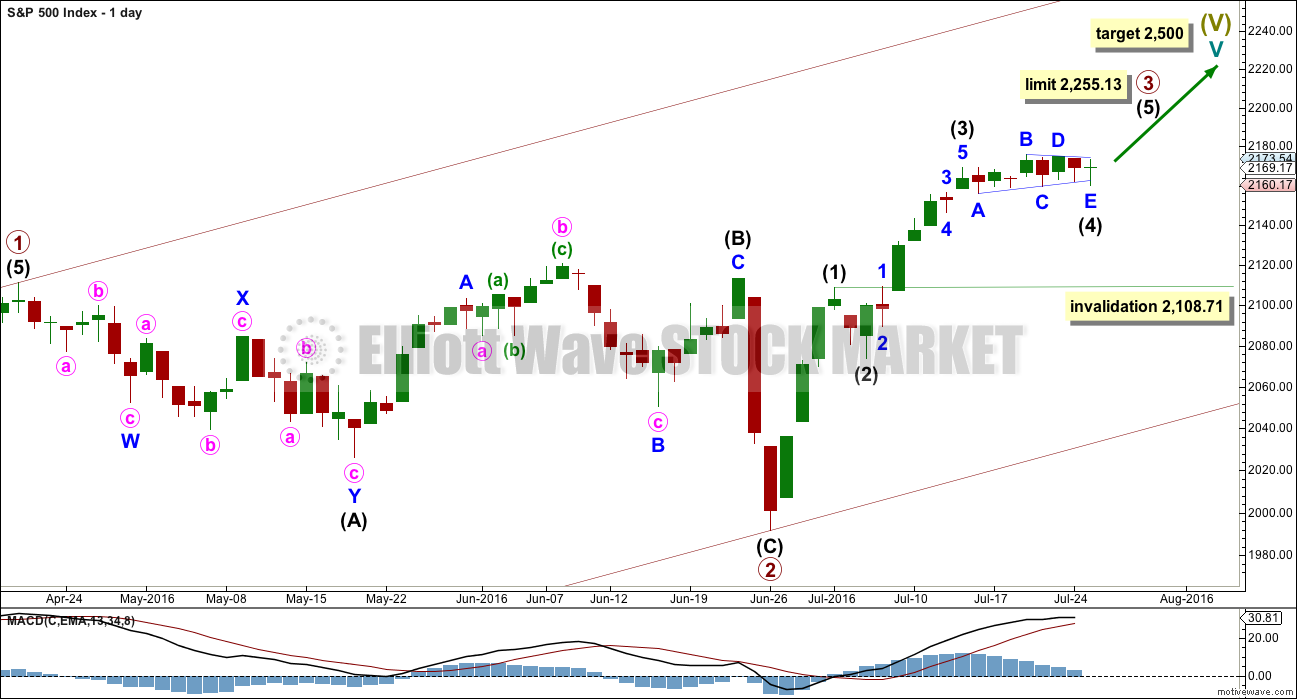
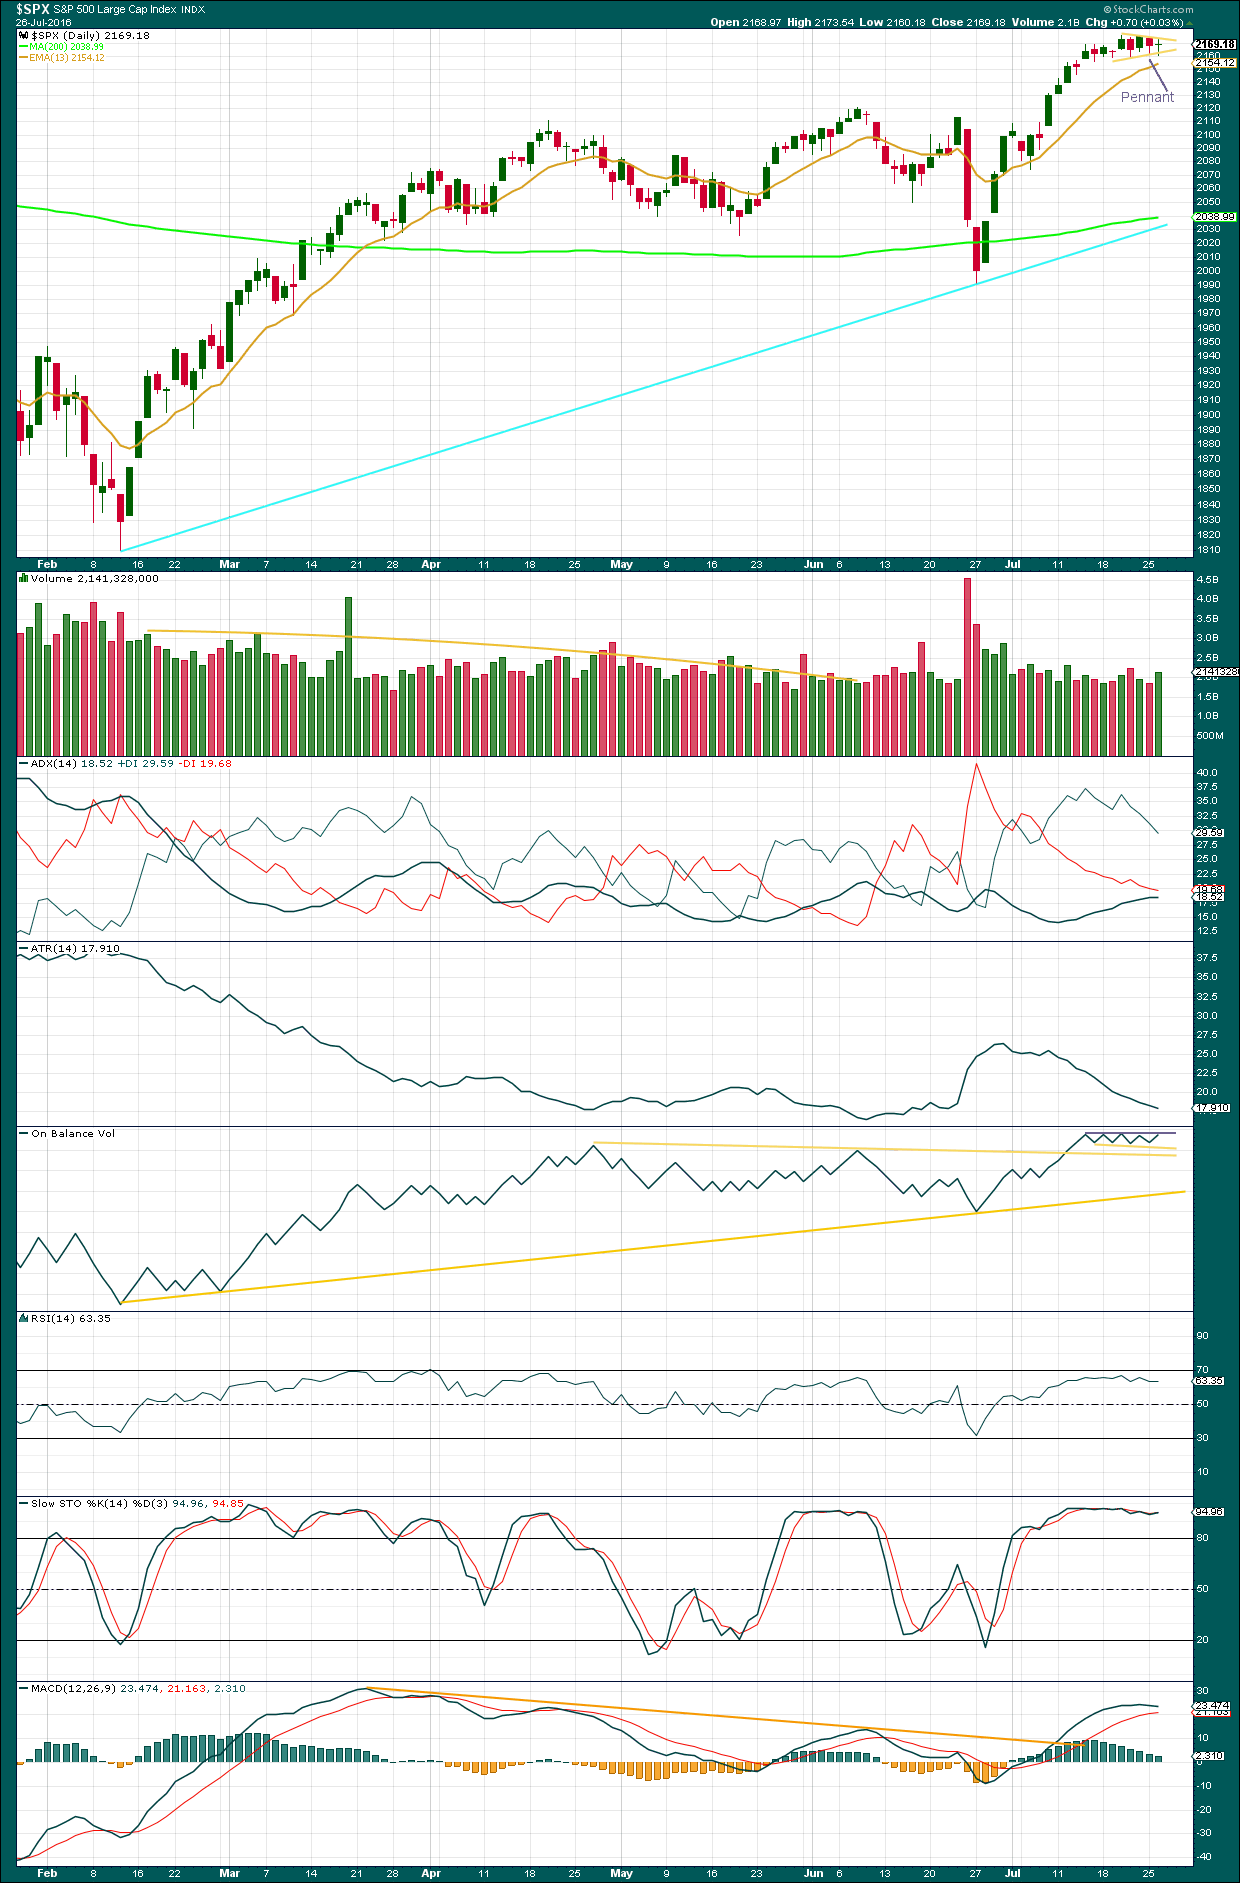
It is most likely that primary wave 2 is already complete as a shallow regular flat correction. Primary wave 3 is most likely underway.
A five wave impulse is almost complete within primary wave 3. This impulse may be primary wave 3 in its entirety, or the degree of labelling within primary wave 3 may all be moved down one degree and this may only be intermediate wave (1) almost complete. When the fifth wave up is complete, then a new alternate will also be considered that sees only intermediate wave (1) complete.
The labelling on the daily and hourly charts will consider primary wave 3 almost complete. Intermediate wave (4) may now be a complete running barrier triangle.
Intermediate wave (3) is shorter than intermediate wave (1) within the upwards impulse. Because a core Elliott wave rule states a third wave may not be the shortest actionary wave within an impulse, this limits intermediate wave (5) to no longer than equality in length with intermediate wave (3) at 2,255.13.
When primary wave 3 is complete, then the following correction for primary wave 4 may not move back down into primary wave 1 price territory below 2,111.05.
Intermediate wave (4) may not move into intermediate wave (1) price territory below 2,108.71.
Intermediate wave (1) lasted four days, intermediate wave (2) was a quick zigzag over in just two days, and intermediate wave (3) may have been over in six days. Intermediate wave (4) may have now ended in a Fibonacci eight days.
HOURLY CHART
Click chart to enlarge.
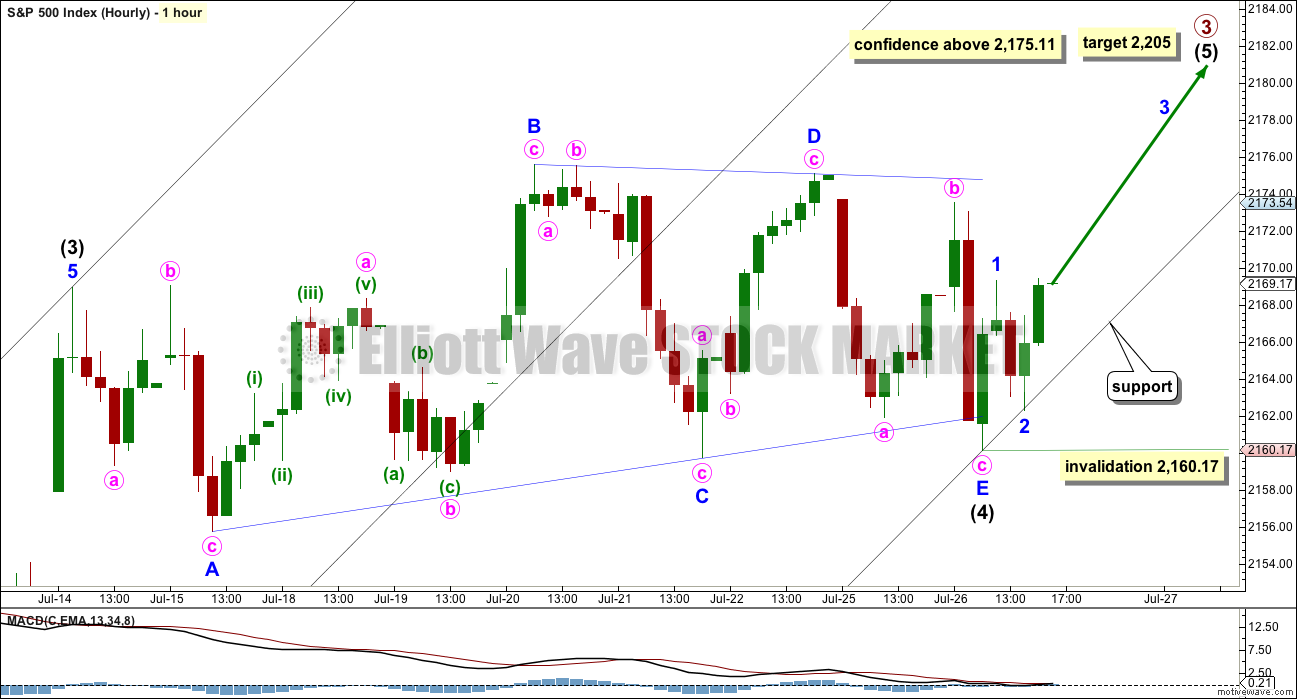
Intermediate wave (4) may be a complete running barrier triangle as labelled. Minor wave E moved lower at the start of Tuesday’s session, completing a larger more obvious three wave zigzag.
The target is recalculated. At 2,205 intermediate wave (5) would reach 0.382 the length of intermediate wave (1). This target is close to the round number pivot of 2,200 which should provide some resistance.
Intermediate wave (4) is a barrier triangle. Fifth waves following fourth wave barrier triangles are either very long extensions, or very short. In this instance, a very long extension may be eliminated because that would violate the core rule that intermediate wave (3) may not be the shortest actionary wave. Intermediate wave (5) should be expected to be very short.
Within intermediate wave (5), no second wave correction may move beyond the start of its first wave below 2,160.17.
It is very likely that this consolidation is over now because the triangle structure fits perfectly, is supported by MACD hovering about zero, and it lasted a Fibonacci eight days. This main wave count has a higher probability than the alternate below.
Confidence may be had in this main wave count with a new high above 2,175.11.
Redraw the channel about primary wave 3 using Elliott’s second technique: draw the first trend line from the ends of intermediate waves (2) to (4), then place a parallel copy on the end of intermediate wave (3). Along the way up, downwards corrections should find support at the lower edge. Intermediate wave (5) may end about the mid line of this channel.
Intermediate wave (5) may last about two to six sessions.
HOURLY CHART – ALTERNATE
Click chart to enlarge.
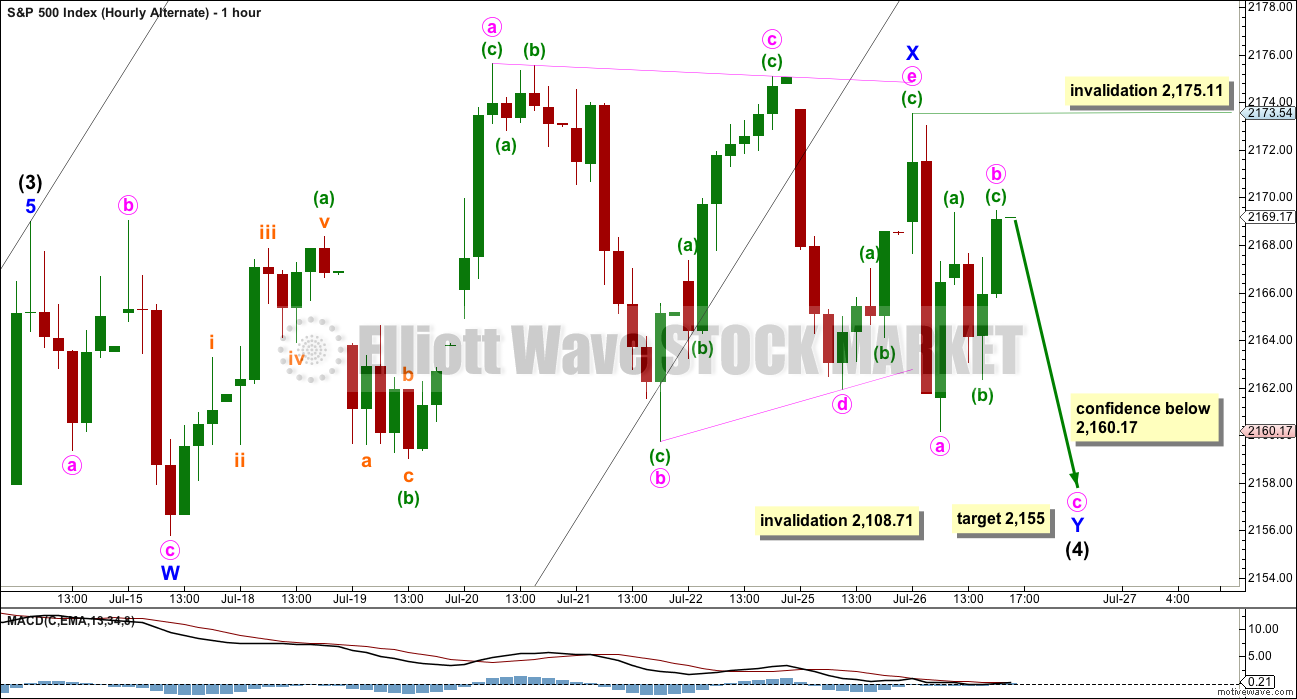
This alternate is changed today. Intermediate wave (4) may be an incomplete double combination. The triangle may possibly have been an X wave joining two structures in the double.
The first structure in the double may be a regular flat correction labelled minor wave W.
Minor wave X may be a regular contracting triangle.
Minor wave Y may be unfolding as a zigzag. The most likely end for it would be about the same level as minor wave W at 2,155, so that the whole structure moves sideways. Within minor wave Y, minute wave b may not move beyond the start of minute wave a above 2,175.11.
If price does break below 2,160.17 tomorrow, then not much more downwards movement would be expected. Combinations should not have a slope; they should have a sideways look to them.
The second alternate in yesterday’s analysis is no longer published today. It no longer has the right look.
ALTERNATE WAVE COUNT
WEEKLY CHART

Click chart to enlarge.
Cycle wave V may be unfolding as an ending diagonal. The most common type of diagonal by a reasonable margin is a contracting diagonal. When primary waves 1 and 2 are complete, then primary wave 3 would most likely be shorter than primary wave 1. If primary wave 3 were to be longer than primary wave 1, then the less common variety of an expanding diagonal would be indicated.
Within an ending diagonal, all the sub-waves must subdivide as zigzags and the fourth wave must overlap back into first wave price territory. The whole structure is choppy and overlapping with a gentle slope. The classic pattern equivalent is a rising wedge.
The zigzag of primary wave 1 requires a final fifth wave up as per the main daily wave count. Thereafter, a deep zigzag for primary wave 2 should unfold. It may find support at the lower edge of the teal channel copied over from the monthly chart.
When the end of primary wave 1 is clear, then a target range for primary wave 2 would be calculated. It would most likely be between 0.66 to 0.81 the length of primary wave 1. Primary wave 2 may not move beyond the start of primary wave 1 below 1,810.10.
Ending diagonals have corrective characteristics as they subdivide into a series of zigzags. Ending diagonals contain uncertainty; the trend is unclear as they unfold due to the deep corrections of their second and fourth waves. They are terminal and doomed to full retracement. This may explain some persistent weakness to this upwards trend at this time. The final target at 2,500 for the main wave count would be far too optimistic if this alternate is correct and the diagonal is contracting.
Third waves of even diagonals should still be supported by volume and should still exhibit stronger momentum than the first wave.
For this alternate wave count, when a final short fifth wave up completes intermediate wave (C), then a deep pullback would be expected for primary wave 2 to last several weeks.
TECHNICAL ANALYSIS
WEEKLY CHART
Click chart to enlarge. Chart courtesy of StockCharts.com.
At the end of last week, another green weekly candlestick completes with a slight decline in volume. The last three weekly candlestick patterns now complete a stalled pattern. This is a bearish reversal pattern, so some caution about this upwards trend is warranted. A trend change to either sideways or down may occur here.
On Balance Volume is still bullish at the weekly chart level. If OBV turns down and breaks below the purple line, that would be a bearish signal.
RSI is not yet overbought at the weekly chart level. There is still room for price to rise.
DAILY CHART
Click chart to enlarge. Chart courtesy of StockCharts.com.
One more sideways day, a small doji, continues the small pennant pattern. Price has not yet broken out of the pattern. Using the measured rule, a target of about 2,274 would be indicated if price breaks out of the pattern upwards tomorrow.
There was some increase in volume today which completed a green candlestick. There was some support for the upwards movement from price.
ADX is increasing, indicating an upwards trend is in place. ATR is still declining, disagreeing with ADX. This is not normal for a healthy sustainable trend.
On Balance Volume is still constrained within two small trend lines. It has not broken out yet to indicate a direction for price. A break above the grey line would be bullish. A break below the yellow line would be bearish.
RSI is not extreme. There is room for price to rise further.
Stochastics is flattening off as price consolidates. This oscillator may remain extreme for reasonable periods of time during a trending market.
MACD is also flattening off as price consolidates. It still shows longer held divergence with price, but divergence is not currently reliable. It is noted, but not given much weight. The break above a trend line from MACD several days ago was a bullish signal.
Price may find support about the 13 day moving average as the upwards trend continues. This is quite close by today, so some upwards movement would be a reasonable expectation about here.
VOLATILITY – INVERTED VIX MONTHLY CHART
Click chart to enlarge. Chart courtesy of StockCharts.com.
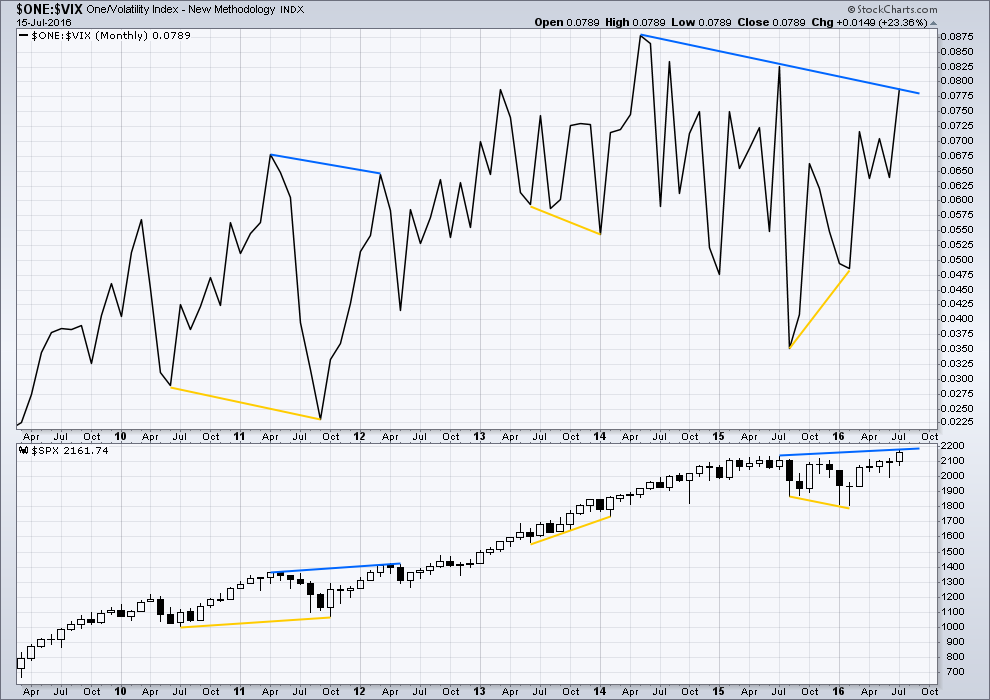
VIX from StockCharts is inverted. As price moves higher, inverted VIX should also move higher indicating a decline in volatility which is normal as price moves higher. As price moves lower, inverted VIX should also move lower indicating an increase in volatility which is normal with falling price.
There is still strong multi month divergence with price and VIX. While price has moved to new all time highs, this has not come with a corresponding decline in volatility below the prior all time high at 2,134. This strong multi month divergence between price and VIX indicates that this rise in price is weak and is highly likely to be more than fully retraced. However, this does not tell us when and where price must turn; it is a warning only and can often be a rather early warning.
At this time, although divergence with price and VIX at the daily chart level has been recently proven to be unreliable (and so at this time will no longer be considered), I will continue to assume that divergence with price and VIX at the monthly chart level over longer time periods remains reliable until proven otherwise.
This supports the idea that price may be in a fifth wave up. Divergence between the end of a cycle degree wave III and a cycle degree wave V would be reasonable to see. Fifth waves are weaker than third waves. This strong divergence indicates that price targets may be too high and time expectations may be too long. However, it remains to be seen if this divergence will be reliable.
DOW THEORY
Major lows within the prior bull market:
DJIA: 15,855.12 (15th October, 2014) – closed below on 25th August, 2015.
DJT: 7,700.49 (12th October, 2014) – closed below on 24th August, 2015.
S&P500: 1,821.61 (15th October, 2014) – has not closed below this point yet.
Nasdaq: 4,117.84 (15th October, 2014) – has not closed below this point yet.
Major highs within the new bear market:
DJIA: 17,977.85 (4th November, 2015) – closed above on 18th April, 2016.
DJT: 8,358.20 (20th November, 2015) – has not closed above this point yet.
S&P500: 2,116.48 (3rd Nobember, 2015) – has now closed above this point on 8th June, 2016.
Nasdaq: 5,176.77 (2nd December, 2015) – has not closed above this point yet.
Dow Theory Conclusion: Original Dow Theory still sees price in a bear market because the transportations have failed to confirm an end to that bear market. Modified Dow Theory (adding S&P and Nasdaq) has failed still to confirm an end to the old bull market, modified Dow Theory sees price still in a bull market.
This analysis is published @ 07:49 p.m. EST.
Those BIG 5 minute red candles out of no where is just crazy. I am as nimble as they come, but this market is just crazy and it’s starting to make me schizophrenic.
I may just turn off my computer for a week and fly the family to Disney world this week.
All those big candles – yet it ends almost exactly flat for the day.
Well, that was confusing and highly annoying wasn’t it. I was whipsawed out, only for price to turn and go in my direction.
Intermediate wave (4) triangle is invalidated. It does fit however as a double flat:
regular flat – X (triangle) – expanded flat
Target for intermediate (5) to = 0.618 X intermediate (1) is 2,231. If this target is wrong it may be too high.
Limit for intermediate (5) to not be longer than (3) is 2,254.03
I do appreciate your timely end of day postings!
Hmmm…market teetering with stochastics overbought and macd at the cross over junction. Market has to move up the old fashion way and earn it. We will see if earnings can keep the levitations intact for another spike.
Reversal in VIX means we are going higher. It will be entirely artificial judging by the lack of emotional reaction to FED pronouncement. UVXY puts showing some life (I ended up with five of them the day after the split). Even more surprising is that yields continue to fall which means the market thinks the FED is full of it on their hawkish jawboning. I still think we will see a final ramp up before a reversal. The banksters will probably do it overnight to keep everyone off balance. I’m watching from the sidelines and will cash in my UVXY puts on the next ramp up.
Have a great evening all!
what really stinks…I can’t get any confidence in a long trade, so I have had a tough time trading on the long side. I used to have no problem switching from short to long. I wish these d*mn banksters would just stop with their magic freakin bids out of nowhere. Is so freakin obvious when watching time and sales….It makes me sick to my stomach.
Lara,
With respect to main hourly wave count with lines converging for triangle, can end of E wave terminate beyond start of C wave?
No. Not by any amount at any time frame.
The triangle was invalidated.
comnnect the lows from 7/15 and 7/21. We have now broken through that trend line twice now, yesterday and just a little bit ago, only to come back above. Sheez…how many head fakes can you give until its no longer a head fake?
I still think we are going to see a spike of some sort after the FED speaks today. Frankly, I am hoping it’s a spike to the upside as I think it would be terminal and a perfect set-up for a short side trade. FED announcements frequently coincide with market tops.
One of the more difficult aspects of trading using EW analysis is getting caught on the wrong side of the market when it makes a turn contrary to the expected wave count. I learned the hard way to not ignore two very important signals of an interim bottom, regardless of my expectation based on the wave count.
The first is upper BB penetration by VIX, UVXY or both.
Every time that happens chances are very high that a reversal is about to occur.
In fact I have never seen it fail.
The second signal is a long lower wick in the area of support. Even when that candle does not technically qualify as a hammer, in almost all the recent cases in which we have seen it it portended a trend change from down to up.
Signals for tops are not as easy to come by, and I have still been working on testing a few.
Having said that, today’s developing bullish engulfing candle in VIX and its series of recent higher closes could be telling us our main wave count may need a second look.
Based on this development, I have cancelled my open order on those SPY calls and will be adding to my volatility position at the close if VIX remains above 13.72.
“One of the more difficult aspects of trading using EW analysis is getting caught on the wrong side of the market when it makes a turn contrary to the expected wave count. ”
No truer words have been spoken about trading with EW Theory. EW Theory is awesome when your count and degrees are right, but when they are off, you need to be able to recognize and react quickly.
Thanks Verne. I’m taking this warning seriously, looking to see if primary 3 could be over already.
So that I’ve got this right and can use it myself, what time frame are you referring to Bollinger Bands on for VIX? I’m looking at daily and VIX is on the mid line today. So I assume you mean hourly?
Regarding a long lower wick touching support, you’re referring to VIX I assume?
Apologies if my comments seem like asking for the obvious, but I don’t like to assume. It makes an ass out of u and me 🙂
Here is my take on current position based on momentum indicator which is the only one I use. Note FTSE which I also trade has just bounced off the 78% fib retrace from ATH and also shows large momentum divergence. I have shorted both S&P and FTSE with targets of T1 23%fib and T2 38% fib retrace.
Keeping an eye on VIX. If we close above 13.72, it would imo warrant reconsideration of the immediate bullish case…
I am starting to wonder if VIX is giving us a heads up. I just took another look at the chart and since its low on July 20, it has posted four out of five higher closes….hmmnn….
Well Verne, off today’s highs, I count 5 waves down on the 5 minute chart….which could be a problem for the triangle count.
Yep. Unless we have an ABC for a second wave of five up. NDX divergence probably means this move down is a head-fake. I expect just as NDX led the way up, it will do so again on the way down. I think the banksters are playing with us… 🙂
A few mixed signals. We should be in wave three of a fifth wave up per the main count so one would expect momentum to show some increase, unless of course the second wave is not done. VIX interestingly, is heading North and UVXY is printing yet another 52 week low.
Probably a good time to SOH until Mr. Market shows his hand…
Just a quick point of personal privilege to the other regular members. I don’t want anyone to get the impression that I sometimes engage in any kind of so-called “cyber bullying” when I confront the occasional individual casting aspersions on Lara’s analysis, or making unduly negative comments on the forum that serves only to discourage and distract other members. My view on this is very simple. We need Lara at her very best mentally and emotionally to give us the excellent analysis she has for these many years now. So it is certainly in all our best interests that she does not have to spend valuable time dealing with flame-throwers. ‘Nuff Said!
Thanks Verne. I’m pretty sure long standing members know this, and it’s only the newer members who may not realise they’ve joined a small community here that don’t initially realise.
I appreciate your support, and that of other members too.
The internet is full of nastiness. For those members new here, please read the comments guidelines carefully. Standards are strictly enforced. My standards for communication in comments is very high indeed. This is not YouTube where anything goes, it is the polar opposite of YouTube in fact.
All members at all times are expected to be kind, very polite and considerate.
Manners are free, and exhibit decency and strength of character when displayed online IMO. Let us all be better than the majority of the internet.
In this way everyone may feel comfortable sharing their own trading strategies, analysis and information. Because you can only do that if you’re sure you won’t get flamed for it.
And as Verne rightly notes, then I’m not wasting my time and energy getting upset about nastiness.
Looks like MMs trying to shake out weak bulls ahead of spike higher. Opened “stink bid” to buy back those calls at 1.10 or better in case MMs spike it down a bit farther. Second wave count still valid above 2160.17…
2 days in a row, they sell the highs. One thing is for certain, this market will test your metal.
What Lara saw as a triangle, I saw as a series of 1-2’s. I never said anything, because my EW skills is average at best.
If triangle is still in play, this could be “e” here. I’m sitting on the sidelines until after the fed announcement.
Do share, particularly if you chart your ideas.
You may see something I’ve missed. And I can offer feedback on your EW counting, helping you learn and get better.
Selling August 5 216.50 calls bought for 1.35 for 1.80 at 20% or better gain…
Waiting for spike higher to start laddering short positions….initial signal will be turn in VIX…
Vern, what about those 50k AAPL calls bought last week, that trade worked out pretty nice. Nothing like insider info, huh? 🙂
Can you believe it? I have to start paying attention to those heads-up I keep getting from my old friends over at Bottarelli Research. Nine out of ten times those “sharp paper” trades hit pay-dirt. I just don’t want any unexpected calls from the SEC! 🙂
I think I’ll be entering a buy… short term scalp for tomorrow.
I’m just curious, when you do such a scalp, are you buying options, futures, or ETFs like SPY or UPRO?
I’m trading CFD’s on the futures market of S&P500.
My broker is CMC markets in New Zealand.
😉
dang,,, late again
🙂
Next time Doc