
Price moved sideways as the main Elliott wave count expected.
Summary: One or two sessions of overall downwards movement to end below 2,168.98 and above 2,159.75 is most likely. Note that downwards movement may end a little below 2,159.75, so if this point is breached, then the target would be only at 2,159. Thereafter, the upwards trend is expected to resume. A deeper pullback requires confirmation with a new low below 2,108.71. Before this price point is reached though, support from volume should indicate this possibility as likely. At this stage, the trend is up. Expect a small consolidation to end soon.
Last monthly chart for the main wave count is here.
New updates to this analysis are in bold.
MAIN WAVE COUNT
WEEKLY CHART
Click chart to enlarge.
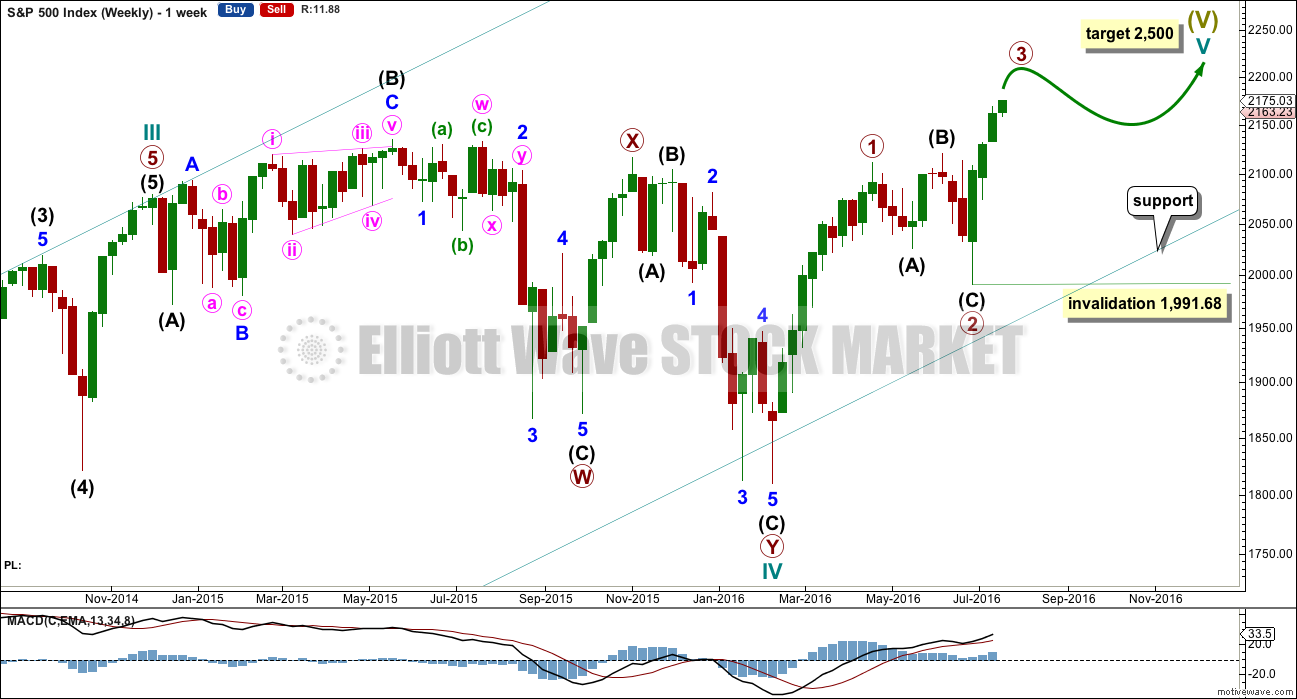
Cycle wave II was a shallow 0.41 zigzag lasting three months. Cycle wave IV is now seen as a more shallow 0.28 double combination lasting 14 months. With cycle wave IV nearly five times the duration of cycle wave II, it should be over there.
Cycle wave I lasted 28 months (not a Fibonacci number), cycle wave II lasted a Fibonacci 3 months, cycle wave III lasted 38 months (not a Fibonacci number), and cycle wave IV lasted 14 months (one more than a Fibonacci 13).
If the target for cycle wave V is for it to be equal in length with cycle wave I, then it may also be expected to be about equal in duration. So far cycle wave V is in its fifth month. After this month, a further 23 months to total 28 seems a reasonable expectation, or possibly a further 16 months to total a Fibonacci 21.
This first weekly wave count expects the more common structure of an impulse is unfolding for cycle wave V. Within cycle wave V, primary waves 1 and now 2 should be over. Within primary wave 3, no second wave correction may move beyond its start below 1,991.68.
There is one other possible structure for cycle wave V, and ending diagonal. This is covered this week in a new alternate.
DAILY CHART
Click chart to enlarge.
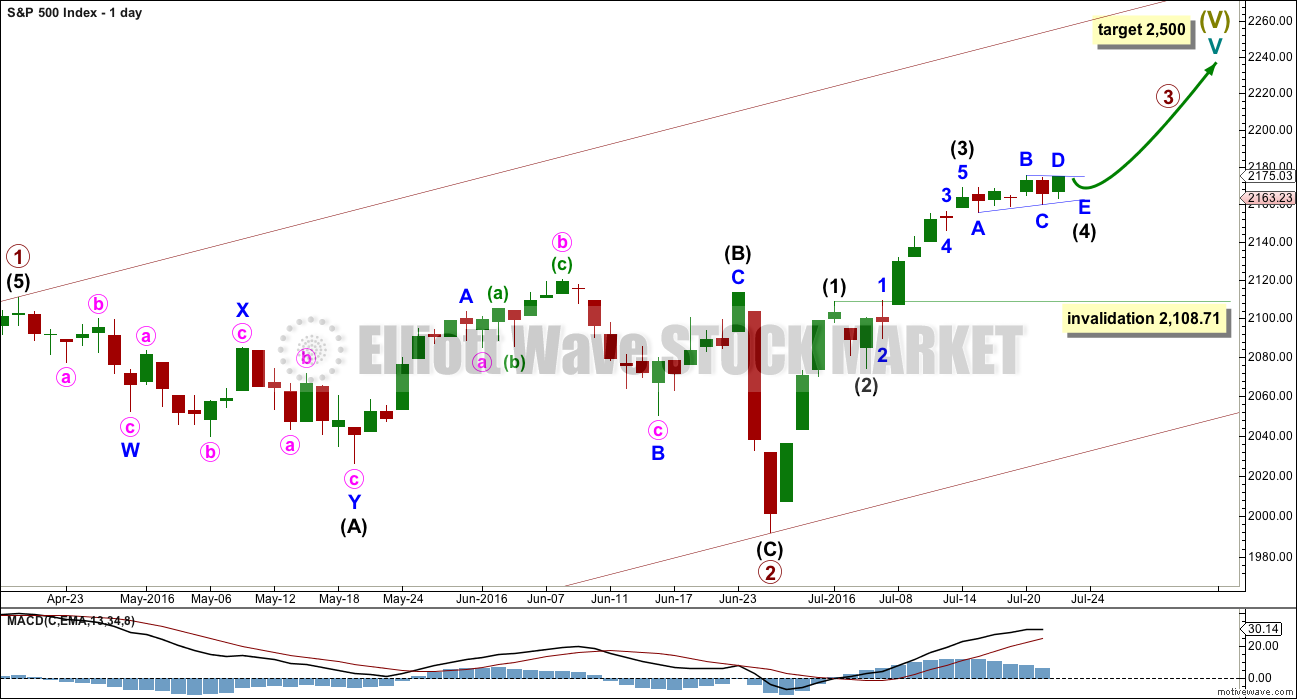
It is still most likely that primary wave 2 is already complete as a shallow regular flat correction. Primary wave 3 is most likely underway.
At this stage, within primary wave 3, it now looks like intermediate wave (3) may be over and intermediate wave (4) may be moving sideways, so far subdividing as a running contracting triangle or double flat. At the end of this week, I have two hourly wave counts for intermediate wave (4).
If intermediate wave (3) is over, then it was shorter than intermediate wave (1), and there is no Fibonacci ratio between the two waves. This limits intermediate wave (5) to no longer than equality in length with intermediate wave (3).
A target for primary wave 3 to end may not be calculated at this time. When intermediate wave (4) is complete, then a target will again be calculated for primary wave 3 to end.
Because the limit to the length of intermediate wave (5) places a limit on how high primary wave 3 can go, the final target for cycle wave V to end now looks to be too high. When primary waves 3 and 4 are complete then the final target for primary wave 5 can be calculated at primary degree. At that stage, the target at 2,500 will probably change and it will probably be lower, if this wave count at that stage is still correct.
Alternatively, the degree of labelling within primary wave 3 may all be moved down one degree. Intermediate wave (1) may be incomplete. This would allow the final target at 2,500 to remain.
When primary wave 3 is complete, then the following correction for primary wave 4 may not move back down into primary wave 1 price territory below 2,111.05.
Intermediate wave (4) may not move into intermediate wave (1) price territory below 2,108.71.
Intermediate wave (1) lasted four days, intermediate wave (2) was a quick zigzag over in just two days, and intermediate wave (3) may have been over in six days. Intermediate wave (4) has so far lasted six days. If it continues for another two, it may total a Fibonacci eight.
HOURLY CHART
Click chart to enlarge.
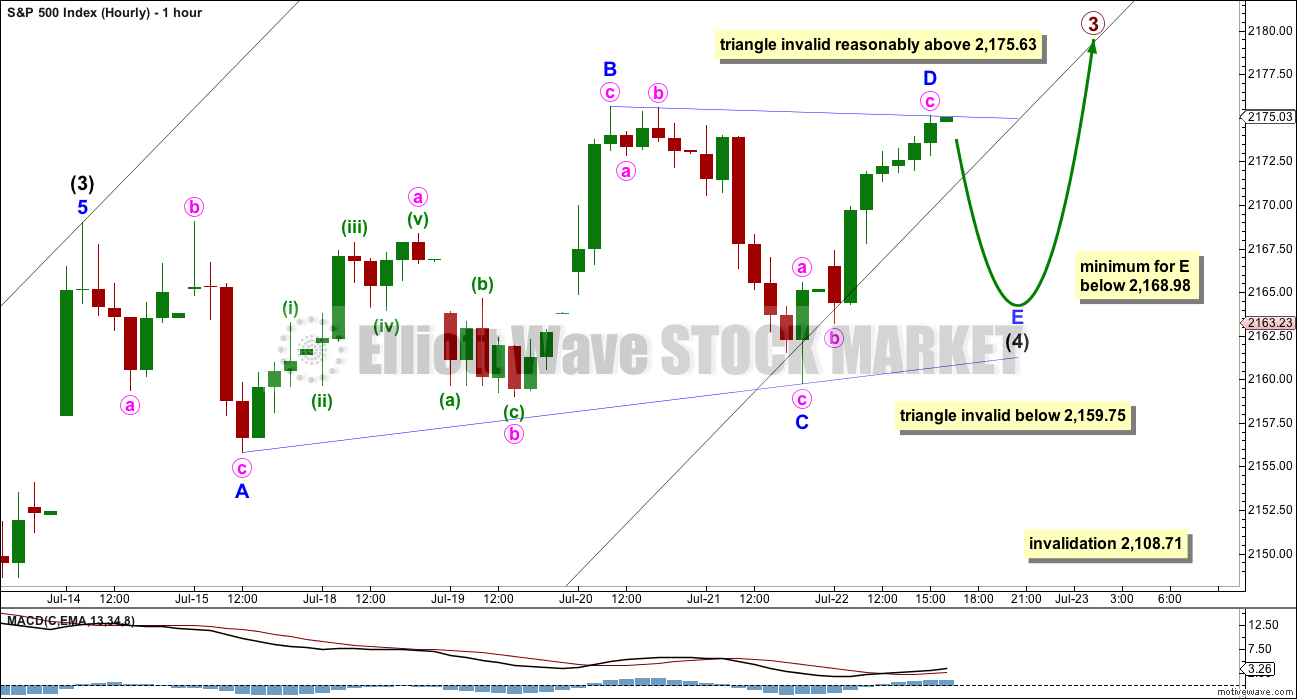
Intermediate wave (4) may be a running barrier triangle as labelled.
This first hourly chart would be preferred while price remains above 2,165.56. The triangle is now supported by MACD flattening off and hovering close to zero.
Minor wave D should have ended about the same level as minor wave B. The B-D trend line is essentially flat indicating a barrier triangle. Fifth waves out of barrier triangles are either very short or very long extensions. In this instance, because intermediate wave (3) was shorter than intermediate wave (1), a very long extension for intermediate wave (5) would violate a core Elliott wave rule, so intermediate wave (5) should be expected to be very short.
Minor wave E downwards should subdivide as a three wave structure. If it is time consuming, it may continue for two sessions so that intermediate wave (4) totals a Fibonacci eight.
Minor wave E would most likely fall short of the A-C trend line. It may not move beyond the end of minor wave C below 2,159.75.
If the market begins on Monday with a little upwards movement, then this wave count will remain valid as long as the B-D trend line remains essentially flat. Unfortunately, that is a subjective assessment; this is the only rule in Elliott wave which is not black and white.
Intermediate wave (4) may not move into intermediate wave (1) price territory below 2,108.71. This wave count remains valid while price remains above this point.
HOURLY CHART – ALTERNATE
Click chart to enlarge.
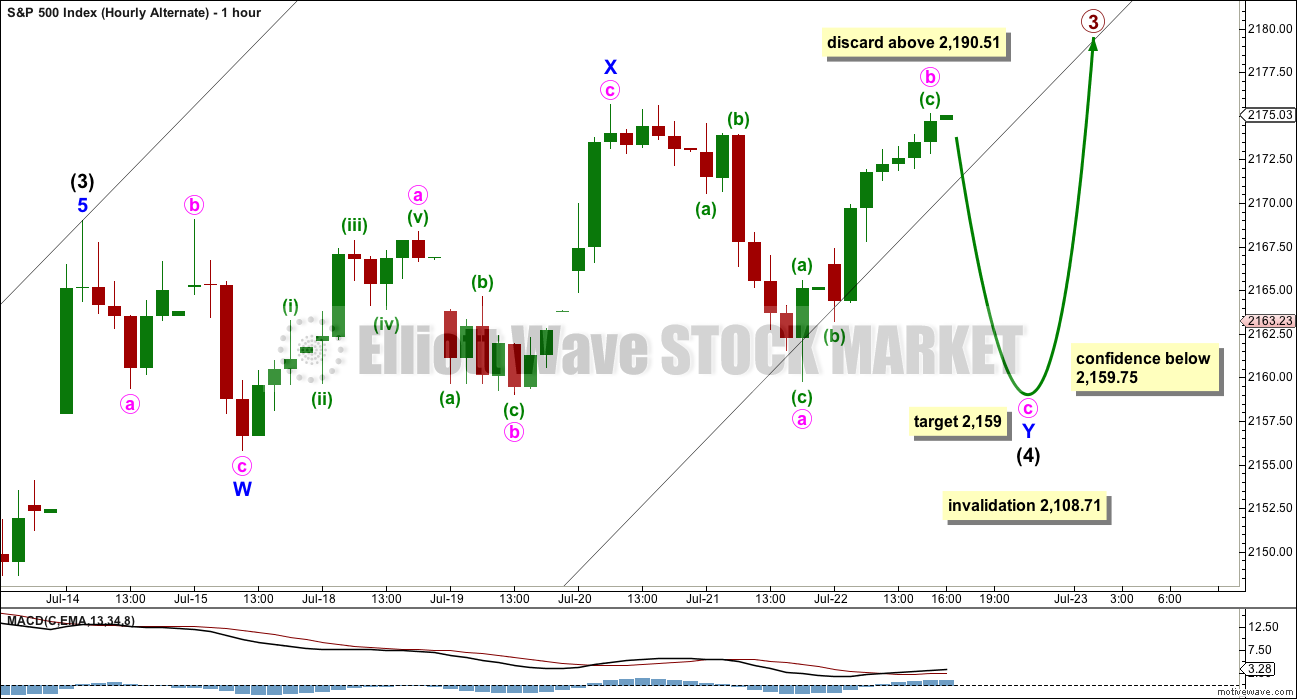
If the triangle is invalidated, then it may be that intermediate wave (4) is continuing as a double flat correction.
The first flat in the double is a regular flat correction labelled minor wave W. The double may be joined by a three, a zigzag in the opposite direction labelled minor wave X.
A second flat correction in the double may be continuing sideways. So far it may be a regular flat, but it may continue as an expanded flat if price begins upwards movement on Monday. The normal range for minute wave b within a flat would be 1 to 1.38 the length of minute wave a, giving a range from 2,175.63 to 2,181.66.
When minute wave b is more than twice the length of minute wave a, then the idea of a flat correction should be discarded. That price point would be above 2,190.51.
If minute wave b is over, then at 2,159 minute wave c would reach equality in length with minute wave a. If minute wave b moves higher, then this target must be recalculated.
Intermediate wave (4) may not move into intermediate wave (1) price territory below 2,108.71.
HOURLY CHART – ALTERNATE II
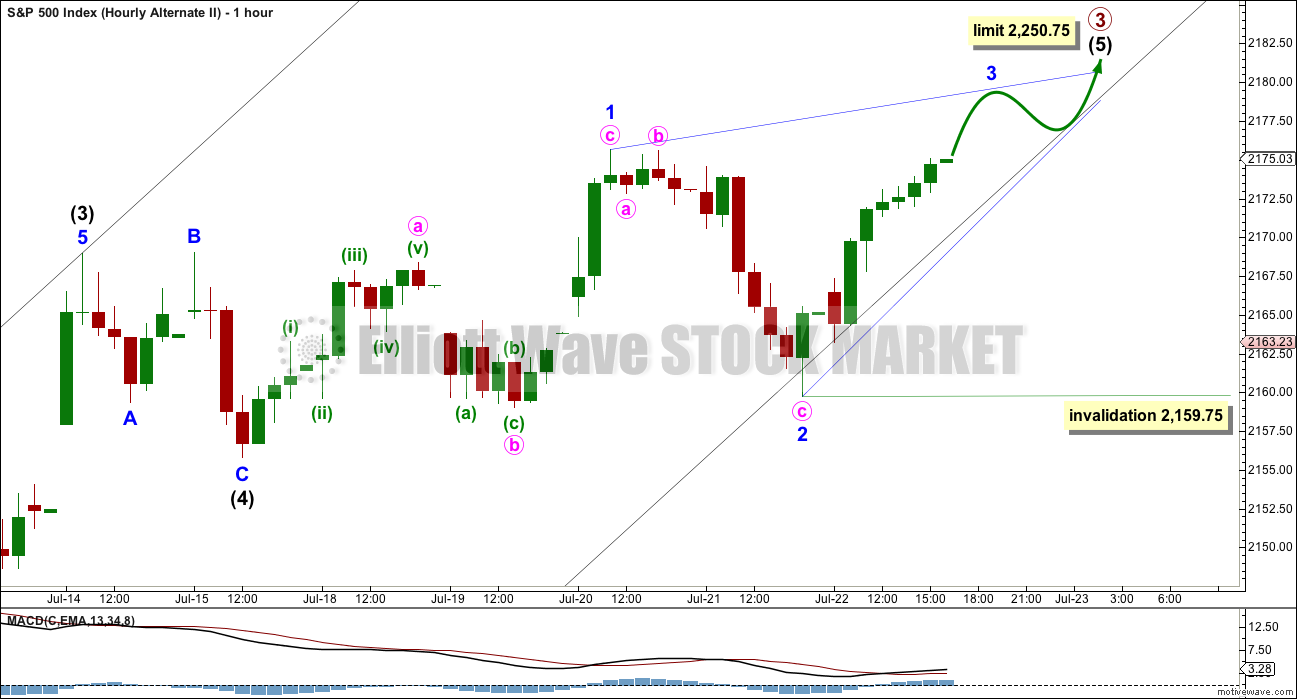
Click chart to enlarge.
It is also possible that intermediate wave (4) was a relatively quick regular flat correction and subsequent choppy upwards movement is an ending diagonal for intermediate wave (5).
Intermediate wave (2) was over in two days as a quick shallow zigzag. This alternate sees intermediate wave (4) as a more shallow and quicker regular flat correction. This is entirely possible, but flats are normally more time consuming than zigzags of the same degree.
For this alternate, intermediate wave (5) is limited to no longer than equality in length than intermediate wave (3) at 2,250.75, so that intermediate wave (3) is not the shortest and this core Elliott wave rule is met.
Ending diagonals require all sub waves to subdivide as zigzags. The fourth wave must overlap first wave price territory but may not move beyond the end of the second wave below 2,159.75.
ALTERNATE WAVE COUNT
WEEKLY CHART
Click chart to enlarge.
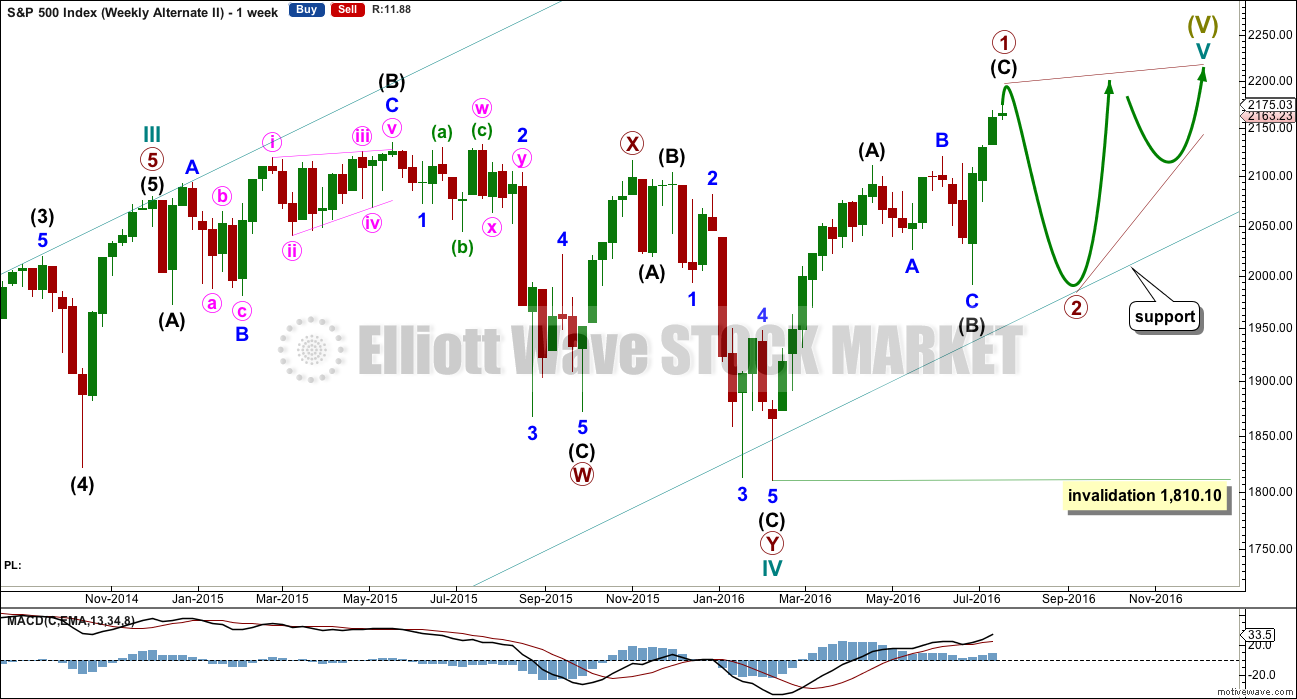
The previous alternate will not be published today in favour of this new idea. Thanks to Gary, EWSM member, for pointing this new idea out. This alternate explains a lot.
The expected direction and depth of a pullback is the same as the prior alternate, so there is no divergence there.
Cycle wave V may be unfolding as an ending diagonal. The most common type of diagonal by a reasonable margin is a contracting diagonal. When primary waves 1 and 2 are complete, then primary wave 3 would most likely be shorter than primary wave 1. If primary wave 3 were to be longer than primary wave 1, then the less common variety of an expanding diagonal would be indicated.
Within an ending diagonal, all the sub-waves must subdivide as zigzags and the fourth wave must overlap back into first wave price territory. The whole structure is choppy and overlapping with a gentle slope. The classic pattern equivalent is a rising wedge.
The zigzag of primary wave 1 may be either complete here, or more likely requires a final fifth wave up as per the main daily wave count. Thereafter, a deep zigzag for primary wave 2 should unfold. It may find support at the lower edge of the teal channel copied over from the monthly chart.
When the end of primary wave 1 is clear, then a target range for primary wave 2 would be calculated. It would most likely be between 0.66 to 0.81 the length of primary wave 1. Primary wave 2 may not move beyond the start of primary wave 1 below 1,810.10.
Ending diagonals have corrective characteristics as they subdivide into a series of zigzags. Ending diagonals contain uncertainty; the trend is unclear as they unfold due to the deep corrections of their second and fourth waves. They are terminal and doomed to full retracement. This may explain some persistent weakness to this upwards trend at this time. The final target at 2,500 for the main wave count would be far too optimistic if this alternate is correct and the diagonal is contracting.
Third waves of even diagonals should still be supported by volume and should still exhibit stronger momentum than the first wave.
Note about the prior weekly bear chart: This idea will not be published at this time for the sake of clarity. It does not diverge at this stage with the bull wave count, and would not diverge for several years.
TECHNICAL ANALYSIS
WEEKLY CHART
Click chart to enlarge. Chart courtesy of StockCharts.com.
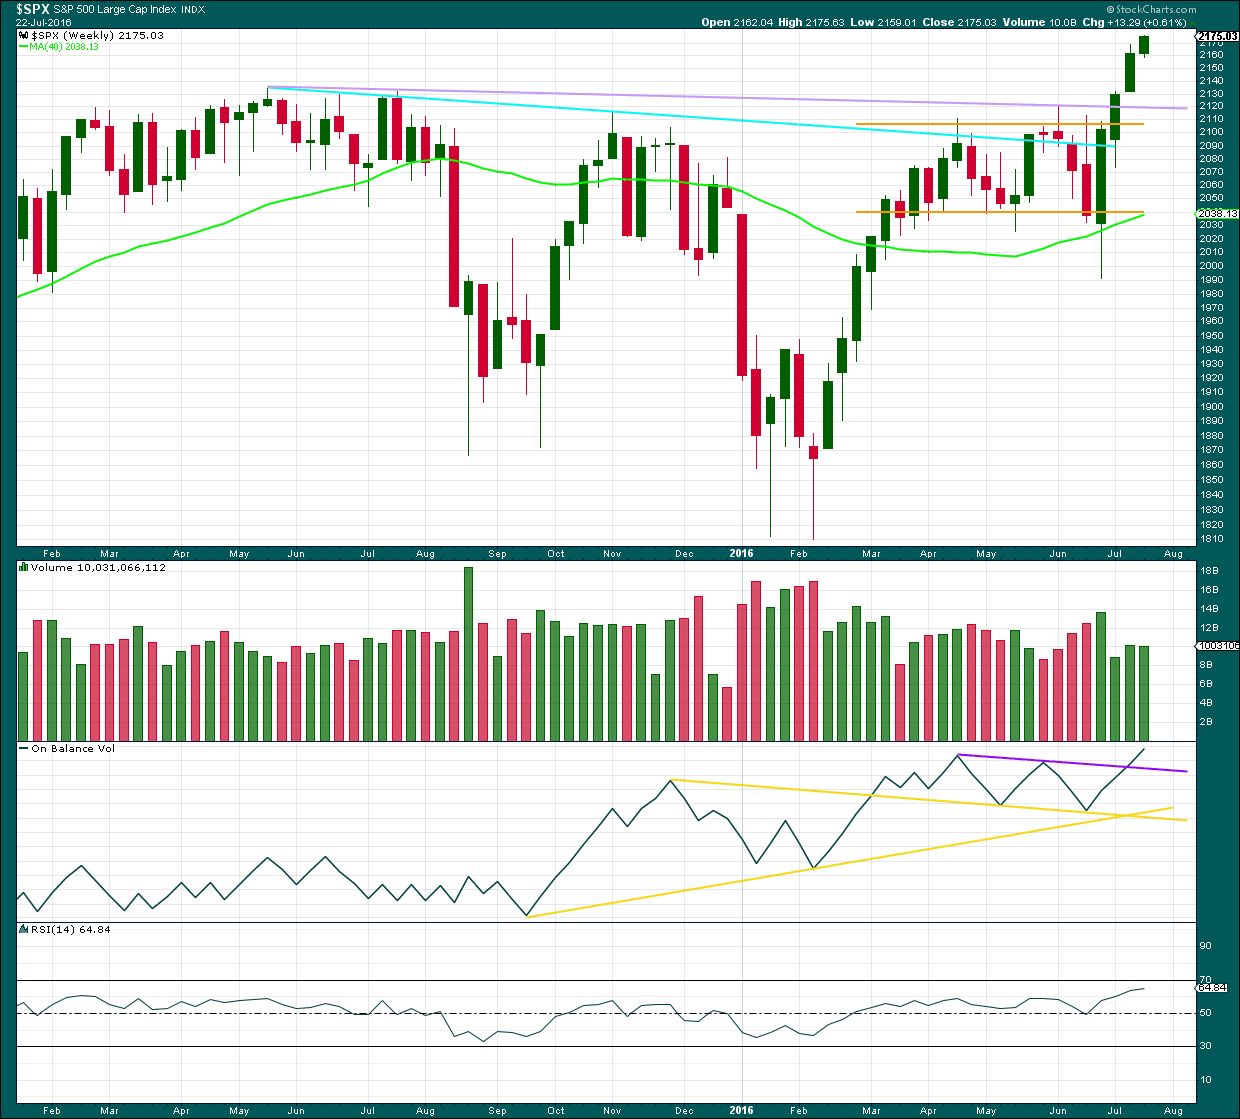
At the end of this week, another green weekly candlestick completes with a slight decline in volume. The last three weekly candlestick patterns now complete a stalled pattern. This is a bearish reversal pattern, so some caution about this upwards trend is warranted. A trend change to either sideways or down may occur here. This offers a little support to the main Elliott wave count and the first and second hourly charts.
On Balance Volume is still bullish at the weekly chart level. If OBV turns down and breaks below the purple line, that would be a bearish signal.
RSI is not yet overbought at the weekly chart level. There is still room for price to rise.
DAILY CHART
Click chart to enlarge. Chart courtesy of StockCharts.com.
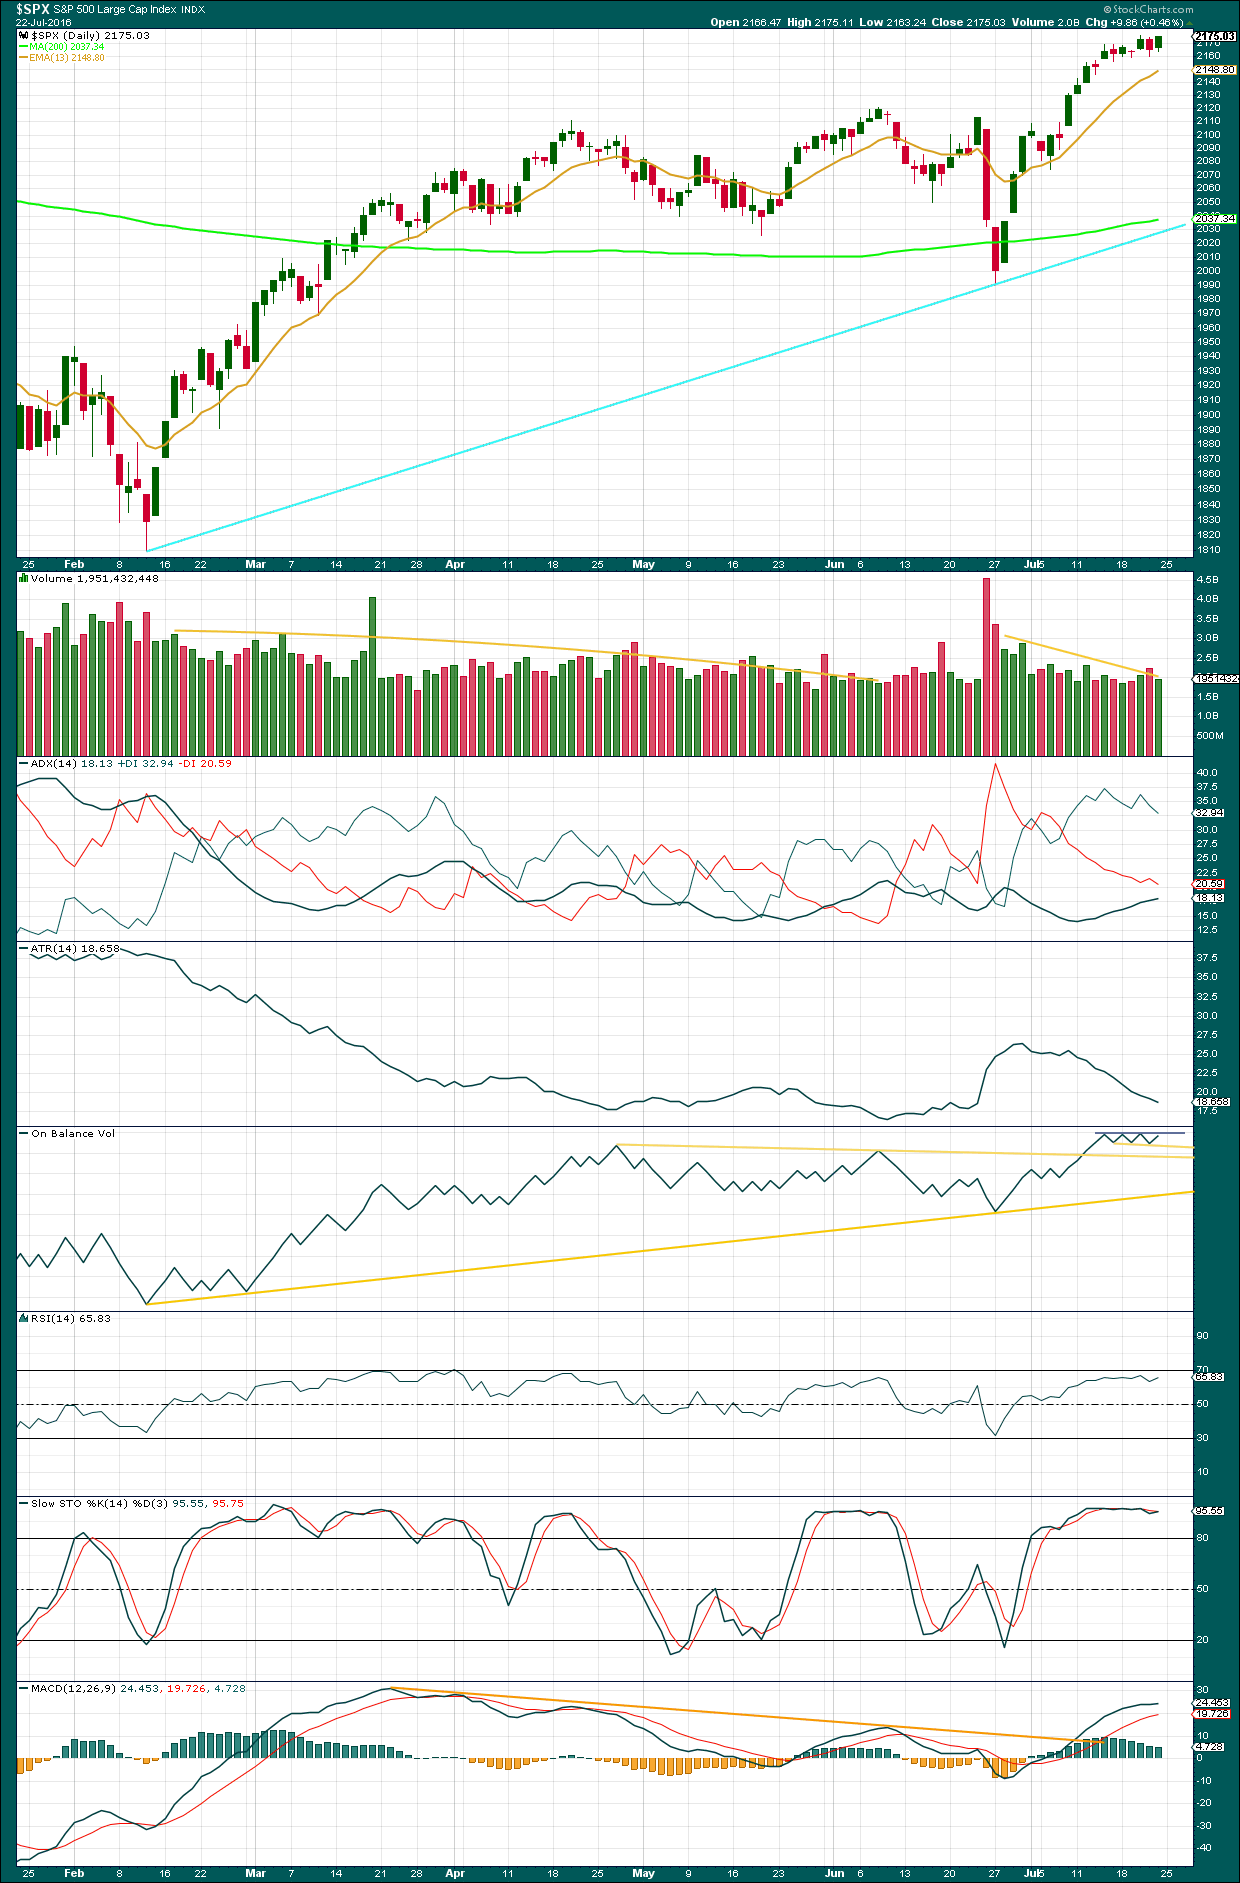
For the first time in several days, since the downwards day of 5th of July, a red daily candlestick is completed which shows some increase in volume. For the first time in a while, there was support for downwards movement of 21st July in price. This strongly suggests at least a little more downwards movement short term.
The next session for Friday 22nd July completes a bullish candlestick with lighter volume than the prior downwards day. At the end of the week, the short term volume profile is again bearish.
A trend change from up to either sideways or down is indicated by the bearish engulfing candlestick pattern of 21st July, but the following bullish candlestick for 22nd July puts this signal in some doubt.
ADX is still increasing, indicating an upwards trend is in place, but this is a lagging indicator. The upwards trend is still in its infancy as ADX is between 15 to 20.
ATR is still declining in disagreement with ADX. This upwards trend is weak; each day the bulls pushed price higher but each day the distance travelled was less and less. That is not normal for a healthy sustainable trend.
RSI has not reached overbought, so a bigger deeper pullback is not yet indicated.
Stochastics has reached overbought. Some smaller correction about here may resolve this.
MACD still exhibits longer term bearish divergence with price, but at this time divergence is particularly unreliable. MACD does indicate there was some reasonable momentum to the upwards trend.
On Balance Volume remains constrained within two short term trend lines, the upper line providing resistance and the lower yellow line providing support. If OBV breaks below the lower yellow line, that would be a weak bearish signal. OBV needs to break below either of the longer yellow support lines for a deeper pullback in price to be indicated. A break above the upper line (grey, but StockCharts keeps changing it from purple) providing resistance would be a weak bullish signal from OBV and would substantially reduce the probability of a deeper pullback here.
The picture is mixed at the end of this week. The volume profile is short term bearish but the candlestick pattern is not so clear. A small consolidation may be more likely than a deep pullback here. If that is what happens, then it should be used as an opportunity to join the trend. The trend is up.
VOLATILITY – INVERTED VIX MONTHLY CHART
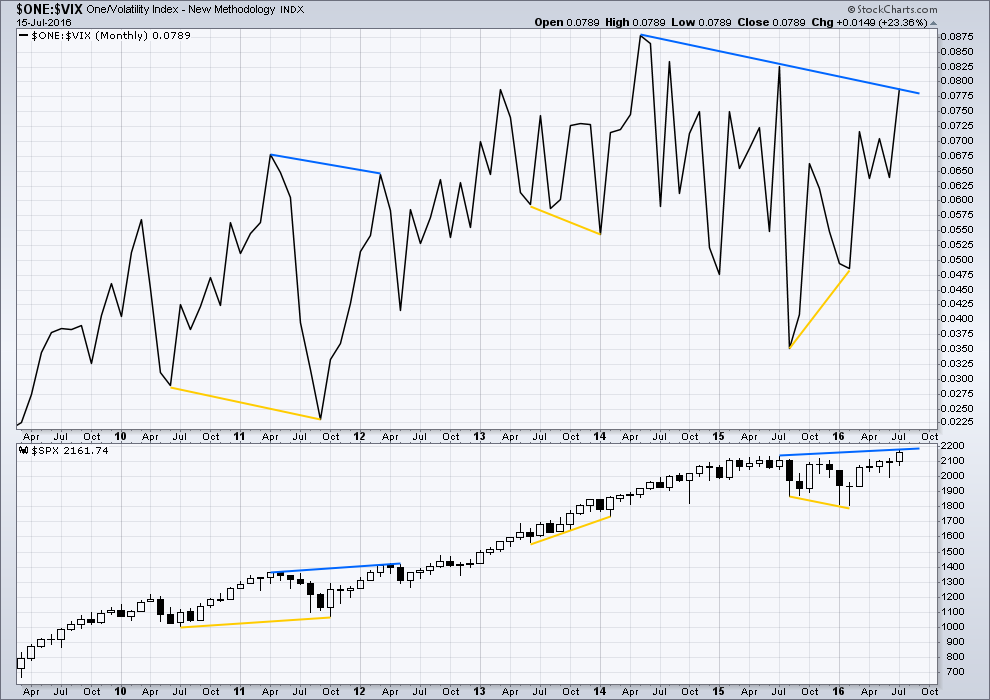
Click chart to enlarge. Chart courtesy of StockCharts.com.
VIX from StockCharts is inverted. As price moves higher, inverted VIX should also move higher indicating a decline in volatility which is normal as price moves higher. As price moves lower, inverted VIX should also move lower indicating an increase in volatility which is normal with falling price.
There is still strong multi month divergence with price and VIX. While price has moved to new all time highs, this has not come with a corresponding decline in volatility below the prior all time high at 2,134. This strong multi month divergence between price and VIX indicates that this rise in price is weak and is highly likely to be more than fully retraced. However, this does not tell us when and where price must turn; it is a warning only and can often be a rather early warning.
At this time, although divergence with price and VIX at the daily chart level has been recently proven to be unreliable (and so at this time will no longer be considered), I will continue to assume that divergence with price and VIX at the monthly chart level over longer time periods remains reliable until proven otherwise.
This supports the idea that price may be in a fifth wave up. Divergence between the end of a cycle degree wave III and a cycle degree wave V would be reasonable to see. Fifth waves are weaker than third waves. This strong divergence indicates that price targets may be too high and time expectations may be too long. However, it remains to be seen if this divergence will be reliable.
DOW THEORY
Major lows within the prior bull market:
DJIA: 15,855.12 (15th October, 2014) – closed below on 25th August, 2015.
DJT: 7,700.49 (12th October, 2014) – closed below on 24th August, 2015.
S&P500: 1,821.61 (15th October, 2014) – has not closed below this point yet.
Nasdaq: 4,117.84 (15th October, 2014) – has not closed below this point yet.
Major highs within the new bear market:
DJIA: 17,977.85 (4th November, 2015) – closed above on 18th April, 2016.
DJT: 8,358.20 (20th November, 2015) – has not closed above this point yet.
S&P500: 2,116.48 (3rd Nobember, 2015) – has now closed above this point on 8th June, 2016.
Nasdaq: 5,176.77 (2nd December, 2015) – has not closed above this point yet.
Dow Theory Conclusion: Original Dow Theory still sees price in a bear market because the transportations have failed to confirm an end to that bear market. Modified Dow Theory (adding S&P and Nasdaq) has failed still to confirm an end to the old bull market, modified Dow Theory sees price still in a bull market.
This analysis is published @ 02:10 a.m. EST on 23rd July, 2016.
The triangle looks good so far. I’m going to now take a look at the 5 minute chart and see if I can figure out how this move down subdivides…
Thanks Lara. As I am looking forward to it.
Would love to see how many waves you think we got down from Friday’s high. I only see and this is 2. I could have shorted a of B and this could be c of B now….who knows. this market is tough!
so it has a cursory count of 11, and I can see a zigzag.
I can also see it as an impulse, with a small ending contracting diagonal at the end.
Another instance when it’s going to be impossible to determine with certainty if this move is a three wave zigzag or a five wave impulse.
For analysis of the hourly chart I’ll go with a three and label the triangle for intermediate (4) over now. But I’ll set the stop at the low of minor C at 2,159.75 to allow E time to move sideways and very slightly lower.
E waves very commonly fall short of A-C trend lines. So if this is a complete triangle it has a really good look.
It’s a barrier triangle and so the next wave up may be surprisingly short and brief. It also has a limit, intermediate (5) may not be longer than (3).
Unless we are looking at an incredible bear trap, that big bet on Apple someone made a few weeks ago looks like it may go up in smoke. The smart money seem to be expecting a disappointing earnings report…
My trading style in a nut shell…..
I believe in EW theory, but trading with price projections can be hazardous to your P&L…IMO. With that being said, we know that prices move in 3 or 5 waves. 3 if corrective (a-b-c), 5 if impulsive. In any case, if I missed the first move (like this one from Friday because I got stopped out). I wait for a rally (counter trend move) to re-position. Call it a 2 wave if it’s impulsive or a b wave if corrective.
My objective is to only catch the c wave or 3 wave of the move. I don’t have to know the count (i’m horrible at it anyhow), I just need to know that prices move in 3 or 5 waves. Even with this style of momentum trend trading I am wrong plenty, however, money management saves me when I am wrong.
C waves and 3 waves tend to be the bigger moves of their sets anyhow.
GLTA!
I agree. C or third waves are also decisive. The earliest red flag that one may be wrong about them is when there is hesitancy in the move. I consider the kind of price action we are seeing today as being of the latter beast, i.e.. corrective as opposed to impulsive. We should know tomorrow…! 🙂
Thank you for sharing this gem Quang Vo.
For less experienced members, I’ll draw your attention to
“money management saves me when I am wrong”
It is the single most important aspect of trading. Even a poor strategy can be turned profitable through good money management.
Always use stops. Never invest more than 3-5% of equity on any one trade. If you learn nothing else but these two rules from me then I would have done a good job.
Thanks Quang Vo, it’s good to have this message about money management repeated from members who are clearly very experienced.
Sounds like a good plan. It is difficult to assess at this point what will transpire. I think the fed will find it difficult to raise rates with the dollar getting stronger against other currencies. If that occurs, fed keeps unchanged, markets may move up in knee jerk reaction. Then there is that contrarian 90 percent bullish reading and high amount of calls. Perhaps we back and fill until the fed announces they won’t do anything and then we get a spurt up. After that we should have some irrational exuberance. Reality of earnings will set in and with the stochastic so already overbought I can’t imagine it will last too much longer if moving up. Then there are all the wrenches that can get thrown in…..fed raises? Japan loosens? The end game is getting near, not a lot of moves on the board when all the fed has is their king and a pawn. Like you I feel this one is ready to pop soon… But no resistance above…yet low volume moves up…..if we don’t start getting some up vol soon may be Time to put some more med term puts in……election years suck.
And you have not even mentioned a possible “black swan”…! 🙂
Looking for a trigger from silver to trade the very worst leveraged ETF ever designed…yep…the detestable DUST!
If silver breaks 19.21, DUST is going to at least 15.00 in the next 30 days imho…
Selling GDX 27.50 puts for a double. I’m a bit concerned about Lara’s call for a strong move up in Gold so I am taking the money and run. I think we do have a bit more downside though. If silver breaks 19.21 will reload short on miners….
Looks to me like its giving you a chance to exit that short trade before it blows past your stop….
Haaa, wouldn’t be the first time I got stopped out. I can’t get rid of my bearish glasses. I have tried, but everything I see tells me we go lower from here.
Here’s my problem with that view. In 99% of cases when you have a break from a long time pivot (around SPX 2100 area), you get a quick return to test it before that move up really takes off. The fact that we are consolidating so far above that pivot makes it unlikely we are going to see any strong downward movement until the top is in. I think unless you are really nimble, short trades under the circumstances is a long shot….just my two cents….
We go down Verne…IMHO.
It’s what I see…I can’t explain it. I could be wrong, but as of this very moment..I see us going down from here. I use stops, to protect when I am wrong, and I’m wrong enough. I don’t mind losing 1-6 points as long as I win 10-25. I just need to be 50/50 and I’m good.
I am rooting for ya dude. I would be happily stopped out with a SPX close below 2060. If that happens I think a re-test of 2100 would be a good bet.
lowering my stop to 2160.25. Can’t loose now, shorted 50 contract at 2160 and another 25 at 2161 for a b/e of 2160.33.
Now sell off already.
just added another 1/4 at 2161.
fishing for a short on this rally. Finally just got short 1/2 position at 2160. Using a 6 point stop here.
A tight stop is good! 🙂
I think the next move up is going to be quite sharp so I would watch that position like a hawk. It could blow past your stop….the trend is now up…
Rolling USO puts on nice 40% pop…
The way they are screwing with the strike prices on UVXY is bordering on criminal. I just don’t understand why they are doing this- but then again I guess I do. There is absolutely no reason those strikes should not be reflecting the split adjusted price UVXY is trading at today. What a crock. And now they have the nerve to show a new 52 week low at 29.63! I am adding a few more puts.
These darn banksters stopped me out of this move on Friday. So as I see this move go 12 points in my original direction, all I can do is watch. Waiting for a rally to re-evaluate and re-enter.
Unless this is e, then will look to get long…..maybe. Still having a tough time getting long.
This move down on the presumable wave e of the triangle should complete today. It looks to me like it has moved far and fast enough to not be expected to continue for another session.
if this is e, shouldn’t we see 3 wave? I only see 1 wave down so far.
I am have just about given up on trying to count the waves. I have missed a lot of market turns because I was looking for the expected count to complete. I now prefer to look at important pivot points when trying to make trading decisions and Lara’s down side target for e was already met.
I had to drill down to 2 minute charts and could only then stretch my imagination to see five waves down. Maybe this is just wave-a down and wave-b up in progress, then wave-c down to fractional new low to buy a little more time.? How I drool for a sustained trend!
The banksters seem determined to not let us enjoy any such luxury. I am just about ready for an extended break from the non-stop whipsaws. I am going to turn off my screens at the end of this week and wait for overnight futures down the maximum 5%. One quick daily check of positions ought to be more than enough time spent ogling a manipulated market…
Holding my nose and buying August 5 expiration SPY 216.50 calls at 1.55 per contract.
Opened contingency order to sell on SPY close below 2060. Plan is to roll half of contracts after at least a 20% gain to ride remaining move higher at reduced risk. Maintaining long VIX position.
Strike quotes on option stings for UVXY not yet adjusted to reflect RS so bid/ask quotes look a bit strange for the moment. If the main EW count is correct, it should trade down into the mid teens by the end of the fifth wave up. The RS in this case signaled that the bull was alive and well for the moment. Correct quotes on strike prices should be posted in a few days. I sometimes wonder if this delay is not designed to confuse traders who want to short the ETF. After all they knew this was coming several weeks ago and could have the proper quotes for the adjusted split price prepared well in advance of the split.
Just to keep ’em honest I am buying the August 19 30 strike put at the market (one contract) for 26.10. This is obviously being bid as if the split had not taken place and UVXY was still trading for around 6.00. Very sneaky imo.
Selling August 17 12.50 calls against VIX long position for 3.40 per contract.
Lowers cost basis on VIX long position to 9.10 per share…
Verne are you bullish here?
I am having a really tough time trading on the long side with any real size….. Find myself staring most of the time.
I am as bearish as all get-out Quang Vo. The long trade goes against a lot of my trader instincts but those are often the kind of trades that pay. There is no doubt in my mind whatsoever about how this is all going to end but I think the banksters are going to be able to juice things just a bit higher. I am only trading 50 lots as I don’t want too much exposure to the upside. Hedged with lots of VIX shares. I expect something very ugly and very sudden from this zombie market and I think most folk are going to get caught with their you-know-what exposed.
BTW, I have also called the banksters bluff with a ton of leap FAZ (2017) contracts. The financial sector is toast, I don’t care how many new 52 week lows FAZ makes. I am willing to wait ’em out…
volume this am is higher then Friday am’s volume…well at least in the es.
Good afternoon all. Just now getting back to doing some home work from the weekend.
Nothing new to the members of this board, but I came across this little interesting article…….
“The current P/E expansion cycle is now one of the largest in history. Since September 2011, S&P 500 forward P/E has grown by 75% (from 10x to 18x). This expansion has only been surpassed twice since 1976, when the multiple rose by 111% from 1984-1987 (ending with the 22% Black Monday collapse) and by 115% from 1994-1999 (ending with the Tech Bubble pop). During the nine previous P/E expansion cycles the multiple typically climbed by 50%.”
http://www.zerohedge.com/news/2016-07-23/goldman-last-two-times-pe-multiples-expanded-much-result-was-historic-crash
I guess…im first! Premier