A bounce was expected short term for Monday / Tuesday but did not turn up on Monday.
The mid term target at 2,000 was met and exceeded by 8.32 points.
Summary: In the short term, it looks very likely today (more so than the end of last week) that a multi day bounce may begin tomorrow. It is likely to remain below 2,050.37. If it moves above this point, then it should stay below 2,113.32. The target for it to end is about 2,038.15 in about three days time.
Trading advice (not intended for more experienced members): Profits may be taken now for short positions opened below 2,050.37. For short positions opened close to 2,113 or above, traders with a longer horizon may like to still hold onto those. If price bounces up as expected, wait for it to be complete then enter short for the next wave down. It is strongly advised for inexperienced traders to not take long positions; stick with the trend, the trend is down.
Stops (and risk) for longer term positions may now be moved down to just above 2,050.37.
Last published monthly charts are here.
New updates to this analysis are in bold.
BEAR ELLIOTT WAVE COUNT
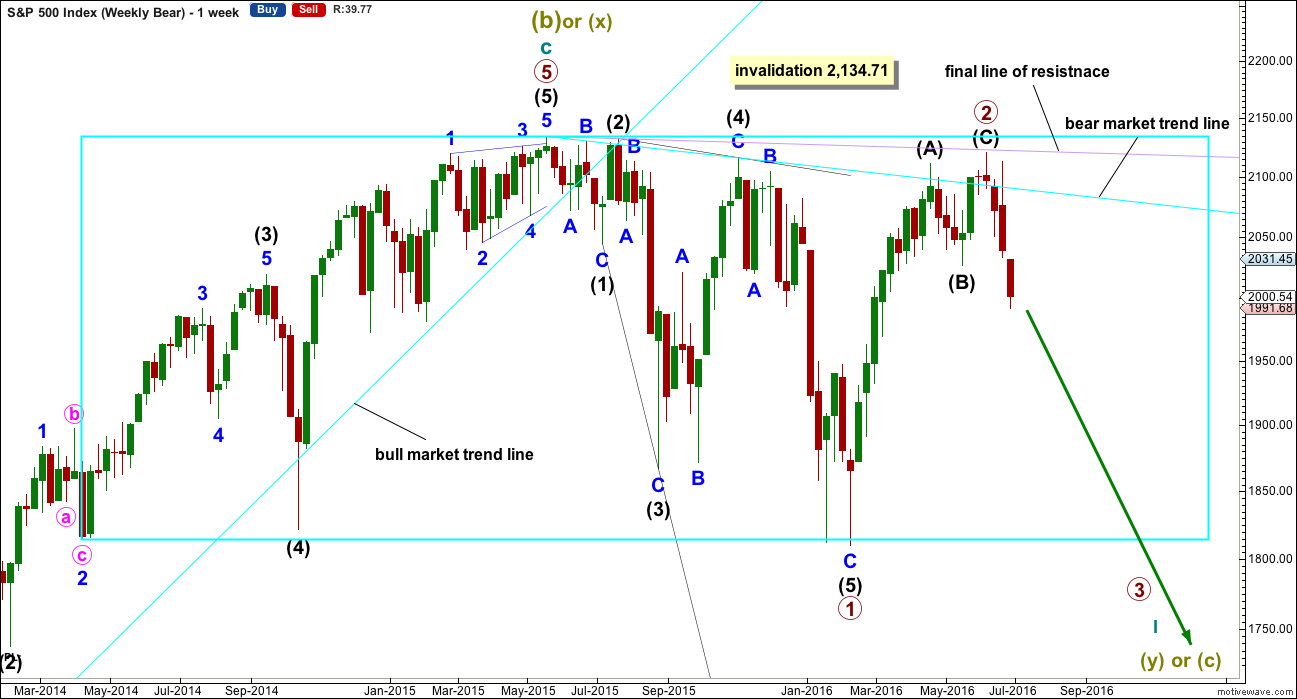
WEEKLY CHART
The box is added to the weekly chart. Price has been range bound for months. A breakout will eventually happen. The S&P often forms slow rounding tops, and this looks like what is happening here at a monthly / weekly time frame.
Primary wave 1 is seen as complete as a leading expanding diagonal. Primary wave 2 would be expected to be complete here or very soon indeed.
Leading diagonals are not rare, but they are not very common either. Leading diagonals are more often contracting than expanding. This wave count does not rely on a rare structure, but leading expanding diagonals are not common structures either.
Leading diagonals require sub waves 2 and 4 to be zigzags. Sub waves 1, 3 and 5 are most commonly zigzags but sometimes may appear to be impulses. In this case all subdivisions fit perfectly as zigzags and look like threes on the weekly and daily charts. There are no truncations and no rare structures in this wave count.
The fourth wave must overlap first wave price territory within a diagonal. It may not move beyond the end of the second wave.
Leading diagonals in first wave positions are often followed by very deep second wave corrections. Primary wave 2 would be the most common structure for a second wave, a zigzag, and fits the description of very deep. It may not move beyond the start of primary wave 1 above 2,134.72.
So far it looks like price is finding resistance at the lilac trend line. Price has not managed to break above it.
I have two Elliott wave counts at the daily chart level. Only one will have an hourly chart; a second will be added when the daily wave counts materially diverge.
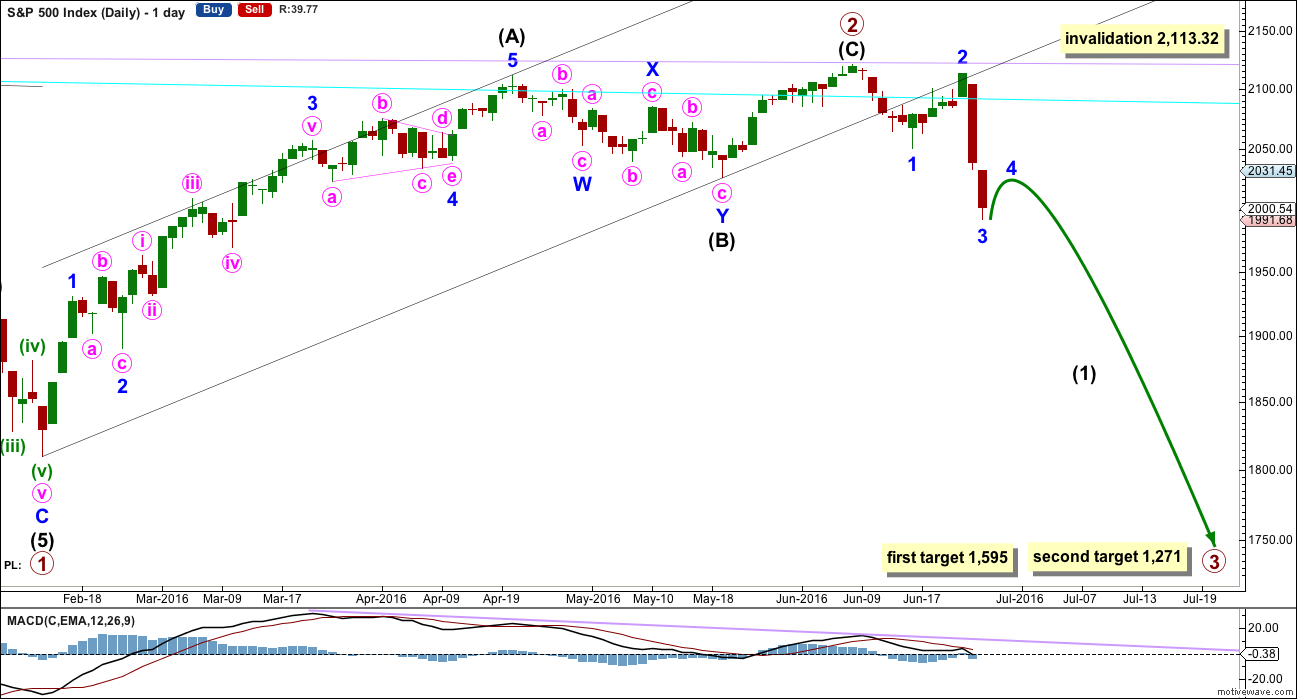
DAILY CHART
Primary wave 2 may have been a zigzag over earlier on 7th of June at 2,120.55. Thereafter intermediate wave (1) may be underway.
Within intermediate wave (1), minor wave 3 may have ended today 8.32 points below the target which was at 2,000. Minor wave 3 is 8.09 points longer than 1.618 the length of minor wave 1.
Minor wave 2 was a very deep 0.90 double zigzag correction lasting a Fibonacci five days. Given the guideline of alternation, minor wave 4 may be expected to be shallow and maybe quicker too than minor wave 2. Minor wave 4 may be expected to be a flat, combination or triangle and may last a Fibonacci three, five or maybe even eight days, with a Fibonacci three days the expectation as most likely at this early stage. The downwards pull of a third wave should now be getting stronger, and past behaviour of the S&P in a bear market shows more time consuming second wave corrections than fourth wave corrections. This does not have to be the case here of course, but we should anticipate it as very likely.
After a bounce for minor wave 4, then minor wave 5 down would most likely be about 70 points in length if it reaches equality with minor wave 1. That would complete a five down for intermediate wave (1), which should be followed by a deeper more time consuming correction for intermediate wave (2).
Bear markets do not move price in a straight line. They have deep corrections along the way which must be anticipated. At this stage, future deep corrections may find strong resistance about the cyan trend line. I would not expect the lilac line to be tested again. If it is, it would offer final resistance, and I would not expect it to be breached at all. This means that any short positions opened above 2,100 may remain profitable for a very long time indeed, if traders would like to hold onto them.
Targets for primary wave 3 remain the same. At 1,595 primary wave 3 would reach 1.618 the length of primary wave 1. If price keeps falling through this first target, or if when price gets there the structure is incomplete, then the next target is at 1,271 where primary wave 3 would reach 2.618 the length of primary wave 1. The lower target is more likely because primary wave 2 was very deep at 0.96 of primary wave 1.
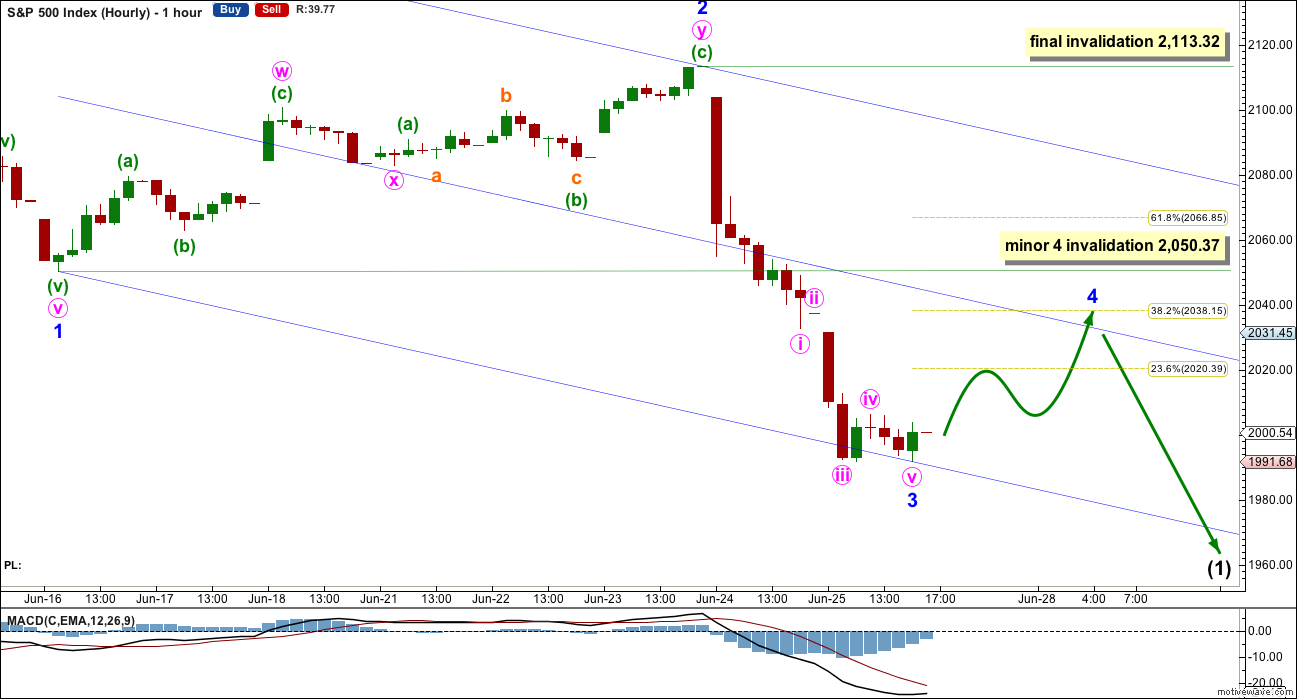
HOURLY CHART
Minute waves iii, iv and v subdivide perfectly on the five minute chart. Minor wave 3 looks today to be over. Minor wave 4 should be expected to show up tomorrow and last a few days.
Because minor wave 3 is close to 1.618 the length of minor wave 1, it is labelled as complete today.
Ratios within minor wave 3 are: minute wave iii has no Fibonacci ratio to minute wave i, and minute wave v is just 0.87 points longer than 0.236 the length of minute wave iii.
If the degree of labelling within minor wave 3 is correct, then the bounce expected to begin tomorrow may not move back up into minor wave 1 price territory above 2,050.37. Minor wave 4 may be a flat, combination or triangle most likely. It may end about the 0.382 Fibonacci ratio of minor wave 3 at 2,038, which is about the mid line of the Elliott channel drawn here.
If the degree of labelling within minor wave 3 is moved down one degree, then it may be that today’s low was only minute wave i of minor wave 3. This is less likely, but still possible. If this is the case, then the bounce expected to begin tomorrow may be another deep second wave correction. Minute wave ii may not move beyond the start of minute wave i above 2,113.32. This is the final invalidation point for this wave count for this reason.
ALTERNATE DAILY CHART
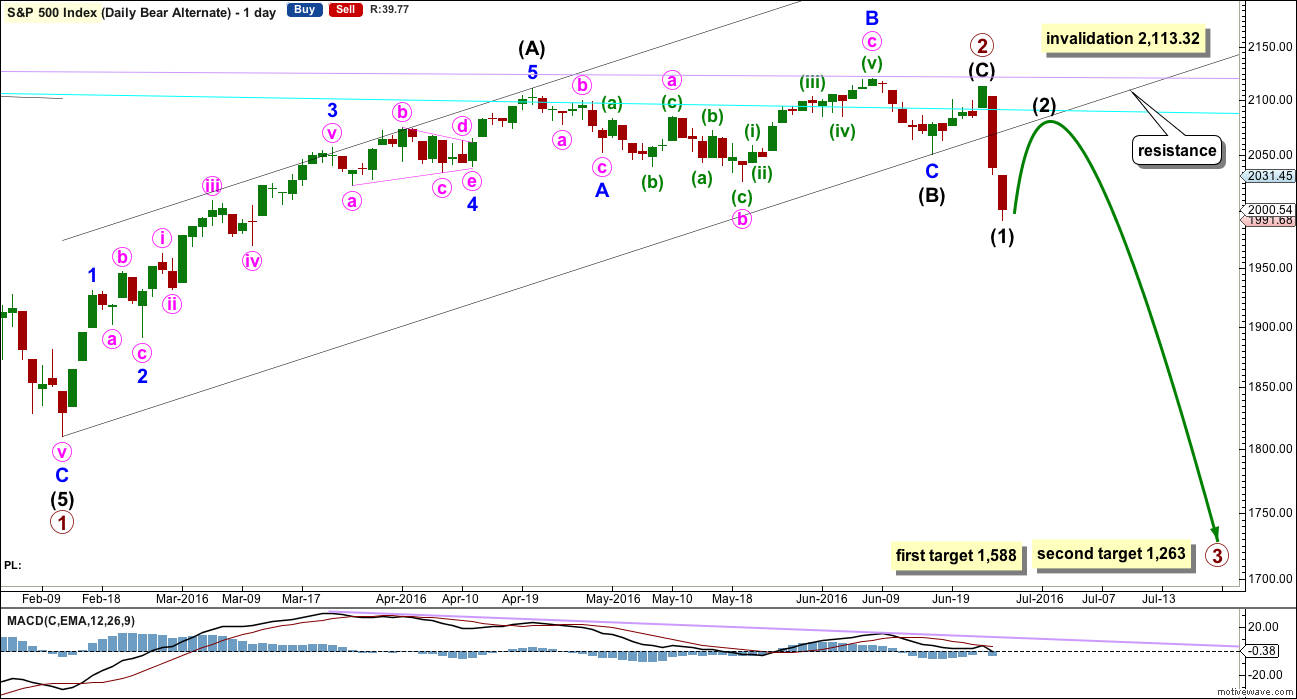
Primary wave 2 is relabelled. Intermediate wave (B) within it may have been more time consuming than previously expected. It subdivides as an expanded flat, minor wave B is a 1.16 correction of minor wave A and there is no Fibonacci ratio between minor waves A and C. Minor wave C ends slightly below the end of minor wave A avoiding a truncation.
Within primary wave 3, no second wave correction may move beyond the start of its first wave above 2,113.32.
At this stage, this alternate does not diverge from the main wave count at the hourly chart level. Both see an impulse downwards complete and both would expect a correction to most likely unfold. Again, look out for continuing surprises to the downside.
This alternate is judged to have a lower probability than the main wave count because it does not have as good a look.
Targets are slightly different for primary wave 3 because for this alternate it begins at a slightly different point. The lower target is still favoured because primary wave 2 was very deep. At 1,588 primary wave 3 would reach 1.618 the length of primary wave 1. At 1,263 primary wave 3 would reach 2.618 the length of primary wave 1.
BULL ELLIOTT WAVE COUNT
WEEKLY CHART
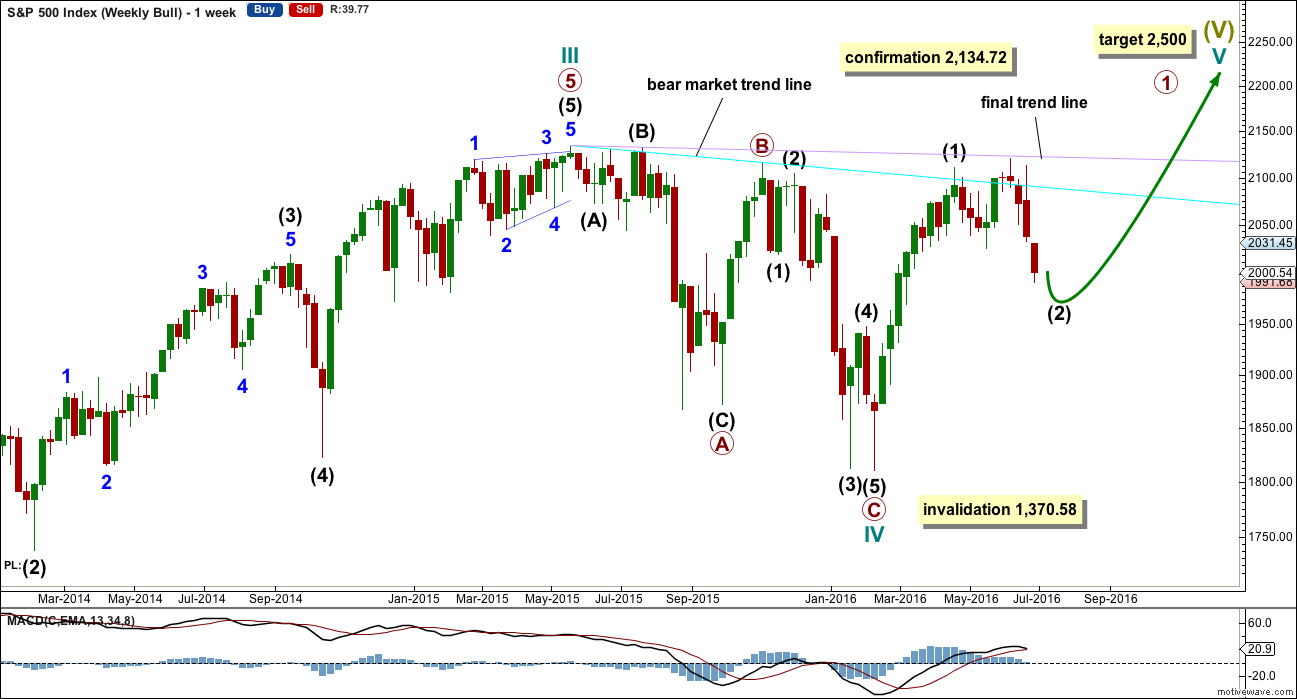
Cycle wave IV is seen as a complete flat correction. Within cycle wave IV, primary wave C is still seen as a five wave impulse.
Intermediate wave (3) has a strong three wave look to it on the weekly and daily charts. For the S&P, a large wave like this one at intermediate degree should look like an impulse at higher time frames. The three wave look substantially reduces the probability of this wave count. Subdivisions have been checked on the hourly chart, which will fit.
Cycle wave II was a shallow 0.41 zigzag lasting three months. Cycle wave IV may be a complete shallow 0.19 regular flat correction, exhibiting some alternation with cycle wave II and lasting nine months. Cycle wave IV would be grossly disproportionate to cycle wave II, and would have to move substantially out of a trend channel on the monthly chart, for it to continue further sideways as a double flat, triangle or combination. For this reason, although it is possible, it looks less likely that cycle wave IV would continue further. It should be over at the low as labelled.
At 2,500 cycle wave V would reach equality in length with cycle wave I.
Price has now broken a little above the bear market trend line. This line is drawn from the all time high at 2,134.72 to the swing high labelled primary wave B at 2,116.48 on November 2015. This line is drawn using the approach outlined by Magee in the classic “Technical Analysis of Stock Trends”. To use it correctly we should assume that a bear market remains intact until this line is breached by a close of 3% or more of market value. Now that the line is breached, the price point at which it is breached is calculated about 2,093.58. 3% of market value above this line would be 2,156.38, which would be above the all time high and the confirmation point.
This wave count requires price confirmation with a new all time high above 2,134.72.
While price has not made a new high, while it remains below the final trend line (lilac) and while technical indicators point to weakness in upwards movement, this very bullish wave count comes with a strong caveat. I still do not have confidence in it. It is produced as an alternate, because all possibilities must be considered. Price managed to keep making new highs for years on light and declining volume, so it is possible that this pattern may continue to new all time highs for cycle wave V.
The invalidation point will remain on the weekly chart at 1,370.58. Cycle wave IV may not move into cycle wave I price territory.
This invalidation point allows for the possibility that cycle wave IV may not be complete and may continue sideways for another one to two years as a double flat or double combination. Because both double flats and double combinations are both sideways movements, a new low substantially below the end of primary wave C at 1,810.10 should see this wave count discarded on the basis of a very low probability long before price makes a new low below 1,370.58.
DAILY CHART
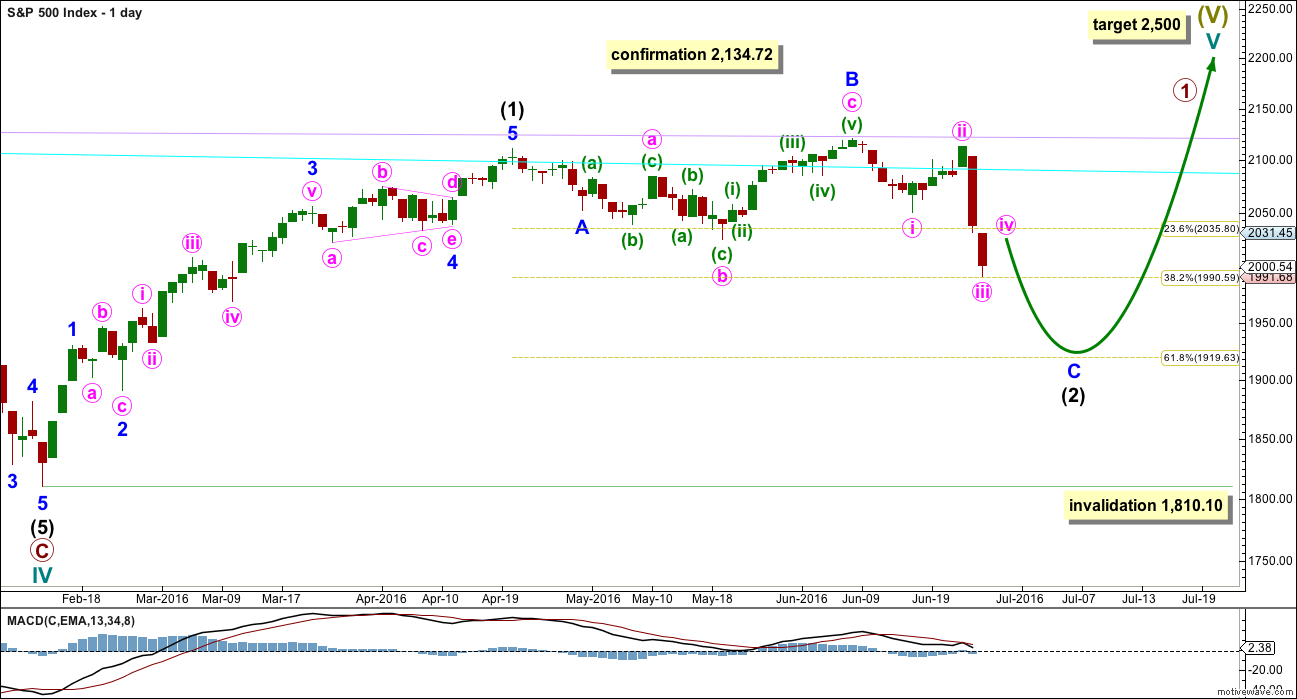
Intermediate wave (2) may be continuing lower. The 0.618 Fibonacci ratio would be a reasonable target at 1,920.
Intermediate wave (2) may not move beyond the start of intermediate wave (1) below 1,810.10.
I still do not have confidence in this wave count. It absolutely requires a new all time high above 2,134.72 before it would be taken seriously. This wave count has no support from classic technical analysis at the monthly chart level.
TECHNICAL ANALYSIS
WEEKLY CHART
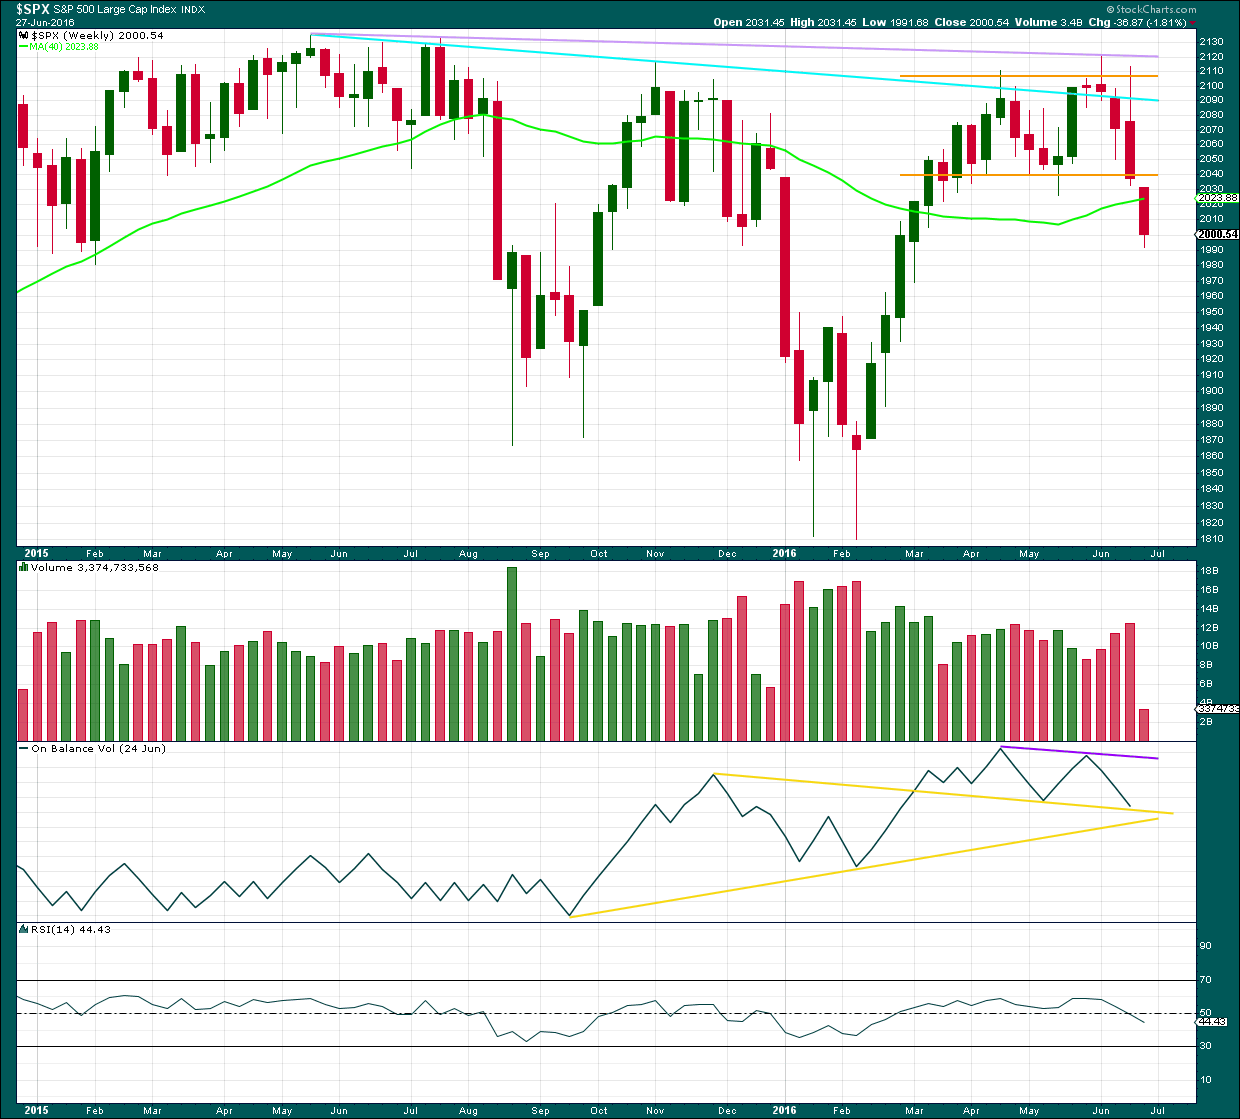
Click chart to enlarge. Chart courtesy of StockCharts.com.
Another strong downwards week is supported by an increase in volume. If next week can remain below the lower orange support line, then a downwards breakout from consolidation would be confirmed.
Overall price is falling on increasing volume For four weeks in a row. This supports a downwards trend.
On Balance Volume trend lines have been redrawn again. OBV may be finding support this week at the first yellow line. This may initiate a bounce next week, but it does not indicate how long the bounce may last for though, only that a bounce here is likely.
RSI is neutral. There is plenty of room for price to fall. This downwards wave may only be considered over when RSI reaches oversold at the weekly chart level, and preferably also exhibits divergence with price at a low. This was seen at both the last two important weekly lows, so it will be expected as likely to show up again.
Price has been range bound for several weeks at the weekly chart level. It is not breaking down below the lower edge of support which is about 2,040 (orange lines). If this week’s session closes below 2,040 with a red weekly candlestick on higher volume, then it would be a classic breakout to the downside.
DAILY CHART
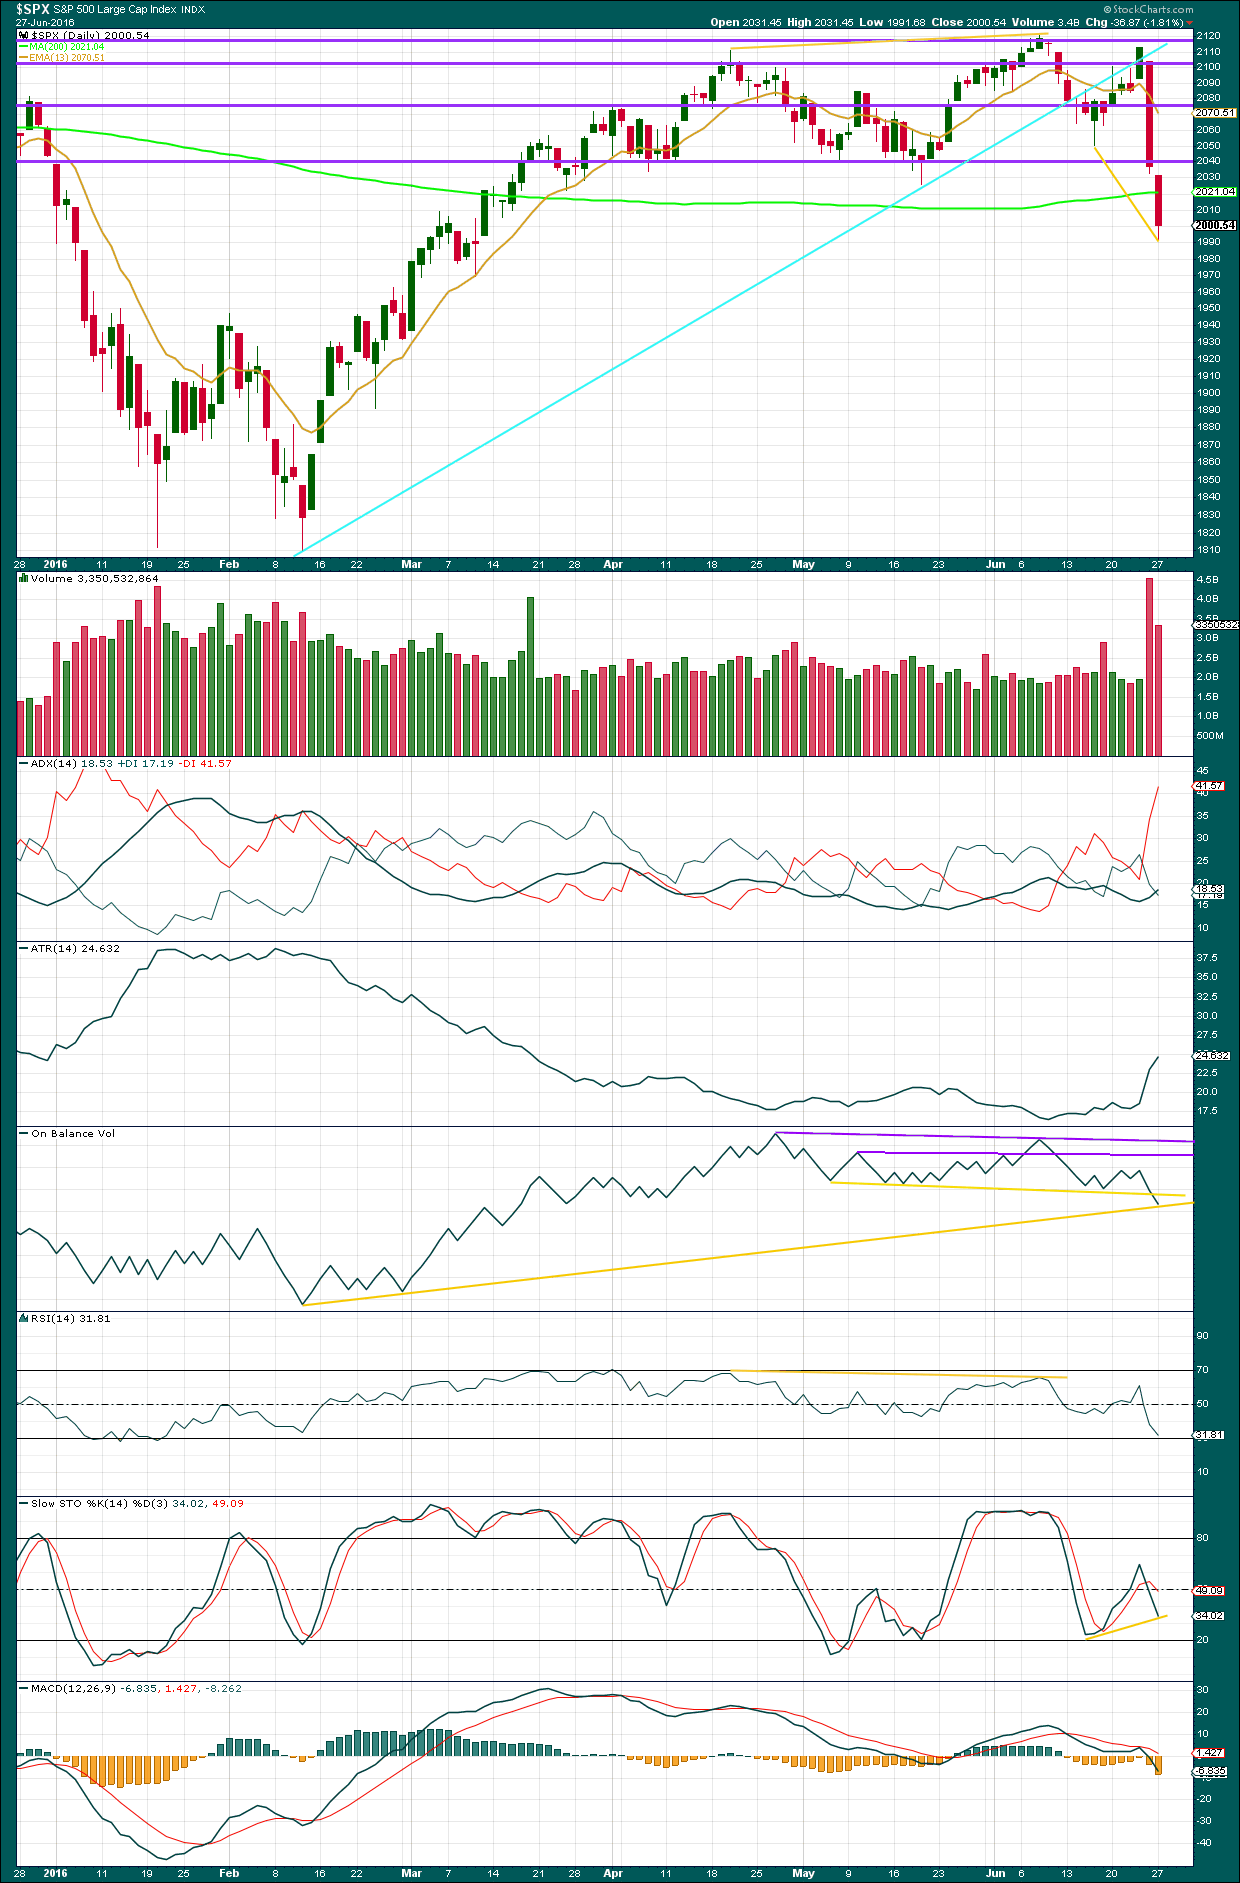
Click chart to enlarge. Chart courtesy of StockCharts.com.
Friday’s strong downwards day came with a strong increase in volume. The fall in price was well supported by volume. There is a clear downwards trend for the S&P at this time.
Price fell today again but comes with a decline in volume (although volume remains very high). There was less support today for the fall in price. This suggests the bears may be getting a little tired and supports the Elliott wave count which expects a bounce to arrive tomorrow.
There is a small lower wick on today’s long red candlestick. That also indicates a little activity from bulls at the end of the session, so they may exert themselves a little more over the next session or two before the bears are ready for the next wave down.
ADX is increasing and the -DX line is above the +DX line. There is a trend and it is down.
ATR strongly agrees as it too is increasing.
On Balance Volume today is very bearish with a break below the yellow line which previously provided support. I have checked today for a lower support line. A new line is added to OBV which has been touched today by OBV and may offer support here. This also supports the idea of a bounce. OBV may find resistance at the first yellow line. This may serve to keep any bounce shallow and this too supports the hourly Elliott wave count.
RSI is not yet oversold. There is still room for price to move lower. A low may be only expected to be in place when RSI reaches oversold and preferably also exhibits some divergence with price at lows. There is no divergence with price and RSI at the lows to indicate weakness in price.
There is some divergence today with price and Stochastics at today’s low and the last swing low. This indicates some weakness to downwards movement. However, divergence between price and Stochastics is not always reliable. Sometimes it disappears. It also does not reliably indicate when price may turn as divergence may develop further before price turns.
VOLATILITY – INVERTED VIX MONTHLY CHART
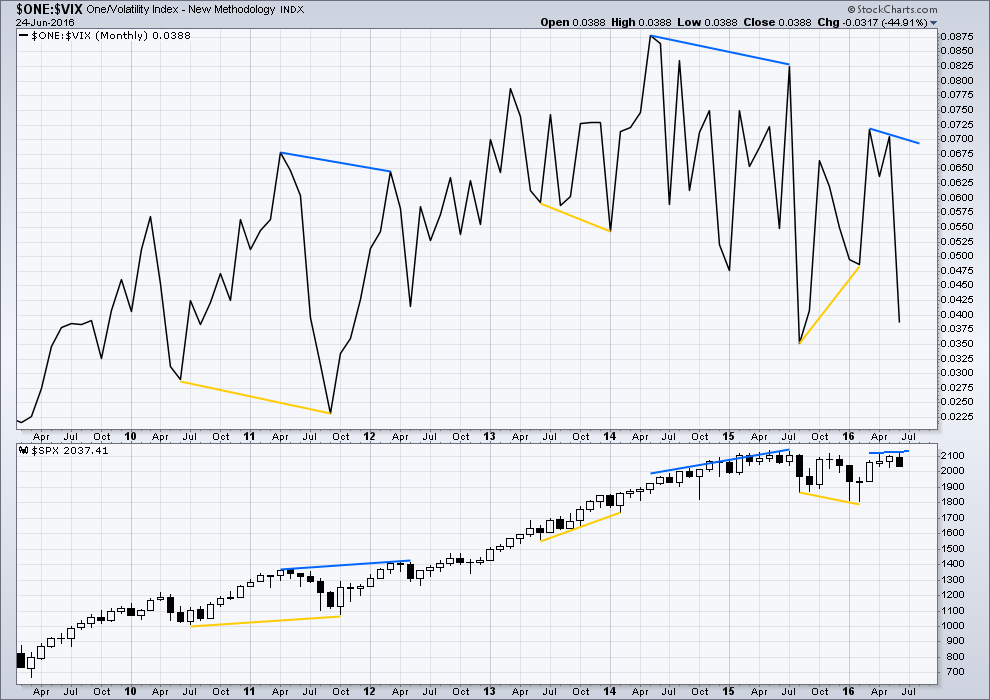
Click chart to enlarge. Chart courtesy of StockCharts.com.
Several instances of large divergence between price and VIX (inverted) are noted here. Blue is bearish divergence and yellow is bullish divergence (rather than red and green, for our colour blind members).
Volatility declines as inverted VIX rises, which is normal for a bull market. Volatility increases as inverted VIX declines, which is normal for a bear market. Each time there is strong multi month divergence between price and VIX, it was followed by a strong movement from price: bearish divergence was followed by a fall in price and bullish divergence was followed by a rise in price.
There is still current multi month divergence between price and VIX: from the high in April 2016 price has made new highs in the last few days but VIX has failed so far to follow with new highs. This regular bearish divergence still indicates weakness in price.
At the end of this week, there is no bullish divergence at the monthly chart level from VIX. Overall, more downwards movement is still indicated for price.
VOLATILITY – INVERTED VIX DAILY CHART
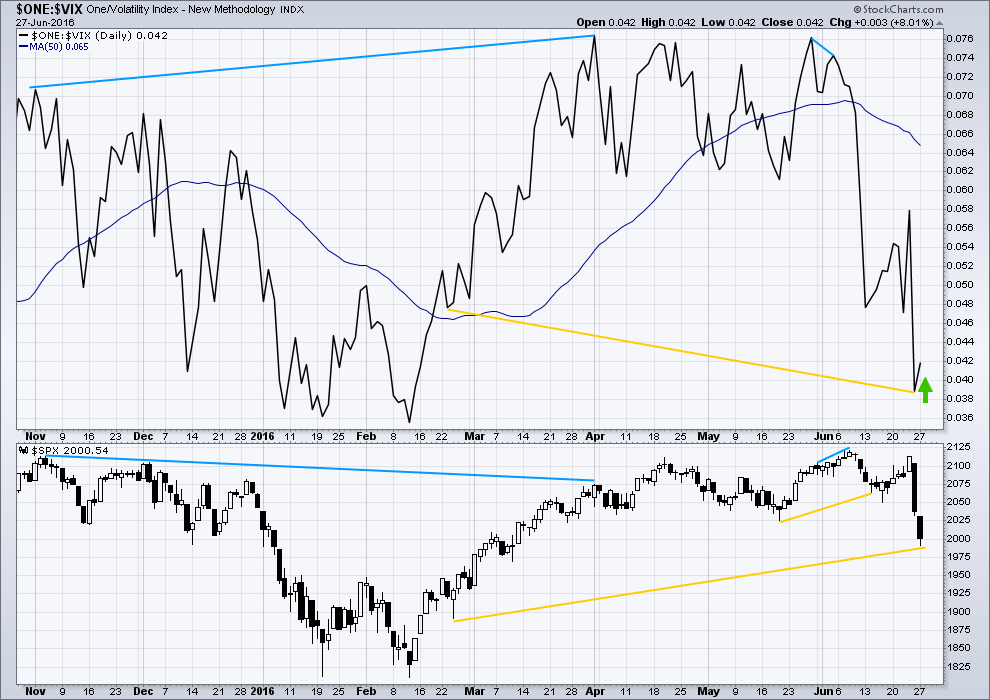
Click chart to enlarge. Chart courtesy of StockCharts.com.
There is an instance of longer term possible hidden bullish divergence noted here between price and inverted VIX with longer yellow lines. From the low of 24th February, volatility has strongly increased yet this has not yet translated into corresponding lows for price.
Price moved strongly lower for Monday’s session yet volatility declined, identified by the small green arrow. This short term bullish divergence should be taken seriously today. It indicates price is very likely to move higher short term. This strongly supports the hourly Elliott wave count.
While I would not give much weight to divergence between price and many oscillators, such as Stochastics, I will give weight to divergence between price and VIX. Analysis of the monthly chart for the last year and a half shows it to be fairly reliable.
BREADTH – ADVANCE DECLINE LINE
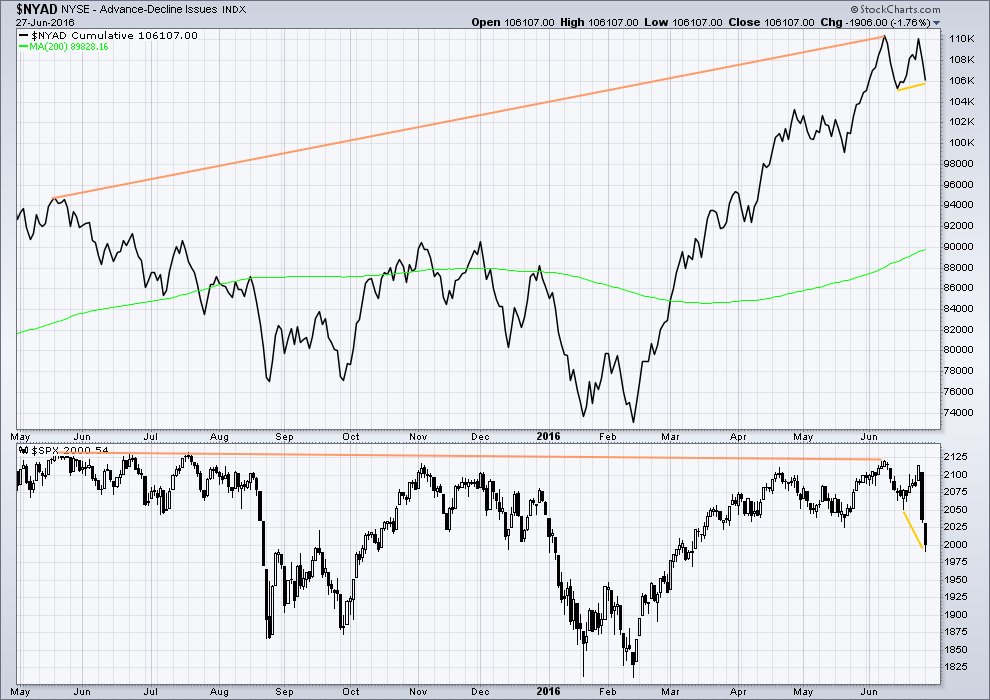
Click chart to enlarge. Chart courtesy of StockCharts.com.
With the AD line increasing, this indicates the number of advancing stocks exceeds the number of declining stocks. This indicates that there is breadth to prior upwards movement.
Taking a look at the bigger picture back to and including the all time high on May 2015, the AD line is making substantial new highs but price so far has not. While market breadth is increasing beyond the point it was at in May 2015, this has not translated (yet) into a corresponding rise in price. Price is weak. This is hidden bearish divergence.
There is divergence today between price and the AD line indicated by short yellow lines. Price today made new lows but the AD line has failed to make corresponding new lows. This indicates some weakness to downwards movement from price. There is less breadth to downwards movement this time. This divergence is bullish and also supports the hourly Elliott wave count.
DOW THEORY
The last major lows within the bull market are noted below. Both the industrials and transportation indicies have closed below these price points on a daily closing basis; original Dow Theory has confirmed a bear market. By adding in the S&P500 and Nasdaq a modified Dow Theory has not confirmed a new bear market.
Within the new bear market, major highs are noted. For original Dow Theory to confirm the end of the current bear market and the start of a new bull market, the transportation index needs to confirm. It has not done so yet.
Major lows within the prior bull market:
DJIA: 15,855.12 (15th October, 2014) – closed below on 25th August, 2015.
DJT: 7,700.49 (12th October, 2014) – closed below on 24th August, 2015.
S&P500: 1,821.61 (15th October, 2014) – has not closed below this point yet.
Nasdaq: 4,117.84 (15th October, 2014) – has not closed below this point yet.
Major highs within the new bear market:
DJIA: 17,977.85 (4th November, 2015) – closed above on 18th April, 2016.
DJT: 8,358.20 (20th November, 2015) – has not closed above this point yet.
S&P500: 2,116.48 (3rd Nobember, 2015) – has now closed above this point on 8th June, 2016.
Nasdaq: 5,176.77 (2nd December, 2015) – has not closed above this point yet.
It is a reasonable conclusion that the indices are currently in a bear market. The trend remains the same until proven otherwise. Dow Theory is one of the oldest and simplest of all technical analysis methods. It is often accused of being late because it requires huge price movements to confirm a change from bull to bear. In this instance, it is interesting that so many analysts remain bullish while Dow Theory has confirmed a bear market. It is my personal opinion that Dow Theory should not be accused of being late as it seems to be ignored when it does not give the conclusion so many analysts want to see.
This analysis is published @ 11:41 p.m. EST.

Just an idea here:
Wave 1 down: 2021 to 2050
Wave 2: a: 2050 to 2013, b: 2013 to 1992, c: 1992 to 1975, so c is about to finish and wave 3 down is about to start, the target for wave 3 is 1864.
Consumer discretionary taking more hits: XLY:XLP ratio approaching important resistance.
“Nike Tumbles To August 2015 Levels After Missing On Revenue, Future Orders, Margin Decline”
http://www.zerohedge.com/news/2016-06-28/nike-tumbles-august-2015-levels-after-missing-revenue-future-orders-margin-decline?utm_source=feedburner&utm_medium=feed&utm_campaign=Feed%3A+zerohedge%2Ffeed+%28zero+hedge+-+on+a+long+enough+timeline%2C+the+survival+rate+for+everyone+drops+to+zero%29
Well, if this is a 4 wave correction up, then it can’t move into wave 1 …correct? Which is less then 3 points away according to what I see.
So if wave 4 is a ZZ, then what the heck was wave 2? I thought wave 2 was a ZZ?
We should expect alternation here…right?
Wave 2 was a double zigzag. So wave 4 is unlikely to be a single or multiple zigzag.
It may be a flat or triangle, it may also be a combination which would also be labelled W-X-Y, but is quite different to the W-X-Y double zigzag I have labelled minor 2.
thank you Lara.
I think i may have my degrees off too. I was looking at minute wave and had it confused with minor.
I can still see a fair gap between the high for today and the low of minor wave 1. There is room for minor wave 4 to move in yet. I expect it will just go sideways from here though, maybe another couple of watching paint dry days?
Always such fun.
Here is a 2hr chart, forks redrawn using the latest bottom. Fits with the 2039ish target for it to reach the middle line.
Surfing with sharks is risky. Traders in UVXY, they’re just nuts. I’d rather be in 25 e-minis with no stop loss and have my computer fail than trade UVXY.
ROFL
Yep, me too.
TBH I have gone back out into the surf after a shark was spotted. Generally I think they’re uninterested in me (the waves were too good to miss!)
Not trading UVXY though… especially a naked put on UVXY! Insanity!
🙂 🙂 🙂
One of the keys to succeed is to control the size so one can still sleep well.
Yep, exactly.
Which is why I keep repeating don’t invest more than 3-5% of your equity on any one trade.
For newer and less experienced members I’ll have to keep repeating it. Until I sound really boring and tired…. but I’ll just keep repeating it. If members learn nothing but that from me then I’ll have done a fabulous job IMO
Now 75% short with 3% discount in my instrument of choice after hours 🙂
If next move down is a three, it will end up being a very swift scalp!
When you sold this after hours yesterday, turned out to be a brilliant move.
Hopefully this will be the same… Cheers 🙂
These after hours moves are ridiculous…
Well…. it could be over. Or this could be wave A of a flat or wave W of a combination or wave A of a triangle for our fourth wave.
So far I can see a zigzag up complete. Had to check the 1 min chart for the structure of subminuette c within minuette (ii) within minute c.
Now it’s my turn to thank you Lara for your wave count. I shorted 1000 shares of UVXY from 15.6 to 11.6, or longed SPX from 1996 to 2034 and made $$$. I will buy my son a top notch Apple laptop for his birthday. I have switched to long the UVXY to ride the 5 the wave down.
Nice trade. Cashed in some bearish call credit spreads on the move down as well. Holding the long calls for the rocket up!
Reloaded bullish put credit spreads at 7/11 🙂
congrats on that trade!!!
Thank you all very much. I learned so much from this site.
You’re welcome, always great to hear when members are able to use my analysis to make $$ because that’s what we’re all here for!
here is the open interest change FROM YESTERDAY for this week expiration SPY….
I like to track it…I will post the ones expiring in 2 weeks too.
looking at it…means a little more to upside. I see explosion of calls both in and out of money….puts open interest dropping
Strike 204 has a HUGE pop today
Thank you for posting that Jules. Another piece of information to consider.
You welcome…
here is the one expiring in 10days…looks similar….implosion of puts and surge in open interest in calls….
the cool thing though is that on the puts side…in 10DAYS…you see people ABNORMAL VOLUME for 199PUTS …Joins JIM WOLF prediction thing
crazy volume at the close……hmm. I’m 50% short and the buying and the volume has me little nervous.
volume supporting up or down?
up. hopefully is was a blow off (climax) and now we head back down.
i think we might have a little more upside…i just posted OPEN INTEREST CHANGE from previous close and I see calls popping…both in the money and out of money….puts did the inverse.
looks the same for all weeklies in spy….
I realize that, but when the last bar accounted for a positive 8 point move in the ES, it makes me wonder if I missed something. Maybe it’s nothing. I’m short with 50%, and all I can do now is see how it all unfolds.
hmmmmm
hope isn’t a good investment strategy, I don’t like it 🙂
looking at proportion this may only be wave a of a larger correction for minor 4
That is my favorite for at least one reason. It seems to me, so very often when the market can become more complex and time consuming, it does, especially in corrections. So I like the odd that it will go up some more and make it more complex.
The idea of a multi-day correction is reasonable at this point in a bear market. Sure we could go down from here. But for another short side entry to add to my existing short position, I will wait for a while.
Maybe… but SPX volume still lower than the 875.453 Million from yesterday. Today 713.520 Million
Symbol $TVOLSP
Oh you are talking options volume…. Okay
no the last 30 minutes was a spike and it was heavy buying. Hopefully it was a buying climax.
Are you looking at candles of the volume?
You find that the last two to three candles of each day (I mostly look at 5 min) are always the largest candles of the day. I have been looking at this for several months now and that is what I always see.
Sloping green line holding (can spike over it some). But sure looks like it wants to go to the 2038.50 – 2040 area.
Did you draw that or someone else? Kinda cool perspective 🙂
Those are Pitchforks, or “Forks”, and you can draw them on various public websites. Similar to EW in that it takes time to learn all the in’s and out’s. You can find them for example on investing.com There’s math behind them, geo.
this is cool!!!! i have to check it out.
works…but again one has to study them like you would EW, takes awhile to learn them. Similar though in probabilities, I like to see a pitchfork target match up with other targets such as EW, pivot points, a divergence occuring, etc.. and then it can be really strong.
Maybe in the eye of the beholder, but I see a 3D element to the wave that I did not appreciate before. Anyone else?
FYI this is how I counted the last move down
now to count this move up….
didn’t mean to post over yours, it was not up at the time I clicked the button
However, I see you have posted fancy currency EW, stock market indexes, Gold….but what about cheese futures, for a Wisconsin guy?
I’m from Wisconsin too…grew up in South Milwaukee
I’m up by Appleton/Green Bay
go Seahawks
go Bears (NFL and here)
Have the Bears come back up from the minors yet?
Thats how bad they are, they should be playing baseball. Edit: I take off the smiley face the Bears are so bad.
Go Packers!
Go NY Jets… and also Bills now that Rex is coach.
The future for cheese is looking a bit mouldy.
There’s your cheese futures for you Peter 😉
That was definitely cheesy 🙂
Howzabout a lil’ limburger anyone?! 🙂
It’s better if it sits on a ritz….
I said SITS! naughty! naughty! 🙂
Baumgartner’s, Monroe
What’s that smell?!
Aaah!
Limbuger sliders! Yummy!
2035.36 is 100DaySMA
2035.76 is 100WeekSMA
If we have just thrust out of a triangle then this move up should be terminal. D & E waves were very small but if this wave is almost done then that is possibly what it was.
Both that and an expanded flat would now expect a 5 wave move downwards next.
2034.36 high… Just under 100Day & Week MA’s
Down it goes… I think. Lets see if 5 waves.
This wave down looking impulsive? Right?
Too low degree atm – still need a bit of time to tell
atm on 1min the 3rd wave looks shortest.
Could have been an extended 5th – so might be impulsive – need a 3 up now
Wow, you see 3 w’s on the 1 min from 2034.36… I see a 1 & 2. and maybe a w3 starting.
DO you use candle sticks to count?
I guess this is going to take me more time.
Yes – I also see 1, 2 (or ab) at one degree higher – my comment was looking within the wave 1 because you asked if it was impulsive 😉 🙂
Okay… So how few 1 min candles can = a wave within wave 1?
I wish there was an easy answer to that! The lower the degree the smaller the waves but even at the same degree waves are rarely the same length as each other (other than within the same degree impulse / correction).
5min is the lowest timeframe I think is required – I’ve used 1 min for years so just prefer that.
Should I count the end of a wave with a pause of at least one 1 min candle? Or a pause at any time period of one candle?
Sorry, to keep asking but this may be why I am not getting it.
Not really as easy as that unfortunately – I use trendlines and (on higher degree waves) RSI to have an idea when one wave has finished. I also use structure (so you need to know each structure like ‘the back of your hand’ just like you need to know all numbers before trying math).
Counting at 1 min is not very easy – make sure you can count at 1 hour level well and then zoom in as you get more confident.
Sorry I cannot offer more help – it’s something you eventually ‘get’. I know it is incredibly difficult up until the point where it ‘clicks’.
The best way to get there is to keep following and counting waves every day, then seeing where you went wrong when Lara puts her counts up. The brain is much more effective at learning when it is sure something is right but it is then proven wrong and shown why, rather than accepting and trying to remember.
Even after all the above – it still aint easy to get it right!
Thank You Olga…. Appreciate your comments.
I think market close is going to be interesting if Ichimoku and Fib sequences has any say on the matter. Would expect downside action maybe test 2000 on the /ES again.
Interesting – that would suggest that we are maybe just finishing off wave (b) of a flat with wave (c) down into the close??…
My count would certainly support that option if Mr M has it in mind – thanks for the heads up 🙂
If I am right we should see UVXY begin to cooperate in the next 15 minutes so that should reveal which way Mr M wants to end today with. I am however, to chicken to by UVXY. 🙁 Still hold longer term SPY shorts though.
Ok, reveal yourself Mr. M!
Not trading UVXY is certainly not chicken – it is most sensible imho.
I am very wary about announcing my UVXY trades for that reason – if I get it wrong anyone following could lose the farm if they don’t exercise absolute discipline with stops. I am often scalping in and out intra day to improve my position – I don’t usually mention those trades nor do I always mention if I bail whilst some move against me plays out.
I know when I started trading I used to follow people who appeared to be making money so I’m sure there must be members here that do the same. With UVXY that is def a good way to lose your shirt in a very short period of time.
BTW – talking about UVXY is a historical thing which pretty much only Verne and I used to trade / talk about back when there were only a handful of us commenting every day (last year). Since then the amount of contributors & new members has increased alot.
Alot of people now mention it which might make people think it is a good intrument to trade, which is certainly not the case for 99% of people and absolutely not the case for 100% of new traders.
Thanks Olga, I’ll second that.
I think a wee while back I saw Verne mention a naked put on UVXY (correct me if I’ve got that wrong). This is probably one of the riskiest instruments and one of the riskiest positions (a naked put!) to trade on it. That had my jaw about my chest….. very impressed I was.
For the VERY experienced only.
Fascinating to watch you guys trade this, but for myself, I’m not touching it with a barge pole. I am however learning from watching you.
Sell off into close idea
Price action sure looks like a classic blow off top…
most be a lot of covering.
Yep – both myself and 3min RSI not convinced atm. UVXY seems a bit more convinced though.
EDIT – RSI changed sides now
Sold yesterday’s calls. This might have a bit more to go but wanted to cash out.
Very wise IMO
I wouldn’t complain one bit if we tested 2000 in the es before the close. 😀
UVXY was $4 higher on 6/14 when the market was 45 points higher than we are right now.
Bargain right now then 🙂
As both Verne and I (and probably others) have pointed out quite a few times – it certainly ain’t no buy and hold!
I sold it only a few months ago near 60… Nuff said!
This sideways move getting a bit long in the tooth for a 4th wave (of (c)) imo – maybe a zig zag is playing out?
Nibbled on some short just in case the move is over at todays high, but I don’t think it is. Move down looks corrective to me atm. Might just use it as a scalp.
EDIT – that b wave not quite 90%, so is not a flat atm. Maybe a triangle or something more complex???…. ‘b’ is def 3 waves (so could be an x wave), and ‘a’ looks like is corrective / complex to me.
I think it’s a triangle too. wave d finishing now on the 1 minute chart.
UVXY currently signalling a move up is coming soon. But then… with the massive amount of manipulation of it very apparent yesterday it seems someone is able to make it do what they want (if only for a few hours – then it let rip).
So Banksters beware…. you will *never* tame the beast!! 🙂
I am looking forward to catching the beast.
FWIW, here are a few possible good entry points for the next short:
— the VIX 20 day SMA and 200 day SMA converge around 18.10 (currently 19.85).
— Nasdaq will fill its second gap down at 4707, currently 4661.
— And of course the SPX 2040, lined in Lara’s both weekly and daily TA charts…
I agree, if (hopefully) we will get to the well worn 2043 pivot, that’s where I start building a position.
The lingering fear is surprises to the downside…
This market looks like it could break to the downside, at any time…
The SPX 200DayMA is right here today at 2021.34…
Today’s move went above in 1st 40min and is now below this MA.
What makes you think 2021.34 won’t be the repel point?
By the looks of it..still too early to tell, but looks like wave 5 of C of iv is starting now. Which means possible good short entry near the close.
Maybe. Price action is torpid, languid, sluggish. The market is behaving like it wants to gap to the downside, not up….
You could be right, it may not make it to the close. I feel like a black bear staring at all the salmon running…ready to pounce once I get a decent set up.
you can tell me,, Im a doctor..
Would you please check that temperature Doc?
It appears a bit elevated to me… 🙂
do you prefer the rectal thermometer?
lmao…
and who doesn’t 🙂 LOL
Isn’t that a little backwards? 😀
Not that I am not behind you on this one Doc…
yeah,, Im sorry,, purty “crappy” of me..
Joseph – what chart were you looking at for the lower futures close after hours late yesterday afternoon? Thanks in advance
If you are trying to accumulate Unicorn shares via options, ignore the bid/ask. They are meant to deter interest from the uninitiated. I am keeping open “stink bids” and getting filled well below the current ask.
Don’t you think UVXY is going to get a little cheaper with this rally?
Probably. I have been accumulating with “stink bids” since it moved under 13.
Considering where I expect it to go on the next leg down, a couple of points either way should not be too significant to positions out several weeks…
The last time we saw a long upper wick as we are seeing today was on June 20. The banksters doubled down in their efforts to ramp the markets higher, culminating in the frenetic run-up on Thursday ahead of the Brexit vote. There is no global event on deck to assist the sentiment side of any attempt to jack prices higher. What will they do pray tell? 🙂
One way to get an idea of where price is going is to look at bids on contracts you are holding. I like to hold both “canary” puts and calls in my account as they will frequently signal what’s ahead even before price action starts to confirm it. I fired off a bullish put spread on SPY this morning and the buy side puts hardly budged as the market moved higher…
Presume that is bearish? For anyone like me who has no clue about options please feel free to state the obvious 🙂
Bearish indeed! 🙂
I hear the train a coming… 🙂
30 Year US Treasury only down 9/32’s to a 2.277% Yield
Means the Bond Money (“The smart money”) is saying this Stock Rally is BOGUS!
All but 2 points of the move was from 6:00PM Yesterday to 9:30AM Overnight
I remain long, albeit at the moment underwater on TBT. The way TLT is cavorting above its upper BB tells me it won’t be long now… (said the cat as his tail got caught in the mower…) 🙂
Ouch, that sounds a little bloody. How about as nervous as a long tailed cat in a room full of rocking chairs? 🙂
I’ll take it, and raise you a few Siamese! 🙂
I believe there is a good chance that the 30 Year goes sub 2% Yield for a period of time before this all ends. There may or may not be some type of correction 1st. That part is hard to determine.
When the stock market breaks below 1800 and the Bear Count P3 is confirmed, that is when you get sub 2%… Only then would I personally look for a bottom in the 30 Year.
The exact timing of all this will be related.
Interesting to see if SPX 2030 or ES 2020 offers resistance.
This is a great example of why I love spread trades in fast moving markets. I took profits on a number of bearish call spreads Friday and Monday and left the buy side of the calls open, so was able to take advantage of the market decline and simultaneously remain hedged ahead of any rebound such as we are seeing today. Looking to me like we may be looking at a second, and not a fourth wave to the upside.
I’m counting this move slightly differently (only as it seems to fit better on 1 min chart – I can’t seem to count the final move lower yesterday as a 5 – I have it as a (b) atm) – but it makes no difference to the way I’ll play it. Count will change to Laras Minor 4 count with a high above 2048 and second wave count with a high above 2051
I believed the futures went lower after hours, however looking again they did not, just tested the low twice more.
They did go lower between 4PM Close – to 5PM official ES Close down 9 to 1982 from 1991 at 4PM.
thought I saw it….looking at too many charts!
Olga – what if the whole move up from the (iii) on your chart posted is (a)? where we are still in (a), then (b) down, then (c) up
Yep – it’s always a possibility that an abc could be just wave (a) of one higher degree. I’m thinking that might go too high to be a 4th wave but I’ve got my eye on all options.
It all means the same really – it’s just a matter of what level is best to throw the kitchen sink at it.
Despite my best efforts it never truns out to be as easy as I plan it, but as long as we are with the trend the rewards should stack up anyway.
Yesterday I was in profit protection defensive mode, today I’m back in hunter mode. Already a nice 12% discount on the beast (27% if you go by yesterdays after hours high) 🙂
Bonds not buying it. Yields not moving much.
Absolutely everybody and his grandma knows this is the deadest of dead cat bounces. The reversal is going to be most spectacular.
Vern,
I suspect they are not going to let this bounce fade quickly especially if the intent is to get more retail folks to buy inventory off their hands at higher prices. I am looking for the bounce to end between 2,045 – 2,067 with a possible throw over the 2,067 line. I am worried that any day now we might get one of the central banks inject some news to push the markets higher..Japan looks to be ready to act to bring Yen down for export purposes..
Here’s the problem Ari. You are assuming that they still have control. They can control price in the short term, and sometimes mood as well. When mood inexorably shifts to the dark side, this powerfully militates against even their short term efforts at price control. I scalped this upside move and was out as quick as a lick. No point in playing with fire imo…
On the matter of CB annoucnements, that will be the very last card in their hand, and will probably come at the end of intermediate three… all to no avail of course…
Sorry Ris. Didn’t mean to assign you another name! 🙂
thought same thing in August and then February….cautious here.
After hours did its little down, then the rip up. So just have to begin trading 24hrs a day I guess.
I was hoping to open a long hedge… but I have to wait until my analysis is written, proofed and published before I can trade. MTA ethics guidelines. By then it was too late. Now the risk / reward profile is horrible.
Sitting this one out. Holding onto my short opened at 2,103 in the expectation that it will reduce, then be back within a week or so.
Lets see how that one works out. No worries. Happy to be patient. No risk, if it turns out to not work then I shall have a better entry.
Hi Lara – just a thought. To satisfy the ethical position, could you possibly just post your main hourly count from the unpublished analysis in the comments section when time is of the essence? In my view you do enough anyway to share your ideas and let members know your thoughts at the end of the trading day well before analysis is published, albeit I realise your counts do sometimes change when you have had a chance to sit down and crunch the numbers.
No doubt there will be some members that absorb a ‘chart only’ preview more readily than others, but I don’t think any member here would want to see you missing out / taking on more risk. As volatility rises we may find in future that the market warrants a more pragmatic approach.
True. I could make a comment which would satisfy ethics guidelines. Then wait about 10 minutes for members to take advantage before I do so myself.
That would have to assume that members are reading the comments…. IMO they should be at least scanning them towards the end of session for my update.
Actually, members should be reading most if not all comments, there’s so much to learn in here from yourself and the other very experienced traders, all sharing trades real time.
To ignore that wealth of information would be a great missed opportunity for learning.
If you declare you have a position already supporting your analysis isn’t that appropriate transparency and then the reader can judge bias or not?
No, I have to advise members of the opportunity and allow enough time for them to take it before I can take a position myself.
Hi Lara,
I apologise if this has already been mentioned somewhere and I have missed it but, I was wondering, for the two primary 3 down targets you provide, how much time (approximate ok) doi you expect would be needed to reach them?
T.i.a.
J.
Sorry John, that was in the analysis up until recently.
Primary 1 lasted 38 weeks, no Fibonacci number. Primary wave 2 lasted 17 weeks, also no Fibonacci number and no ratio to the duration of primary 1.
So it’s a wild guess really. A fibonacci 55 weeks would be the first idea.
Time is much harder to estimate than price. Which is why I won’t trade futures. Corrections can be more time consuming than expected… messing it all up.
Thanks Lara.
Huge cash dump in European bourses that have gone from as much as 3% plus in the red to now solidly in the green, reflecting even bigger gains than US markets which went green fairly early. Price action today should have the bulls dancing in the streets! 🙂
It has been quite uncanny how often the lower probability wave count has of late turned out to be the correct one. This morning was the most amazing display of bullishness I have seen since the decline started in that we had traders trying to pre-maturely short UVXY while a third wave down was unfolding. That is very bullish indeed! Foolhardy, but bullish. 15.00 strike calls picked up when it hit 14.95 this morning were an easy double for the taking. If UVXY gets anywhere near 10 the next day or two it might be an indication that we only completed minute one down.
Hi Lara,
My hourly charts look quite different from yours – see attached-due to the fact that FXCM doesn’t seem to trade the cash market. Is this the case with you? If not, how are you able to trade the cash with FXCM?
It makes following the labelling quite hard!
I’m using NY session only data, directly from the exchange.
I’m trading with CMC Markets now. I’m using CFD’s and CMC markets are using futures data which includes after hours data.
Yes, it’s a little different.
I don’t use FXCM anymore.
1st
🙂
wow,, you are a quick one,,
I commented b4 I read the analysis… is that cheating doc?
Dang it. Turd 🙂
No, that seems to be the approach. Comment 1st… then read 🙂