Downwards movement was again expected for the session and again failed to materialise.
No confirmation of a trend change has been indicated yet either, so it was allowed that price could move a little higher.
Summary: Price is persistently weak but no trend change is yet indicated. Earliest confidence in a trend change would come with a new low below 2,085.36. A breach of the large black channel on the daily chart would provide further confidence. Finally, a new low below 2,025.91 would provide confirmation.
Last published monthly charts are here.
New updates to this analysis are in bold.
BEAR ELLIOTT WAVE COUNT
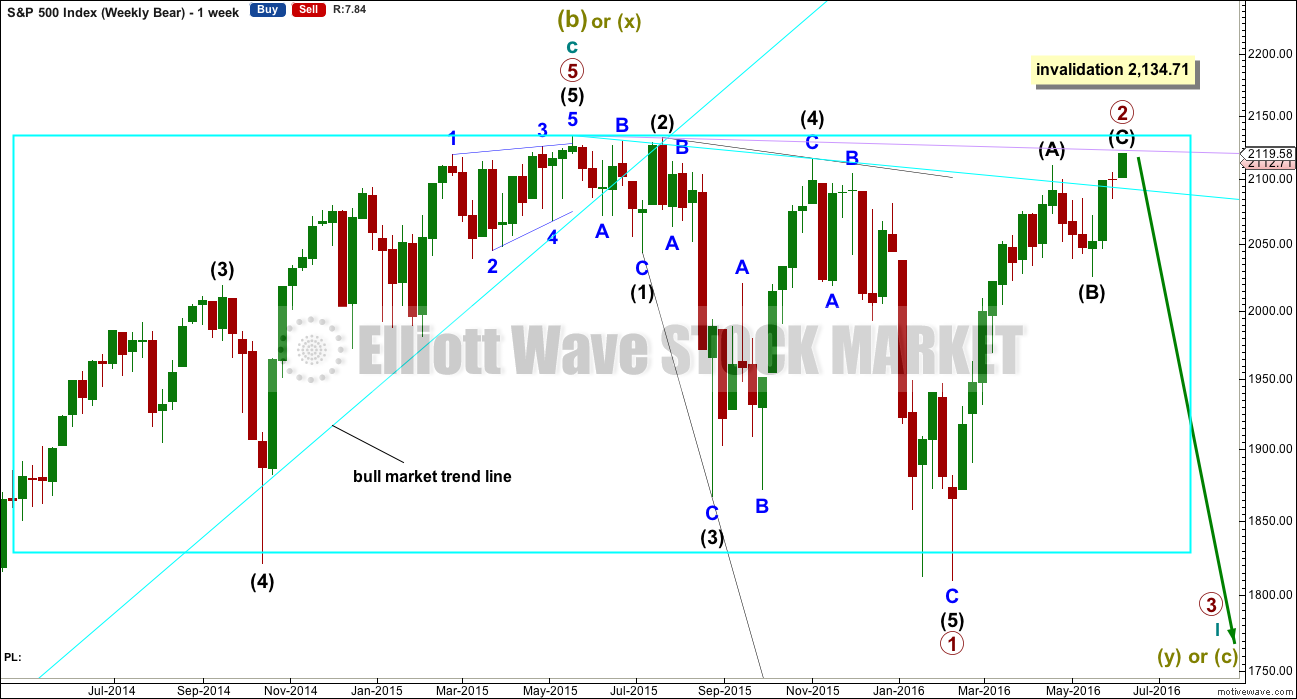
WEEKLY CHART
The box is added to the weekly chart. Price has been range bound for months. A breakout will eventually happen. The S&P often forms slow rounding tops, and this looks like what is happening here at a monthly / weekly time frame.
Primary wave 1 is seen as complete as a leading expanding diagonal. Primary wave 2 would be expected to be complete here or very soon indeed.
Leading diagonals are not rare, but they are not very common either. Leading diagonals are more often contracting than expanding. This wave count does not rely on a rare structure, but leading expanding diagonals are not common structures either.
Leading diagonals require sub waves 2 and 4 to be zigzags. Sub waves 1, 3 and 5 are most commonly zigzags but sometimes may appear to be impulses. In this case all subdivisions fit perfectly as zigzags and look like threes on the weekly and daily charts. There are no truncations and no rare structures in this wave count.
The fourth wave must overlap first wave price territory within a diagonal. It may not move beyond the end of the second wave.
Leading diagonals in first wave positions are often followed by very deep second wave corrections. Primary wave 2 would be the most common structure for a second wave, a zigzag, and fits the description of very deep. It may not move beyond the start of primary wave 1 above 2,134.72.
Price may find resistance at the lilac trend line if it continues higher. It is just touching the line today.
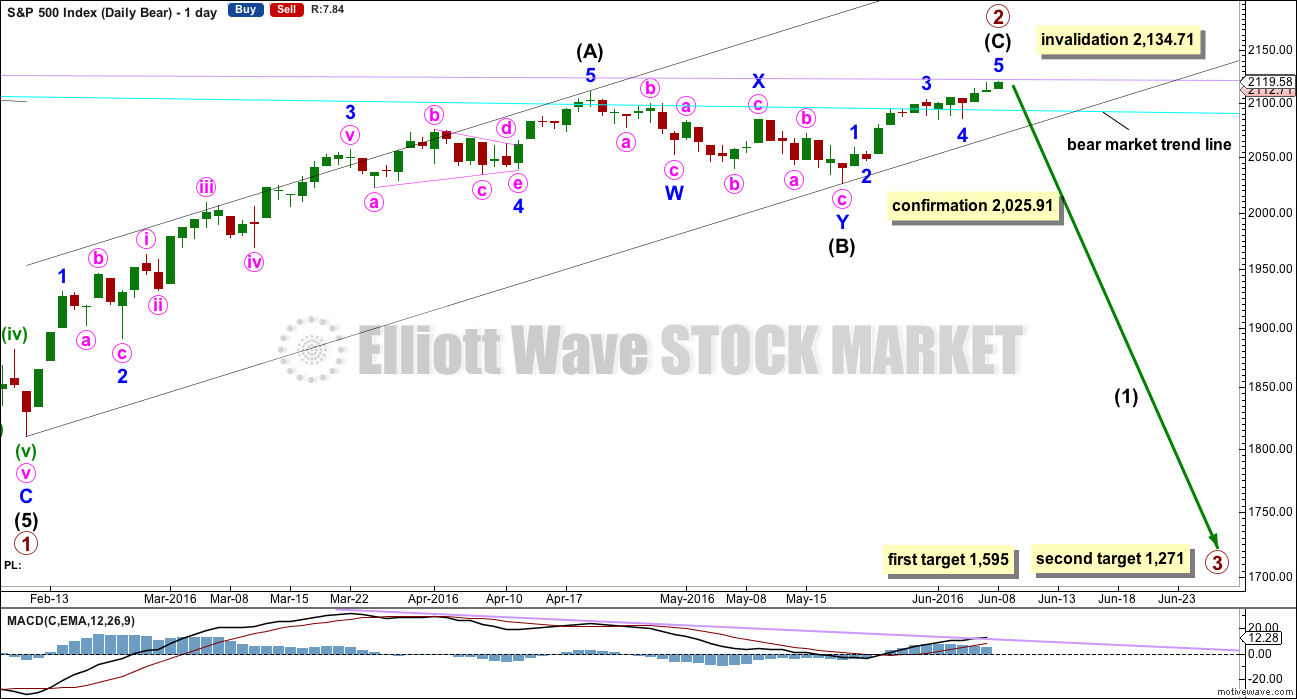
DAILY CHART
So far primary wave 2 would be a 0.96 correction of primary wave 1. Second wave corrections following first wave leading diagonals are commonly very deep, so this fits the most common pattern if primary wave 1 was a leading diagonal.
The most common structure for a second wave correction is a zigzag.
There is still no Fibonacci ratio between intermediate waves (A) and (C).
Intermediate wave (C) must be a five wave structure. It may be either an impulse or an ending diagonal. It would be unfolding as an impulse, not a diagonal. The structure may be complete, but as yet there is no evidence of a trend change. Today completes the thirteenth day for intermediate wave (C). If it is to exhibit a Fibonacci duration, it may end at today’s high. Intermediate wave (A) lasted 47 sessions (no Fibonacci number) and intermediate wave (B) lasted a Fibonacci 21 sessions.
Draw a channel about primary wave 2 using Elliott’s technique for a correction: the first trend line from the start of the zigzag, then a parallel copy on the end of intermediate wave (A). When this channel is breached by downwards movement it would be indicating a possible trend change. A new low below 2,025.91 would provide price confirmation of a trend change. At that stage, downwards movement could not be a second wave correction within intermediate wave (C) and so intermediate wave (C) would have to be over.
The targets calculated are provisional only because at the end of this session there is still no confirmation of a trend change. They come with the caveat that price may yet move higher which means the targets would move correspondingly higher. They also come with the caveat that at this very early stage a target for primary wave 3 may only be calculated at primary degree. When intermediate waves (1) through to (4) within primary wave 3 are complete, then the targets may change as they can be calculated at more than one wave degree. Primary wave 3 may not exhibit a Fibonacci ratio to primary wave 1.
The first target at 1,595 is where primary wave 3 would reach 1.618 the length of primary wave 1. This target would most likely not be low enough because primary wave 2 is very deep at 0.96 the length of primary wave 1. Primary wave 3 must move below the end of primary wave 1, and it must move far enough below to allow subsequent room for primary wave 4 to unfold and remain below primary wave 1 price territory. Normally, there is a gap between first wave and fourth wave price territory, particularly in a bear market.
The next target may be more likely. At 1,271 primary wave 3 would reach 2.618 the length of primary wave 1.
If primary wave 3 does not exhibit a Fibonacci ratio to primary wave 1, then neither of these targets would be correct.
Well before these targets, it should be obvious if the next wave down is a primary degree third wave. It should exhibit increasing ATR, strong momentum, and a steep slope. However, please note that although it may begin very strongly it does not have to. It may also be that intermediate wave (1) maintains an ATR about 20 – 30 and has some deep time consuming corrections within it. That was how the last primary degree third wave began within the last bear market, so it may happen again.
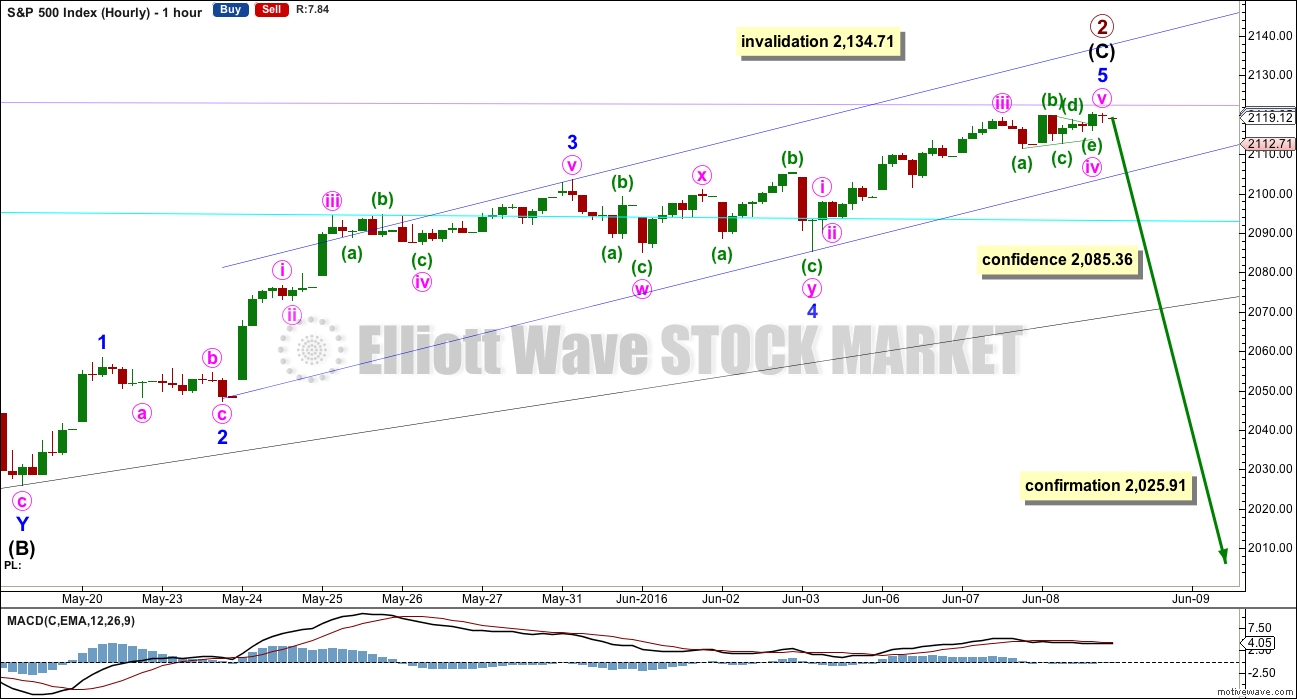
HOURLY CHART
The hourly chart shows the whole structure of intermediate wave (C). This upwards movement is seen as a five wave impulse.
A five wave impulse upwards from the low labelled intermediate wave (B) on 19th of May may now be complete, but the fifth wave may also continue higher.
This wave count at the hourly chart level agrees with MACD. The strongest piece of movement is the third wave. The fifth wave exhibits weaker momentum and divergence with MACD.
Minor wave 3 is 3.05 points longer than 1.618 the length of minor wave 1. If minor wave 5 is over at today’s high, then it would be 2.6 points longer than equality in length with minor wave 1.
Ratios now within minor wave 5 are: there is no Fibonacci ratio between minute waves i and iii, and minute wave v is just 0.05 points short of 0.382 the length of minute wave i. There is perfect alternation between the shallow 0.34 zigzag of minute wave ii and the very shallow 0.13 triangle of minute wave iv.
The first indication of a potential trend change would come with a breach of the blue channel containing intermediate wave (C). Along the way down, expect to see some support, and a bounce, at the cyan bear market trend line.
A new low below 2,085.36 could not be a second wave correction within minor wave 5, so at that stage minor wave 5 would have to be over. This price point needs only to be passed by any amount at any time frame.
Thereafter, the same rule is used for the confirmation point at 2,025.91. A new low by any amount at any time frame below this point could not be a second wave correction within intermediate wave (C), so at that stage intermediate wave (C) would have to be over.
To the upside, price may find resistance at the lilac trend line now. It looks like today this line held the rise in price to only another 2 points.
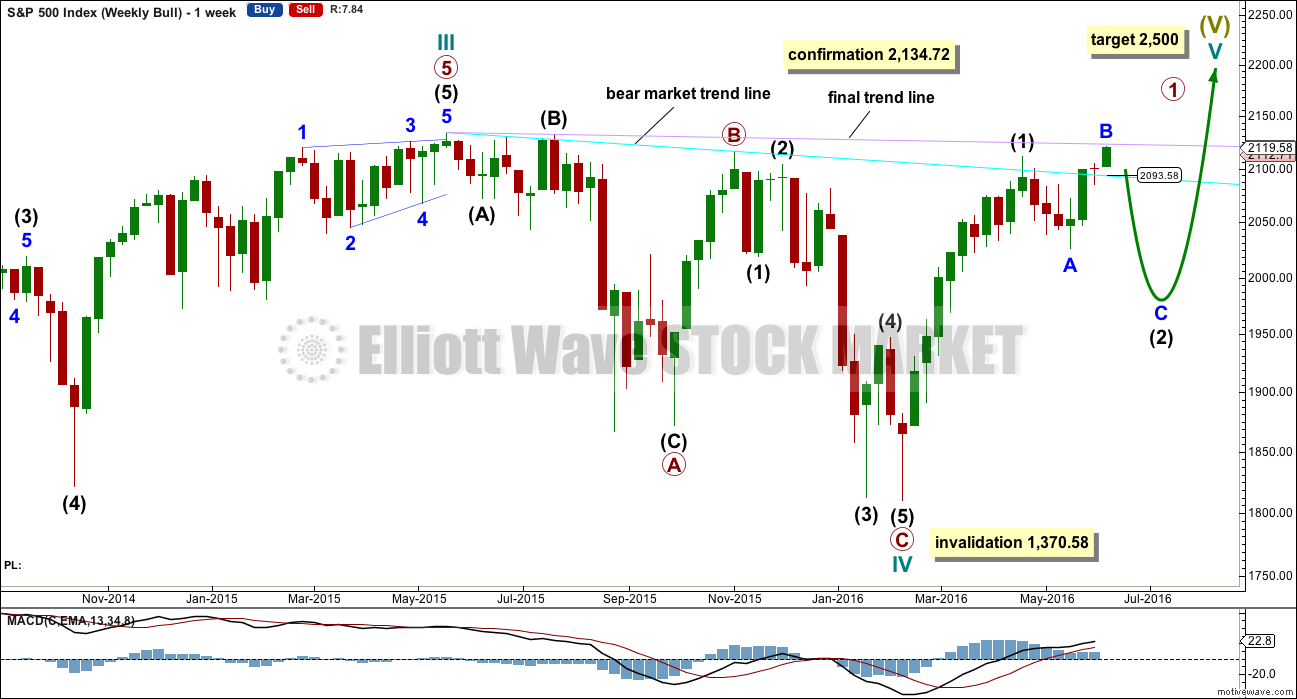
BULL ELLIOTT WAVE COUNT
WEEKLY CHART
Cycle wave IV is seen as a complete flat correction. Within cycle wave IV, primary wave C is still seen as a five wave impulse.
Intermediate wave (3) has a strong three wave look to it on the weekly and daily charts. For the S&P, a large wave like this one at intermediate degree should look like an impulse at higher time frames. The three wave look substantially reduces the probability of this wave count. Subdivisions have been checked on the hourly chart, which will fit.
Cycle wave II was a shallow 0.41 zigzag lasting three months. Cycle wave IV may be a complete shallow 0.19 regular flat correction, exhibiting some alternation with cycle wave II and lasting nine months. Cycle wave IV would be grossly disproportionate to cycle wave II, and would have to move substantially out of a trend channel on the monthly chart, for it to continue further sideways as a double flat, triangle or combination. For this reason, although it is possible, it looks less likely that cycle wave IV would continue further. It should be over at the low as labelled.
At 2,500 cycle wave V would reach equality in length with cycle wave I.
Price has now broken a little above the bear market trend line. This line is drawn from the all time high at 2,134.72 to the swing high labelled primary wave B at 2,116.48 on November 2015. This line is drawn using the approach outlined by Magee in the classic “Technical Analysis of Stock Trends”. To use it correctly we should assume that a bear market remains intact until this line is breached by a close of 3% or more of market value. Now that the line is breached, the price point at which it is breached is calculated about 2,093.58. 3% of market value above this line would be 2,156.38, which would be above the all time high and the confirmation point.
This wave count requires price confirmation with a new all time high above 2,134.72.
While price has not made a new high, while it remains below the final trend line (lilac) and while technical indicators point to weakness in upwards movement, this very bullish wave count comes with a strong caveat. I still do not have confidence in it. It is produced as an alternate, because all possibilities must be considered. Price managed to keep making new highs for years on light and declining volume, so it is possible that this pattern may continue to new all time highs for cycle wave V.
The invalidation point will remain on the weekly chart at 1,370.58. Cycle wave IV may not move into cycle wave I price territory.
This invalidation point allows for the possibility that cycle wave IV may not be complete and may continue sideways for another one to two years as a double flat or double combination. Because both double flats and double combinations are both sideways movements, a new low substantially below the end of primary wave C at 1,810.10 should see this wave count discarded on the basis of a very low probability long before price makes a new low below 1,370.58.
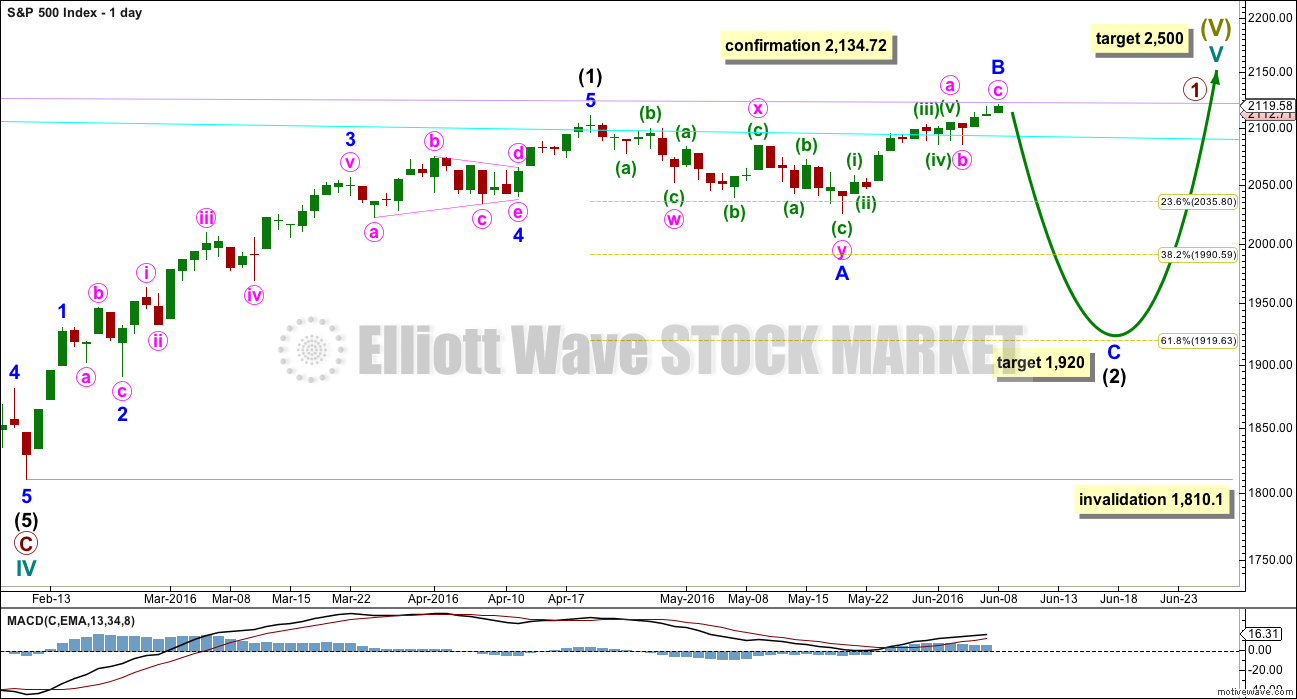
DAILY CHART
Intermediate wave (2) may still be an incomplete flat correction. Minor wave A will subdivide as a three, a double zigzag, and minor wave B may be seen as a single zigzag.
The most likely point for intermediate wave (2) to end would be the 0.618 Fibonacci ratio at 1,920.
Intermediate wave (2) may not move beyond the start of intermediate wave (1) below 1,810.10.
TECHNICAL ANALYSIS
WEEKLY CHART
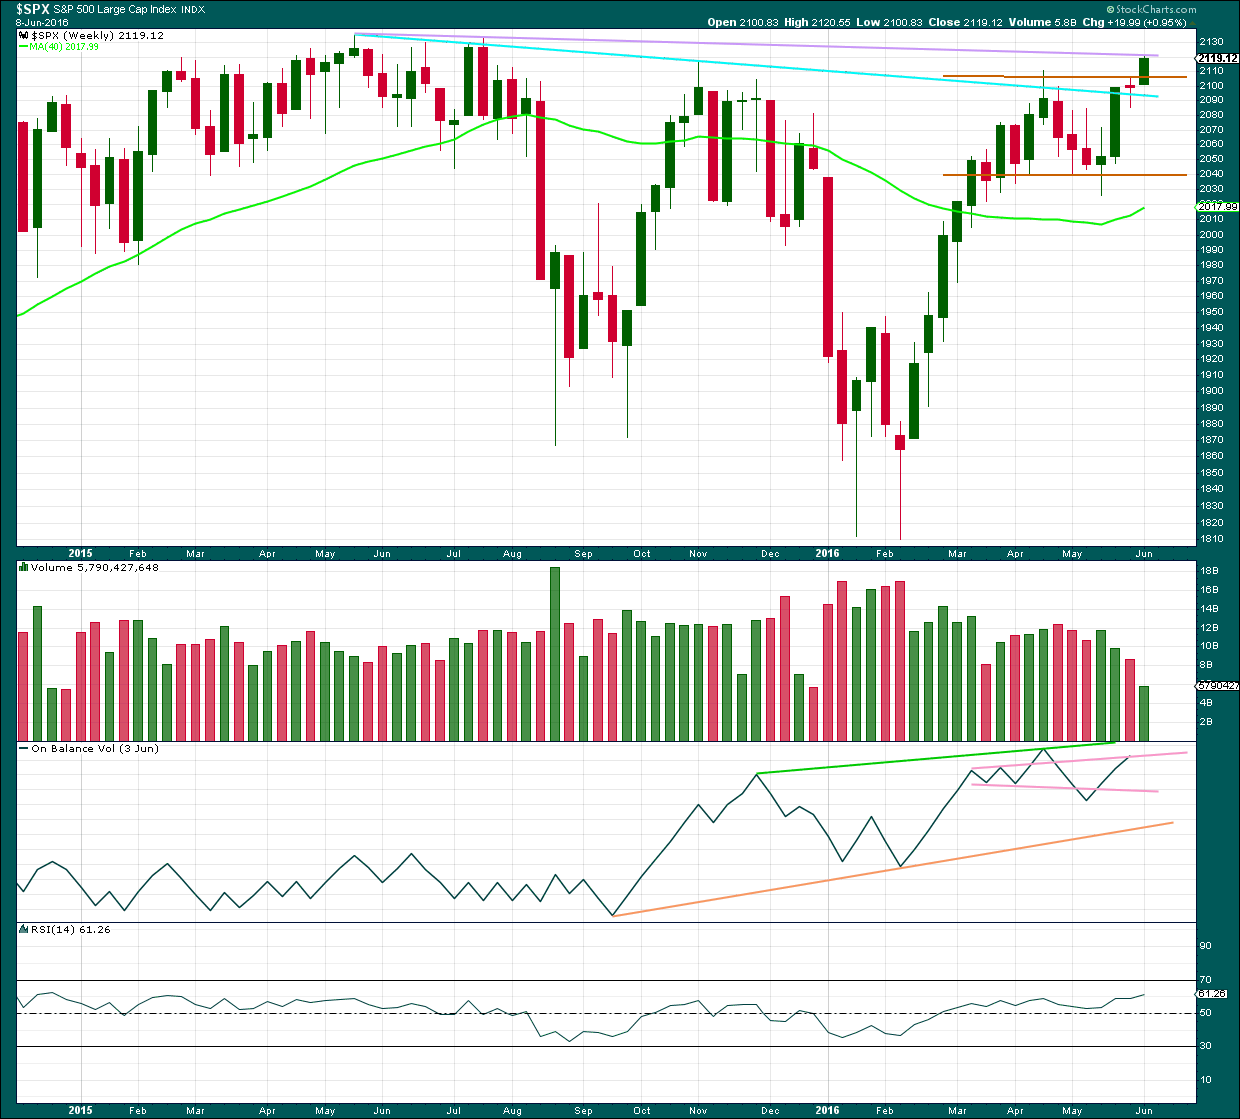
Click chart to enlarge. Chart courtesy of StockCharts.com.
Price is the final determinator and the most important aspect of market analysis. So what has price been doing since the all time high in May 2015?
Price has made an important new high above the prior major high of November 2015. Price is now finding resistance at the lilac line. It can no longer be said that price is making lower highs and lower lows because it no longer has a lower high. This is the most bullish indication from price for many months. This supports the bull wave count over the bear.
Last week completes a small doji pattern with lighter volume. This represents a balance between bulls and bears for the week and indecision. The long lower wick is slightly bullish while the red colour is slightly bearish.
Further comment on On Balance Volume will be suspended at the weekly chart level until the current week is over and OBV is updated for the week. Because price has made a new high above the prior swing high of April 2016, OBV should also make a new high at the end of this week.
Volume is declining while price has essentially moved sideways for the last ten weeks in a zone delineated by brown trend lines. The longer price meanders sideways the closer a breakout will be. During this sideways range, it is a downwards week which has strongest volume suggesting a downwards breakout may be more likely. However, price is breaking out upwards. This breakout should come with an increase in volume for it to be reliable (as opposed to potentially a false breakout). That cannot yet be determined because the week is not yet complete.
The strong green candlestick two weeks ago the most bullish signal for some time. With this now followed by a doji, some of this bullishness is dissipated.
The 40 week moving average has turned upwards, another bullish signal. However, this has happened before in October 2015 yet it was followed by a strong downwards wave. On its own this bullish signal does not necessarily mean price is going to make new all time highs.
DAILY CHART
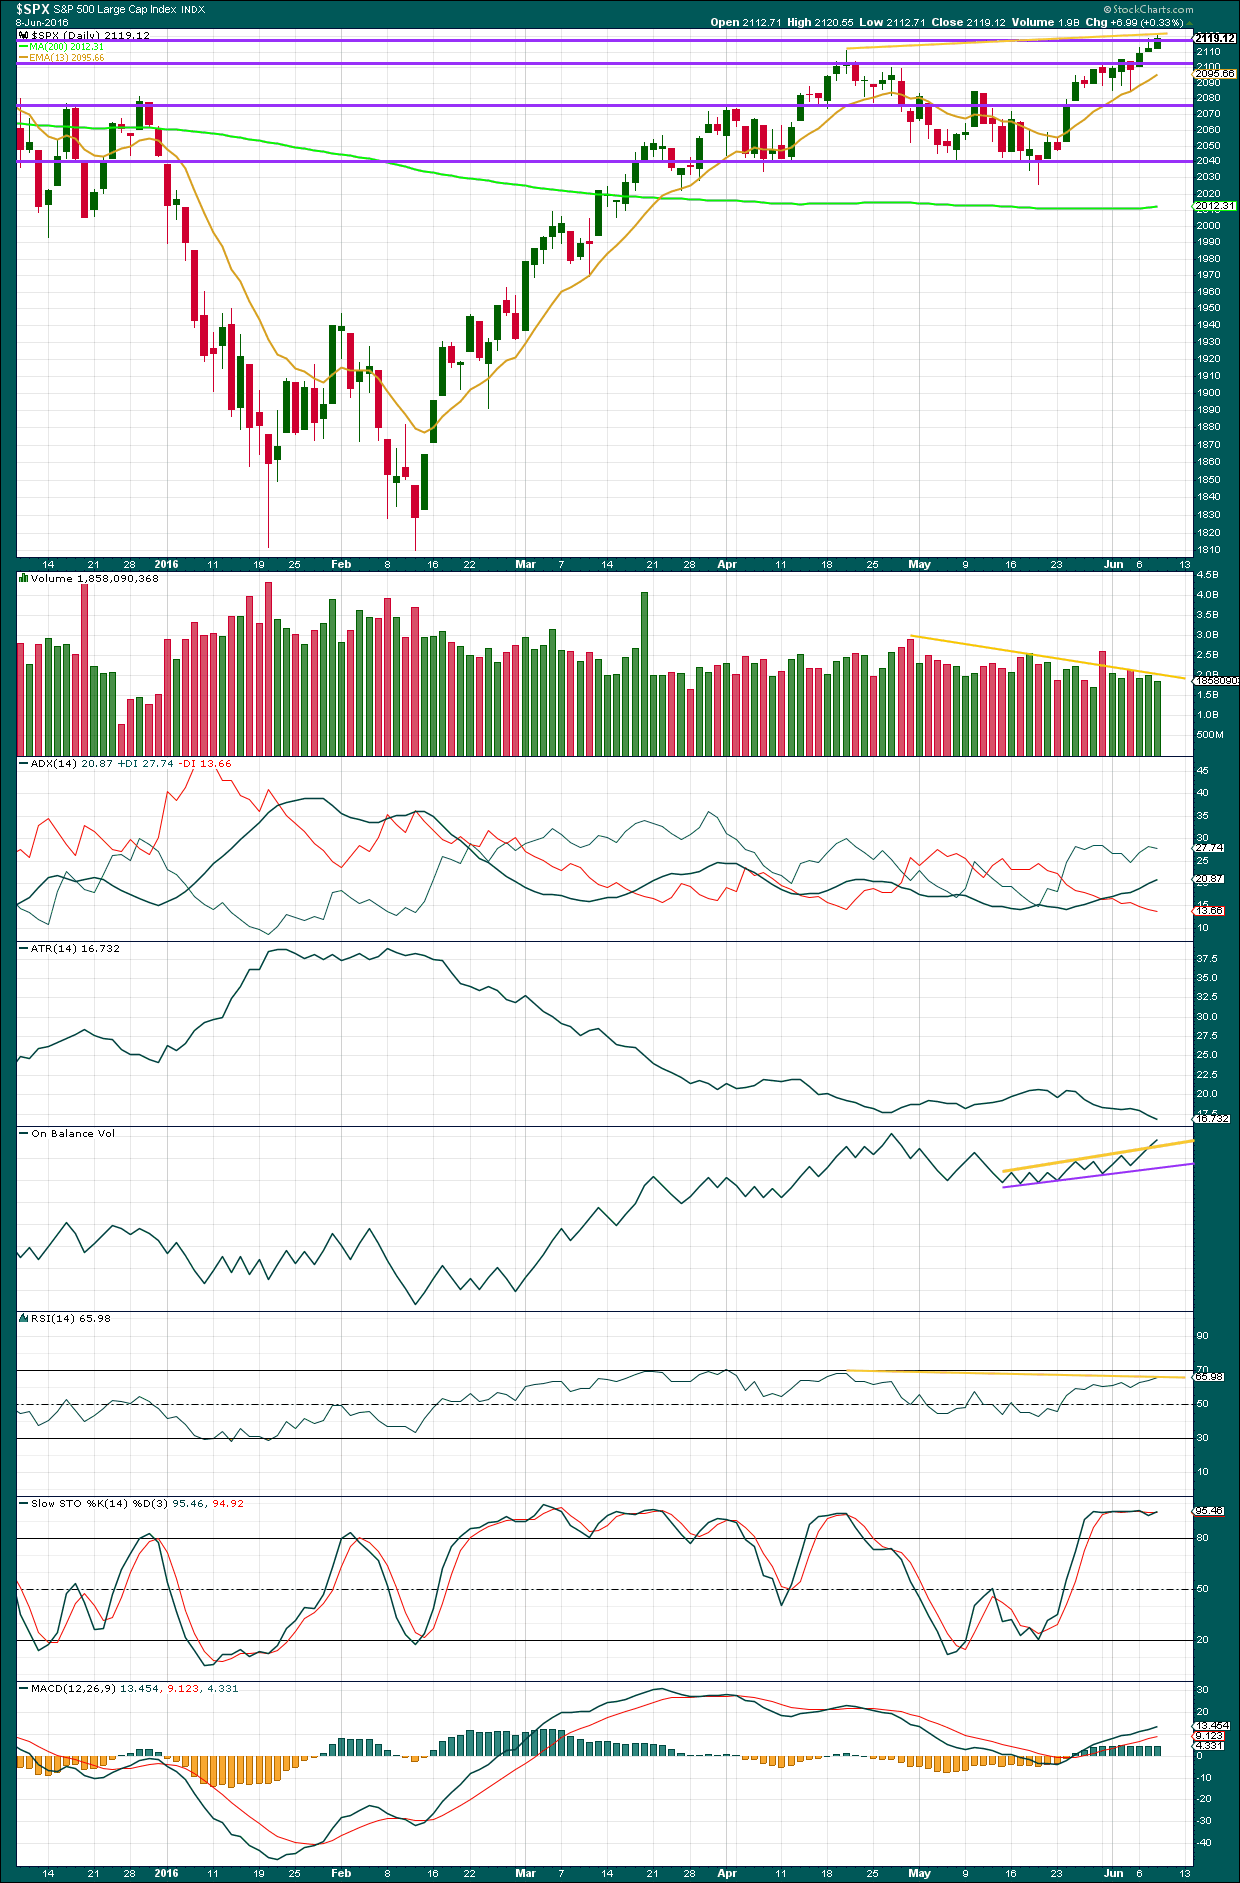
Click chart to enlarge. Chart courtesy of StockCharts.com.
Volume data on StockCharts is different to that given from NYSE, the home of this index. Comments on volume will be based on NYSE volume data when it differs from StockCharts.
The rise in price for Wednesday’s session was not supported by volume. Overall, volume continues to decline as price rises indicating that this upwards trend is not sustainable.
However, rising price on declining volume has been a pattern of this market for some time. Although in the long term it cannot be sustained because for price to keep rising it requires activity from buyers to push it up, that does not tell us when and where the rise must end. This rise in price is not sustainable long term but can be sustained for the shorter term.
ADX still indicates an upward trend is in place. ATR still disagrees. It is declining as price continues higher which indicates continuing weakness from bulls: each day they are able to push price up by a smaller and smaller amount. Eventually, they will be exhausted and a pullback may relieve this exhaustion.
On Balance Volume is giving another weak bullish signal today with a break above the yellow line. This line is not too steep, tested at least four times but not long held, so it offers only weak technical significance. There is still divergence between price and On Balance Volume from the high on 27th April to today’s new high: price has made new highs but OBV has not made a corresponding new high. This indicates weakness in price. Again, it only indicates weakness to this upwards movement and does not indicate that price must turn nor does it tell when and where price may turn.
There is still persistent divergence which is fairly long held between price and RSI: from the high for price on 20th of April, price this week has made new highs but RSI has so far failed to make a corresponding new high. RSI on 20th of April was at 68.24 and today RSI is at 65.98. Divergence between price and RSI is usually a fairly reliable indicator of a trend change, but again it does not indicate exactly when and where price may turn but only that it is very likely to turn.
There is still divergence with price and Stocahstics, but this divergence is not very reliable. During a trending market Stochastics may remain extreme for reasonable periods of time.
VOLATILITY – INVERTED VIX MONTHLY CHART
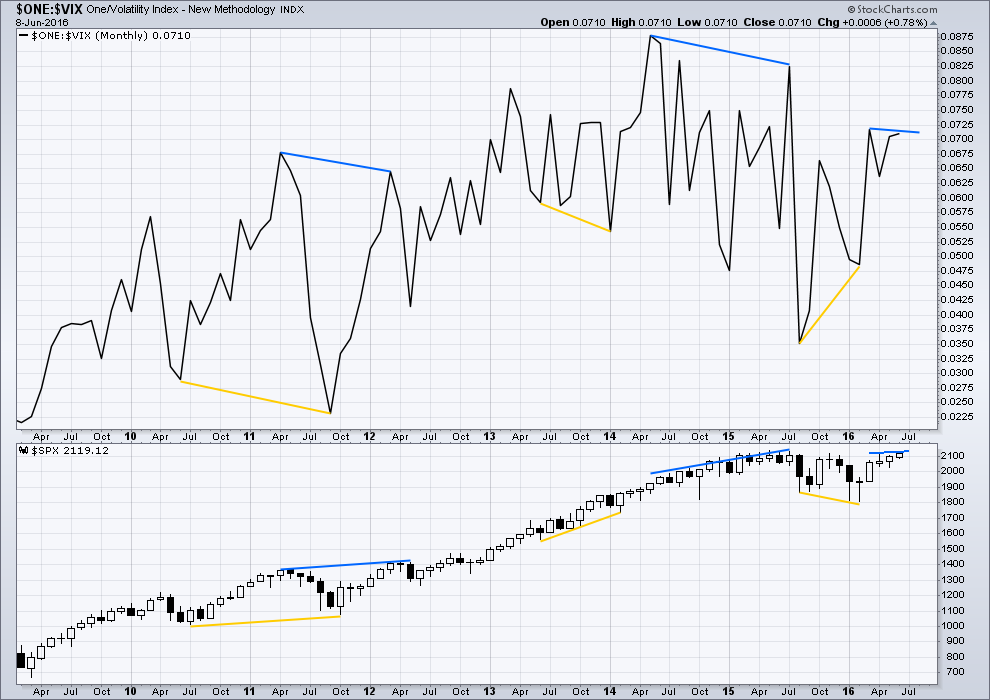
Click chart to enlarge. Chart courtesy of StockCharts.com.
Several instances of large divergence between price and VIX (inverted) are noted here. Blue is bearish divergence and yellow is bullish divergence (rather than red and green, for our colour blind members).
Volatility declines as inverted VIX rises, which is normal for a bull market. Volatility increases as inverted VIX declines, which is normal for a bear market. Each time there is strong multi month divergence between price and VIX, it was followed by a strong movement from price: bearish divergence was followed by a fall in price and bullish divergence was followed by a rise in price.
There is still current multi month divergence between price and VIX: from the high in April 2016 price has made new highs in the last few days but VIX has failed so far to follow with new highs. This regular bearish divergence still indicates weakness in price.
VOLATILITY – INVERTED VIX DAILY CHART
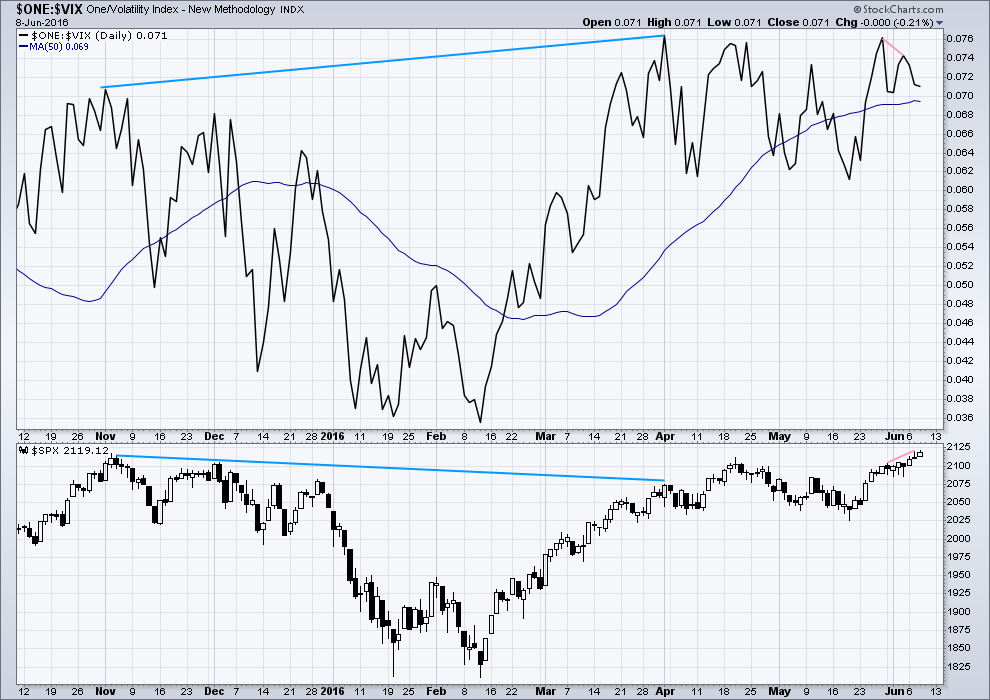
Click chart to enlarge. Chart courtesy of StockCharts.com.
There is now only one instance of hidden bearish divergence noted on this daily chart of price and VIX (blue lines). VIX makes higher highs as price makes lower highs. The decline in volatility is not matched by a corresponding rise in price. Price is weak.
There is also very short term regular bearish divergence (pink lines). VIX did not make a corresponding new high as price made a new high in the last three days. This indicates exhaustion for bulls and underlying weakness in price.
Now price has moved higher for three days in a row completing green daily candlesticks yet VIX has moved lower. This short term divergence between price and VIX is unusual. It indicates further exhaustion from bulls. This trend in price is weak, especially for the last three days.
While I would not give much weight to divergence between price and many oscillators, such as Stochastics, I will give weight to divergence between price and VIX. Analysis of the monthly chart for the last year and a half shows it to be fairly reliable.
BREADTH – ADVANCE DECLINE LINE
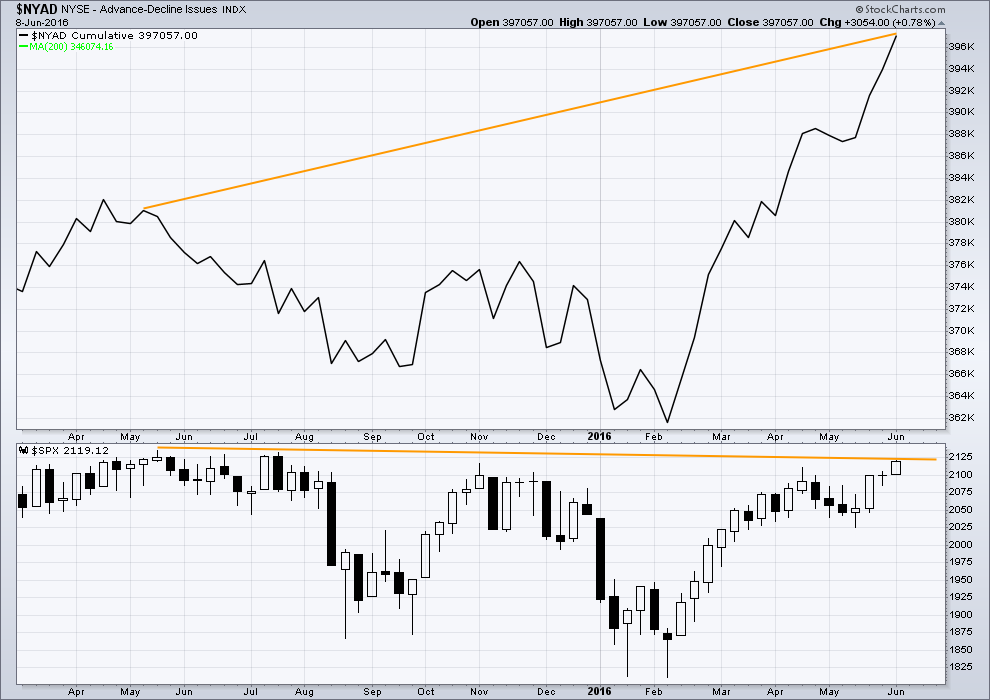
Click chart to enlarge. Chart courtesy of StockCharts.com.
With the AD line increasing, this indicates the number of advancing stocks exceeds the number of declining stocks. This indicates that there is breadth to prior upwards movement.
Taking a look at the bigger picture back to and including the all time high on May 2015, the AD line is making substantial new highs but price so far has not. While market breadth is increasing beyond the point it was at in May 2015, this has not translated (yet) into a corresponding rise in price. Price is weak. This is hidden bearish divergence.
It is also noted that the AD line diverged for the four months prior to the all time high; this was regular bearish divergence.
DOW THEORY
The last major lows within the bull market are noted below. Both the industrials and transportation indicies have closed below these price points on a daily closing basis; original Dow Theory has confirmed a bear market. By adding in the S&P500 and Nasdaq a modified Dow Theory has not confirmed a new bear market.
Within the new bear market, major highs are noted. For original Dow Theory to confirm the end of the current bear market and the start of a new bull market, the transportation index needs to confirm. It has not done so yet.
Major lows within the prior bull market:
DJIA: 15,855.12 (15th October, 2014) – closed below on 25th August, 2015.
DJT: 7,700.49 (12th October, 2014) – closed below on 24th August, 2015.
S&P500: 1,821.61 (15th October, 2014) – has not closed below this point yet.
Nasdaq: 4,117.84 (15th October, 2014) – has not closed below this point yet.
Major highs within the new bear market:
DJIA: 17,977.85 (4th November, 2015) – closed above on 18th April, 2016.
DJT: 8,358.20 (20th November, 2015) – has not closed above this point yet.
S&P500: 2,116.48 (3rd Nobember, 2015) – has now closed above this point on 8th June, 2016.
Nasdaq: 5,176.77 (2nd December, 2015) – has not closed above this point yet.
It is a reasonable conclusion that the indices are currently in a bear market. The trend remains the same until proven otherwise. Dow Theory is one of the oldest and simplest of all technical analysis methods. It is often accused of being late because it requires huge price movements to confirm a change from bull to bear. In this instance, it is interesting that so many analysts remain bullish while Dow Theory has confirmed a bear market. It is my personal opinion that Dow Theory should not be accused of being late as it seems to be ignored when it does not give the conclusion so many analysts want to see.
This analysis is published @ 09:36 p.m. EST.

2100 pivot is – as expected – acting like a magnet.
Not exacting cutting through it like butter 🙂
But should give way soon enough…
Hard core Elliotticians eschew any discussion that attempts to link the developing waves with news events. It is really an academic “chicken or egg” kind of debate as absolutely no one denies how frequently dramatic moves in the markets are accompanied by dramatic events, 9-11 being one obvious example. The whole notion of the “exogenous shock”, or what Taleb famously referred to as “black swans”.
I have posted a few times that I think the next shock would be the collapse of the bond market, and particularly the I.O.U.s of central banks. It seems however, there is an imminent event that might also have the power to produce substantial ripples throughout global equities markets, and one that I frankly have not paid much attention to.
I am talking about the possible exit of the UK from the E.U.
This could end up being a much bigger deal than most folk think. The apparatchiks who benefit from this cozy arrangement are becoming increasingly shrill about the doom and destruction they assure us all will result if the people of the UK opt to extricate themselves from economic serfdom, and regain the right to fire the politicians who enact laws they have to live with.
Some smart observers are saying to watch the DAX.
Germany, more than any other EU member, has reaped a bountiful economic harvest by what is really nothing more than a “beggar thy neighbour” economic system, in which the stronger nations in the union consume the weaker, and delude them into thinking they can enjoy a standard of living way beyond their means by saddling future tax-paying generations with debt that can never be repaid.
As sure as Germany had the most to gain from this arrangement, so surely do they stand to loose the most by its demise. Make no mistake about it. If the UK leaves, it could be the first of many falling dominoes.
The DAX might give an early clue as to the Brexit vote outcome.
Uncharted waters. In a recent survey France hated the EU far more than UK. The unwind will be messy. No real positives I can see shorter term.
Hmm, very confused! As I’m still new to trading not really sure what I’m trading! I thought it was the S&P index but I have just realised it might be the futures? Wasn’t really sure what I was trading LOl. My broker has an automatic rollover and as of the close tonight and reopen the price has dropped to 2,103.00 ish, does that mean the index will follow suit? It’s also a shame they deduct the profit from the drop 🙁
Mally if you are trading the ES futures contract then you are essentially trading the S&P 500 Index. The June contract (designated with an M) is rolling off in favor of September (designated with a U). The discount down to 2003 from 2012 or so reflects the carry (dividend yield less the discount rate) that a long holder will pickup from now until September. Essentially, the September contract will trade closer and closer to the Index price as we move toward September. Hope that helps.
Edit 2103 and 2112 above.
Also keep in mind that when the discount rate is higher than the dividend yield then the premium will be paid by the long position, so the September contract would actually be higher than the Index price because of the carry (opposite of where we are today).
Thanks for the explanation Corey, I appreciate your help.
Lara- I keep meaning to ask you this, but I always forget. It is in regards to you Advance/Decline section of your daily analysis. Should AD line confirm with Index or should index confirm with AD line? For example, wouldn’t a bearish divergence mean that the SP index is making new highs while the NYSE AD line fails to confirm it? It would mean that all the smaller companies (too small to be in the SP500) are not participating in the rally.
So when the AD line is shooting up and the SP500 index is not confirming, wouldn’t this instead be a bullish divergence ?
That’s how I remember it…but, it’s been a few years and I can’t remember where/how I learned it that way.
To be fair, I’ve checked both Pring and Kirkpatrick & Dhalquist and I can’t find an explanation of how to interpret this current situation; the AD line moving ahead of the index.
What I can find is simply the statement that the AD line should roughly replicate the index. Instances of divergence are important, but the texts I have only discuss regular bearish divergence at highs when the AD line makes lower highs while price makes higher highs.
Regular bearish divergence is easier to understand and interpret.
What I am seeing here is hidden bearish divergence.
I did spend some time thinking through what it means, which is how I’ve described it. This is my conclusion. That the AD line shows more breadth in the market currently than it did back in November 2015, but this increase in breadth has so far failed to translate into a corresponding increase in price.
This Divergence Cheat Sheet may be helpful.
Hidden divergence is more difficult to understand I think, but I would not say it doesn’t apply to the AD line. I would rather say it applies to the AD line in exactly the same way it would apply to On Balance Volume, MACD, Stochastics or any other indicator or oscillator.
I would not be interpreting this current divergence as saying that price must catch up with the AD line, because that would be an interpretation on what price should do and not what price is doing now.
Does that make sense?
I agree, it can be confusing.
gotcha…thanks for the clarity.
I remember seeing a chart not too long ago that showed market breadth increasing during the last bear market decline…
you may want to consider a trial subscription to Lowry Research…during the trial you can learn about the conventional AD and the operating company AD…
https://www.lowryresearch.com
A quiet day for the markets and a quiet day here.
Price has found support at the lower edge of the blue trend channel on the hourly chart. It needs to break below that channel, when that happens it may gather a little momentum. While it’s still in that channel it may well go up for another one to few days…
No confirmation yet of a trend change.
I’ve set my position. I’ll forget it now. I’m prepared for the possible pain of holding a negative position for a few days. I’m also prepared for the possibility that I’m wrong. I don’t think so, but it’s possible.
FWIW the downwards move on the five minute chart fits perfectly as an impulse, with
Verne – you seeing the indexes gapped down, then stayed down for half the day, and still with 3 full hours of buying the gap is not filled? Then take a look at a 5min chart on the NYSE, RUT and INDU. Now I’m getting more exicited about a drop tomorrow/Monday. Showing bull exhaustion.
Filled Sept. E-minis short at 2106.75 SPX 2117.45
With you Peter.
Got filled on another tranche at 2107. Average is currently 2104.05
Congrats on your fills…you both have nice fills. I’m at 2105.50, got in a little on the early side, but I’ll have to work with it 🙂
Q,
You’re better off than me on avg terms, so the kudos must go to you 🙂
Yes Peter. I was so nervous about the market today I set an alert to trigger if UVXY filled its opening gap and walked away for the rest of the day. I occasionally checked in with Bloomberg to see what was happening and was convinced that the slow fade of the decline would send UVXY plummeting back South.
I was pleasantly surprised that the alert I was expecting never came. While maintaining that open gap is not a sufficient achievement to confirm the bearish case, from what I know of how it trades, it was a necessary one.
Like Lara, it looks like an impulse down to me as well.
Even if futures remain a bit muted overnight, as long as they don’t blow past the ATH I think the bears have a fighting chance here…note how UVXY has started to keep pretty good pace with VIX to the upside. It looks like they are both getting ready to rumble….
BTW, R.I.P. the late, great Mohamed Ali…most awesome rumbler ever!!
Quang Vo: I’m still trading this pattern posted a few days ago, until the market proves it wrong. I’ve been short big time ETF’s (mainly at SPX 2099.60) but have gone long on E-minis more than once so net ahead yet. So yes, wave C down yet, my opinion. If you trade it and lose money, sorry. If you win give me half. 🙂
Sounds like a great deal for me Peter……lol.
I like high probability trades, and this looks like a high probability trade. Bull/Bear count, we should go down either way. Hopefully it will pay, but even if it turns out to be a loser…it’s a trade I’ll take any day.
even if, the bear count is wrong ( i don’t think so), and we’re in a bull count, we should still retrace the recent bull move. If so, then we would see a C wave sell off if we just finished a and b waves….correct?
Yes. No matter what anyone’s position on the long term bull/bear market there will be a pull back.
Every scenario posted on this site accounts for that
How deep the pull back goes will provide clues as to what scenario is playing out.
A ton of open interest at the 2100 pivot. The crowd is convinced this round number is going to hold on any pullback…they are right to think it is critical what happens there…it is…
The last time we trade below 2100 was June 3 when UVXY traded at 11.02 watch that number…
I meant to say if UVXY trades above 11.02 BEFORE we take out SPX 2100 it would be shot across all bullish bows…
I am still short myself, but yesterday trending software i follow that had been given me confidence in “bear” count turned to long term bullish…it turned long term bearish in mid Sept 2015 for long term trend, which had given me confidence to short rally’s. The software is (Direction Alerts). Most other trending software has turned bullish too. I plan to cover my shorts via inverse ETF and Sept spy and IWM puts “hopefully” with a drop this summer to the ~1950 SPX area. (if that happens, not sure i will buy then unless setup looks right, but i will cover all shorts. ) I would expect Fed to keep market manipulated through Nov election. Still banking on the Bull wave count correction coming by end of July. IMO
Thanks for sharing that Jeremy. I like keeping other possibilities in mind…just in case.
Good point Jeremy. If the banksters are not pushing the market higher I don’t think it is bacause they are not trying, especially as you pointed out, during an election year. I really thought they would ramp it past the ATH today as they have never been closer.
Once again I think the trading around the round number pivots is going to be key to where we go next.
If we are about to see a C impulse wave down as part of a corrective move VIX will probably signal that it is terminal with a long upper wick…that I think will be the signal to go long and strong…
Same area I’m looking for, and similar time frame.
Its pulled me back in, going short futures at 2117.40ish and will hold overnight. Like the 76.4% retrace; filling the gap.
62% retrace from yesterday’s high to today’s low. Could be top of a 2 wave of some sort her….ZZ?
unfortunately, hourly and daily charts still look bullish.
except…today’s low is lower the previous 2 days low.
Re-shorting 1/2 position here.
looks like it could break down from here… 🙂
sheez…looks like I spoke too soon….wishful thinking.
Looking like a gap fill attempt is in the works…
EOD melt up is coming a little early today.
Could still crash into the close…
Here’s a question for anyone who trades the SP emini’s.
I trade emini’s via trade station, when I offer out an order, sometimes I get a partial fill. For example, I rarely show my full size, most of the time I am showing 1-3 contracts, but I will get a 7 contracts filled, leaving the rest of my order unfilled. Then I see a ton of trades go through at my current price, but it’s not filling the rest of my order. Has anyone else experienced this? If so any idea why? I thought it was 1st come 1 served. it’s not like their price is better then mine by 1/100 of a dollar…so why does that happen? TIA for anyone who can help answer that question.
I have not experienced that, but using IB.
Most major markets around the world down about 1%… Looks like we might be heading that way. The dam showing some cracks… good old NASDAQ leading the way down, even though it was holding up strongly earlier…
Going long at 2106.30ish
….just covered my short from yesterday pm myself. Looking to re-evaluate.
Must admit, price action so far hasn’t been very bearish…
Unable to break even minor support. And so this may attract the BTFD posse…
But maybe, just maybe https://www.youtube.com/watch?v=4F4qzPbcFiA
🙂
LOL! Bear trap or bull trap?
If we have rolled over, we are in the very early stages. Moves down wont be accelerating quickly here…IMHO.
If Primary 2 up has just completed, all the late bulls who missed the run up in P2, will buy all these initial dips….
So my game plan is to short the rallies and cover as the momentum slows (at least early on). Once the waves move further along in progression of degrees, I’ll start holding my trades a little longer.
If this is indeed the start of Primary wave 3 down, there are many smaller degree wave2’s to short over the next few weeks.
I believe in Lara’s count… however, I need to remain nimble…so I can sleep at night.
That’s my game plan also.
Pretty confident right now we have a local top in place but this isn’t going to drop without a lot of whip and gorp first.
Just to keep everyone on their toes.
I missed my entry to go long, computer buying then kicked in (it is their money I love taking the most). Oh well, will sit out for the last few hours today. Up on long dollar trade at least.
Nice call though Peter, a whisker more would have nailed it.
Gap open of UVXY looking too weak to be a break-away gap.
For the bearish case that gap should stay open.
If it is filled, then it has to be on its way to printing a bullish engulfing candle.
If none of those two things happen today, may the Great Bear R.I.P. At least for the short and medium term imho…
The worshiping of Price as the absolute determinant “the ONLY determinant” is mind blowing to me!
Well I say Price works until it doesn’t work any more!
But let’s NOT forget all the forces out there manipulating Price to meet the objectives of “the Big CON” they are trying to pull off! This is the last thing I wanted to say for now.
Good Luck all… I am going Dark for a couple of weeks (for sanity). But will be lurking to read Lara’s analysis.
30 Year Treasury Bond goes sub 2.50% Yield… right now at 2.481%
Good night from me, and I’ll see you all in my morning. An uninterrupted nights sleep is on for me.
Good luck everybody, and remember, risk management is THE most important aspect of trading.
Lara’s two golden rules:
1. Never ever invest more than 3-5% of your equity on any one trade.
2. Always use a stop loss.
Excellent Advice.
It would seem that we now have more thrashing around from Mr Draghi and the ECB.
The have “announced” that they will now be buying corporate bonds and specifically mentioned Telefonica. They also announced remarkably, that they will be buying junk bonds as well!
Here’s the deal folk, this announcement is nothing more than a pathetic attempt so convince the crowd that they have more bullets. Only the dullest of observers would not understand that they have been doing exactly that all along behind the scenes. They are attempting to build a fire-wall around what they already know will be the next global financial catastrophe, namely, the implosion of government bonds. Good luck with the Mr. Draghi, you’re gonna need plenty of it…
Tomorrow is going to be a historic day, and one we will be talking about probably for years to come. If there was ever a point in the history of markets, where banksters were incentivized to display their financial prowess in affecting market price, it would be in demolishing the trivial eleven points that stand between them and new ATH in SPX. If they were able to pull it off it would not make me bullish- not quite yet. If they are not, it would be one of the most incredible demonstrations of the validity of EWT I have ever witnessed in all my years of trading.
As I indicated previously, the drama, nail-biting as it is, is entirely befitting a primary two top at super cycle degree. A more dramatic and convincing primary two top could not have been conceived in the most inventive of fairy tales!
I sure hope so Verne. I feel like a mouse being played by a cat, a Mr Market cat.
Enough of the suspense already! Show us your hand Market!
I hear ya. They have not so far showed their hand by jacking up futures through the roof…interesting…I wonder why not…?
If the bear count is right, and new high in SPX or not, I think the bear is coming, I will be looking for a signal in spiking volatility. I want to see UVXY at 12.20 at which time I will be jumping on board. There be lots of short sellers who will be covering…
Amazed that the bulls can pull this off so far. didn’t we just have 38 K jobs after expecting 160k? Didn’t we just have the last few months revised down? This is amazing. There seems to be an invisible hand at work here. The way to boil a frog to death is a little at a time so he doesn’t realize the temperature increase, just the way the bulls are raising this market . It reminds me of a previous election year where we just kept going up on a straight ramp. Now I don’t have any idea who specifically could be doing this or why. But I do have some suspicions about the government and their ability to manipulate markets. Some day this will be fully unveiled, whether it is done through goldman sachs or whoever and there will be a reckoning.
I think government $$ via QE has been propping up this market for years.
I suspect that’s why price has been rising on declining volume for years.
If EW theory is correct in terms of social mood, and if the bear wave count is correct and bull wave count is not, then government / banksters can push this right up to the ATH but not above. They can made this second wave deeper than it would otherwise be, but they can’t stop a third wave.
That’s the theory anyway. Lets see how this plays out.
I’ve entered another short position.
Stop this time just above the ATH, set at 2,137.81 (to allow for widening spread during times of volatility). Entry point 2,117.58. Risking 5% of equity.
I’m doing this mostly to get a good nights sleep. The risk is the price I’m prepared to pay to get it.
Target for now 1,271 but I’ll probably move that up once the downwards wave gets going and I can calculate targets at multiple wave degrees.
This is the final attempt for the bear wave count. If all that analysis at the monthly chart level is right, then the stop can’t be set any higher. This is it. If I have confidence in what I’m doing then I have to back myself.
I like your style Lara 🙂 I too went short today yet again; here’s to not getting burnt.. (clink)
*clinks cup… of tea*
That’s about as safe a trade as anyone could take at this juncture. If what I have been looking at overnight adds up, shorts from this level will be in significant profits later today.
Personally my stop is at 2123 (futures), but I’m pressing this move with a larger position size, and will be moving to breakeven asap.
Initial target is 2085
If tomorrow is a big down day I’ll be moving my stop either at breakeven or pretty close to it. I think it’s a great risk management technique TBH
I have a buy stop for UVXY at 12.15. If that order is filled tomorrow, I suspect it could be my best trade ever… 🙂
Lara,
Just curious, by setting your stop above the ATH, I suppose your are conceding that the bull count could still be in play. In other words, the market could rise above the ATH, but turn down before hitting your stop. In that case, would you assume that the bull count was in play, and therefore look to exit your short earlier?
Peter
No, not at all.
The reason is this: I have noticed that sometimes the spread with brokers widens considerably during times of high volatility.
While I absolutely don’t expect price to make a new all time high, it may get very close indeed and if it does then the spread on my brokers account for this instrument may widen to stop me out if my stop is at the ATH.
What I do to not be taken out by them is to calculate 3X the normal spread and put my stop that far away from the invalidation point.
I will use either an EW invalidation point or a trend line to place my stops.
If we see a new ATH then I’ll be exiting my short immediately.
OMG!!First!!:)
Nice 🙂
good job,,