Downwards movement was again expected for the session and again failed to materialise.
Summary: Price is persistently weak but no trend change is yet indicated. Earliest confidence in a trend change would come with a new low below 2,085.36. A breach of the large black channel on the daily chart would provide further confidence. Finally, a new low below 2,025.91 would provide confirmation.
Last published monthly charts are here.
New updates to this analysis are in bold.
BEAR ELLIOTT WAVE COUNT
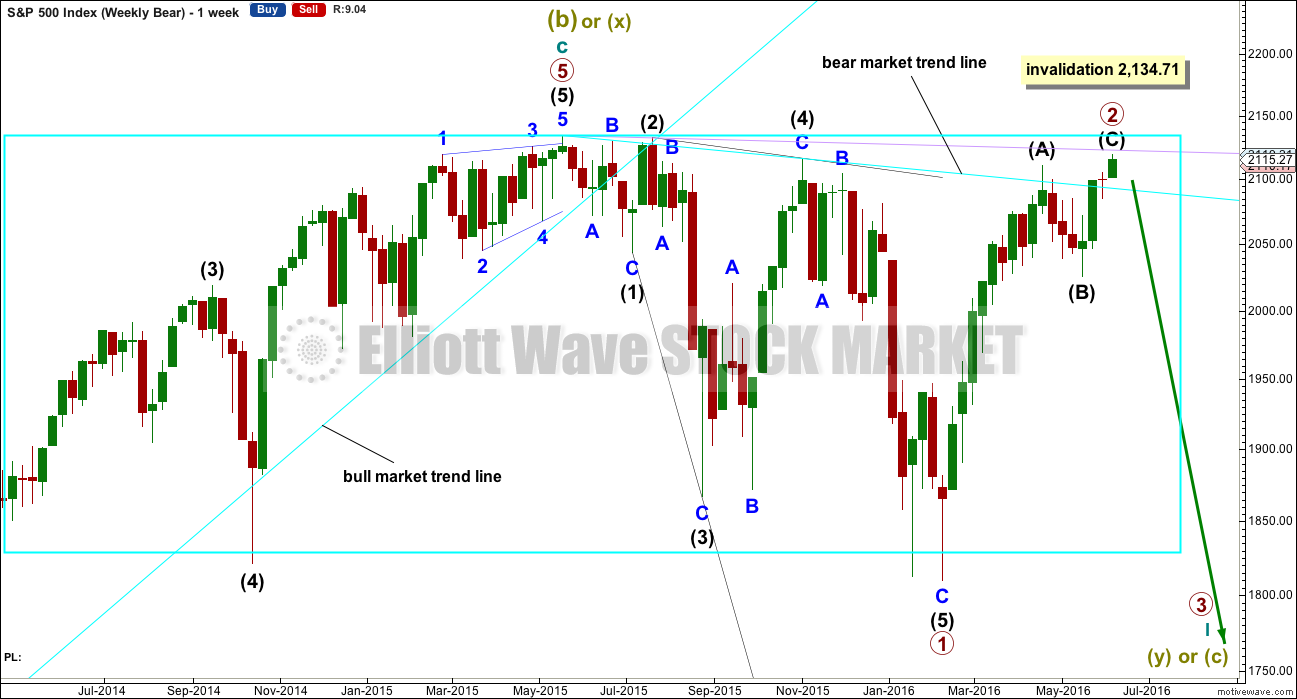
WEEKLY CHART
The box is added to the weekly chart. Price has been range bound for months. A breakout will eventually happen. The S&P often forms slow rounding tops, and this looks like what is happening here at a monthly / weekly time frame.
Primary wave 1 is seen as complete as a leading expanding diagonal. Primary wave 2 would be expected to be complete here or very soon indeed.
Leading diagonals are not rare, but they are not very common either. Leading diagonals are more often contracting than expanding. This wave count does not rely on a rare structure, but leading expanding diagonals are not common structures either.
Leading diagonals require sub waves 2 and 4 to be zigzags. Sub waves 1, 3 and 5 are most commonly zigzags but sometimes may appear to be impulses. In this case all subdivisions fit perfectly as zigzags and look like threes on the weekly and daily charts. There are no truncations and no rare structures in this wave count.
The fourth wave must overlap first wave price territory within a diagonal. It may not move beyond the end of the second wave.
Leading diagonals in first wave positions are often followed by very deep second wave corrections. Primary wave 2 would be the most common structure for a second wave, a zigzag, and fits the description of very deep. It may not move beyond the start of primary wave 1 above 2,134.72.
Price may find resistance at the lilac trend line if it continues higher.
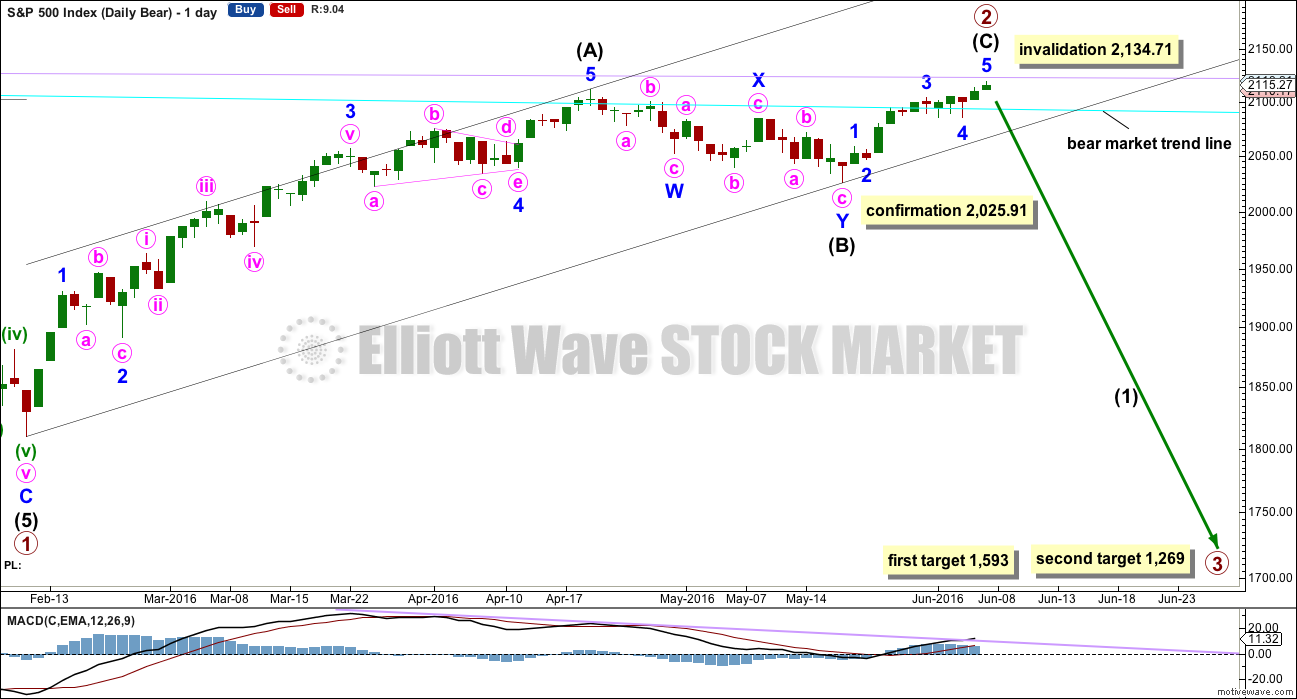
DAILY CHART
So far primary wave 2 would be a 0.95 correction of primary wave 1. Second wave corrections following first wave leading diagonals are commonly very deep, so this fits the most common pattern if primary wave 1 was a leading diagonal.
The most common structure for a second wave correction is a zigzag.
There is still no Fibonacci ratio between intermediate waves (A) and (C).
Intermediate wave (C) must be a five wave structure. It may be either an impulse or an ending diagonal. It would be unfolding as an impulse, not a diagonal. The structure may be complete, but as yet there is no evidence of a trend change.
Draw a channel about primary wave 2 using Elliott’s technique for a correction: the first trend line from the start of the zigzag, then a parallel copy on the end of intermediate wave (A). When this channel is breached by downwards movement it would be indicating a possible trend change. A new low below 2,025.91 would provide price confirmation of a trend change. At that stage, downwards movement could not be a second wave correction within intermediate wave (C) and so intermediate wave (C) would have to be over.
The targets calculated are provisional only because at the end of this session there is no confirmation of a trend change. They come with the caveat that price may yet move higher which means the targets would move correspondingly higher. They also come with the caveat that at this very early stage a target for primary wave 3 may only be calculated at primary degree. When intermediate waves (1) through to (4) within primary wave 3 are complete, then the targets may change as they can be calculated at more than one wave degree. Primary wave 3 may not exhibit a Fibonacci ratio to primary wave 1.
The first target at 1,593 is where primary wave 3 would reach 1.618 the length of primary wave 1. This target would most likely not be low enough because primary wave 2 is very deep at 0.95 the length of primary wave 1. Primary wave 3 must move below the end of primary wave 1, and it must move far enough below to allow subsequent room for primary wave 4 to unfold and remain below primary wave 1 price territory. Normally, there is a gap between first wave and fourth wave price territory, particularly in a bear market.
The next target may be more likely. At 1,269 primary wave 3 would reach 2.618 the length of primary wave 1.
If primary wave 3 does not exhibit a Fibonacci ratio to primary wave 1, then neither of these targets would be correct.
Well before these targets, it should be obvious if the next wave down is a primary degree third wave. It should exhibit increasing ATR, strong momentum, and a steep slope. However, please note that although it may begin very strongly it does not have to. It may also be that intermediate wave (1) maintains an ATR about 20 – 30 and has some deep time consuming corrections within it. That was how the last primary degree third wave began within the last bear market, so it may happen again.
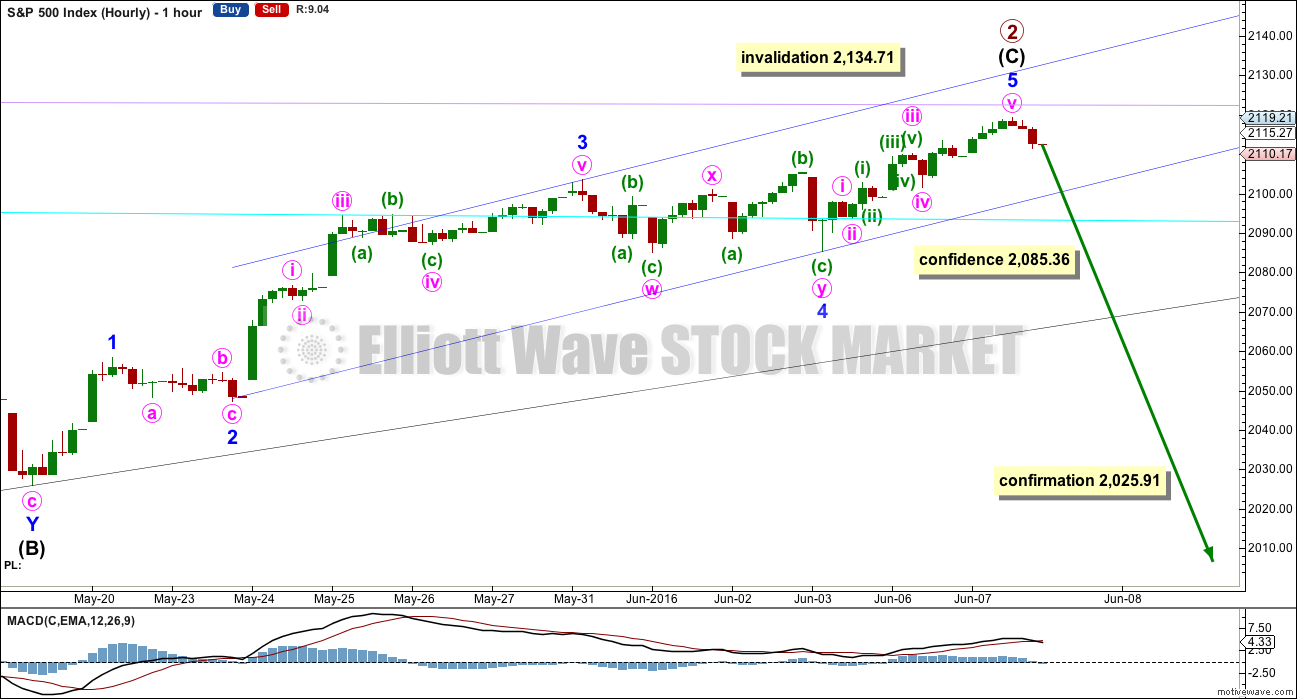
HOURLY CHART
The hourly chart shows the whole structure of intermediate wave (C). This upwards movement is seen as a five wave impulse for all wave counts, so this one hourly chart will suffice for both bear and the bull wave count. The degree of labelling only would be different.
A five wave impulse upwards from the low labelled intermediate wave (B) on 19th of May may now be complete, but the fifth wave may also continue higher.
This wave count at the hourly chart level agrees with MACD. The strongest piece of movement is the third wave. The fifth wave exhibits weaker momentum and divergence with MACD.
Minor wave 3 is 3.05 points longer than 1.618 the length of minor wave 1. If minor wave 5 is over at today’s high, then it would be 1.41 points longer than equality in length with minor wave 1.
The first indication of a potential trend change would come with a breach of the blue channel containing intermediate wave (C). Along the way down, expect to see some support, and a bounce, at the cyan bear market trend line.
A new low below 2,085.36 could not be a second wave correction within minor wave 5, so at that stage minor wave 5 would have to be over. This price point needs only to be passed by any amount at any time frame.
Thereafter, the same rule is used for the confirmation point at 2,025.91. A new low by any amount at any time frame below this point could not be a second wave correction within intermediate wave (C), so at that stage intermediate wave (C) would have to be over.
To the upside, price may find resistance at the lilac trend line now. It looks like today this line may be stopping price from moving any further.
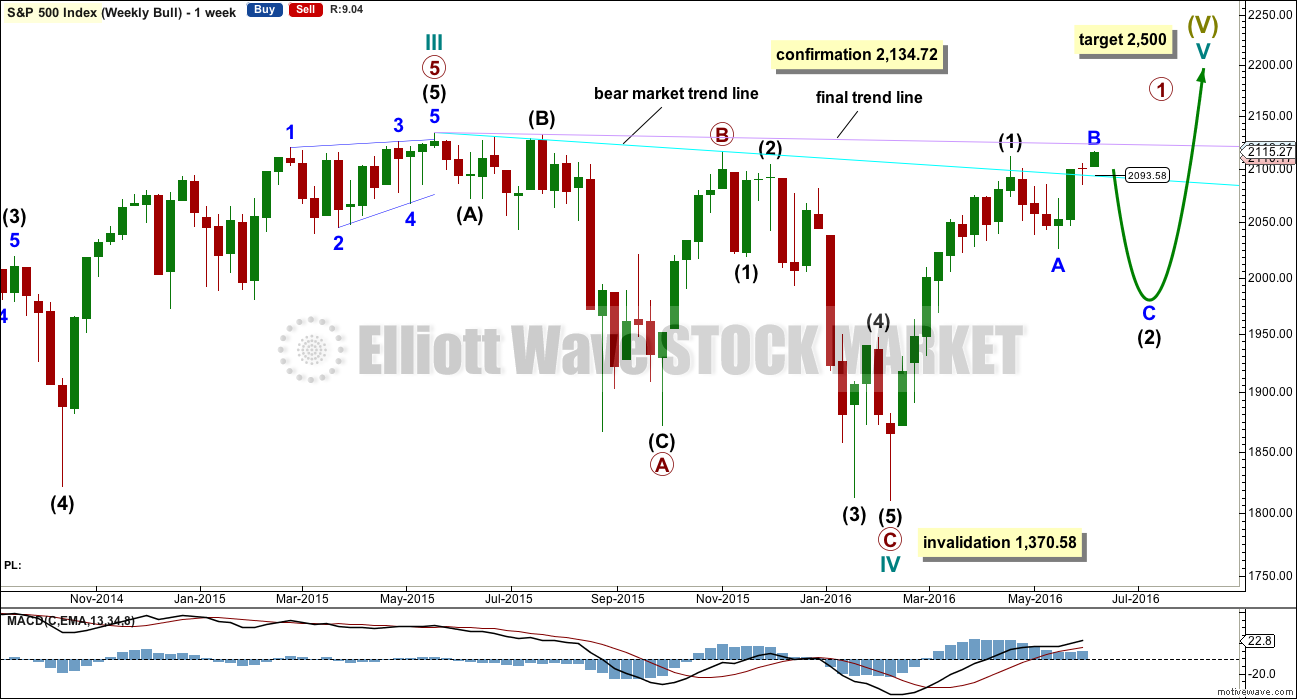
BULL ELLIOTT WAVE COUNT
WEEKLY CHART
Cycle wave IV is seen as a complete flat correction. Within cycle wave IV, primary wave C is still seen as a five wave impulse.
Intermediate wave (3) has a strong three wave look to it on the weekly and daily charts. For the S&P, a large wave like this one at intermediate degree should look like an impulse at higher time frames. The three wave look substantially reduces the probability of this wave count. Subdivisions have been checked on the hourly chart, which will fit.
Cycle wave II was a shallow 0.41 zigzag lasting three months. Cycle wave IV may be a complete shallow 0.19 regular flat correction, exhibiting some alternation with cycle wave II and lasting nine months. Cycle wave IV would be grossly disproportionate to cycle wave II, and would have to move substantially out of a trend channel on the monthly chart, for it to continue further sideways as a double flat, triangle or combination. For this reason, although it is possible, it looks less likely that cycle wave IV would continue further. It should be over at the low as labelled.
At 2,500 cycle wave V would reach equality in length with cycle wave I.
Price has now broken a little above the bear market trend line. This line is drawn from the all time high at 2,134.72 to the swing high labelled primary wave B at 2,116.48 on November 2015. This line is drawn using the approach outlined by Magee in the classic “Technical Analysis of Stock Trends”. To use it correctly we should assume that a bear market remains intact until this line is breached by a close of 3% or more of market value. Now that the line is breached, the price point at which it is breached is calculated about 2,093.58. 3% of market value above this line would be 2,156.38, which would be above the all time high and the confirmation point.
This wave count requires price confirmation with a new all time high above 2,134.72.
While price has not made a new high, while it remains below the final trend line (lilac) and while technical indicators point to weakness in upwards movement, this very bullish wave count comes with a strong caveat. I still do not have confidence in it. It is produced as an alternate, because all possibilities must be considered. Price managed to keep making new highs for years on light and declining volume, so it is possible that this pattern may continue to new all time highs for cycle wave V.
The invalidation point will remain on the weekly chart at 1,370.58. Cycle wave IV may not move into cycle wave I price territory.
This invalidation point allows for the possibility that cycle wave IV may not be complete and may continue sideways for another one to two years as a double flat or double combination. Because both double flats and double combinations are both sideways movements, a new low substantially below the end of primary wave C at 1,810.10 should see this wave count discarded on the basis of a very low probability long before price makes a new low below 1,370.58.
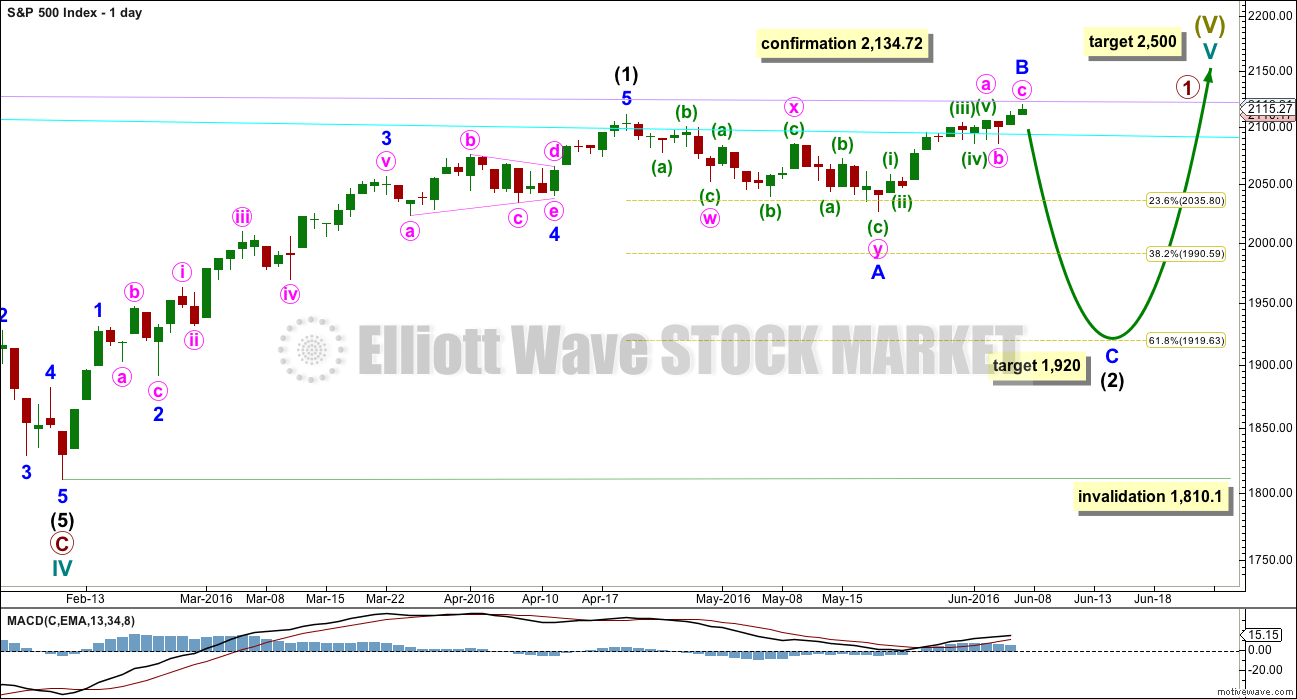
DAILY CHART
Intermediate wave (2) may still be an incomplete flat correction. Minor wave A will subdivide as a three, a double zigzag, and minor wave B may be seen as a single zigzag.
The most likely point for intermediate wave (2) to end would be the 0.618 Fibonacci ratio at 1,920.
Intermediate wave (2) may not move beyond the start of intermediate wave (1) below 1,810.10.
TECHNICAL ANALYSIS
WEEKLY CHART
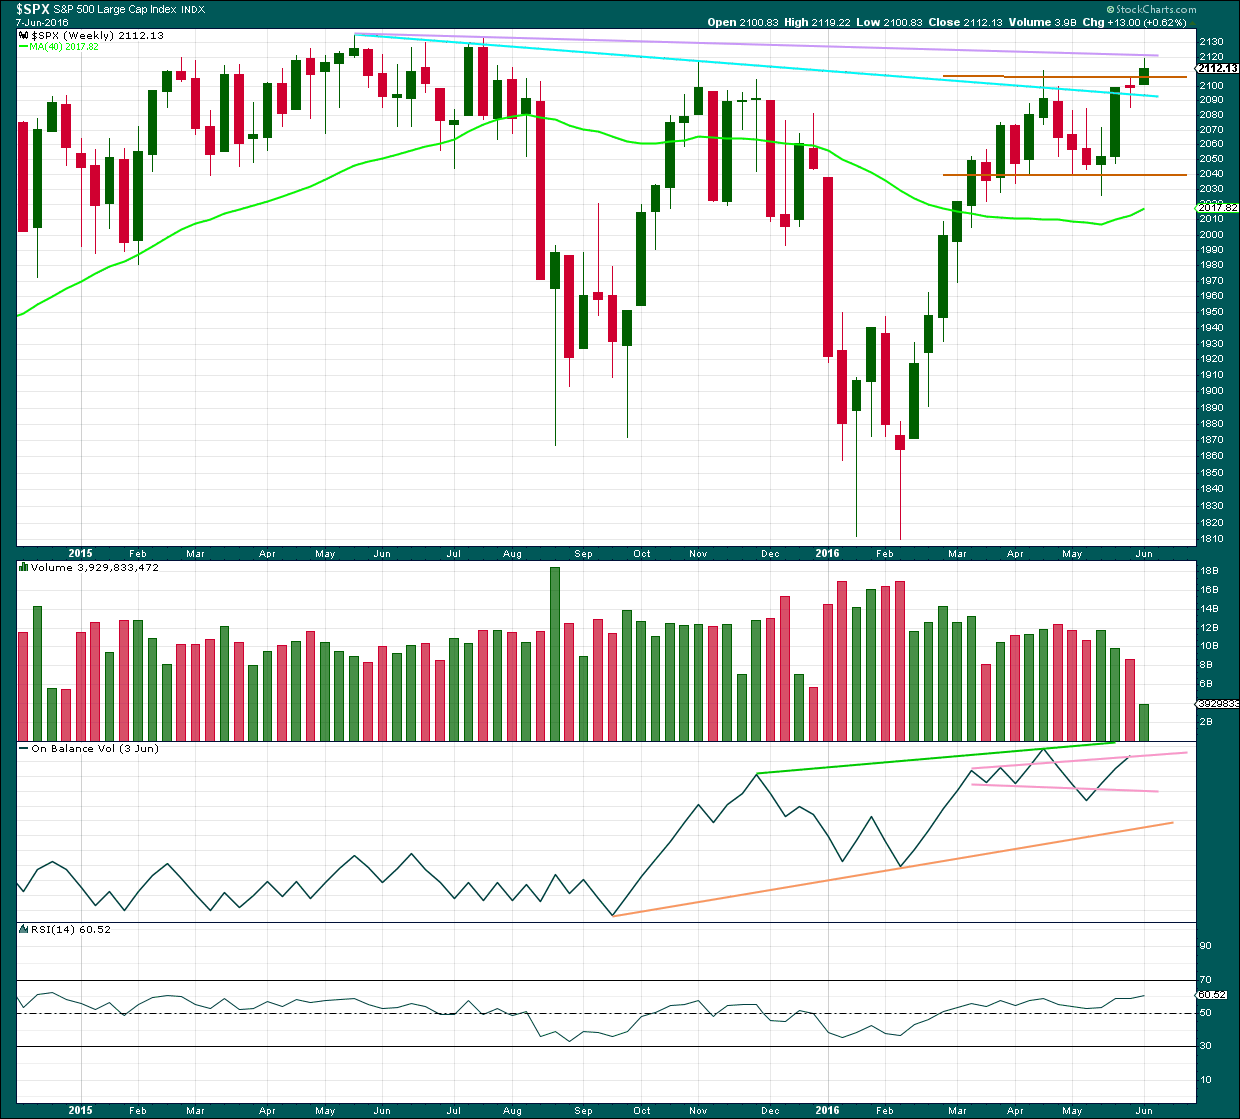
Click chart to enlarge. Chart courtesy of StockCharts.com.
Price is the final determinator and the most important aspect of market analysis. So what has price been doing since the all time high in May 2015?
Price today has made an important new high above the prior major high of November 2015. Price is now finding resistance at the lilac line. It can no longer be said that price is making lower highs and lower lows because it no longer has a lower high. This is the most bullish indication from price for many months.
Last week completes a small doji pattern with lighter volume. This represents a balance between bulls and bears for the week and indecision. The long lower wick is slightly bullish while the red colour is slightly bearish.
On Balance Volume no longer shows divergence with price: from the high in November 2015 to the high in April 2016 both OBV and price have now made new highs. The weakness up until today though still did exist.
Volume is declining while price has essentially moved sideways for the last ten weeks in a zone delineated by brown trend lines. The longer price meanders sideways the closer a breakout will be. During this sideways range, it is a downwards week which has strongest volume suggesting a downwards breakout may be more likely.
The strong green candlestick two weeks ago the most bullish signal for some time. With this now followed by a doji, some of this bullishness is dissipated.
The 40 week moving average has turned upwards, another bullish signal. However, this has happened before in October 2015 yet it was followed by a strong downwards wave. On its own this bullish signal does not necessarily mean price is going to make new all time highs.
DAILY CHART
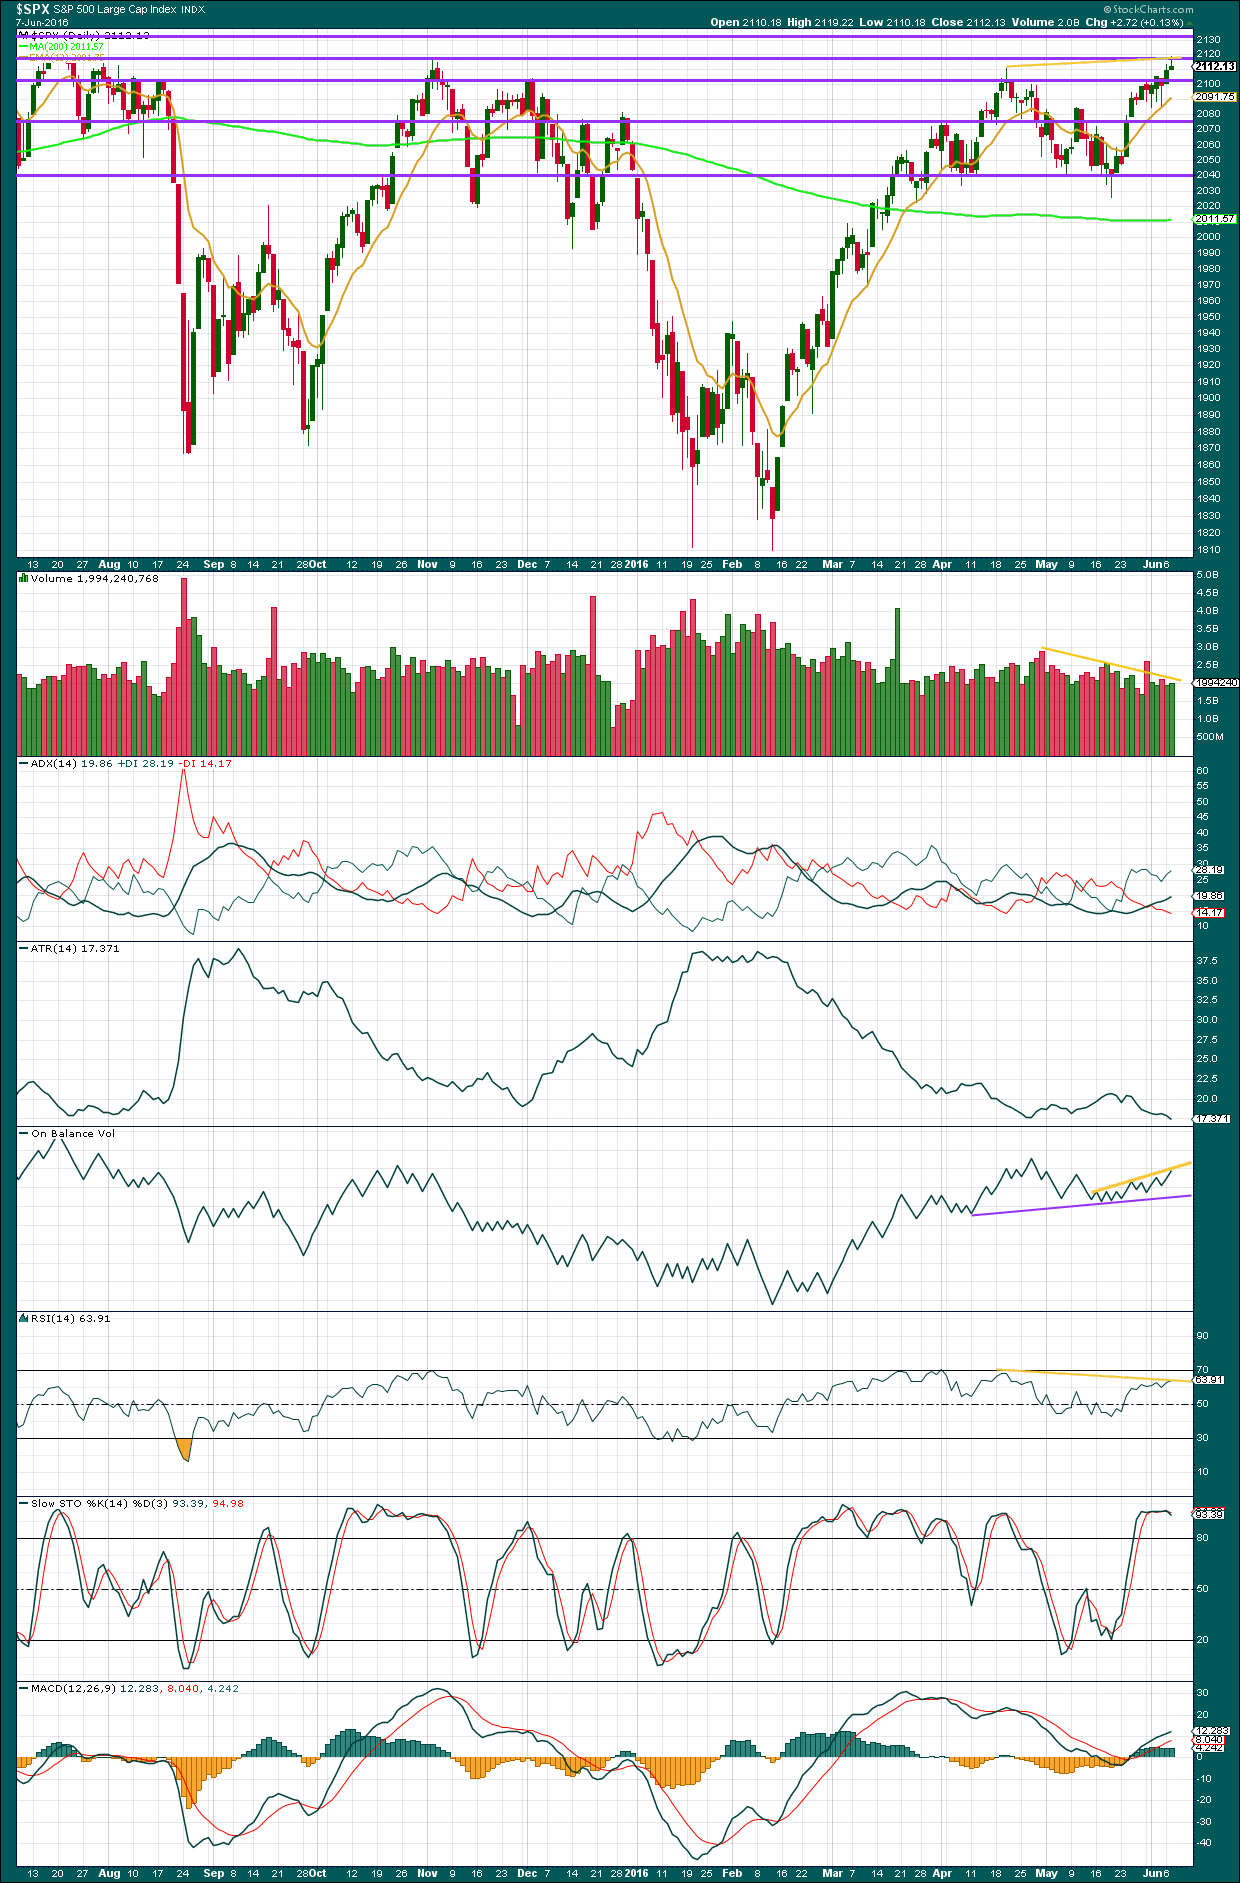
Click chart to enlarge. Chart courtesy of StockCharts.com.
Volume data on StockCharts is different to that given from NYSE, the home of this index. Comments on volume will be based on NYSE volume data when it differs from StockCharts.
Some small increase in volume for today’s session offers some support for the rise in price. Volume, however, remains relatively light: during the last seven sessions it is still two downwards days which have strongest volume.
ADX still indicates an upwards trend is in place. ATR still disagrees. There is still something wrong with this trend; a sustainable trend should not come with declining daily range.
More data is shown today on the chart. On Balance Volume trend lines are redrawn. The purple line is essentially the same, so a break below it would be a strong bearish indicator. The yellow line is redrawn. This line is repeatedly tested, so it offers reasonable technical significance. A break above this line would be a reasonable bullish signal.
There is divergence between price and RSI now. Price has made a new high above the prior swing high of 20th of April but RSI has failed to make a corresponding new high. This regular bearish divergence indicates weakness in price and exhaustion of bulls. Divergence between price and RSI is usually a fairly reliable indicator. It does not say price must turn down here, but it does indicate a trend change is very likely to occur either here or very soon.
There is also divergence over the last few days between price and Stochastics. Stochastics is flat and today declined while price has made important new highs. However, this divergence is not very reliable.
There is also strong divergence between price and MACD at the daily chart level. Again, this divergence between price and MACD is not always very reliable. It is one more small piece of the puzzle only.
VOLATILITY – INVERTED VIX MONTHLY CHART
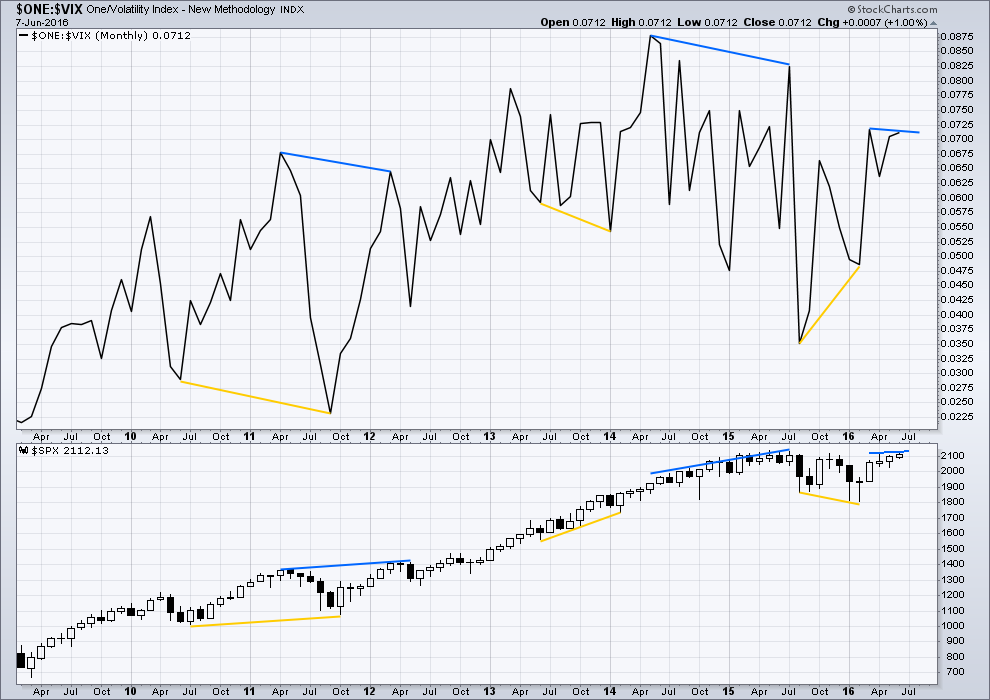
Click chart to enlarge. Chart courtesy of StockCharts.com.
Several instances of large divergence between price and VIX (inverted) are noted here. Blue is bearish divergence and yellow is bullish divergence (rather than red and green, for our colour blind members).
Volatility declines as inverted VIX rises, which is normal for a bull market. Volatility increases as inverted VIX declines, which is normal for a bear market. Each time there is strong multi month divergence between price and VIX, it was followed by a strong movement from price: bearish divergence was followed by a fall in price and bullish divergence was followed by a rise in price.
The divergence noted yesterday between price and VIX is no longer evident with the hew high today above November 2015. There is still current multi month divergence between price and VIX: from the high in April 2016 price has made new highs in the last few days but VIX has failed so far to follow with new highs. This regular bearish divergence still indicates weakness in price.
VOLATILITY – INVERTED VIX DAILY CHART
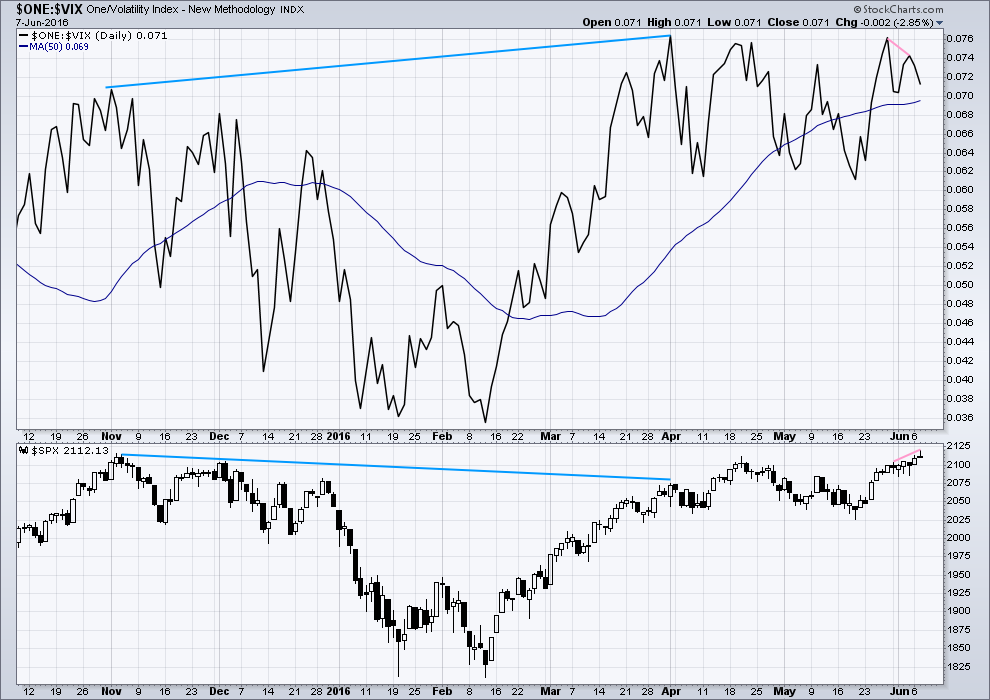
Click chart to enlarge. Chart courtesy of StockCharts.com.
There is now only one instance of hidden bearish divergence noted on this daily chart of price and VIX (blue lines). VIX makes higher highs as price makes lower highs. The decline in volatility is not matched by a corresponding rise in price. Price is weak.
There is also very short term regular bearish divergence (pink lines). VIX did not make a corresponding new high as price made a new high in the last two days. This indicates exhaustion for bulls and underlying weakness in price.
Now price has moved higher for two days in a row completing green daily candlesticks yet VIX has moved lower. This short term divergence between price and VIX is unusual. It indicates further exhaustion from bulls. This trend in price is weak, especially for the last two days.
While I would not give much weight to divergence between price and many oscillators, such as Stochastics, I will give weight to divergence between price and VIX. Analysis of the monthly chart for the last year and a half shows it to be fairly reliable.
BREADTH – ADVANCE DECLINE LINE
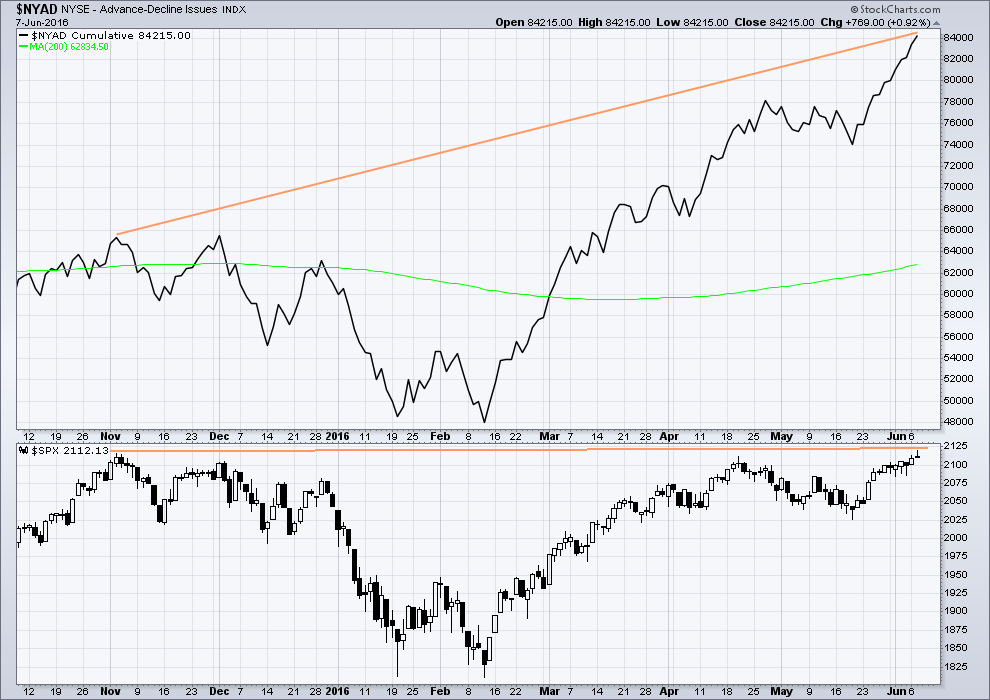
Click chart to enlarge. Chart courtesy of StockCharts.com.
With the AD line increasing, this indicates the number of advancing stocks exceeds the number of declining stocks. This indicates that there is breadth to prior upwards movement.
The hidden bearish divergence noted up to two days ago between price and the AD line no longer is evident with price now making new highs. The fact remains that it did exist though up until two days ago. Until two days ago price was exhibiting weakness in relation to market breadth.
DOW THEORY
The last major lows within the bull market are noted below. Both the industrials and transportation indicies have closed below these price points on a daily closing basis; original Dow Theory has confirmed a bear market. By adding in the S&P500 and Nasdaq a modified Dow Theory has not confirmed a new bear market.
Within the new bear market, major highs are noted. For original Dow Theory to confirm the end of the current bear market and the start of a new bull market, the transportation index needs to confirm. It has not done so yet.
Major lows within the prior bull market:
DJIA: 15,855.12 (15th October, 2014) – closed below on 25th August, 2015.
DJT: 7,700.49 (12th October, 2014) – closed below on 24th August, 2015.
S&P500: 1,821.61 (15th October, 2014) – has not closed below this point yet.
Nasdaq: 4,117.84 (15th October, 2014) – has not closed below this point yet.
Major highs within the new bear market:
DJIA: 17,977.85 (4th November, 2015) – closed above on 18th April, 2016.
DJT: 8,358.20 (20th November, 2015) – has not closed above this point yet.
S&P500: 2,116.48 (3rd Nobember, 2015) – has not closed above this point yet.
Nasdaq: 5,176.77 (2nd December, 2015) – has not closed above this point yet.
It is a reasonable conclusion that the indices are currently in a bear market. The trend remains the same until proven otherwise. Dow Theory is one of the oldest and simplest of all technical analysis methods. It is often accused of being late because it requires huge price movements to confirm a change from bull to bear. In this instance, it is interesting that so many analysts remain bullish while Dow Theory has confirmed a bear market. It is my personal opinion that Dow Theory should not be accused of being late as it seems to be ignored when it does not give the conclusion so many analysts want to see.
This analysis is made public today for promotional reasons. Member comments and discussion below will remain private.
This analysis is published @ 09:08 p.m. EST.
[Note: Analysis is public today for promotional purposes. Member comments and discussion will remain private.]

I got a pretty good signal to buy the dollar late in the day. I went long on it. That might help quell the stock indexes some. On the Fib resistances for SPX I’m showing 2121.72-2121.90; then 2125, then 2128.86, then of course the 2134 high. So agreeing with whoever said it below that there are many Fib numbers just above today’s market close. I read there is a cycle high on stocks June 10th….but can’t for the life of me find it again now.
It is difficult to imagine the SPX will not traverse the last eleven points to make a new ATH. The DJI may not, and I am quite confident that DJT will not. This of course would lead to a very strange scenario of severely fractured markets, and leave many wondering how on earth markets are going get synchronized to the downside. A new SPX high will not change the fact that we are in a recession. The signs are manifold and indisputable. Even Bloomberg is observing that markets are “being greased” by central banks world wide. So regardless of what SPX does tomorrow, I remain bearish long term. If SPX does not make a new high tomorrow, I would consider it a spectacular case of RNE reaching out from the grave to grab the banksters by the throat. All things considered, it does seem as if short term they can indeed distort the waves…a new high in SPX under the circumstances would be highly suggestive that such is the case…
Historical chart related to the current divergence with VIX.
Jason Goepfert from sentimentrader.com tweeted this chart yesterday showing what the S&P has done over the next three weeks after making new 6-month highs and closing positive along with the VIX for two consecutive days. Today was the third consecutive day the VIX has closed positive with the S&P.
https://twitter.com/sentimentrader/status/740263281911205888
Well…got the first bit of my premarket musing right but we didn’t close down today… however, we are still within the 2118-2122 topping area so still speculatively short.
A breakout above that then I’ll sit out taking anymore punts and sell weakness once it’s confirmed with a confirmed break of support. The risk versus reward at this price area is great though so cant complain, even if it does turn out to be a loss.
And my point of view confirmation bias is in full effect this evening…
Won’t it be something if this possible wave two retraced 100% of wave one? Talk about the ultimate head-fake!
It would be something indeed. I don’t think price will manage to get that high though.
Three days in a row now price has moved up but VIX has increased volatility. That is highly unusual. It’s bearish divergence, but clearly it doesn’t say price must turn here.
The longer that goes on the less likely price can keep going up.
Still divergence between price and RSI today also.
This thing looks like a rubber band stretched to extreme… the snap back may be pretty strong.
I’m the same Stuart, I see several Fibronaci levels just above:
Neutral short term. Price action trumps all and absence of selling pressure not consistent with a change of trend at this degree.
No upside hedges because of divergent VIX.
Volume also lower today.
Have a great evening everyone!
Very conflicted. Close above round numbers bullish.
Volatility divergence bearish. Will probably go to cash until clarity arrives….
I’m out. Waiting for indication of when the pullback or next wave down has begun.
The only thing odd about this triangle is I can’t identify a double zigzag in there.
But it’s over. The new high confirmed it must be over.
This channel about minor 5 is drawn from 2 to 4 with a copy on 3. The lower edge is providing support. So far. Lets see if that can be taken out… probably not before the close today.
So glad I went back to sleep and didn’t stay up to watch the paint dry 🙂
If looking down we need to lose 2115.78 to eliminate the minuette w(1)up scenerio.
Exactly.
We also still need 2,085.36 to be breached to eliminate minor 5 extending.
I agree with Gary’s chart below. It looks like this session completed a fourth wave triangle. I’d label that minute wave iv.
There’s a thrust up out of the triangle.
The whole structure could be complete… but as Gary also rightly points out this last impulse may also be a first wave.
For the bear count it should end here, finding strong resistance at the lilac line.
Incidentally, this important new high (above 2,116.48 from November 2015) may be enough to turn almost everyone bullish. I expect now almost everyone will be expecting new all time highs? Extreme green should rule about now.
David posted a chart below showing greed is extreme. I don’t know how reliable this CNN sentiment indicator is, but I’m looking at it because it’s daily (not weekly). This is extreme.
Everyone I follow or have looked at this week (other than EWSM) is very bullish intermediate term. With the break of 2116 most assume 2134 will be taken out soon. It is not difficult to understand why there is so much bullishness. Price. Many indicators losing their bearish divergences. Bullish divergences being sighted. Moving averages have been overtaken from below and we still stand above them. The rally off the Feb 2016 low has been one of the strongest rallies ever.
I am not saying I agree, especially short term. But I certainly can understand why they have a bullish perspective.
Agree. This market has now more bullish indication than it has had since the ATH.
Price especially is bullish. The taking out of 2,116 was a really very important new high.
I may well be out on a very lonely limb here, being so bearish 🙁
That’s uncomfortable. Not liking that.
Exactly what we would expect of a primary two top is it not?
Yes… I hope it is… but those Bull $%&@s are always saved by the PPT.
My next several trading days+++ to two weeks are going to be miserable.
I will not be posting… or reading posts after today… I think that is best.
Verne – Exactly.
Could also be what to expect of a bull market?
As in -If it walks like a duck, quacks like a duck, and acts like a duck, then its a duck… even if its not exactly like all the other ducks….
My aren’t we bullish! I look at lots of other things beside price action in the markets and I am afraid my view on this market’s destiny is not as sanguine, quacks and waddles notwithstanding… 🙂
VIX taking a final trip to the bottom of the pool (although not quite the bottom), UVXY hanging tough. Looking for both to take off like a bat out of hades to tell us we’re done…top so far at 2120.55…
Is that it??!!
Could be… But have to be aware we could just have minuette w(1) of minute w(5)
That’s exactly how I labelled it too.
It will be difficult to avoid a new ATH if we still have 3,4, and 5 up I think…
Ha, ha, yours matched mine? Better check again you must be doing something wrong.
Maybe we get a short wave three and a shorter wave five….
LOL
Nope. I checked. Looks good to me.
Move down looks corrective. I think your label is correct and we just completed minute one…I would have expected volatility to tank ahead of a third wave up though…something does not quite add up….
About time! Final wave up it appears….should drop back to touch top of trend-line and pop higher…
Prices are at extreme’s atm.
Minor w5 = 1.68 w1 @ 2120.10
Several fibs above that around 2128 -2130
Like that candle on the 5 min chart
Now confirmation is needed
EDIT: COME ON!!!!!
EDIT: F this!!!!! EDIT: MF
I think… I am toast! Burnt Toast!
Just yelling at the screen… not at anyone! Ready to put my foot through it!
some gorilla sat there and bought every d*mn SP emini contract at 2115….and I do mean a ton of them too.
Distract it with couple bananas…! 🙂
throw it a 4 yr old kid…
lol…good one
lol
http://www.zerohedge.com/sites/default/files/images/user3303/imageroot/2016/06/06/20160608_BAML2.jpg
Well that didn’t work… clink link showing that interest rates are the LOWEST in 5000 Years
If ramp up into close then the triangle may need some more time. Wave (e) may morph into a triangle itself.
I agree. It will probably not get resolved today. My only observation is the proportion of what we assume is an incomplete wave four….
Doesn’t look quite as bad on an hourly chart…
In a few rare cases I have seen price break violently down out of these triangles before reversing up for the final wave….
Anticipation….where’s Carly when you need her? 🙂
This is soo boring! I need to find something else to do.
I can’t take it anymore!
I hear ya. I am just about ready to close the screens for a bit and take a breather.
I was having a hard time with the contracting triangle count because minuette w(b) is really difficult to see as a three wave structure. But the rules of EW say that 4 of waves of a triangle must be zigzags or combination of zigzags so I guess the triangle on my chart satisfies these requirements.
We should be very close to the final move up if this triangle is going to do what I expect – a sharp move down, then a sharp final move up through the triangle’s converging trend-lines to a new high….
I just re-shorted 1/2 my position.
Still holding short, but rather uneasily I must confess…. 🙂
I totally agree. This market needs to make up it’s mind. At this point, I don’t care if it’s up or down….I just need a 3-4 day move in one direction or another. This whippy market sucks!
If we are still working on minute w4
This could very possibly be.
30 Year Treasury Bond Yield about to go…
SUB 2.50%… Now at 2.509%
Bond money is the smartest! That specific yield going sub 2.50 is a very bad signal for where the economy is and going!
And that yield going sub 2.50% as the US stock market is rising & near highs & stocks generally up world wide… is screaming message…
Because it’s NOT a safe haven trade pushing the yield there.
Joseph,
Could we be near a bottom in yields and some sort of top in markets? And if so is it possible to have bonds and equities falling at the same time?
Yes… high yield bonds will fall in price along with stocks.
Depending on how the stocks fall plays out… Yields on US Treasury’s can go lower as stocks fall at least in the initial stages as a safe haven play.
Not sure where the bottom in yields is… especially in this negative interest rate world.
Thanks Joseph
Thanks for pointing that out. It’s a strange market for sure…
I think it is actually imploding bonds that are going to be the catalyst to usher in intermediate three of primary three. I agree that junk bonds are going to go first, but I also think corporate bonds are going to start being a problem as the economy grinds to a halt. At that point, FED or no FED, yields start going through the roof and bond face values start selling for a fraction of maturity value…you already know what happens to the stock market….
Deflation!
That is my view… Massive Deflation as free cash flows can NOT support the payments due. One big massive haircut in Bond Principal.
But right now signaling a slowing economy that is already in recession IMO… with no way out!
BTW: It’s raining right now & why I am here.
What a crazy situation… that can’t possibly end well. Another card to be dislodged?
Next Banking Scandal Explodes in Spain
In recent days the stock of Spain’s Banco Popular has once again begun to crumble following allegations that Popular is also doing some creative selling of its own. The Spanish investment group Blackbird claims that the bank is offering customers dirt-cheap loans or refinancing deals, at an interest rate of just 2.5%, as long as they use some of the funds to purchase the bank’s new shares. “Popular is offering loans to its customers on the condition that they subscribe to the rights issue… and then deposit the €1.25 per share in their bank accounts.”
http://www.zerohedge.com/news/2016-06-08/next-banking-scandal-explodes-spain
If we have started minute w5…..
The moves out of these contracting triangles are usually sharp, not sluggish as we are seeing today; no idea what to make of it…Of course that typically happens when they are complete so it may not be quite done…I suspect we do have one more move up before the impulse down gets really started….
Looks like given the external influences, the market participants have no fear, as if we now have a Yellen PUT under the market. This is worse than the Internet bubble market period.
I am starting to think we are not going see a loss of CB control until some exogenous shock causes it to show up in the futures market. There just seems to be a dearth of sellers in the day to day price action. We should get some clarity before long….
No fear…
David, would you mind me asking where did you find this chart?
http://money.cnn.com/data/fear-and-greed/
and then go to the bottom of the page
Thanks!
It looks a bit out of proportion to wave one but it could also be an expanded flat for a second wave. If we get a fifth wave we should see a final sharp spike down in VIX…
I would really like to see some selling on the Russell 2000, still an appetite for risk …
Yeah. The protracted meandering in the area of these round number pivots is starting to make me just a bit skittish…I will be lightening short positions if we don’t see some resolution in the next hour….
VIX still looking bullish so I will give it a bit more time…
Well….not much in the way of velocity here today so maybe we are working on another high. Vern will get his 2120 + and the throw off.
Yep. I think you are right. We are still just warming up for the down-trend it seems…one more move up in a classic thrust from a fourth wave triangle….it should be very sharp and reverse swiftly…
NYSE hit its November 3rd, 2015 top; horizontal trendline resistance. VIX looks good on 2 hour chart for a downer.
Thanks Verne for your kind comment, if we all agreed 100% with each other it would be a boring forum. In one of my first posts my first question everyday is which way is the market going, the exact wave count is secondary (to me). Trades have been good so sticking with it.
Hello all.
New idea of what may be happening within minor 5, this is the 5 min level.
Minute i and ii end as labelled on the hourly chart.
The longer minor 5 continues the further it is from the ratio of equality with minor 1. So far they’re still close enough to equal to say they have a ratio.
The big ? is whether or not minute v is complete
It looks like most of this session may be another slow gind higher. I’m back to sleep. Good night.
thank you for the update 🙂
UVXY up, market up.
UVXY leading VIX to the upside.
Bullish for volatility, at the very least near term…
VIX gap filled…
Now for a fill of VIX closing gap at 14.05 and remaining fence sitters granted permission to come aboard…. 🙂 🙂 🙂
I thought this article was interesting..
http://www.investing.com/analysis/was-that-a-bear-market-for-us-stocks-is-it-over-200134682
You mean to tell me the bulls cannot manage a measly 0.20 points??!! 🙂
I guess 2119.90 it is then….
Vern,
NUGT is going nuts up over 14 points along with rest of the market… Hmmmm next target 2,134 (hoping that is fails before that).
Bought GLD and several gold miners at the open – the dollar looks to make another leg down.
I think it is ultimately going higher….
Trying to build positions in a couple of juniors…
I think GOLD has one more leg down before we see an interim low.
I’ve got some open stink bids on NUGT in anticipation. We had a beautiful anticipated pop on the job numbers last week. Wow!
NUGT from 75 to 110 in two days ?!?
We are headed for 2120 I think! 🙂
A picture book ending to the fifth…
Either a fifth or second wave underway. We should know soon enough…
Yesterday we broke the lower channel line on the 5 minute chart. (I should say it is my own best fit channel.) We are now seeing the typical throwback. Lets see if it provides resistance.
A green VIX print should sound the all clear. Another engulfing candle would be bullish for VIX…
It would be a tight fit….!
The only thing missing from Gary’s idea of the ending diagonal presented in his charts yesterday was the typical throw over of the 1,3 trend-line. A few other analysts expect that the fifth wave is not quite done and that we will actually see the throw-over during this morning’s session…if that happens it will be interesting to see if it can do it and not exceed the ATH….
Yep… A lot of Bulls out there and Bears throwing in the towel & turning Bullish. Mass/Gross complacency!
I am staying where I am at! Fundamentals don’t… in any way shape or form support higher equity prices. In fact they have been and are getting worse and that won’t change for many years! That is at individual company levels and macro economically.
Individual Equity Stock Prices are Grossly Overvalued and the best indicator of that Gross overvaluation is the market cap to revenue multiple… this one cuts though all the noise & financial engineering & BS propaganda. When this overshoots the historical norm level to the downside (it overshoots to the upside & the downside… can’t change nature!), you have your super cycle / grand super cycle bear!
A few weeks back I posted a chart of a rare cross of the 10 and 20 month MA in SPX. I like looking at slower moving averages as they can be really helpful in distinguishing the forest from the trees.
Another very interesting cross of the 50 week and 100 week MA now underway, FWIW
http://www.safehaven.com/print/41620/our-primary-trend-indicator-generates-a-long-term-stock-market-sell-signal
“For the first time in six years, our Primary Trend Indicator, a long-term trend stock market forecaster, generated a new signal, a Sell Signal on May 31st, 2016…There had been only four signals since 1997 before the Sell signal in May 2016, so this tool is useful for long-term investors, as it filters out the noise of up and down corrections of significance in favor of the primary trend. September 2008 was the third signal, May 2010’s was the fourth, and the May 2016 signal is the fifth.”
This is very interesting… I did not know this existed.
Important to note that the 50 WK MA crossed the 100 WK MA on May 2nd 2016
I have been viewing another indicated that went Long-term negative in Sept 2015. It is still negative. The historical chart shows that it picked all the key points to go long and to go short. 4 LT sells and 3 LT buys since 1996.
I can’t vouch for the validity yet as only viewing for several months. So we shall see how it plays out.
Thanks for sharing Philip,
First I’ve heard of this also. Really interesting.
Thanks for the link Philip. I think it is fascinating that they have what they believe is a primary trend change indicator. I am posting the chart. Yet another most interesting pair of moving averages!
This is a very sophisticated indicator. I was staring at the chart and wondering why they had the longer term 14 month average listed as fast and the shorter 5 month average listed as slow but that is not what they are saying. The slower indicator is actually a five month AVERAGE of the 14 month MA, so it makes perfect sense. That is really an amazing analytic approach, and I would love to learn a bit more about the TA rationale behind it.
Interesting… I didn’t pick up on that in my initial read.
Can that be plugged into ThinkorSwim or other charting platforms? I will have to look into that.
I can’t duplicate what they are saying on my monthly charts system… Can anyone else?
I am focusing on the May 2010 Buy signal only. Maybe there is an additional formula at play.
Will check back tonight.
Yep. It looks very proprietary to me. I would not doubt there’s something else there they are not necessarily disclosing…
Some thoughts ahead of the market opening:
With the way the patterns have unfolded and with price reaching 2119 yesterday, I’m expecting that today is going to be a good day for the bears, and we close down.
But, my guess is that we also open up, and there is another BTFD rally before any sharp drop. Expecting a bit of a volatile day.
But as ever, the market can do what it wants, and I reserve the right to change my mind at any moment… 🙂
As posted yesterday I’m on the hunt for a short entry… and if we stay under yesterday’s high, there should be plenty of opportunity…
SPX futures up 0.15% at 6.00 am Central time…DJI about 0.1%…
Taking a short here on Jun futures at 2116, stop behind yesterdays high.
I do prefer the bullish scenario. It´s more solid, stronger than the bearish scenario. So, we are expecting a c-wave down to ~2,000 or less, and then….what could be the beginning of a massive fifth wave to complete Primary 3.
If you are right, hopefully we get some confirmation from VIX in the form of a long upper shadow and/or penetration of the upper BB at that level; a reliable sign that at least an interim bottom is in place. The response to the round number at 2000 will also be quite revealing I think.
Yep.
IF that what’s taking place then I’d expect the next couple of months to be corrective price action before we embark upon the last leg of the upside towards 2500, starting late this year.
Will be very easy to spot if that happening or not… All price needs to do is stay above 1950 (and it may not even make it down that far)
Long term I think things begin to badly unravel in 2018, and we get 2, possibly 3 years of bear market to follow.
Quite grand assumptions I know, especially considering that the fifth wave is projected to offer up 500 points in a such a short space of time.
But would be incredible if it played out like this…
Interesting projections. I am intensely curious to learn whether banksters can continue to juice the markets in a recessionary environment. I have absolutely no doubt that they will do their utmost. It would be a historical first.
The House of Cards will collapse… very soon… this year! Several of the inner foundation cards have already fallen… Once one of the outer cards (more obvious) dislodges… the house will fall.
2022 is the year you see a lot – for things to hit the fan big time.
I’m looking at after hours movement (my trading platform) and so far I can see a zigzag down on both FTSE and S&P.
FTSE is clearest. The low of A within the zigzag would be 6,274. If price moves back up above that point then the downwards move from the high for FTSE would be a three (most likely) which means FTSE may not yet have a high in place.
S&P isn’t quite so clear, but it’s possible end for wave A of a zigzag would be 2,111.67, and following upwards movement has already gone back above this point. So S&P may now have a small three down complete.
This is all at the five min chart level, all for futures.
So I was looking for a possible entry today for shorts on both of these markets, but with downwards movement looking like threes I’ll hold off. I’m concerned that for both there may not be a high in place. Which means I may have to get up in the night.
I may turn up here randomly during the NY session 🙂
Lara, I view ES often overnight… especially the last couple of years.
I find the easiest ES charts to attempt to count (Not that I am any good yet) is at the 10 min & 15 min chart levels + hourly. Volume is dramatically lower in the overnight and ES only moves in 25 cent intervals. I suggest you take at look at what appears clearer to you by taking a look at a few levels.
Good idea
Reflecting on the description of EW by Ralph Nelson Elliott as the principle of human behaviour, I can’t help but think of the seeming contradiction of the concomitant predictability of human behaviour, and the inscrutability of it. Remember how over the last few months we kept pulling our hair out over the fact that the screeching momentum we were all expecting from a primary third wave down seemed to perpetually elude us? I really have to laugh at how often we got so excited about the possibility of a third wave down at multiple degrees (at one point even an octuplet of thirds! no less….), all the while a primary degree second wave was developing under our very noses; predictably retracing a remarkable 95% of the first wave down! I am starting to develop a deep appreciation of Lara’s familiar expression of “What if…?” and am becoming convinced that developing an ability to maintain flexibility in our thinking in real time, is a real key to making the very best use of the outstanding EW analysis we enjoy. I want to say a big “Thank You” to Stuart and Peter for their willingness to pose some contrarian perspectives on the forum and forcing some of us to entertain that “What if…?”. And what can I say about Lara? I never cease to be amazed at her ability to roll with the punches, step back as re-assess (albeit this time with Cesar’s help) and come up with these amazing solutions that make all the pieces fall into place. This forum is a great place to trade. Glad you are all here….
Thank you very much Verne.
It’s been a rather down couple of days TBH, I am very deflated when the wave count is invalidated at the daily chart level. Just so members are aware, I take it extremely seriously.
I hate being wrong. I don’t like losses. And my goal is always to get it right.
I don’t care if my outlook is bull or bear, I’ll switch overnight if evidence says I should. I want to be on the right side, which isn’t necessarily bull nor bear.
So the stepping back and reassessing… yes, I can do it. It’s hard. Really hard. I feel like apologising profusely when I get it wrong, but I think you’d all rather I spend my energy on getting it right next time.
So your positive comment really helps Verne. Thank you!
Most welcome! 🙂
Really appreciating all of this as a newcomer. Thanks much to all!
Hi!
Am I first? 🙂
Not exactly. I was here perfunctorily. I am just returning the favour.
LOL
That’s very kind
Hi Lara.
Is there any way to change my name to appear as “Alan Tham” in the forum? I’m more used to that, but if it is too much of an inconvenience, then please don’t bother.
Thank you.
You can change that, look on the right hand side at your account and click membership details and then it will load a my account page, at the top of the page click edit your password and account details, change your name there and click save changes. You can then post a comment but I think your first post will have to be confirmed again by Lara to allow the privilege to comment.
I changed mine from Malcolm to Mally 🙂
OMG Alan! So sorry! I totally didn’t realise it was you. Lovely to see you active on both sites.
Thank you so much Mally for the explanation.
Alan, I’ll look for your first comment with your name in moderation to release before I go to sleep tonight.
Everybody, Alan is really REALLY good at EW counts. He knows his stuff 🙂
And don’t mind Doc, he’s an awesome jokester 🙂
Thanks Lara.
I love people who are fun to be with. They liven up what would otherwise have been a sombre atmosphere. They are the social glue that helps us mere mortals maintain our sanity, that which is sorely needed in trying times especially when the market does not work in our favour. I tend to jest around quite a fair bit. But I usually maintain a sense of dignity. It is only when I am comfortable with the audience that I open up. Doc, glad to have you around.
It is only people who are uncivil that get on my nerves. These people attack you as a person and not on your mistakes. Everybody makes mistakes. If we become too cautious, then there is no way to trade for profit. Opposing views are in fact welcome because they bring with them a fresh perspective and everyone can learn from visualing things from a different angle. It enriches. It is so with work; it is so with life.
Alan, I’ve changed it for you.
If your next comment is in moderation I’ll look for it before I sleep or when I get up randomly to check the markets.
Why thank you Kwok! I thought I detected someone there in the shadows…. 🙂
that’s a crock Kwok,, if you are 1st you take it,,, cuz it is such an honor to be 1st,,(no offense by the way)