
The target at 2,099 was reached on Friday.
Summary: The wave count now expects downwards movement from here. This is supported at the end of this week by classic technical analysis. A breach of the green channel on the hourly chart would be first confidence, and a new low below 2,058.35 would provide price confirmation. The short term target is at 1,911 and the long term target remains the same at 1,423.
To see last published monthly charts click here.
To see how each of the bull and bear wave counts fit within a larger time frame see the Grand Supercycle Analysis.
To see detail of the bull market from 2009 to the all time high on weekly charts, click here.
New updates to this analysis are in bold.
BEAR ELLIOTT WAVE COUNT
WEEKLY CHART
Click chart to enlarge.
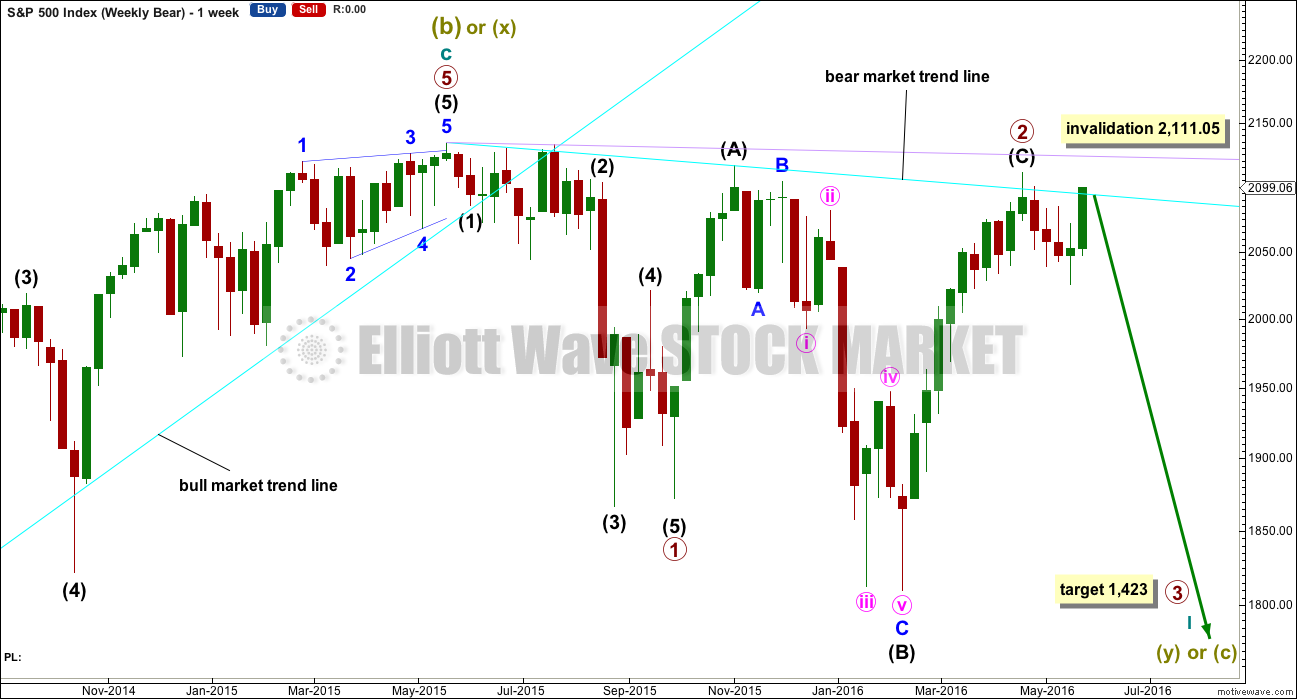
This bear wave count fits better than the bull with the even larger picture, super cycle analysis found here. It is also well supported by regular technical analysis at the monthly chart level.
Importantly, there is no lower invalidation point for this wave count. That means there is no lower limit to this bear market.
Primary wave 1 is complete and lasted 19 weeks. Primary wave 2 is over lasting 28 weeks.
An expectation for duration of primary wave 3 would be for it to be longer in duration than primary wave 1. If it lasts about 31 weeks, it would be 1.618 the duration of primary wave 1. It may last about a Fibonacci 34 weeks in total, depending on how time consuming the corrections within it are.
Primary wave 2 may be a rare running flat. Just prior to a strong primary degree third wave is the kind of situation in which a running flat may appear. Intermediate wave (B) fits perfectly as a zigzag and is a 1.21 length of intermediate wave (A). This is within the normal range for a B wave of a flat of 1 to 1.38.
Within primary wave 3, no second wave correction may move beyond its start above 2,111.05.
DAILY CHART
Click chart to enlarge.
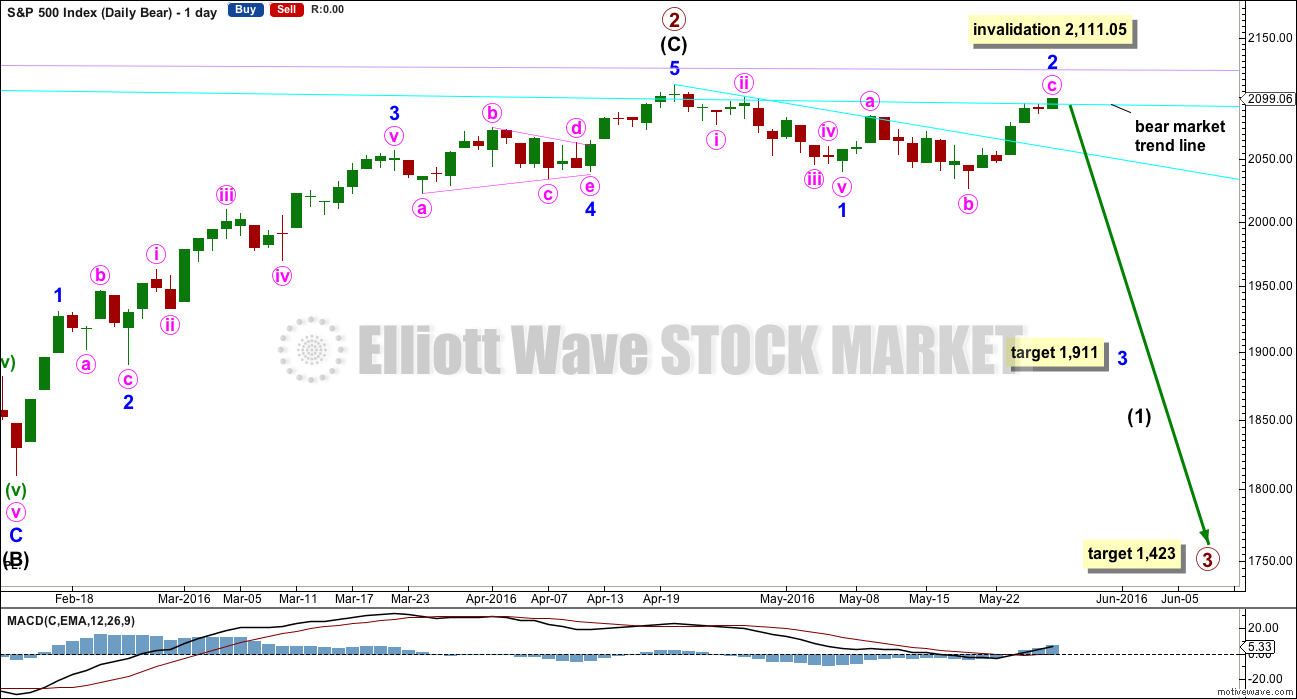
If intermediate wave (C) is over, then the truncation is small at only 5.43 points. This may occur right before a very strong third wave pulls the end of intermediate wave (C) downwards.
The next wave down for this wave count would be a strong third wave at primary wave degree. At 1,423 primary wave 3 would reach 2.618 the length of primary wave 1. This is the appropriate ratio for this target because primary wave 2 is very deep at 0.91 of primary wave 1. If this target is wrong, it may be too high. The next Fibonacci ratio in the sequence would be 4.236 which calculates to a target at 998. That looks too low, unless the degree of labelling is moved up one and this may be a third wave down at cycle degree just beginning. I know that possibility right now may seem absurd, but it is possible.
Alternatively, primary wave 3 may not exhibit a Fibonacci ratio to primary wave 1. When intermediate waves (1) through to (4) within the impulse of primary wave 3 are complete, then the target may be calculated at a second wave degree. At that stage, it may change or widen to a small zone.
Minor wave 2 fits perfectly as a very common expanded flat correction. Minute wave b is a 1.3 length of minute wave a, nicely within normal range of 1 to 1.38. Minute wave c is just 1.26 points short of 1.618 the length of minute wave a. After Friday’s upwards movement, minute wave c has a clear five wave look to it on the daily chart.
At 1,911 minor wave 3 would reach 2.618 the length of minor wave 1. This is the appropriate ratio to use for this target because minor wave 2 is very deep at 0.82 the length of minor wave 1.
Notice that the bear market trend line has been overshot before at the high labelled primary wave 2, so it may be overshot again.
Minor wave 2 may not move beyond the start of minor wave 1 above 2,111.05. This is the risk to short positions at this stage.
If any members are choosing to enter short positions here, then manage risk carefully: Do not invest more than 3-5% of equity on any one trade and always use a stop loss to contain losses.
HOURLY CHART
Click chart to enlarge.
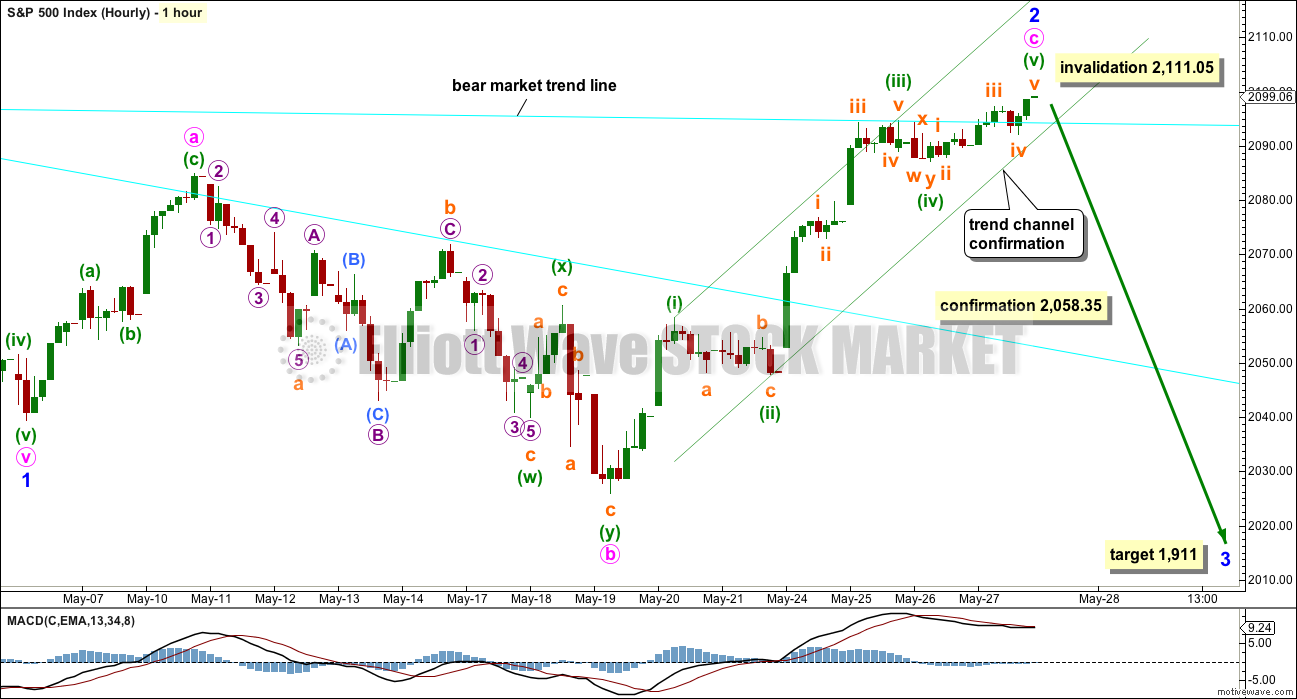
Minor wave 2 may again be complete, but a trend change is unconfirmed. If minor wave 2 continues any higher, and it may, then it may not move beyond the start of minor wave 1 above 2,111.05.
Draw a channel about minute wave c using Elliott’s technique: draw the first trend line from the highs labelled minuette waves (i) to (iii), then place a parallel copy on the low labelled minuette wave (ii). When this channel is breached by downwards movement, it shall be indicating the end of minute wave c and the start of the next wave down. Risk must remain at 2,111.05 while price remains within the channel.
After the trend channel is breached to the downside, price may throwback to find resistance at the bear market trend line or the lower edge of the channel. If that is how price behaves, then short positions may be entered there with stops just above the end of minor wave 2 which at this stage is at 2,099.06.
A new low below 2,058.35 could not be a fourth wave correction within minute wave c, so at that stage the impulse of minute wave c would have to be over. A new low below 2,058.35 would provide strong price confirmation of a trend change.
BULL ELLIOTT WAVE COUNT
WEEKLY CHART
Click chart to enlarge.
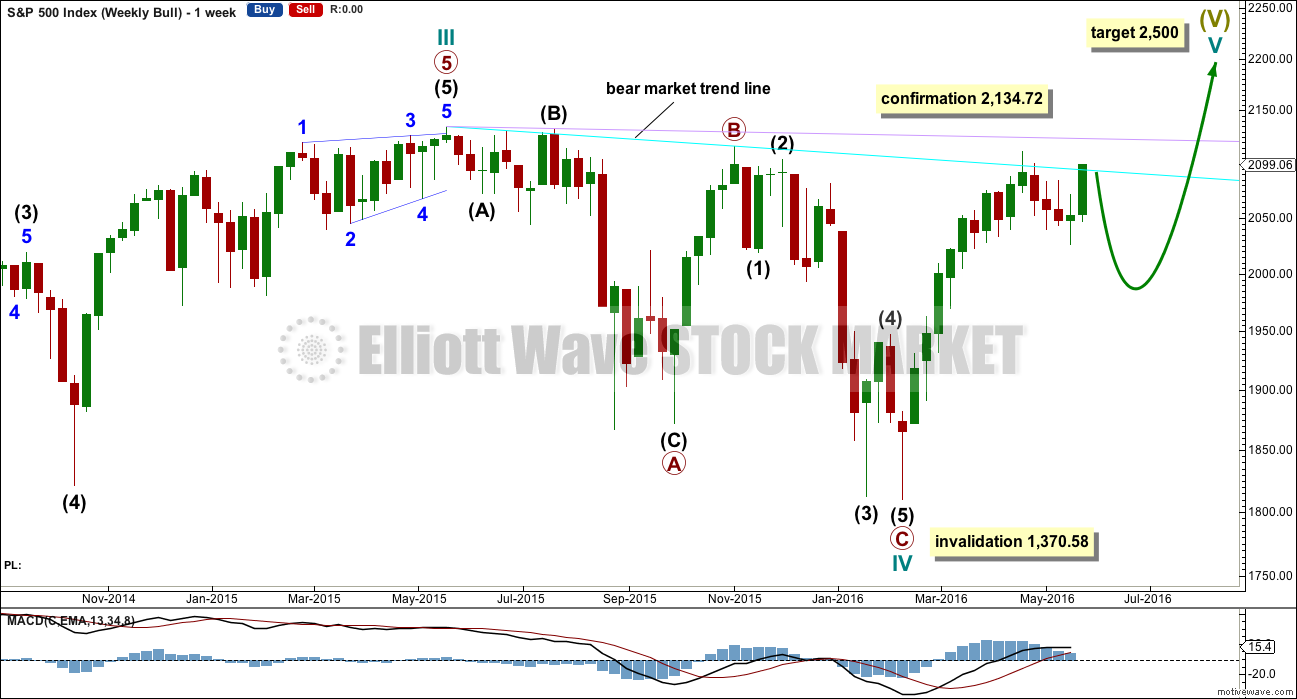
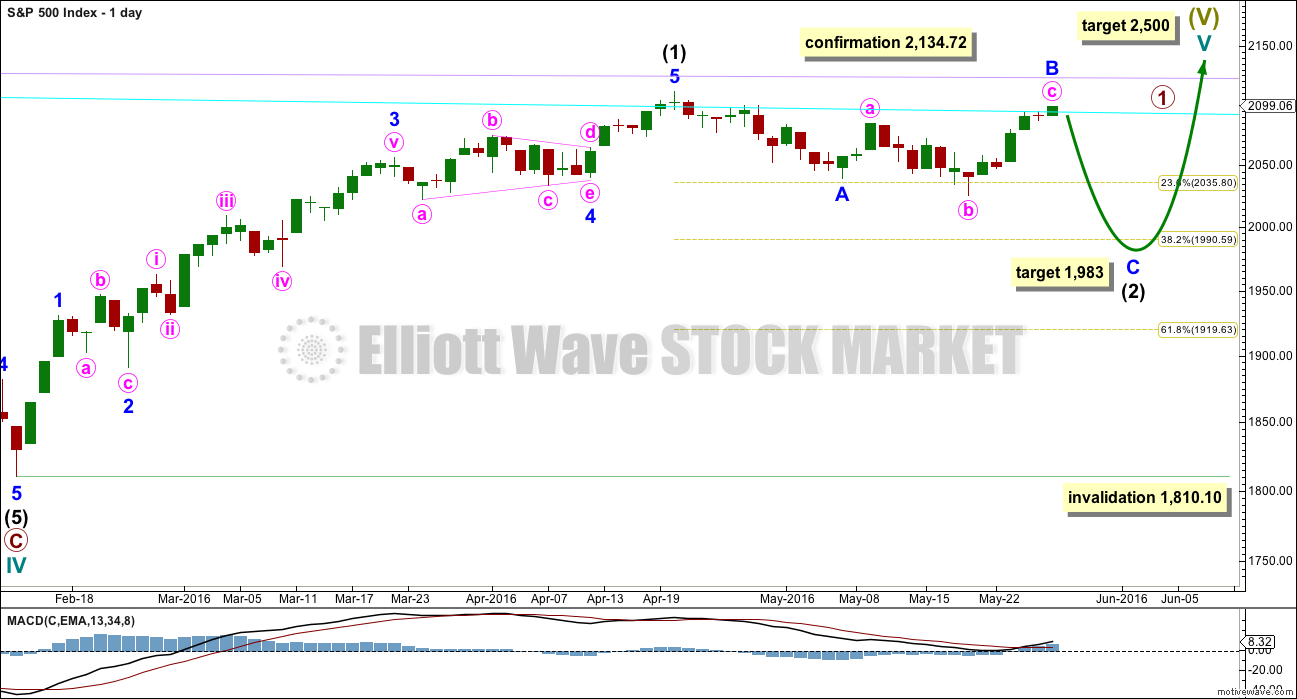
Cycle wave IV is seen as a complete flat correction. Within cycle wave IV, primary wave C is still seen as a five wave impulse.
Intermediate wave (3) has a strong three wave look to it on the weekly and daily charts. For the S&P, a large wave like this one at intermediate degree should look like an impulse at higher time frames. The three wave look substantially reduces the probability of this wave count. Subdivisions have been checked on the hourly chart, which will fit.
Cycle wave II was a shallow 0.41 zigzag lasting three months. Cycle wave IV may be a complete shallow 0.19 regular flat correction, exhibiting some alternation with cycle wave II.
At 2,500 cycle wave V would reach equality in length with cycle wave I.
Price remains below the final bear market trend line. This line is drawn from the all time high at 2,134.72 to the swing high labelled primary wave B at 2,116.48 on November 2015. This line is drawn using the approach outlined by Magee in the classic “Technical Analysis of Stock Trends”. To use it correctly we should assume that a bear market remains intact until this line is breached by a close of 3% or more of market value. In practice, that price point would be a new all time high which would invalidate any bear wave count.
This wave count requires price confirmation with a new all time high above 2,134.72.
While price has not made a new high, while it remains below the final bear market trend line and while technical indicators point to weakness in upwards movement, this very bullish wave count comes with a strong caveat. I still do not have confidence in it.
The invalidation point will remain on the weekly chart at 1,370.58. Cycle wave IV may not move into cycle wave I price territory.
This invalidation point allows for the possibility that cycle wave IV may not be complete and may continue sideways for another one to two years as a double flat or double combination. Because both double flats and double combinations are both sideways movements, a new low substantially below the end of primary wave C at 1,810.10 should see this wave count discarded on the basis of a very low probability long before price makes a new low below 1,370.58.
DAILY CHART
Click chart to enlarge.
If the bull market has resumed, it must begin with a five wave structure upwards at the daily and weekly chart level. That may today be complete. The possible trend change at intermediate degree still requires confirmation in the same way as the alternate hourly bear wave count outlines before any confidence may be had in it.
Intermediate wave (2) may be an incomplete zigzag. Within the zigzag, minor wave B may now be a complete expanded flat. At 1,983 minor wave C would reach 1.618 the length of minor wave A. This ratio is used for this target because intermediate wave (2) should be expected to be relatively deep. If this target is wrong, it may not be low enough. The next likely target would be the 0.618 Fibonacci ratio at 1,920.
In the long term, this wave count absolutely requires a new high above 2,134.72 for confirmation. This would be the only wave count in the unlikely event of a new all time high. All bear wave counts would be fully and finally invalidated.
TECHNICAL ANALYSIS
WEEKLY CHART
Click chart to enlarge. Chart courtesy of StockCharts.com.
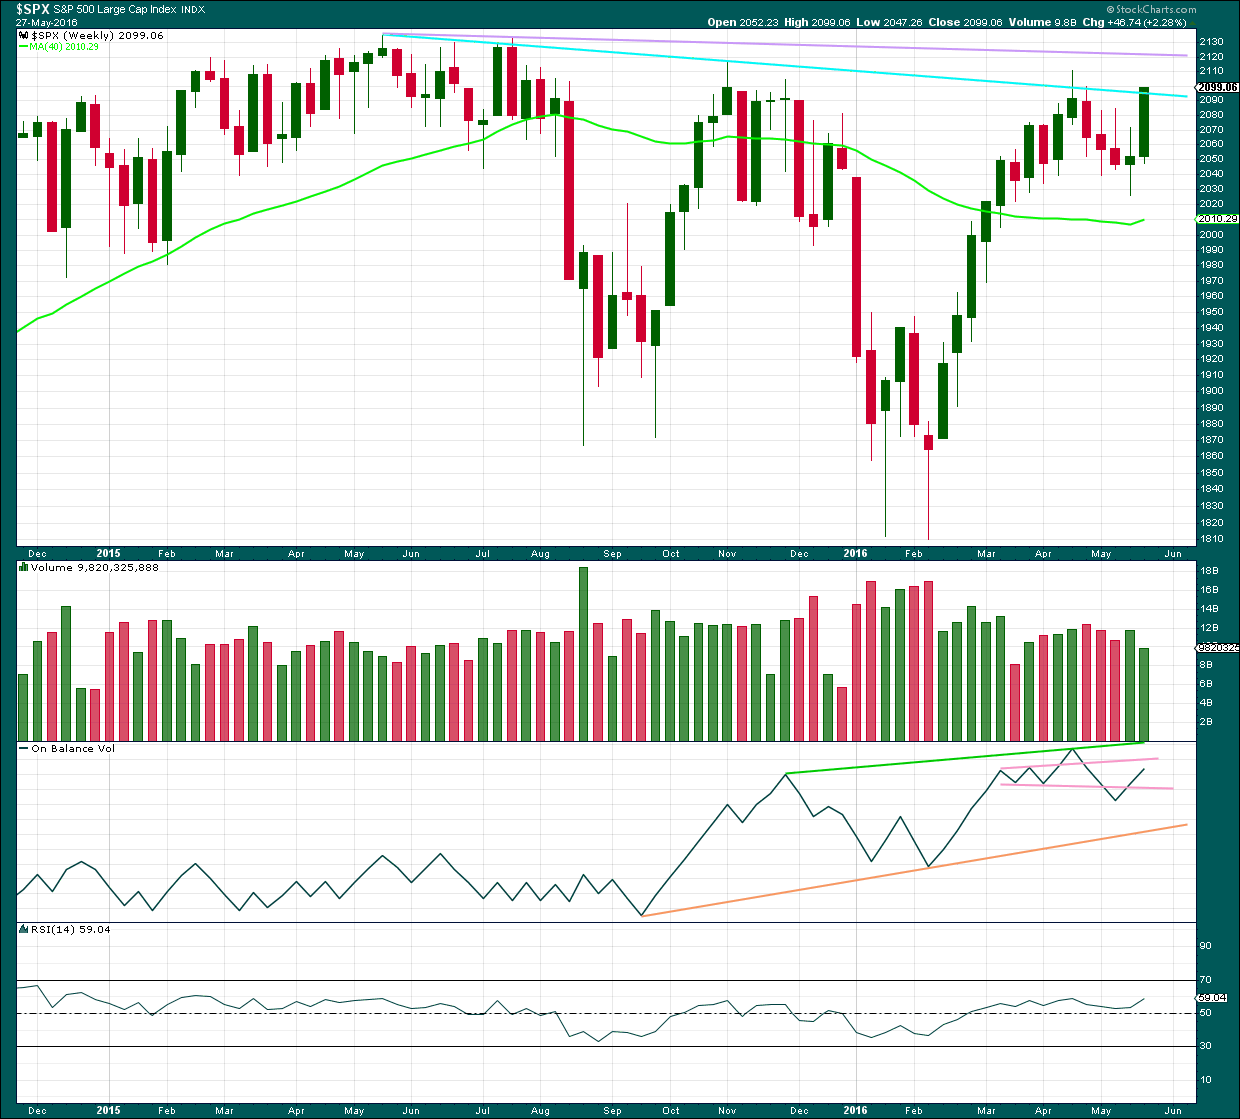
There is a bearish engulfing candlestick pattern at the last high. This has occurred at the round number of 2,100 which increases the significance. Volume on the second candlestick is higher than volume on the first candlestick, which further increases the significance. That it is at the weekly chart level is further significance.
Engulfing patterns are the strongest reversal patterns.
Now this pattern is followed by another red weekly candlestick. The reversal implications of the pattern are confirmed.
This is a very strong bearish signal. It adds significant weight to the expectation of a trend change. It does not tell us how low the following movement must go, only that it is likely to be at least of a few weeks duration.
There is also a Three Black Crows pattern here on the weekly chart. The first three red weekly candlestick patterns are all downwards weeks. The pattern is not supported by increasing volume and only the third candlestick closes at or near its lows; these two points decrease the strength of this pattern in this instance. That the pattern occurs at the weekly chart level increases its strength.
This week completes a strong bullish candlestick, but it comes on declining volume. Price was not supported by volume although price managed to move substantially higher.
This pattern was seen back in July 2015 on this weekly chart. The week ending 13th of July, 2015, completed a strong bullish candlestick after a week immediately prior which completed a candlestick with a small real body and a long lower wick. The second candlestick there too came on declining volume. The following week managed to make a slight new high, but the advance of the bullish candlestick was fully retraced within two weeks.
The conclusion must be that this candlestick is bullish and would support more upwards movement. But the decline in volume is very concerning and indicates that if price does continue higher, it may not be by much.
On Balance Volume trend lines have been redrawn. OBV is constrained within two larger lines (green and orange). A break above the green line would be a strong bullish signal. A break below the orange line would be a strong bearish signal. OBV is constrained more short term between the two pink lines. The upper line may provide resistance; a break above it would be a weak bullish signal. The lower line has been tested and breached; this line is weak. A break below the lower pink line would be a weak bearish signal.
There is some long held divergence here between On Balance Volume and price. Between the last two major swing lows in price at the end of August 2015 and early February 2016, price made new lows but OBV made a higher low. This regular bullish divergence indicated the February low in price was weak. It was followed by a major upwards swing from price.
Now, from the major swing high for price in early November 2015 to the last major swing high in April 2016, price has made a lower high but OBV has made a higher high. Price cannot make a corresponding new high despite OBV making a new high. Price is weak. This hidden bearish divergence now supports the Elliott wave count.
DAILY CHART
Click chart to enlarge. Chart courtesy of StockCharts.com.
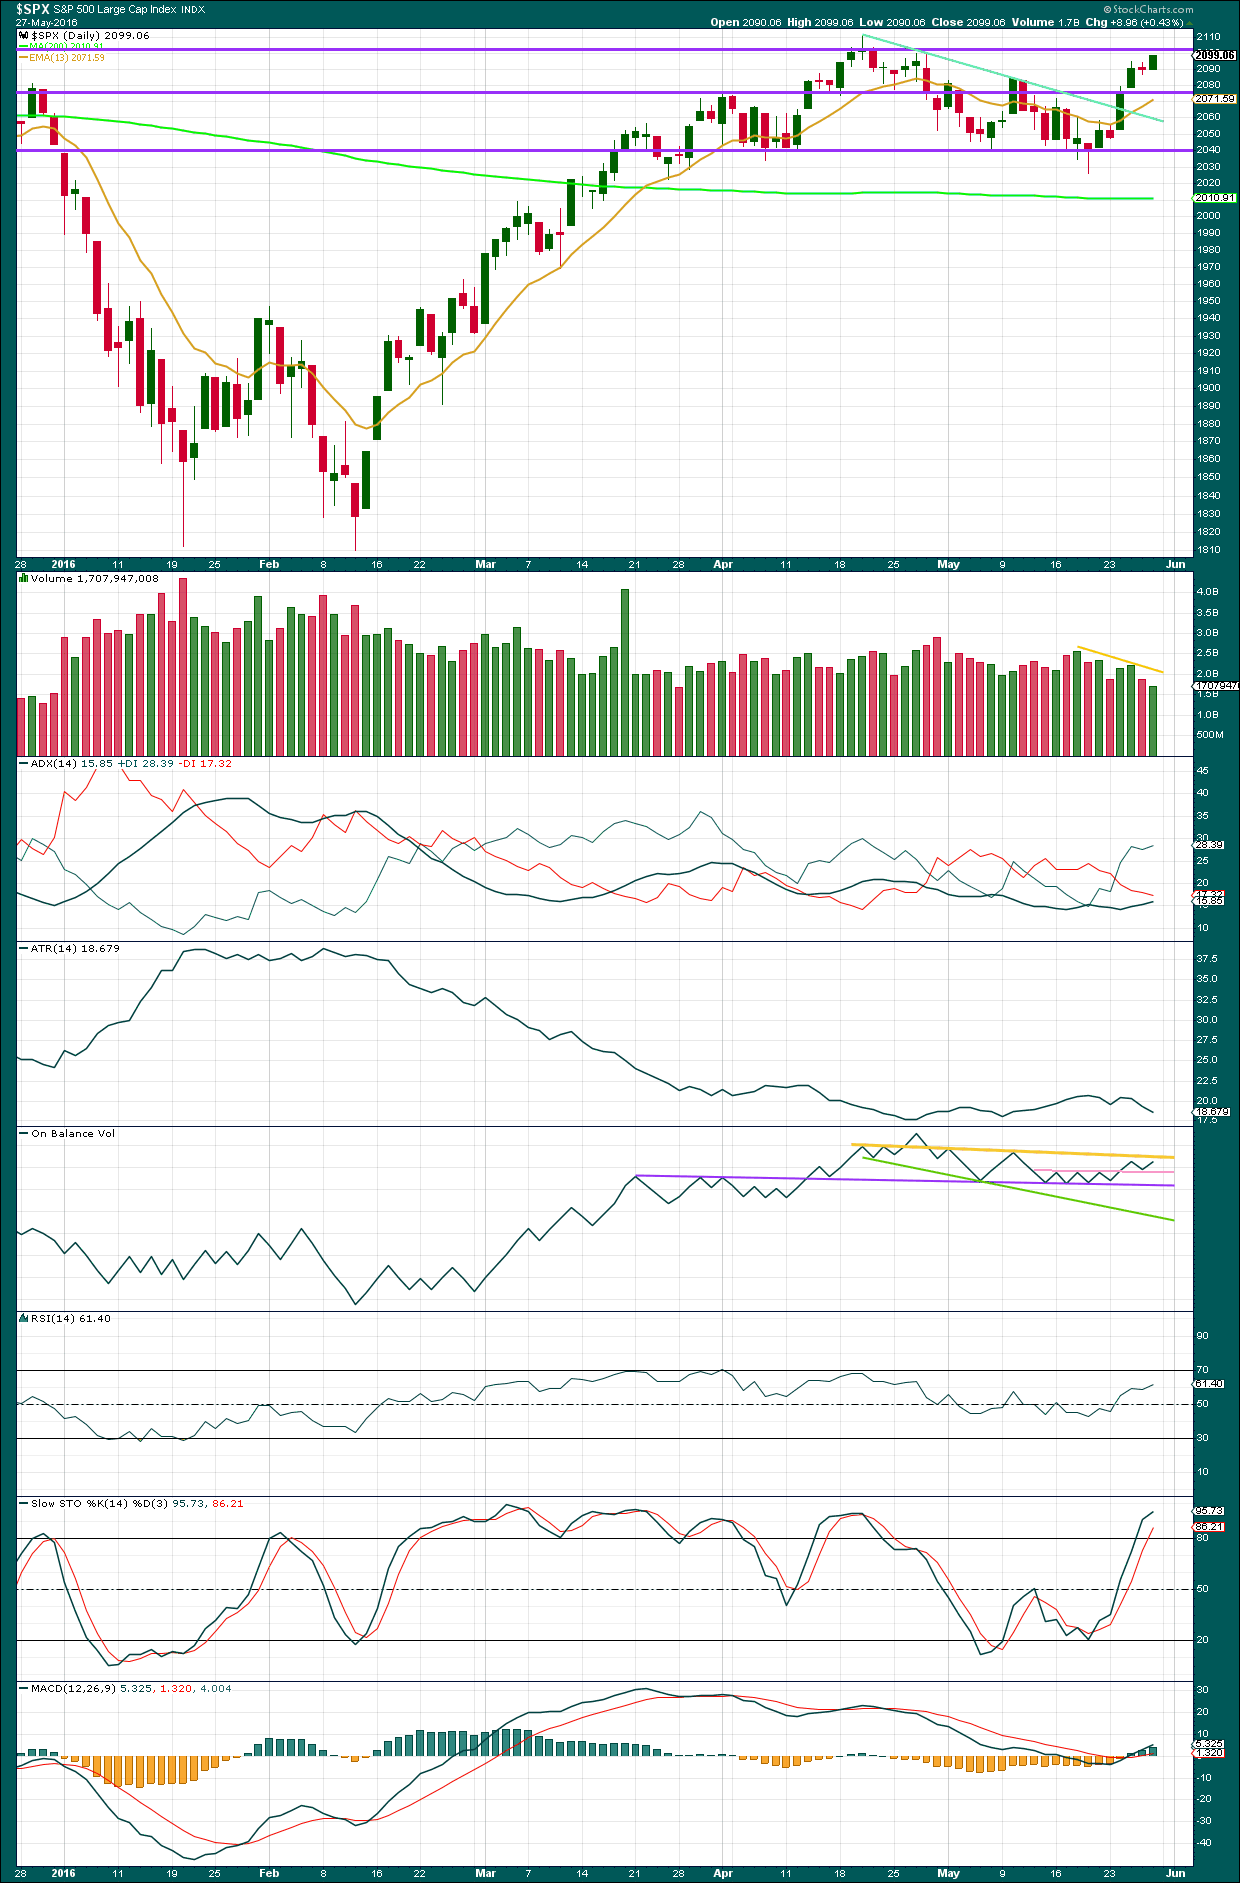
Volume data on StockCharts is different to that given from NYSE, the home of this index. Comments on volume will be based on NYSE volume data when it differs from StockCharts.
Price comes on clearly declining volume as price rose to the high for Friday. The rise in price is not supported by volume, so it is not sustainable. Friday’s rise in price came with lightest volume for the last two months. The next lighter day is 28th March. This is to be expected before a holiday weekend.
Price may be expected to find strong resistance at the round number pivot of 2,100. Price has tested this number on four days in the last few months and each time price has moved downwards from this point. Each test strengthens resistance at the point. It would be reasonable to expect a downwards reaction from here.
ADX is increasing indicating the market is trending. The trend is up.
ATR is again however declining indicating the market is not trending. If this movement is a countertrend movement, then this disagreement between ADX and ATR makes sense.
On Balance Volume has come up to almost touch the yellow line. This may provide resistance. Although the yellow line has been breached before, if OBV moves higher, it may not be by much. There is some divergence between OBV and price at the daily chart level also: from the swing high of 10th of May to the last high for Friday 27th of May price has made a new high but OBV has made a lower high. This regular bearish divergence indicates weakness to upwards movement from price.
RSI is not yet extreme. There is room for price to rise further. There is no divergence between price and RSI to indicate weakness.
Stochastics has now reached overbought. If the market is range bound, then a downwards swing may be expected to begin from about here.
VOLATILITY – INVERTED VIX DAILY CHART
Click chart to enlarge. Chart courtesy of StockCharts.com.
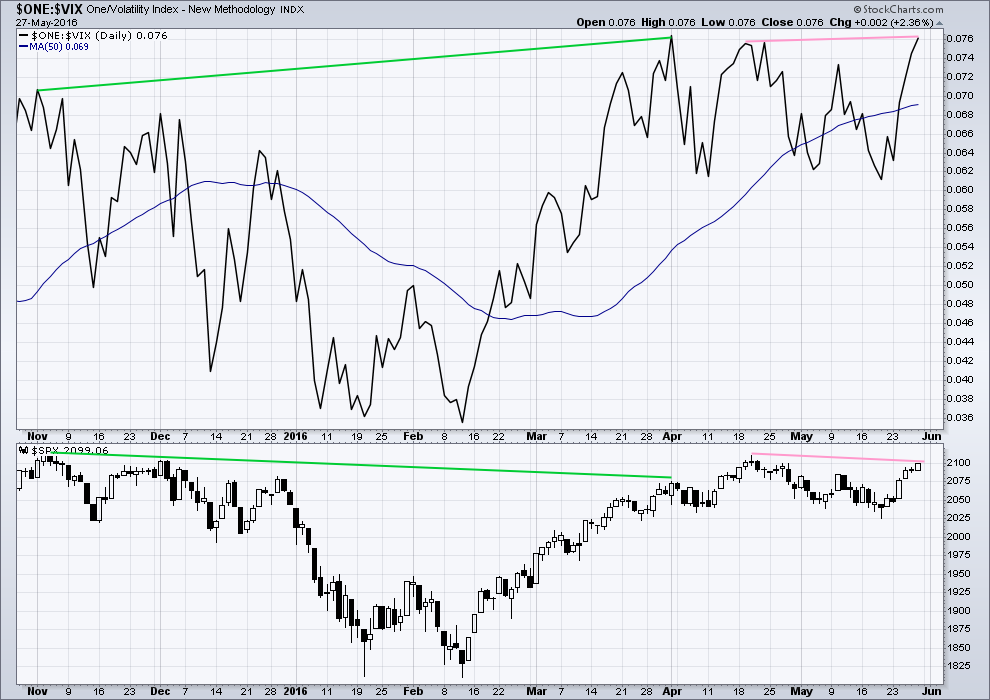
Volatility declines as inverted VIX climbs. This is normal for an upwards trend.
What is not normal here is the divergence over a reasonable time period between price and inverted VIX (green lines). The decline in volatility did not translate to a corresponding increase in price. Price is weak. This divergence is bearish.
There is now double negative hidden bearish divergence between price and VIX (pink lines). At the end of the week, VIX has made a new high above the prior swing high of 20th of April yet price has failed to make a corresponding new high. This indicates weakness in price. Volatility has declined below the point it was at on 20th of April, but this has failed to be translated into a corresponding rise in price.
BREADTH – ADVANCE DECLINE LINE
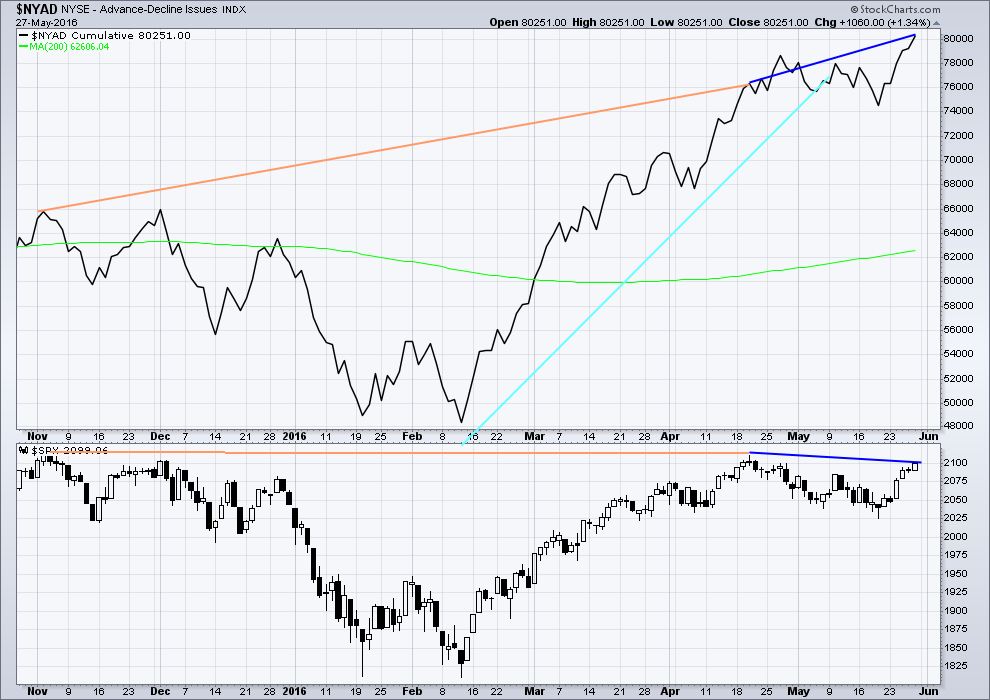
Click chart to enlarge. Chart courtesy of StockCharts.com.
With the AD line increasing, this indicates the number of advancing stocks exceeds the number of declining stocks. This indicates that there is breadth to prior upwards movement.
From November 2015 to 20th April, the AD line made new highs while price far failed to make a corresponding new high. This indicates weakness in price; the increase in market breadth is unable to be translated to increase in price (orange lines).
The 200 day moving average for the AD line is now increasing. This alone is not enough to indicate a new bull market. During November 2015 the 200 day MA for the AD line turned upwards and yet price still made subsequent new lows.
The AD line is now declining and has breached a support line (cyan). There is breadth to downwards movement; more stocks are declining than advancing which supports the fall in price.
There is now double hidden bearish divergence between price and the AD line at the end of this week (dark blue lines). The AD line has made a new swing high above the prior high of 20th of April. This increase in breadth to upwards movement has failed to translate into a corresponding rise in price. Price has failed to make a new high above 20th of April. This indicates weakness in price.
ANALYSIS OF LAST MAJOR BEAR MARKET OCTOBER 2007 – MARCH 2009
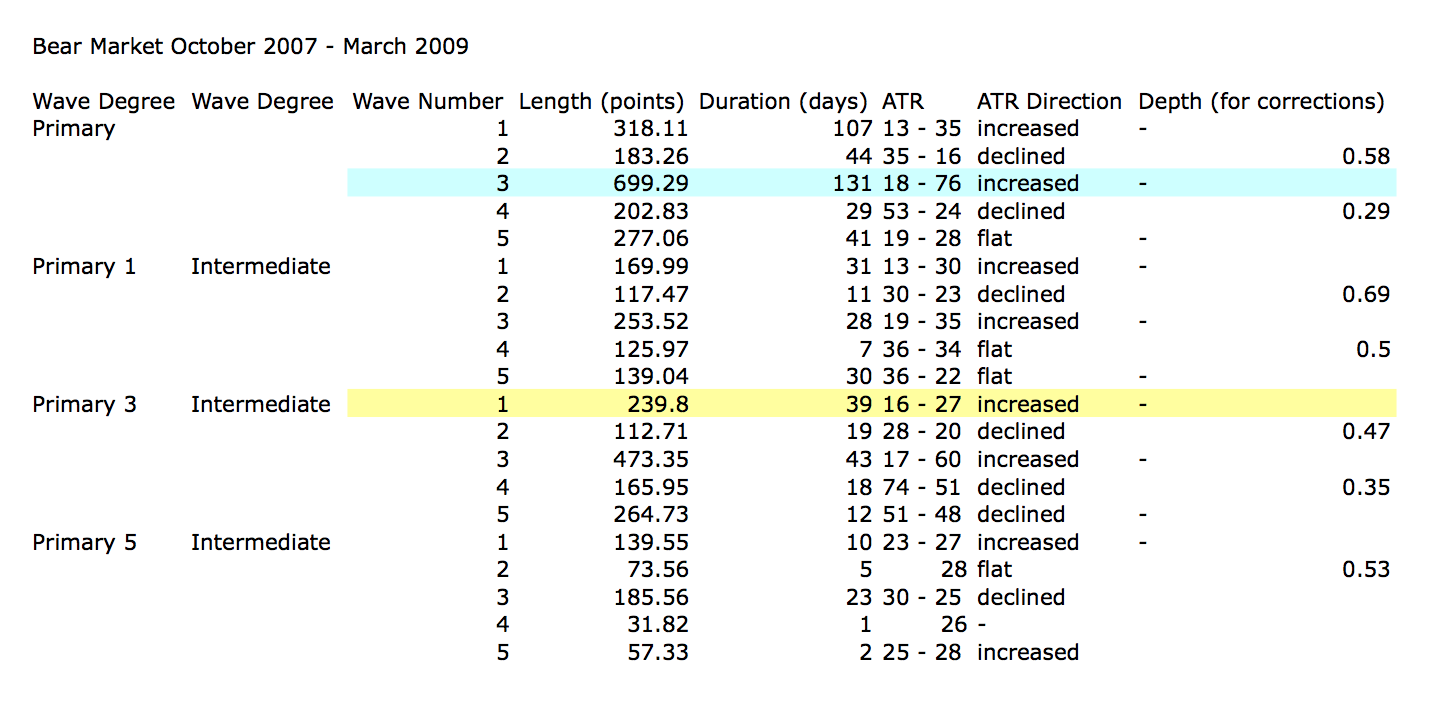
Click to enlarge.
In looking back to see how a primary degree third wave should behave in a bear market, the last example may be useful.
Currently, the start of primary wave 3 now may be underway for this current bear market. Currently, ATR sits about 19. With the last primary degree third wave (blue highlighted) having an ATR range of about 18 to 76, so far this one looks about right.
The current wave count sees price in an intermediate degree first wave within a primary degree third wave. The equivalent in the last bear market (yellow highlighted) lasted 39 days and had a range of ATR from 16 – 27.
To see some discussion of this primary degree third wave in video format click here.
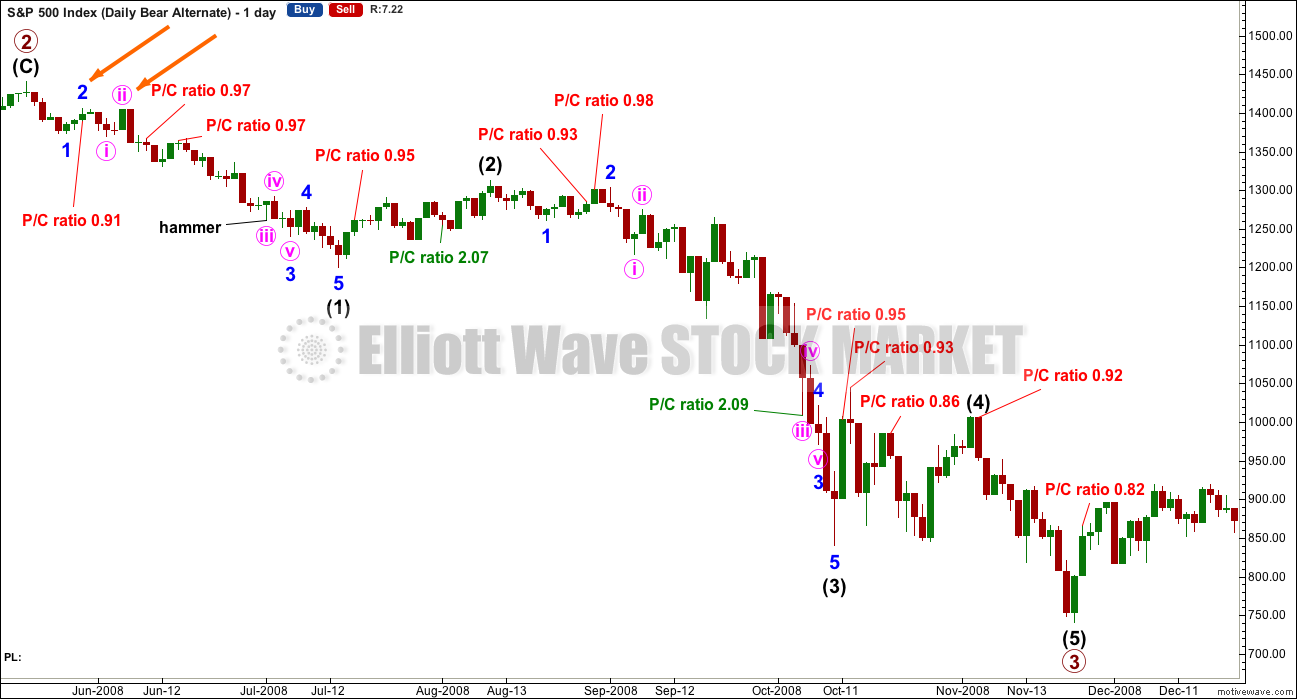
Click chart to enlarge.
This chart is shown on an arithmetic scale, so that the differences in daily range travelled from the start of primary wave 3 to the end of primary wave 3 is clear.
Primary wave 3 within the last bear market from October 2007 to March 2009 is shown here. It started out somewhat slowly with relatively small range days. I am confident of the labelling at primary degree, reasonably confident of labelling at intermediate degree, and uncertain of labelling at minor degree. It is the larger degrees with which we are concerned at this stage.
During intermediate wave (1), there were a fair few small daily doji and ATR only increased slowly. The strongest movements within primary wave 3 came at its end.
It appears that the S&P behaves somewhat like a commodity during its bear markets. That tendency should be considered again here.
Looking more closely at early corrections within primary wave 3 to see where we are, please note the two identified with orange arrows. Minor wave 1 lasted a Fibonacci 5 days and minor wave 2 was quick at only 2 days and shallow at only 0.495 the depth of minor wave 1.
Minute wave ii, the next second wave correction, was deeper. Minute wave i lasted 3 days and minute wave ii was quick at 2 days but deep at 0.94 the depth of minute wave i.
What this illustrates clearly is there is no certainty about second wave corrections. They do not have to be brief and shallow at this early stage; they can be deep.
This chart will be republished daily for reference. The current primary degree third wave which this analysis expects does not have to unfold in the same way, but it is likely that there may be similarities.
Put / Call ratios are added from data published at CBOE. This ratio is the index ratio published, not the ratio specifically for the S&P500. It should be a reasonable indicator of sentiment. Only values above 2 and below 1, extremes, are noted. A low P/C ratio indicates more long positions than short, so it is interpreted as bearish, a contrarian indicator. A high P/C ratio indicates more short than long positions, so it is interpreted as bullish, a contrarian indicator.
There were two instances where the P/C ratio gave a bullish extreme above 2 during primary wave 3. One instance happened right at the end of the middle of the third wave. My conclusion is that the P/C ratio may be a reasonable sentiment indicator, but it is not to be taken definitively. It should be one piece of information weighed up alongside other information. Currently, the index P/C ratio is not extreme. Only extremes will be noted.
DOW THEORY
I am choosing to use the S&P500, Dow Industrials, Dow Transportation, Nasdaq and the Russell 2000 index. Major swing lows are noted below. So far the Industrials, Transportation and Russell 2000 have made new major swing lows. None of these indices have made new highs.
I am aware that this approach is extremely conservative. Original Dow Theory has already confirmed a major trend change as both the industrials and transportation indexes have made new major lows.
At this stage, if the S&P500 and Nasdaq also make new major swing lows, then my modified Dow Theory would confirm a major new bear market. At that stage, my only wave count would be the bear wave count.
The lows below are from October 2014. These lows were the last secondary correction within the primary trend which was the bull market from 2009.
These lows must be breached by a daily close below each point.
S&P500: 1,821.61
Nasdaq: 4,117.84
DJIA: 15,855.12 – close below on 25th August 2015.
DJT: 7,700.49 – close below on 24th August 2015.
Russell 2000: 1,343.51 – close below on 25th August 2015.
To the upside, DJIA has made a new major swing high above its prior major high of 3rd November, 2015, at 17,977.85. But DJT has so far failed to confirm because it has not yet made a new major swing high above its prior swing high of 20th November, 2015, at 8,358.20. Dow Theory has therefore not yet confirmed a new bull market. Neither the S&P500, Russell 2000 nor Nasdaq have made new major swing highs.
It is important to note here that traditional Dow Theory (using only DJT and DJIA) has confirmed a bear market and not confirmed the end of that bear market and the start of a new bull market. I would consider Dow Theory to be a solid and effective tool to determine overall market direction. This is another reason why I have little confidence in the alternate bullish Elliott wave count.
This analysis is published @ 07:00 p.m. EST on 28th May, 2016.
I’m showing SPX volume at 904.42M, a good jump from last week’s days.
Looks like todays candlestick for the S&P is a red hanging man.
One more little piece of information which is bearish.
Look at where the green hourly candlestick ended today, almost right at the lower edge of the channel about minute c.
A more perfect throwback I could not imagine.
Now if this wave count is correct, and if we’re reading the technicals correctly, then Mr Market just offered us a gift. The bankers may have pushed that up for us to give the perfect entry point for one of the most awesome trades of a lifetime.
Maybe.
Nothing is 100% certain, which is why we must manage risk.
NASDQ also closed today for the 5th day in a row above its BB. It’s due to snap back in the short term to its 20-day SMA. 5 days above or below a BB is the most I’ve heard for any US index. Most ever I’ve seen is 7 days, and that was for silver or gold (a comodity) when it was sliding hard a couple of years ago.
Nice set-up indeed.
I see, thanks Ari, another thing to look out for.
I notice also Nasdaq rising on falling volume for the last few days. So yes, a reaction down from there would be entirely reasonable to expect.
Huge Volume Today in SPX :
898.706 Million Today
505.454 Million Friday
Very nice to see indeed. A little more confidence that we may indeed have a trend change happening here 🙂
Is that a possible zig-zag up for a second wave?
Long upper wick on the last candle looks terminal.
Yes, it looks like a pretty clear three on the five minute chart.
It ended just above the 0.618 Fibonacci ratio, and ended with a bearish engulfing candlestick pattern.
However, I don’t really like to consider candlestick patterns on the five minute chart. Nor will I put too much weight on anything on the five minute chart.
So my conclusion there is…. it’s not bullish.
Which is not quite the same as saying it’s bearish. But it’s certainly not bullish.
Will be watching futures closely this evening. It really ought to be down triple digits for DJI and over 1.5% or thereabouts for SPX. Next stop, SPX 1900. I do expect a primary degree third down to earn a little respect and smash it. albiet after a slight pause to say “Howdy!” ‘Nite all…!
I don’t believe it will be down much in futures overnight tonight… market will want to suck any remaining $$$ from the dumb money in the morning during regular trading hours. Then look to trap all bulls with a sharp move lower sometime on Wednesday & close at or near the low and only then will the overnight futures be sharply lower.
I think the bounce is done. Loaded to the gills with UVXY 11.50 calls expiring next week @0.50 per contract . A few speculative 11.50 calls expiring Friday @ 0.25. This pullback today an amazing gift horse. Looking for a gap n’ go tomorrow. The banksters have a lot on their plates I’m afraid….
After such a bullish run we have to expect a sharp bull 2nd wave correction, after a 3rd down I think they will be more cautious giving us a flat wave 4?
Last Golden Chance to SHORT at this level!!!!
If you believe… of course.
Joseph,
Expecting a ramp to 2,115 and market strength at that level will determine what is the next move. I was expecting the S&P to hit 2,084-2,085 retracement before the ramp to 2,115. I guess we will know tomorrow if today’s low was good enough. Volume could be tied to month end action.
Has anyone looked into the carry forward trade influence due to USD moves? Strength in USD will certainly attract foreign money into US markets.
I am being patient and if 2,115 fails that will be sign for me to open 50% position on the short side.
Good Luck with that… I respectfully disagree.
I will repeat….
Th-th-th-that’s all, folks!
Needs more than luck imho…. 🙂
I would speculate it has been money flooding out of China is one factor that has given us this relentless upward market. One look at the world real estate market gives you an idea how much the wealthy Chinese want to get their cash out of China ahead of further devaluation and crashing markets. When you have buying with no price discovery it is an Algo, the Fed, of someone who wants to park their cash now.
DJIA has a huge bearish engulfing candlestick pattern today.
DJT is forming a doji with a long upper wick.
Nasdaq is forming a small red doji.
Russell 2000 is forming a green doji with a long upper wick.
Across the board the US markets so far today are looking more bearish than bullish.
When NY is closed I’ll be able to see what the international markets did, when StockCharts have their data.
Yep! It engulfs price action from last Wednesday, Thursday, and Friday last week. It is a monster. I do not know what market UVXY short sellers are watching. Remarkable! Not that I am complaining mind you…! 🙂
International exchanges:
FTSE has a beautiful bearish engulfing candlestick today.
Singapore (sometimes a leader) has a doji.
Shanghai has a huge green candlestick. Going against the flow of all others!
Hang Seng has a green candlestick with a long upper wick.
DAX a bearish engulfing pattern, very strong.
Good morning every body. Nice to see the market behaving itself. I can see a nice five down on the five minute chart, although with an extended first wave. Now a bounce beginning for a second wave correction.
That adds a little confidence today.
I have the 0.618 Fibonacci retracement level at 2,097.82
And another thing, todays downwards move has clearly breached the trend channel containing minute wave c.
This bounce is a throwback to the bear market trend line, with a slight overshoot.
We have trend channel confirmation of a change. Now we have throwback to resistance… for those not short yet or those choosing to add to shorts an entry here with a stop just above the high for todays session is a low risk / high reward opportunity.
Remember (this is directed at less experienced members) never ever anything ever* risk more than 3-5% of equity on any one trade and always use a stop loss to protect your account.
*quote from Rick Mayall in Mr Jolly Lives Next Door
Should head up to around 2096.80…
should stay below 2098.30
has already retraced over 50% of the move…hmmmm
I have it just below ATM. I have the 0.5 level at 2,096.07
sorry Lara…I should clarify.
I’m looking at the ES, and the ES traded yesterday during the globex session 2102.75.
Righty ho. Understood.
Not at all. A second wave can permissibly retrace 100% of a first….
Watching this bounce closely. The third wave pull could make it an abbreviated affair, concluding prior to the close with a waterfall starting now and continuing overnight…
Impulse down complete. Now to rattle weak hands on the short side.
Russell 2000 slowly breaking down
A heck of a daily candle (bearish) is forming on that Russell index!
and now in the red with the rest ….this last hr should be interesting
SDOW and SPXS popping upward nicely too now.
I think an extended three just completed and this is a fourth wave underway….one more impulse to complete wave one down….
Taking profits on short term positions on next move down and waiting to reload on second wave bounce…
agree..especially if this move is only minuette 1 of minute 1 of minor 3 down. Should have several other opportunities to get short ….hopefully tomorrow, if you can be nimble. 🙂
We don’t get too many opportunities to compound returns on impulses down so you gotta take ’em when you see ’em…I do think this is only minuette one down…
Great to see that outside reversal day. I think volume will also be healthy giving us a nice trifecta of divergent volatility, engulfing candle, and high volume….Nice!! 🙂
Yep… Volume will be much higher today than Friday.
on the ES, I do count 5 waves down on the 30 minute chart. The high was during the globex session yesterday. We should have a small bounce here…one that should be shorted of course….IMO.
QID calls popping finally. This is a no-brainer trade. This should be an easy triple or more…
Tiiiiimmmbbbeeerrr!
footlong candles
Yes…PLEASE give us red, foot long candles. Love them when I’m short!
Now don’t be too greedy there Doc.
The foot longs won’t turn up for a while… patience.
Now that’s what I’m talkin’ ’bout! 🙂
UVXY 11.50 next to be followed by 12.20…
dow/nasdq/s&p all in the red now just russell small cap hanging in the + so still some appetite for risk, need to watch it closely
Yep. I am now thinking the impulse will still complete today with a nasty second wave coming at the end of the day. This has been the tactic to whipsaw traders. It may not happen with a powerful third but that is the way I am trading it- taking profits and rolling positions on the bounce…
here come the banksters
Shallow corrections augurs well for the power of a third down. It would be great to see a decisive fall away from the 2100 pivot with increasing momentum…last time we were here I said the same thing and did not take my own medicine…. 🙂
Here we go 🙂
Quick 3,3,5 expanded flat over so soon??!!
Back below 2093.05 means third down on deck…
Right on schedule, another intra-day reversal and a big second wave up. It has started early enough to perhaps complete before the close but I doubt it. It will bamboozle any traders taking short positions this morning and probably be a deep re-trace.These guys are becoming quite predictable….
Th-th-th-that’s all, folks!
Fourth wave underway?
I count 5 down on the 5 minute chart with the low of v at 12:15. I would not be surprised with end of month today to see ii up take us to the close with some type of doji or spinning top candle. Maybe a shallow ii with a red bar…
Real fireworks *should* be tomorrow.
Of course a quick ii that starts iii down on the 5 minute TODAY would be nice too!
I am assuming an extended third…
One more impulse down and then a manic second wave up to confuse the cubbies.
The pattern has been completion of impulses intra-day so I expect it will continue….
May have a series of 1’s,2’s ….with 3, 4’s to go. Seems to have found support now at the minuette wave best fit channel.
I have been away from the screen for the last hour or so. I am back and very happy to see what might be the beginning of Minor 3. With that encouragement, I leave for the mountains to find the bear. I will be back Friday most likely after the close. I will start my trip with a cautious smile!
Have a great time in the great outdoors Rodney. Wishing you every success in your Ursine scouting, and looking forward to seeing you when you get back…. 🙂
Russell small cap breaking EMA support on the 10min chart & S & P getting close to breaking EMA on the 2 hr chart… Dido Olga’s 2087.12 for S&P
Wondering if the price had to go up past 2084, then past 2099 to shake out the super high VIX point shown at the May 19th date? (corresponding SPX low in price on that day). One can see the same pattern too of how VIX and price were so opposite each other at the April 19th high…same which happened just now over the last week or so in this timeframe. 2 hour bar chart of SPX shown.
11.50 next milestone for the Unicorn…it should catch up with and sling shot past VIX fairly soon…
May have found short term support at Lora’s Bear Market Trendline…
I would expect a third down to slice through it decisively….
My channel looks different. I show we did break down already. However my channel is on the ES.
Covered half my short at 2092 on the ES…looking to reload back on the short side if we get a rally.
Really nice chart Gary. Thanks. I am hopeful we will break out or drift out of the channel.
Thank you.. Update coming
Freely promoting the etf with the symbol EDZ. It is a 3x bearish etf (where you want stock indexes to drop to be clear). It has a great upward chart pattern looking at the 6 month or 1 year daily.
Hi Joe:
Look at how volatility is now jumping ahead of price movement bud…
My next points of interest 2092.18 (poss W4 of (v) low) & 2087.12 (poss W4 of (c) low) – whilst above there this move up can extend higher imo.
Nice 5 down atm, but can always be a pesky c wave of an expanded flat – need a 3 wave upwards move to provide more confidence.
Anyway – I’m all in so I can only sit and watch 🙂 Well done to anyone patient enough to get in short today.
Broke out of Lara’s wC wave channel. Could be coming it to kiss it here.
My QID calls a bit sluggish. The NDX longs seem to think they have nothing to worry about. What exactly are they smokin’?! 😀
It feels like we’re all sitting down together at a card table and playing a game of poker.
I’m in too…. but with just a little room for just a little more.
I’ll be moving my stop down to todays high and adding a little more to my short position, to total 5% of my equity.
I think that’s a pretty cunning plan 🙂
Another new 52 week low in UVXY this morning. There is no fear here… 🙂
is certainly early in the day yet but it could be a great candle day for us bears!
Looks like we are about to get an extended third wave…..
UVXY open gap from this morning filled. A move above 12.20 today is a go… it means we are headed for the upper BB…
This next wave down should be a small degree third wave and should really kick some bullish gluteus maximus….
Looks like 1,2,3 of developing impulse down. We need to fill gap at 2099.06 to confirm…
Correction, we actually hit 2099.05 on that last candle down so gap already filled…
That’s all Folks!
Looks beautiful so far…
Let’s not jinx it 😉 🙂
VIX is up 0.94 to 14.06
That’s a lot for DOW only down 38 and S&P down 0.21
A 10% move will take it over 15.00 and that would be bearish…
We need to now take out 2098.05…
You would need a much bigger move down in DOW & S&P to get there atm.
Not necessarily. In fact a good clue as to what is coming is when VIX starts jumping ahead of actual price movement in the market. Smart traders are always a little bit ahead of the crowd….
An excellent development would be for price to engulf both Friday and Thursday’s action with a new low below 2087.08…
We need three up and some ramping momentum for confirmation…UVXY still red…incredible!
Olga – I’m getting time gaps between the pricing (only on less than a day charts). Any thoughts on how to fix it? And as always thankful for your help. See chart.
Not had that issue – is it maybe trying to show out of hours data that isn’t available?
Try Chart Settings – Chart Paramters tab – then in Chart Time Options at the bottom, ensure Keep Chart Up to Date is ticked and Show Data outside regular hours is not ticked.
Is probably something in those Chart Time Options if not the above
Thanks. I just learned it has something to do when I was putting VIX as a secondary over SPX, then going down to less than a day chart.
Extended 5th close to completion???
Below 2095.92 cannot be a small W4
You cannot get much more extreme than five trading days outside Bollinger bands as NDX is now doing. Executing trade via QID June 30 strike calls. Filled at 0.32 half position. Buy stop on second half with bid of 0.45 to be filled at the market…
It looks like we are going to get one more spike up out of this sideways movement before we see an impulse down….
Chicago PMI is down into contraction territory-consumer confidence is down, lowest since 2015 yet the markets rally up……..
Nibbling on the short side here @ES 2101. Move off today’s lows looks corrective to me and there’s a good chance the worm is starting to turn back down.
WIll add significantly as I get confirmation.
The bulls have been hanging tough around the 2040 pivot. I am not going to be fully convinced until I see it taken out on an impulse down with either an extended third or fifth wave. The meandering continues….
I trade very short term Verne. Anywhere between 30 minutes to 4- 5 days. I only trade the ES. I take anywhere between 100-200 contracts position in a blink of an eye.. so I have to be right within 10-15 minutes of my position or I am out. The toughest part of my style of trading is to wait…for the move to set up.
I caught this short at 2101 this am and added to it 2099. We go down from here. I’m an old school technician, but have recently (2008) added Elliotwave to my trading. I like knowing the wave counts are as helps me with what positions to hold longer or what positions to dump quickly.
I like your style and that is the way I have been trading lately as well. I am keeping my trades on a very short lease and not leaving profits in this market. I plan on taking the same approach on the next wave down. While I like seeing big green gains on my positions, I will be scalping and rolling all the way…. 🙂
Frankly I don’t like this triangle shape that is now developing. It means more meandering today with more upside more likely than not. What we need for the bearish case is a clean, sharp clear five wave impulse down at the minimum. Even that would not be conclusive, but a necessary, thought not sufficient condition for the immediate bearish case.
I cannot confirm the count, but it could be an ending diagonal that is forming.
Also, it is forming an upward sloping wedge which usually resolves to the downside.
Time to watch that purple line get busted. The stopped out H&S is extremely bullish. You can speculate on the VIX and banksters all day. The VIX is only the market inverse and not very good at that.
Complacency with regard to any significant decline in the market remains extreme, as evidenced by the red print in UVXY. An incredible number of shares remain sold short. Today’s gap down should be quickly filled if we have a trend reversal at hand. The next sign of a proper compliment of fear commensurate with market risk will be a close above 12.20 in UVXY. If this is the start of minor three down and that level is not achieved today, we should gap up through it at the open tomorrow imo. If that does not happen, price is what it is and we are simply going higher in the short term.
We have enough upward movement today to form the top of a bearish engulfing pattern. We have a long way to go to complete the minimum lower part of the body, 2090. But it is a possibility to watch.
That will be clue #2.
An outside reversal day would be a big deal.
The third and final clue would be an explosion in volume.
We already have VIX divergence. Clue #1.
How strong Verne?
If you are referring to the strength of the divergence VIX is up 6% as of this post. Anything over 5% on an up market day is noteworthy. If it approaches 10% that is equivalent to sirens going off imo…
Cheers Verne for the info ?
Morning all!
Continuing the theme of distinguishing the forest from the trees, and trying to identify market patterns as a possible clue to near-term direction, Sam Collins took a look at recent action around the 2040 pivot and charted how the recent action mirrors the false breakdown, followed by a false breakout last December. I think we are looking at a market in which the developing trend in being fiercely resisted by the banksters, which in turn is why we are witnessing the amazing tug-of-war price action. While I do not underestimate the commitment of the banksters, I do not think this can continue for much longer. Just as in the physical realm, I believe financial markets can also exceed their “elastic limit” and rather than snapping back and forth around pivots, they ultimately simply snap. I am curious as to how far CSI would have fallen without a 10% limit circuit breaker.
Good morning! There were 2 members here with the user name “Thomas” including me. I have changed my user name to Tom. I am the “Thomas” that has a background in quantitative system design and trading. 🙂
Lara:
I haven’t seen post for 30th May analysis yet, is something wrong with my account ?
That’s because the last day that the SPX Traded was May 27th. Closed for Memorial Day… a US Holiday. May 27th is posted.
Thank you Joseph!
Apparently CSI was down the 10% limit for the session in that spike. As global markets continue to fracture I suspect we are going to see more of these as the banksters slowly loose control. That kind of move in futures represented a monstrous unwinding of a long position. I seriously doubt it was due to short selling. As this kind of thing starts to occur with increasing frequency, it will be a good tactic to keep open “stink ask” orders on a few short positions (especially if you trade options) in the hope of getting filled during a flash crash. Conversely, “stink bids” on the long side that get filled during a mini flash crash can give some incredible returns in very short order. Obviously, these are all speculative types of trades and made only for giggles… 🙂
Flash crash in CSI makes the thousand point DJI plunge last August 24 look like a blip. Central banks stepped in immediately but an ominous sign…the bottom of that spike will probably be revisited…
Hi Lara, doesn’t minuette wave 5 have a typical 4th wave look? How often do you see a rapid move down following a sideways move like this? Doesn’t a wave 3 normally come after a spike/peak shape rather than a rounded sideways move?
? minuette (v) is an upwards trend.
I wouldn’t say it has a fourth wave look.
it has weaker momentum than minuette (iii) and a shallower slope, which is absolutely typical of a weaker fifth wave after a stronger third wave
no, the start of minor 3 doesn’t have to come after a spike. the S&P often forms rounding tops, and can do so at the start of a third wave
A good(long) read titled “Are the Bulls Back?”
http://seekingalpha.com/article/3978516-bulls-back?app=1&auth_param=1db37t:1bko1ri:fe2ffe7ebb812cb236a7bcde9657e0b3&uprof=56&dr=1
I am actually glad to see European markets hinting at a bit more upward movement on Tuesday. An outside reversal day would go a long way toward inspiring some confidence that we had just completed a C wave up.
up into 2111 top would still fit a C wave up completion; i’m still short on my ETF’s.
I also expect VIX to signal the all clear. I will be looking for divergence with a higher VIX as SPX moves higher. I could even endure a temporary dip of UVXY below 10 so long as it does not close below, and there is also divergence with VIX.
For thought: daily SPX chart with bull count shown (zoomed up a bit for easier viewing). Began with Lara’s bull count, but asking if A-B-C from the April 19th high is already over with? Close over 2111 would confirm entry into a new bull phase. Which would mean a larger degree A-B-C is finished from the May 2015 top. Sunday night trading (i was stopped out of short E-minis) obviously is now past 2099. Yet 1.618 target of 2099 is now gone so the most likely new one would be 2.618 = 2,131.90. Lite and declining all week volume is on Bears’ side yet to finish a “C” up. But it doesn’t do one’s account well with prices rocketing up either regardless of volume.
my mistake, the “(2)” should be a (4)
Has anyone else noticed that expanded flats seem to be wave structure occurring with the most frequency of late? It so also interesting in that this, wave structure, probably more than any other, has the ability to confound and confuse bear and bull alike. We have been seeing a lot of difficult to recognize B waves that throw out head fakes by moving beyond the A wave and drawing the bears in, only to be whipsawed by a vicious C wave in the opposite direction. I think this has been the outcome of every instance we have anticipated the onset of a powerful third wave decline. It could be the expanded flat is the wave form of intervention, and I am curious about whether as traders we can begin to exploit thier frequency of occurrence in anticipating market direction, in addition to the current EW count.
Here are three things I have noticed.
1. Most recent impulses down are completing intra-day.
2. Price action issues in a long lower wick or hammer
3. VIX (or UVXY with less realiability) penetrates or touches the upper BB and/or prints long upper wick.
Comments are welcome.
I have noticed that every time we expected a strong wave down according to our EW count, one or all of the above events occurring has been a sign that an expanded flat was unfolding with a C wave to follow. Just thinking out loud….
BTW, it quickly became clear to me that it was EWI’s dismal failure to recognize this particular pattern that led them to so many horridly wrong calls over the years. It was one of the first things I noticed about Lara’s analysis when I became a member, and that is that she had a much more sophisticated grasp of the various wave forms.
Here is one take on how to trade expanded flats:
http://www.investoo.com/how-to-trade-flats-and-expanded-flats/
The writer of that article makes it look and sound easy, which of course it would be in hindsight.
The proof is whether or not he can do it in real time. That’s another matter entirely!
It’s not explained what a “break” with structure is, I think that’s important. It’s stated that identifying the start of a correction is easy, with which I will most strongly disagree, and finally it’s stated:
“If price goes below the 161.8, we are no longer in an expanded flat”
which is incorrect.
Nope. I’m not buying it.
Trading expanded flats isn’t so easy.
There’s one I think unfolding right now on Gold. The C wave is almost done. Lets see if that’s “easy”. Pretty sure it won’t be. Also pretty sure at the end of wave C on that structure I’ll have members insisting Gold is about to make new all time lows, they’ll be nervous to go long.
I think you are right on the money about gold and exited short trades recently. I think we could go a bit lower but already sentiment starting to shift which for me signals time to take profits… 🙂
Lara reminds me of a radiologist. I look at x-rays and I’m like what the heck is THAT. The expert comes in and sees the most minute and micro details that i thought was a focus problem.
I have focus problems sometimes 🙂
My two cents worth Verne…
It’s those darn B waves. They’re such a sucker play, I get sucked into them regularly. That’s their purpose.
B waves of expanded flats (of flats generally, but expanded more so) are so hard to pick and stick with the count when you think one may be unfolding. More often than not an expanded flat isn’t clear until the C wave is underway.
I agree with the long lower wick on a daily candle at important lows; we have one on 20th Jan and 11th Feb most recently. But TBH the problem I can see there is there were also long lower wicks during downwards movements; 3rd Feb, 8th Feb, 4th Jan… I can see more.
It’s a hugely tricky one. So hard to see as it unfolds. I have concluded for now that a long lower wick in conjunction with divergence with OBV, RSI and / or VIX will be the key to seeing a B wave of an expanded flat.
Most of the people writing those kinds of articles rarely have money on the line. Real traders pay no attention to that sort of stuff. Right on Lara! I was too polite to say what you did but I am So glad you did! The hard reality is that the vast majority of successful traders do not share their methods.
I agree with your take on the B waves. Anyone who has actually tried to trade them knows that it is not at all that simple. 🙂
Hi Lara
No worries, I realized the invalidation point is the start of the short term wave 1 on the hourly. Thanks
Okay, I’ll have no worries 😉
Hi Lara
The all time high of S&P500 at the beginning of primary wave 1 was about 2130 so why the invalidation you marked as 2111.05? Was it because of cash vs futures market data? I just checked the cash index, the high seemed to be 2132.82 – am i missing something?
This particular Elliot Wave count has me a bit concerned about there still being a bullish possibility. This is the eSignal Type 1 GET system which does not follow pure Elliot Wave count rules rather tries to create a trading system around some of the principles. I am using SPY for this chart.
My two cents worth:
1. This isn’t a chart of the S&P500. SPY will have a slightly different wave count, because it’s a different market. The distinction is very important.
2. Anything Elliott wave which isn’t following all the rules all the time, and isn’t putting the wave count into context (i.e. isn’t placing it into higher time frames up to and including all available data) has zero predictive value.
EW isn’t something that can be done halfway.
My conclusion would be not to let this potential wave count worry you. Focus on the technicals and don’t worry about anything half EW.
Ok tnx 🙂
Because the recent moves of the S&P 500 respected the Ichimoku cloud resistance so well, I decided to see what the previous trend line was when it broke cloud resistance the last time (Yellow line). It crosses the cloud nicely. Looks like it gets to 2000 around 6/7 if it follows this course…
Fat clouds like this one are easier to break through…
I am watching the Value Line Geometric Mean which is harder to manipulate. It is respecting the down trend line.
http://scharts.co/1TOXuZ3
“The Value Line Arithmetic Composite Index was established on February 1, 1988, using the arithmetic mean to more closely mimic the change in the index if you held a portfolio of stocks in equal amounts. The daily price change of the Value Line Arithmetic Composite Index is calculated by adding the daily percent change of all the stocks, and then dividing by the total number of stocks.”
http://www.valueline.com/About/Ranking_System.aspx
Interesting. The S&P 500 High Beta Portfolio which may be an early indication met with some resistance at the end of the week…
“Now this is not the end. It is not even the beginning of the end. But it is, perhaps, the end of the beginning.”
Winston Churchill
Wow… We now have a cover working for the bear count!
“The Stock Market Won’t Crash, Yet” – The Barron’s Cover Strikes Again
Submitted by Tyler Durden on 05/28/2016 – 10:41
When it comes to Wall Street cover page superstitions, nothing beats the Barron’s front page article jinx: just when you think something will never happen, Barron’s confirms it on the cover, virtually assuring that it does. In which case, be afraid bulls, be very afraid, because if past is prologue Barron’s just green-lit the next crash.
http://www.zerohedge.com/news/2016-05-28/stock-market-wont-crash-yet-barrons-cover-strikes-again
Interesting.
I’ve had a thought… I agree with the point in the article that the only thing (seemingly) holding this market up is central bank intervention.
But that contradicts the recent example of the Chinese markets; when they crashed nothing the CCP did to stop it worked.
Which leads me to the conclusion that this market (S&P but also DJIA especially) just isn’t ready to crash up to now. That the bear market is only just beginning.
When it’s ready to move into free fall nothing any central bank anywhere tries to do will be able to stop it.
So from an EW POV what I’m concluding is that social mood just now isn’t ready for the middle of the bear market, it’s only just in the early stages of the beginning.
Which fits with social trends I see. But that’s so incredibly subjective, I hesitate to discuss that here even. I feel on safer territory with technicals.
In a way, both perspectives are correct. That central banks intervene is undeniable. It is also true that it is the perception of their invincibility that keeps sellers at bay, buyers emboldened (the few there are) and equally important, the crowd hopefully invested. In this way the influence of the banksters comports well with EW theory in that it primarily has to do with their ability to affect social mood. I have learned not to underestimate the gullibility of the crowd. They will eventually wake up to reality.
I was just looking at the Barron’s cover simply…
“The Stock Market Won’t Crash, Yet” 2045 according to zero hedge take on the Barron’s story.
To me that cover is bullish or shows complacency so therefore the lends support to the Bear Count.
I can’t read the full Barron’s story because I don’t subscribe. Anyone have the full Barron’s story?
I agree Joe. It’s bullish.
Verne and I are off on a tangent….. 🙂
I too would be interested in the gist of that article if any members have access and would be so kind as to post a quick summary for us.
“Verne and I are off on a tangent….. :-)”
Or perhaps a tango?! 🙂
It can be really amusing listening to the gobbledygook of some of these wall street perma- bulls who think they are a lot smarter than everyone else in the room. One of their favourite phrases in talking up the continuing bull market is that there is “a lot of cash on the sidelines”. These geniuses forget that for every seller, you have to have a buyer, and that buyer either moved an exactly equal amount of his/her cash off the sidelines, or similarly increased their leverage to execute the purchase. Exactly what “sidelines” are they talking about pray tell? Does anyone really pay attention to these clowns?!
They also don’t seem to understand that all that cash came from debt. All the cash printed and flowing in the financial sector has it’s equivalent, the other side of the balance sheet, in debt.
When a bear market takes hold that cash simply disappears. The debt has to be repaid which destroys money, or it is written off with the same result.
This POV some years ago would be met with derision. In the last few years a few central bankers have come right out with it and stated that banks create new money when they create loans. So I would expect now that my explanation here isn’t so controversial.
So if the bubble is based on debt, then bursting the bubble sees the debt and so the money disappear. Which is deflationary. Which is not good socially.
I’ve yet to see a talking head explain it like that. But then, I don’t tend to listen to the talking heads 🙂
I posted an article yesterday saying most stock buybacks are funded by new debt. Also BoA says their clients are scaling out of equities (see graph). So the upward thrust of the market is even more hard to explain, the author of this article says much of it is due to debt fueled buybacks.
Here is the link (again) an interesting article:
“How The Next Market Crash Happens”
http://seekingalpha.com/article/3977639-next-market-crash-happens
In addition to buybacks and the Fed, it’s quite possible the crashing Chinese stock market is pushing a lot of Chinese investors to the U.S. markets for relative safety and liquidity. Likewise, the Chinese are buying up real estate all over the world for durable assets outside of China. There is a lot of fear about a massive devaluation coming – so that caution is valid. The lack of price discovery in recent rallies would point to that as well.
Very few people realise what a large percentage of global debt is denominated in dollars. While I agree with those who envisage the dollar’s ultimate demise, prior to that it will go higher than most people expect as a viscious deflationary spiral destroys all that dollar-denominated debt, thereby making dollars more scarce, and more valuable in the short term and medium term.
For the Main count:
Does anyone see 5 waves in the very last wave? Sub-minutte v of Minutte (v)?
My newbie eyes don’t.
If it’s not there, then it supports the hypothesis that we might go just a little higher.
I can
Thanks Lara. Your analysis is absolutely the best. All the TA confirming the EW pattern is quite encouraging. Like Vern, I have been concerned the last 48 hours or so. But you analysis lends confidence. Thanks. Now on to the video.
BTW, did you mean week ending July 17, 2015 when discussing the weekly TA. I do not see a week ending on the 13th.
Oh dear, I should have said week starting 13th. Not ending.
I’m living in the future down here, we’re always a day ahead 🙂 Consequently I’m permanently confused as to what day / date / time it is.
That’s my excuse anyway
I think I understand now what the bears are up to and why there has been such a noticeable absence of sellers. They have been saving their ammunition for the round number pivot. Apparently they have been quite content to let the banksters and perma-bulls push the market up on low volume until it approaches that all-important pivot. The fact that they have rejected five prior attempts to re-take it means that it will in all likelihood once again provide quite formidable resistance. Thanks for pointing that out Lara; it’s as if the lights all of a sudden went on!
I predict we will see a massive ramp up in volume on any decline next week as the heavy-weights come out en masse….how easy it is to sometimes miss the forest because of the trees! Whew! I have to say I was starting to get a bit concerned….now I get it! The round number pivots are paramount! And there is no perambulating around that fact… 🙂
Perambulating. Another new word to my vocabulary. Thanks.
I will be perabulating the mountains next week. But I decided to leave Tuesday morning instead of Monday. I’ve got a lot to do and besides I want to see the open!
IKR
Verne is expanding out vocab. One new word each week or so it seems….
Yeah. Then in my second use of the word in the above comment, I even misspelled it!
Don’t you worry. We mentally inserted the missing “M”! 🙂
2,100 hasn’t been breached this time.
It has been before by a few points, but overall it held. Price moved down and away.
So probability says it will again.
Nothing in technical analysis is ever, nor ever can be, 100% certain though.
I suspect we are not going to see the gap up in VIX I would like to see on Tuesday. I would not be surprised to see a brief throw-over the 2100 pivot in one more huge cash dump by the banksters. A bearish engulfing candlestick would be a powerful reversal signal. I know I have been saying that for a few weeks now, but it sure would be nice to finally see something reasonably definitive
First. 😉