More upwards movement was expected to a target at 2,099 or resistance at the bear market trend line.
Price has stopped for the session right at the trend line.
Summary: Upwards movement is either over today or it may end slightly higher tomorrow. A breach of the green channel on the hourly chart would provide confidence that upwards movement is over. This would be confirmed by price with a new low below 2,058.35. If a third wave down begins tomorrow, then the short term target for minor 3 is at 1,907. The long term target for primary wave 3 remains at 1,423.
To see last published monthly charts click here.
To see how each of the bull and bear wave counts fit within a larger time frame see the Grand Supercycle Analysis.
To see detail of the bull market from 2009 to the all time high on weekly charts, click here.
New updates to this analysis are in bold.
BEAR ELLIOTT WAVE COUNT
WEEKLY CHART
This bear wave count fits better than the bull with the even larger picture, super cycle analysis found here. It is also well supported by regular technical analysis at the monthly chart level.
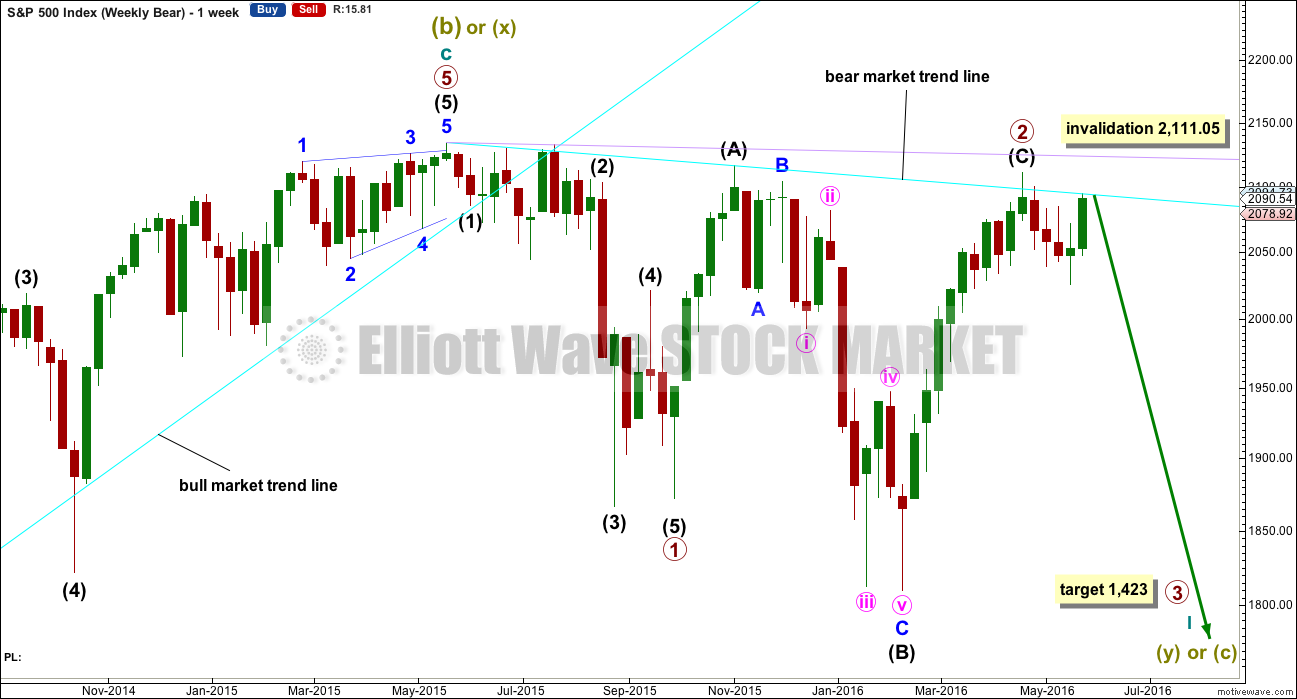
Importantly, there is no lower invalidation point for this wave count. That means there is no lower limit to this bear market.
Primary wave 1 is complete and lasted 19 weeks. Primary wave 2 is over lasting 28 weeks.
An expectation for duration of primary wave 3 would be for it to be longer in duration than primary wave 1. If it lasts about 31 weeks, it would be 1.618 the duration of primary wave 1. It may last about a Fibonacci 34 weeks in total, depending on how time consuming the corrections within it are.
Primary wave 2 may be a rare running flat. Just prior to a strong primary degree third wave is the kind of situation in which a running flat may appear. Intermediate wave (B) fits perfectly as a zigzag and is a 1.21 length of intermediate wave (A). This is within the normal range for a B wave of a flat of 1 to 1.38.
Within primary wave 3, no second wave correction may move beyond its start above 2,111.05.
DAILY CHART
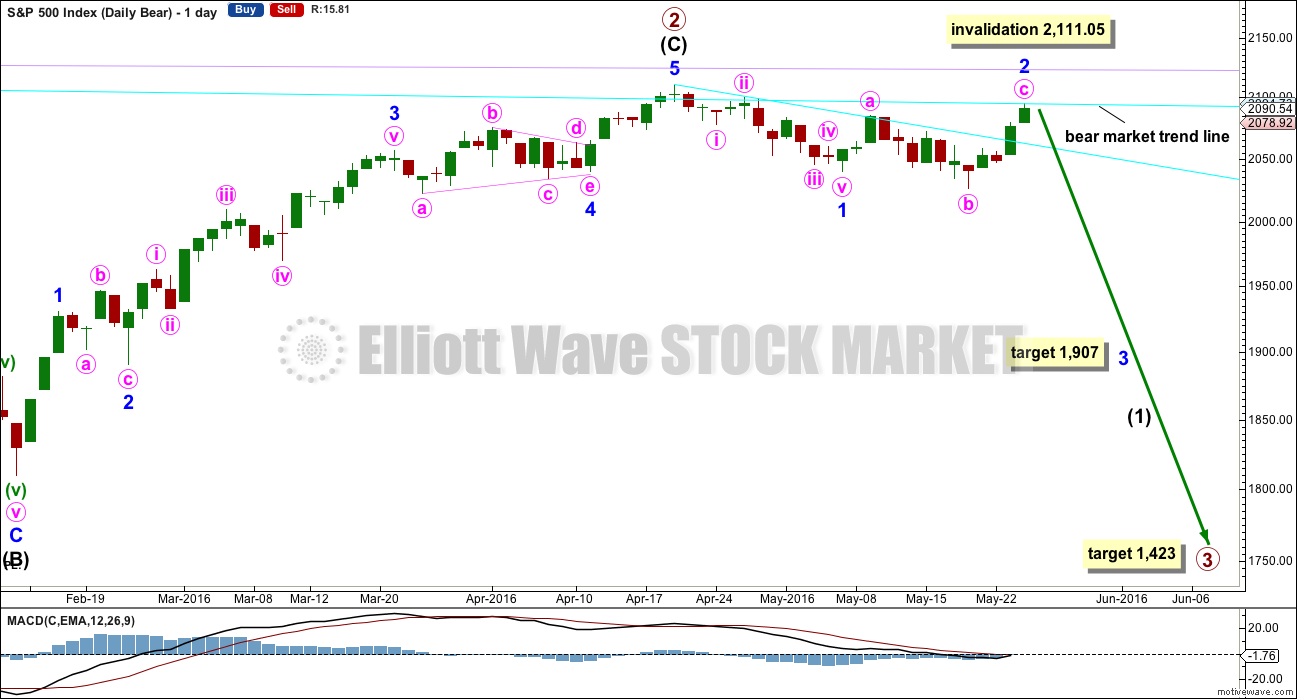
If intermediate wave (C) is over, then the truncation is small at only 5.43 points. This may occur right before a very strong third wave pulls the end of intermediate wave (C) downwards.
The next wave down for this wave count would be a strong third wave at primary wave degree. At 1,423 primary wave 3 would reach 2.618 the length of primary wave 1. This is the appropriate ratio for this target because primary wave 2 is very deep at 0.91 of primary wave 1. If this target is wrong, it may be too high. The next Fibonacci ratio in the sequence would be 4.236 which calculates to a target at 998. That looks too low, unless the degree of labelling is moved up one and this may be a third wave down at cycle degree just beginning. I know that possibility right now may seem absurd, but it is possible.
Alternatively, primary wave 3 may not exhibit a Fibonacci ratio to primary wave 1. When intermediate waves (1) through to (4) within the impulse of primary wave 3 are complete, then the target may be calculated at a second wave degree. At that stage, it may change or widen to a small zone.
With price now right at the bear market trend line, it is reasonably likely that minor wave 2 is over here as an expanded flat correction. If this is where minor wave 3 begins, then at 1,907 minor wave 3 would reach 2.618 the length of minor wave 1.
If minor wave 2 continues any higher to slightly overshoot the bear market trend line, then the target for minor wave 3 will have to move correspondingly higher. Notice that the bear market trend line has been overshot before at the high labelled primary wave 2, so it may be overshot again.
Minor wave 2 may not move beyond the start of minor wave 1 above 2,111.05. This is the risk to short positions at this stage.
If any members are choosing to enter short positions here, then manage risk carefully: Do not invest more than 3-5% of equity on any one trade and always use a stop loss to contain losses.
MAIN HOURLY CHART
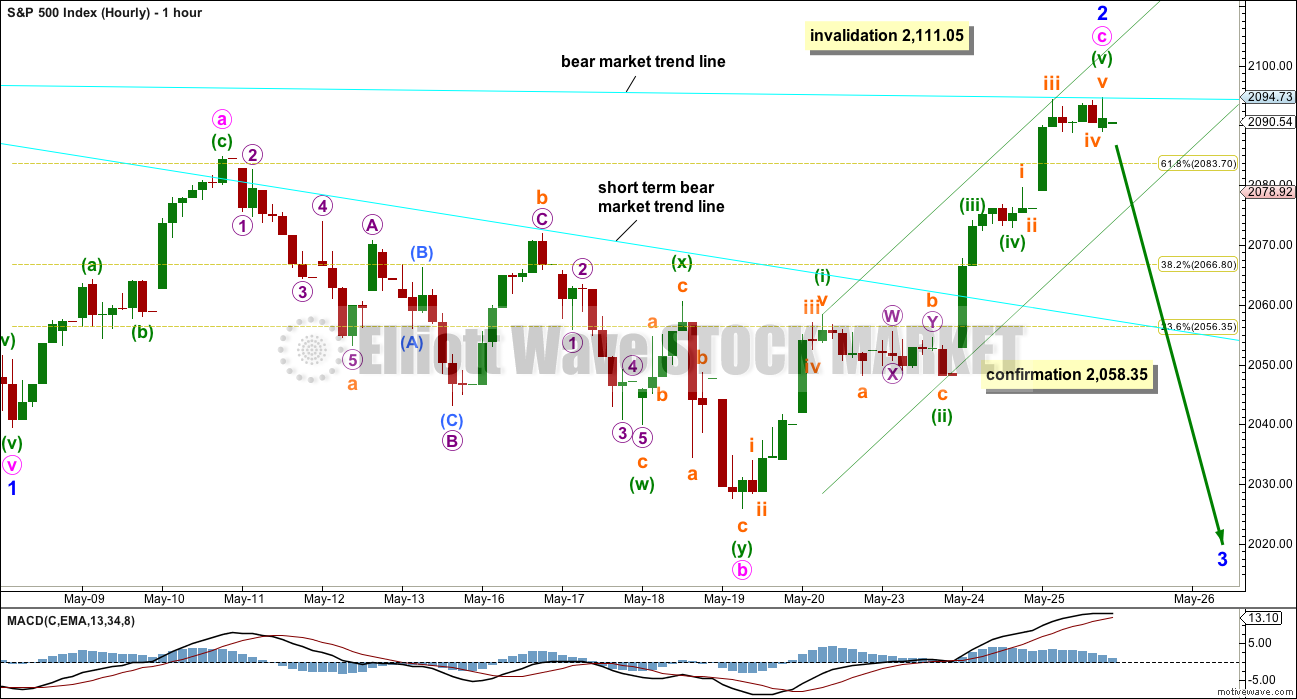
Minor wave 2 now looks like it may be complete. Minute wave c is 4.67 points short of 1.618 the length of minute wave a.
Ratios within minute wave c are: there is no Fibonacci ratio between minuette waves (i) and (iii), and minuette wave (v) is 1.74 points longer than 0.618 the length of minuette wave (i).
The green channel is a best fit channel about minute wave c. When this channel is breached by downwards movement, that shall provide trend channel confirmation that the upwards wave of minute wave c is over and the next wave down has begun.
The next wave down for this wave count should show a strong increase in downwards momentum.
ALTERNATE HOURLY CHART
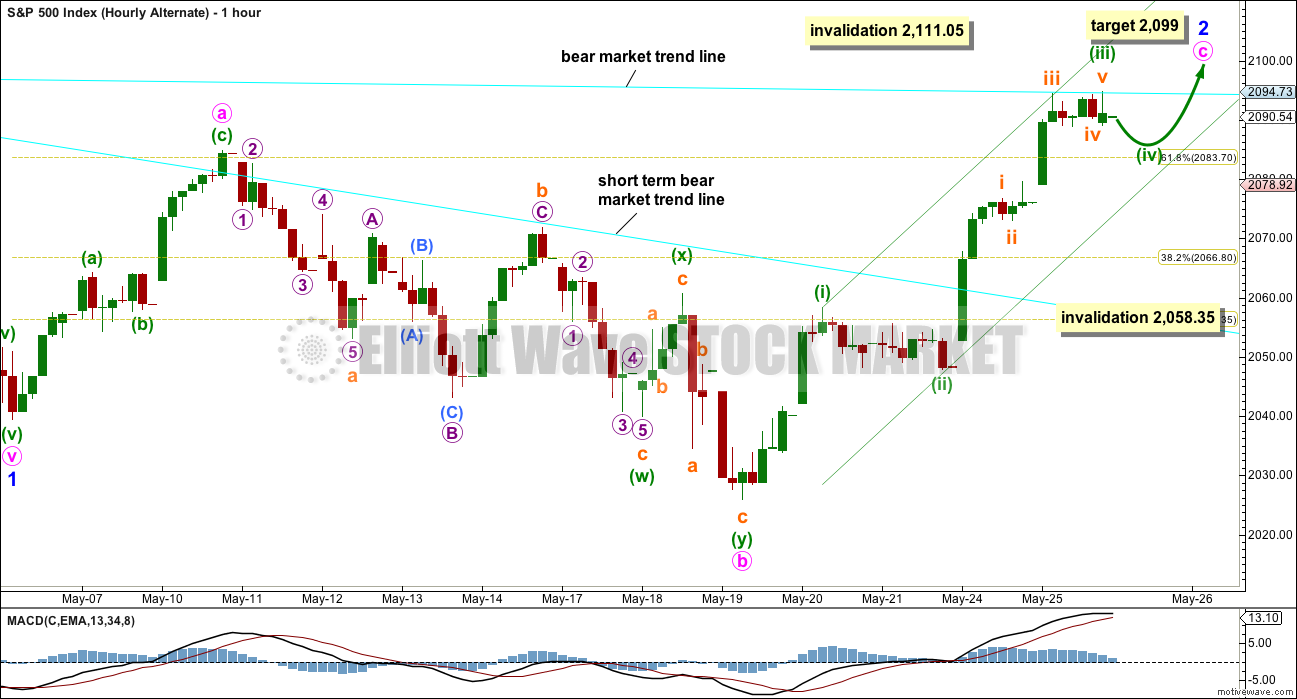
What if minor wave 2 is not over and will overshoot the bear market trend line?
It is possible that within minute wave c only minuette wave (iii) ended at the high for today’s session. There is no Fibonacci ratio between minuette waves (i) and (iii).
There are no adequate Fibonacci ratios between subminuette waves i, iii and v within minuette wave (iii). This slightly reduces the probability of this alternate.
Minuette wave (iv) may show up on the daily chart lasting one to three sessions. This would give minute wave c a clear five wave look at the daily chart level. Minuette wave (iv) may not move into minuette wave (i) price territory below 2,058.35.
BULL ELLIOTT WAVE COUNT
WEEKLY CHART
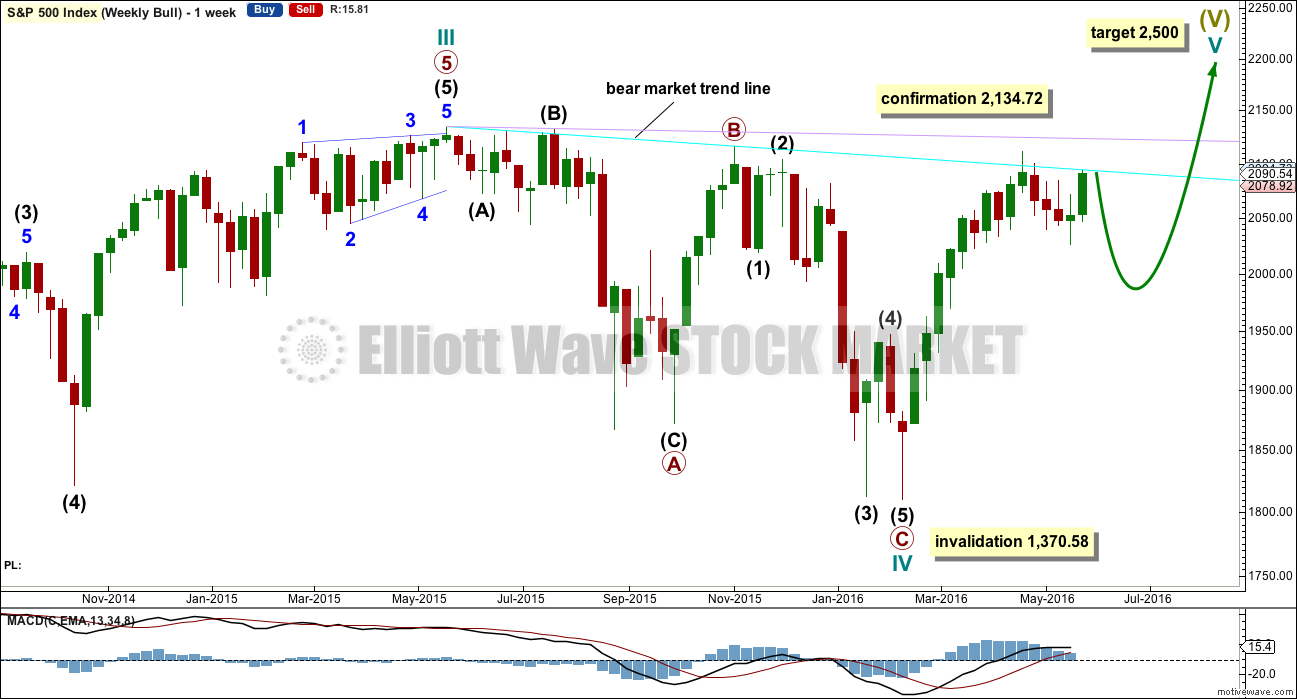
Cycle wave IV is seen as a complete flat correction. Within cycle wave IV, primary wave C is still seen as a five wave impulse.
Intermediate wave (3) has a strong three wave look to it on the weekly and daily charts. For the S&P, a large wave like this one at intermediate degree should look like an impulse at higher time frames. The three wave look substantially reduces the probability of this wave count. Subdivisions have been checked on the hourly chart, which will fit.
Cycle wave II was a shallow 0.41 zigzag lasting three months. Cycle wave IV may be a complete shallow 0.19 regular flat correction, exhibiting some alternation with cycle wave II.
At 2,500 cycle wave V would reach equality in length with cycle wave I.
Price remains below the final bear market trend line. This line is drawn from the all time high at 2,134.72 to the swing high labelled primary wave B at 2,116.48 on November 2015. This line is drawn using the approach outlined by Magee in the classic “Technical Analysis of Stock Trends”. To use it correctly we should assume that a bear market remains intact until this line is breached by a close of 3% or more of market value. In practice, that price point would be a new all time high which would invalidate any bear wave count.
This wave count requires price confirmation with a new all time high above 2,134.72.
While price has not made a new high, while it remains below the final bear market trend line and while technical indicators point to weakness in upwards movement, this very bullish wave count comes with a strong caveat. I still do not have confidence in it.
The invalidation point will remain on the weekly chart at 1,370.58. Cycle wave IV may not move into cycle wave I price territory.
This invalidation point allows for the possibility that cycle wave IV may not be complete and may continue sideways for another one to two years as a double flat or double combination. Because both double flats and double combinations are both sideways movements, a new low substantially below the end of primary wave C at 1,810.10 should see this wave count discarded on the basis of a very low probability long before price makes a new low below 1,370.58.
DAILY CHART
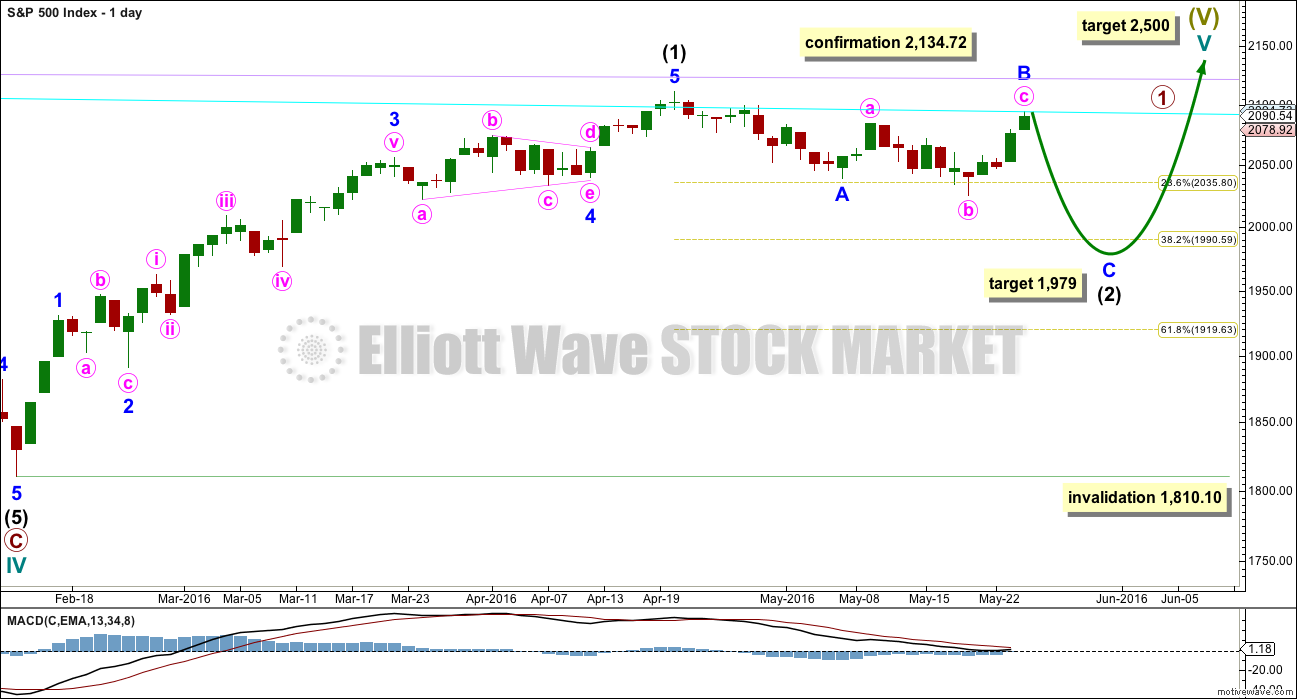
If the bull market has resumed, it must begin with a five wave structure upwards at the daily and weekly chart level. That may today be complete. The possible trend change at intermediate degree still requires confirmation in the same way as the alternate hourly bear wave count outlines before any confidence may be had in it.
If intermediate wave (2) begins here, then a reasonable target for it to end would be the 0.618 Fibonacci ratio of intermediate wave (1) about 1,920. Intermediate wave (2) must subdivide as a corrective structure. It may not move beyond the start of intermediate wave (1) below 1,810.10.
In the long term, this wave count absolutely requires a new high above 2,134.72 for confirmation. This would be the only wave count in the unlikely event of a new all time high. All bear wave counts would be fully and finally invalidated.
TECHNICAL ANALYSIS
WEEKLY CHART
Click chart to enlarge. Chart courtesy of StockCharts.com.
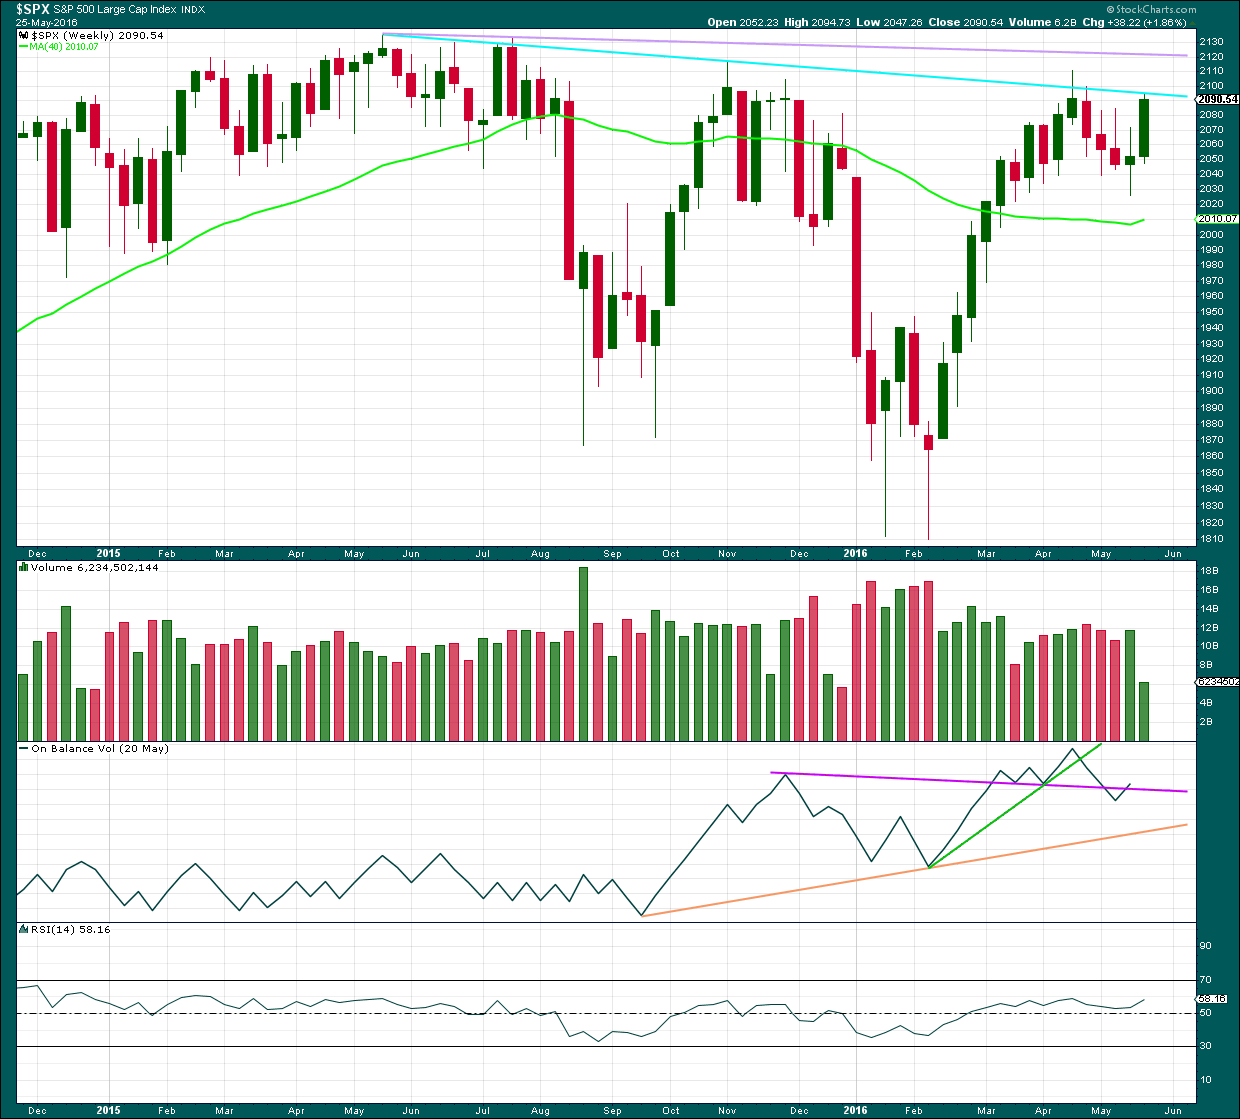
There is a bearish engulfing candlestick pattern at the last high. This has occurred at the round number of 2,100 which increases the significance. Volume on the second candlestick is higher than volume on the first candlestick, which further increases the significance. That it is at the weekly chart level is further significance.
Engulfing patterns are the strongest reversal patterns.
Now this pattern is followed by another red weekly candlestick. The reversal implications of the pattern are confirmed.
This is a very strong bearish signal. It adds significant weight to the expectation of a trend change. It does not tell us how low the following movement must go, only that it is likely to be at least of a few weeks duration.
There is also a Three Black Crows pattern here on the weekly chart. The first three red weekly candlestick patterns are all downwards weeks. The pattern is not supported by increasing volume and only the third candlestick closes at or near its lows; these two points decrease the strength of this pattern in this instance. That the pattern occurs at the weekly chart level increases its strength.
On Balance Volume broke below the purple line and is now returning to just above it. The bearishness of the break below the purple line is negated.
DAILY CHART
Click chart to enlarge. Chart courtesy of StockCharts.com.
Volume data on StockCharts is different to that given from NYSE, the home of this index. Comments on volume will be based on NYSE volume data when it differs from StockCharts.
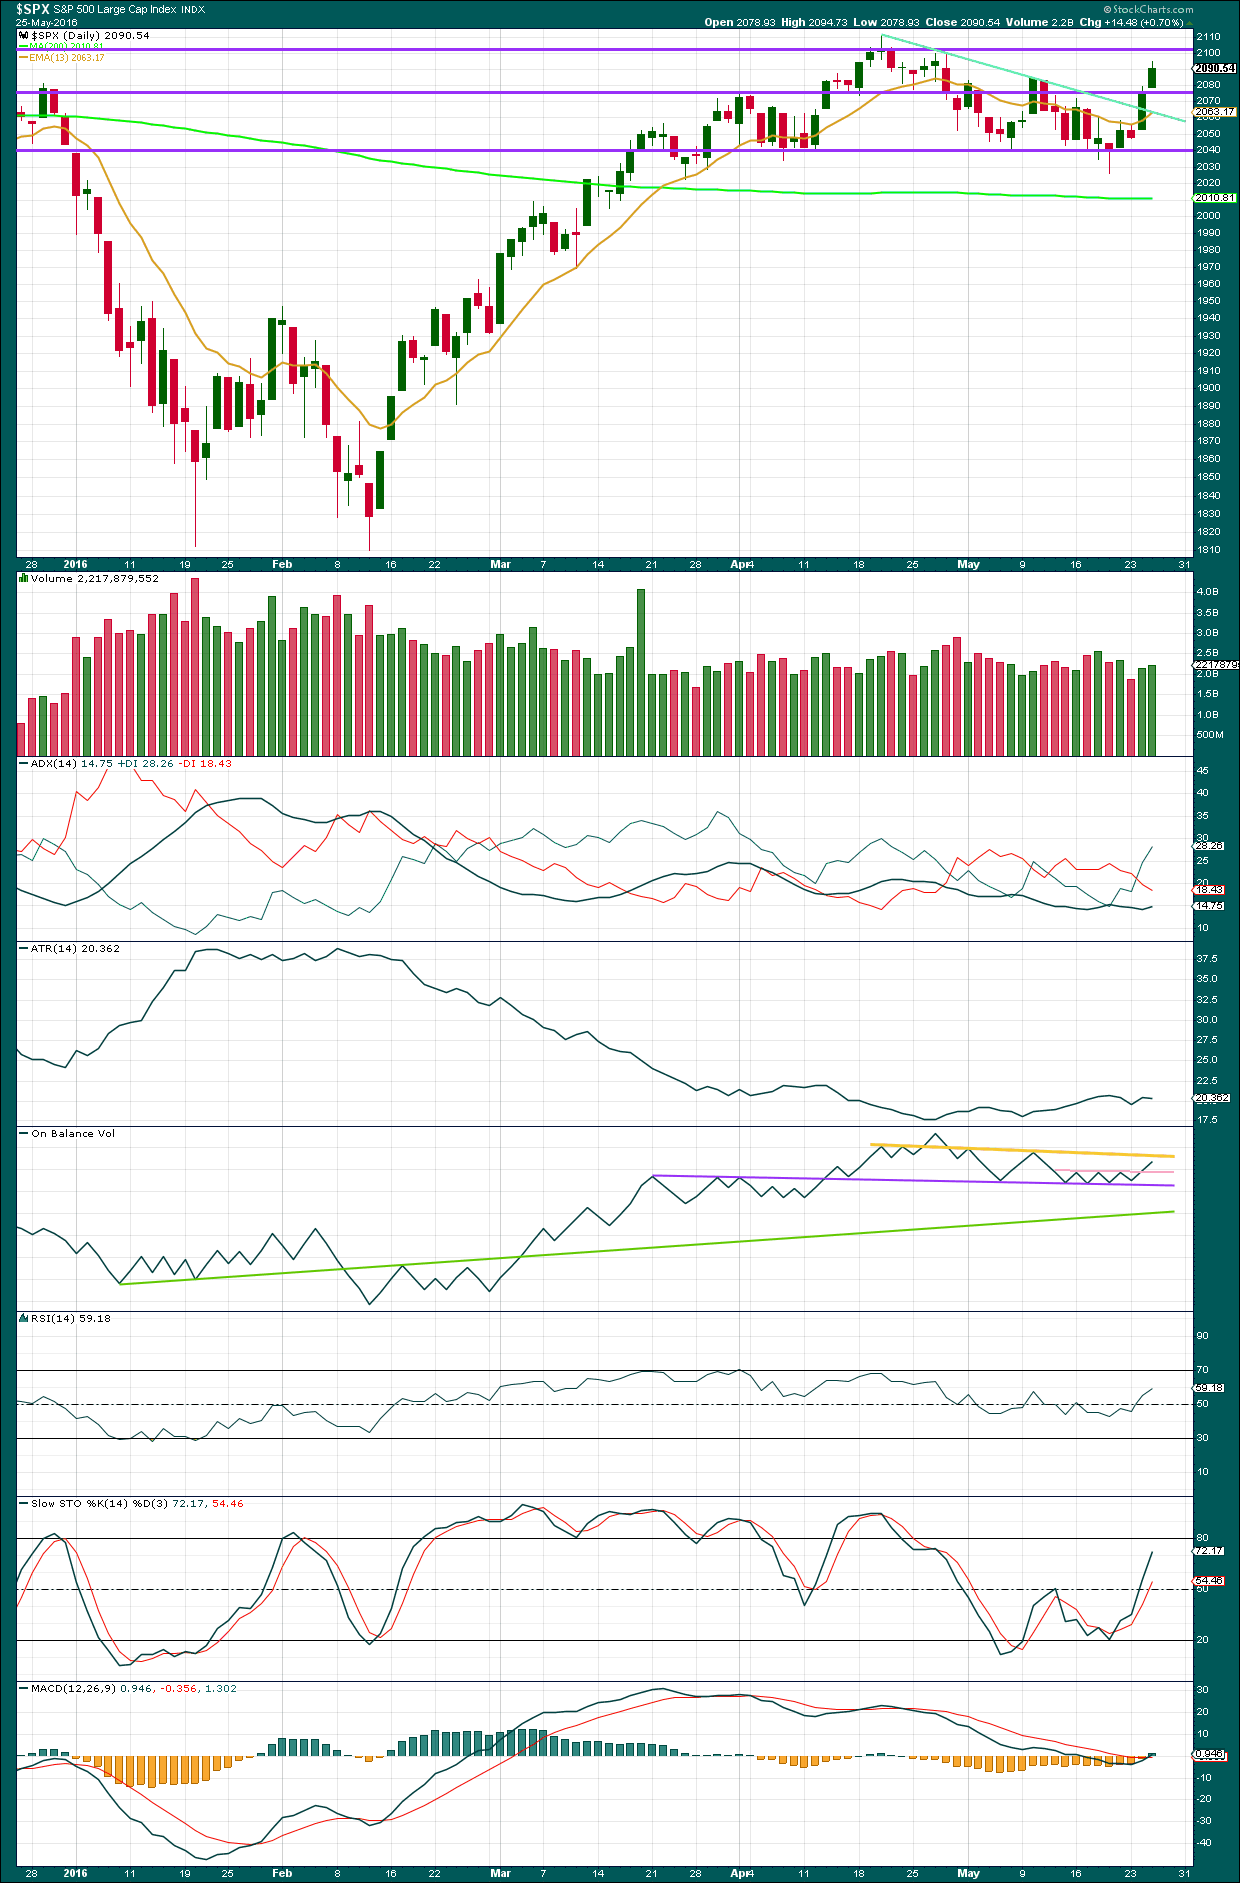
There is some support for the rise in price today from volume. If there is a high in place, then ideally it would come on a day with upwards movement to complete a green daily candlestick or a doji, on lighter volume. The slight rise in volume today looks like upwards movement is not quite done yet. This is a big reason for publishing the alternate hourly wave count today.
If upwards movement continues, then it may find very strong resistance about the round number pivot of 2,100.
ADX today indicates there is an upwards trend in place. ATR may be disagreeing as today it is flat indicating no clear trend. If this upwards movement is a small countertrend movement, then disagreement between ADX and ATR would be expected.
On Balance Volume is close to but not yet touching the yellow trend line. One more day of small upwards movement to bring OBV up to the yellow line may occur. If OBV touches the yellow line, then that should stop price from rising further.
There is no divergence today between RSI and price: price has made a new swing high above the prior high of 10th of May and RSI has made a corresponding new high.
There is no divergence between price and Stochastics either. Stochastics is not yet overbought. So if this market is range bound, more upwards movement would be expected until price finds resistance and Stochastcis is overbought at the same time.
VOLATILITY – INVERTED VIX DAILY CHART
Click chart to enlarge. Chart courtesy of StockCharts.com.
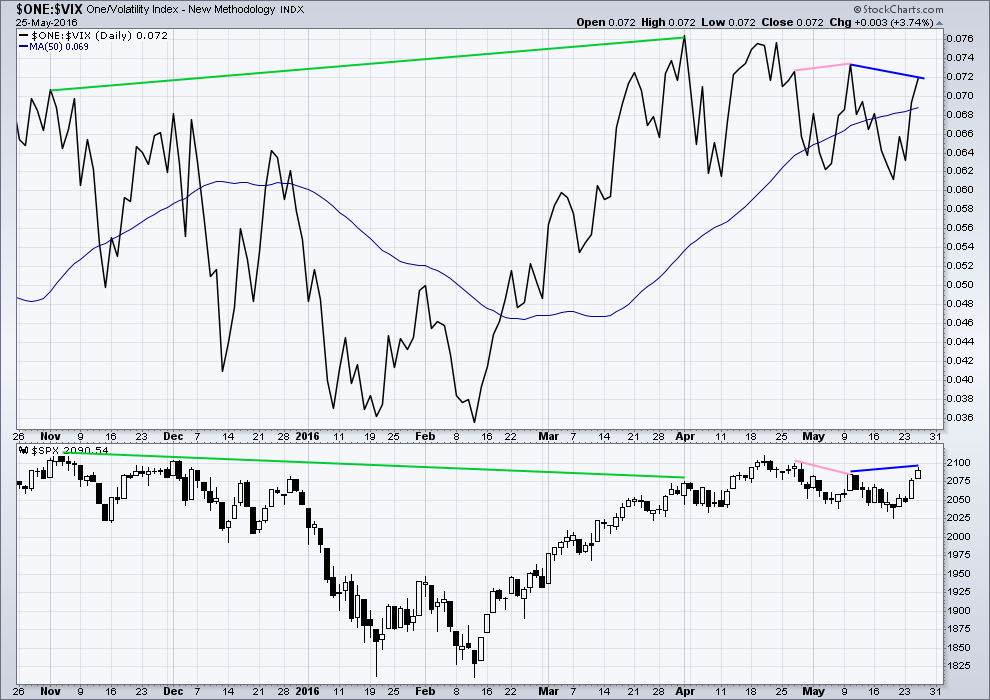
Volatility declines as inverted VIX climbs. This is normal for an upwards trend.
What is not normal here is the divergence over a reasonable time period between price and inverted VIX (green lines). The decline in volatility did not translate to a corresponding increase in price. Price is weak. This divergence is bearish.
There is divergence between price and inverted VIX (dark blue lines) today. While price has made a new swing high above the prior high of 10th of May, inverted VIX has failed to make a corresponding new high. This indicates weakness to upwards movement. The rise in price has not translated to a corresponding decline in volatility. This divergence is bearish.
BREADTH – ADVANCE DECLINE LINE
Click chart to enlarge. Chart courtesy of StockCharts.com.
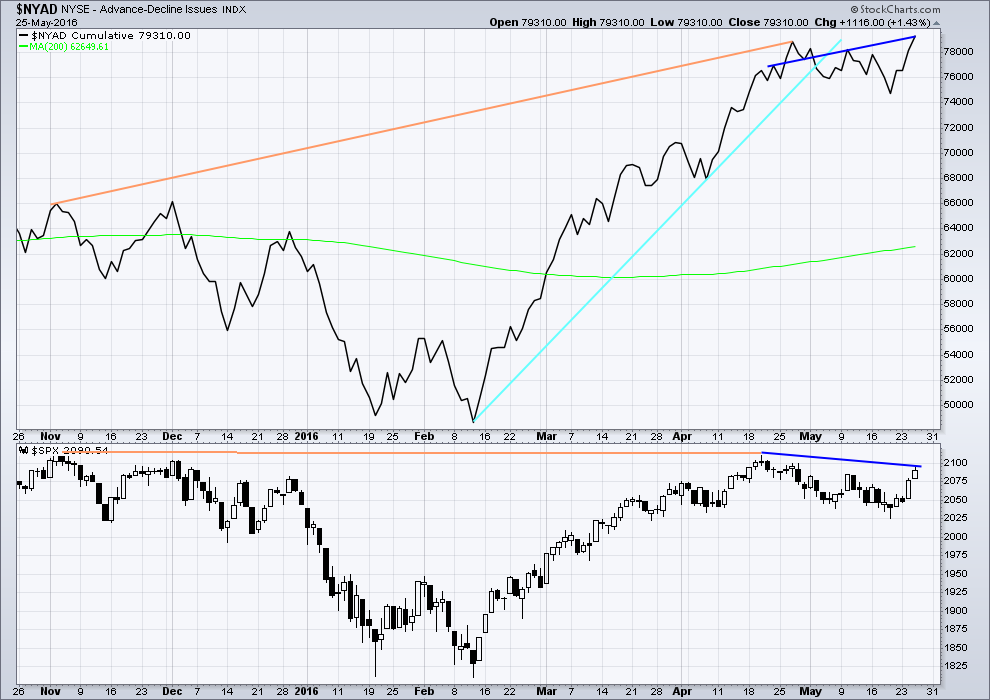
With the AD line increasing, this indicates the number of advancing stocks exceeds the number of declining stocks. This indicates that there is breadth to prior upwards movement.
From November 2015 to 20th April, the AD line made new highs while price far failed to make a corresponding new high. This indicates weakness in price; the increase in market breadth is unable to be translated to increase in price (orange lines).
The 200 day moving average for the AD line is now increasing. This alone is not enough to indicate a new bull market. During November 2015 the 200 day MA for the AD line turned upwards and yet price still made subsequent new lows.
The AD line is now declining and has breached a support line (cyan). There is breadth to downwards movement; more stocks are declining than advancing which supports the fall in price.
There is regular bearish divergence today between price and the AD line. Price has made a lower high to the swing high dated 21st of April, but the AD line has made a higher high. This indicates weakness in price.
With divergence between price and the AD line and price and VIX, it is reasonably likely that upwards movement is over here. These two indicators today both support the main hourly wave count.
ANALYSIS OF LAST MAJOR BEAR MARKET OCTOBER 2007 – MARCH 2009
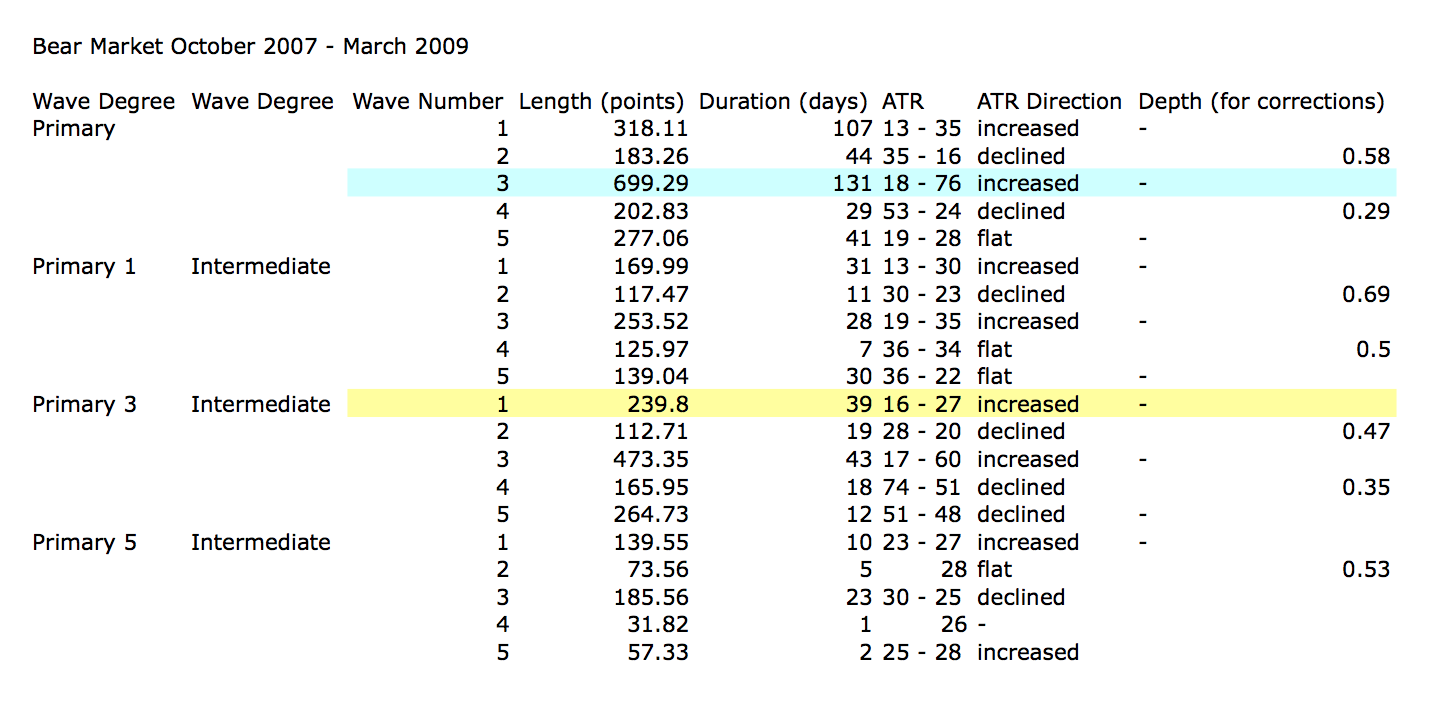
In looking back to see how a primary degree third wave should behave in a bear market, the last example may be useful.
Currently, the start of primary wave 3 now may be underway for this current bear market. Currently, ATR sits about 19. With the last primary degree third wave (blue highlighted) having an ATR range of about 18 to 76, so far this one looks about right.
The current wave count sees price in an intermediate degree first wave within a primary degree third wave. The equivalent in the last bear market (yellow highlighted) lasted 39 days and had a range of ATR from 16 – 27.
To see some discussion of this primary degree third wave in video format click here.
This chart is shown on an arithmetic scale, so that the differences in daily range travelled from the start of primary wave 3 to the end of primary wave 3 is clear.
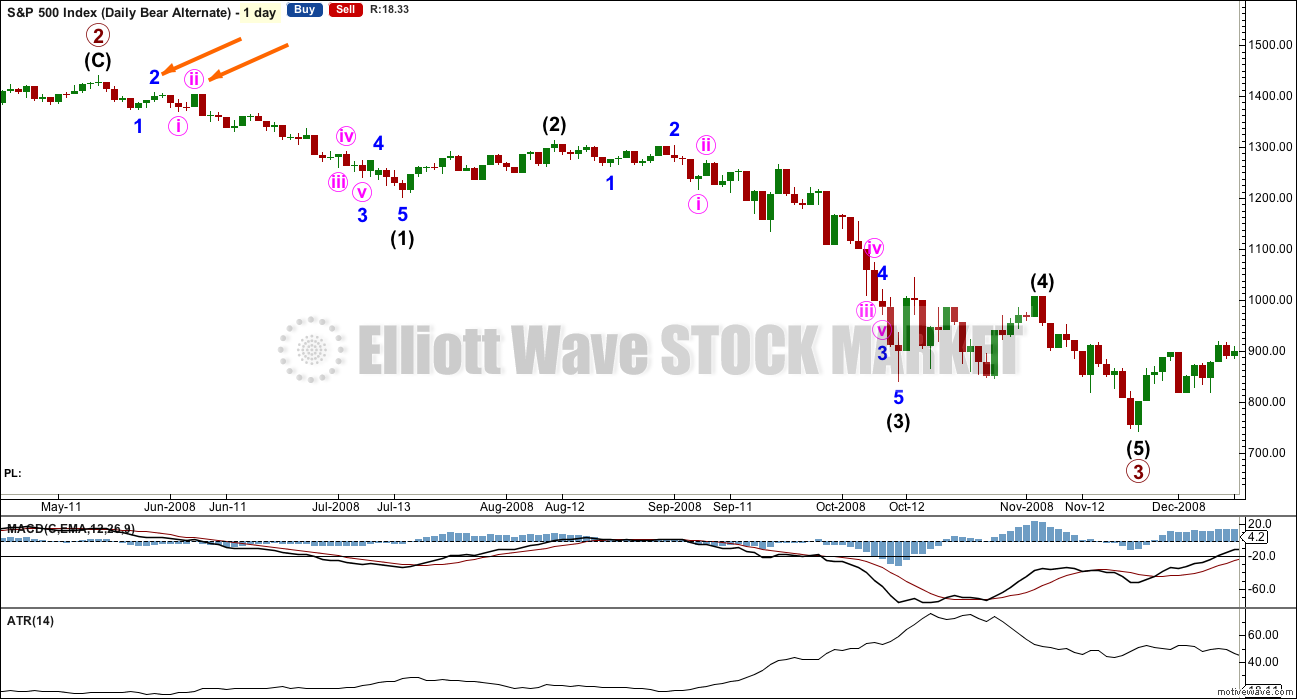
Primary wave 3 within the last bear market from October 2007 to March 2009 is shown here. It started out somewhat slowly with relatively small range days. I am confident of the labelling at primary degree, reasonably confident of labelling at intermediate degree, and uncertain of labelling at minor degree. It is the larger degrees with which we are concerned at this stage.
During intermediate wave (1), there were a fair few small daily doji and ATR only increased slowly. The strongest movements within primary wave 3 came at its end.
It appears that the S&P behaves somewhat like a commodity during its bear markets. That tendency should be considered again here.
Looking more closely at early corrections within primary wave 3 to see where we are, please note the two identified with orange arrows. Minor wave 1 lasted a Fibonacci 5 days and minor wave 2 was quick at only 2 days and shallow at only 0.495 the depth of minor wave 1.
Minute wave ii, the next second wave correction, was deeper. Minute wave i lasted 3 days and minute wave ii was quick at 2 days but deep at 0.94 the depth of minute wave i.
What this illustrates clearly is there is no certainty about second wave corrections. They do not have to be brief and shallow at this early stage; they can be deep.
This chart will be republished daily for reference. The current primary degree third wave which this analysis expects does not have to unfold in the same way, but it is likely that there may be similarities.
DOW THEORY
I am choosing to use the S&P500, Dow Industrials, Dow Transportation, Nasdaq and the Russell 2000 index. Major swing lows are noted below. So far the Industrials, Transportation and Russell 2000 have made new major swing lows. None of these indices have made new highs.
I am aware that this approach is extremely conservative. Original Dow Theory has already confirmed a major trend change as both the industrials and transportation indexes have made new major lows.
At this stage, if the S&P500 and Nasdaq also make new major swing lows, then my modified Dow Theory would confirm a major new bear market. At that stage, my only wave count would be the bear wave count.
The lows below are from October 2014. These lows were the last secondary correction within the primary trend which was the bull market from 2009.
These lows must be breached by a daily close below each point.
S&P500: 1,821.61
Nasdaq: 4,117.84
DJIA: 15,855.12 – close below on 25th August 2015.
DJT: 7,700.49 – close below on 24th August 2015.
Russell 2000: 1,343.51 – close below on 25th August 2015.
To the upside, DJIA has made a new major swing high above its prior major high of 3rd November, 2015, at 17,977.85. But DJT has so far failed to confirm because it has not yet made a new major swing high above its prior swing high of 20th November, 2015, at 8,358.20. Dow Theory has therefore not yet confirmed a new bull market. Neither the S&P500, Russell 2000 nor Nasdaq have made new major swing highs.
This analysis is published @ 10:19 p.m. EST.

Not liking this hanging around the round number at all. The longer it goes on, the greater the chances that the market will rise above this number. If we do not move decisively away from the 2100 area prior to the close I will be lightening my short term positions going into the week-end…I’ve seen this too often before…
Good day to all. First post from a new member – great site! Question for you, Lara (or anybody knowledgeable). In the summary, you mention the short term target for minor 3 is 1,903. Is there any reliable way of forecasting the timeframe referred to by “short term”? For instance, are we thinking days, or weeks? I understand this kind of question is difficult to answer, but I did notice your forecast for August 19, 2015 accurately projected an impending sharp decline that week.
Exited my E-minis picking up 2.25 basis points. Sitting tight with short 3x ETF’s.
Lower Volume today vs yesterday on a daily doji.
The downwards movement from the high (this is on the 5 min chart) looks like a five but it’s not a leading diagonal. The wave lengths are wrong.
It may be a first wave and now a second wave expanded flat. So a new high slightly above 2,094.30 would complete the expanded flat for micro 2, that would see submicro (C) move above submicro (A) avoiding a truncation.
For the alternate hourly idea this could be A-B-C for a zigzag. Wave B could be the expanded flat.
Because 1-2-3 and A-B-C (of a zigzag) both subdivide the same way; 5-3-5.
NASDAQ is having its second full candle above its upper BB. I don’t see how it can go any higher from here…
Although tomorrow is a big day news wise (GDP numbers in AM, and Yellen speech in the afternoon), its before a holiday and everyone is expecting low volume and no big swings… And just because of that reason, we might see some big swings tomorrow on low volume! 🙂
Great call Ari. The reversion to the mean trade is one of the most reliable trades one can make and I think NDX gave us a big tell with that BB move.
I was thinking the banksters would make a strong run at the SPX 2100 pivot but if they did not do it with wave three up I think it now unlikely. The SPX doji today clinches it for me and I deployed my remaining dry powder at the close. All in! 🙂
So did I Verne! lol
After I wrote my comment, I checked the SQQQ September $20 call option. At $1.45, I thought they were a bargain, and I jumped in all the way. Can’t bee too bad of a buy being 2 days above BB’s. Bull or Bear wave count, we’re bound to have a correction over the next 2-3 weeks. Too much uncertainty with the Brexit vote and the Fed decision, something’s gotta give. Plus you mentioned the China news that may be coming out. It’s a good set up.
However, UVXY just too unpredictable for me and way too risky. I’m sticking to the SQQQ call options…
Sideways.
It’s a direction 🙂
Maybe there will be a small doji for todays session, setting up for an Evening Doji Star?
If symmetry works with rhyming, I am all for a repeat tomorrow so that the follow through to the downside happens next week while I am away.
Maybe up into 2099 with this count here, 5min chart zoomed up some.
Nope on the chart above, price closed below “i” so still in the iv, or maybe with a little luck v is over and we’ll head down.
Looks like price breaking from wedge to the upside. Doesn’t appear to be either rising or falling but mostly sideways. Nothing much to see here it seems…
agree. Volume extremely light too. I’m calling it… have a great weekend all. I’m outta here until Tuesday.
Tom DeMark is thinking there may be some kind of announcement out of the Chinese Politburo that is going to have a big impact on their markets and that they are going to do it over the holiday weekend. He expects another 10% slide in the Chinese markets, and that we will see a significant correction in sympathy in US markets over the next two weeks. He however, does not expect new lows below the February print.
If I recall, he was previously calling for a move below ~1750 and that didn’t occur on the Jan Feb move lower? Anyone remember if I have the 1750 target right or was it lower?
I think they were originally looking for final support around the break-out level from the triple top in 2014, around 1550.00
I think you’re right…. Have to search for it over the weekend. I think he was on a video report… Bloomberg maybe?
We should be seeing a breakout from this triangle formation quite soon I think. The directional break is going to be a head-fake I suspect….
Pre-holidays is when the big banksters leave the kids in charge with orders to just keep it between the brackets….and then they head for the Hamptons. “You got it, see ya Tuesday”. So don’t burn up a lot of order tickets chasing this thing around.
LOL
IMO it provides us a leisurely entry for a short position. So while they’re being all leisurely at the Hamptons, I’ll be leisurely here in NZ and get ready 🙂
I suspect any downward break from this triangle formation will be quickly reversed for the final wave up; it would be great if we see minuette five up get underway later today…
Today is the last day to trade…. Friday before Memorial day is usually dead/very, very low volume. It may be an up day…. but not always.
So if the market is going to move big… it’s today or nothing till next week. Tuesday is probably a very low volume day historically as well if I remember correctly.
I agree.
UVXY is also fairly reliable in signaling the start of impulsive third waves down. In nine out of ten cases you will get a gap open. The fact that we did not get it this morning strongly suggests to me that we are not quite there yet. Of course we could get an intra-day gap up but those are quite rare…
you notice on the E-minis volume was down yesterday from the day before that? not up
There is a way to help one count waves. Take the pattern your looking at, here is from the May 19th low, and find the time frame on your platform which stretches it out to more than 80% of the total screen. closer to 100% the better but still seeing the entire move in your screenshot. Then apply the price ocs, MADC would work too, and look for the highest line bar (in red on chart here). The histogram got up to 2.063 on May 20th….but it got up to 2.122 on May 24th. So May 24th up should be the wave 3 up in this pattern (or at least the 3 of the 3). It is getting confirmed in fact by looking at the much smaller histogram rise on May 25th. Just another tool one can use. Of course an extended fifth wave can develop too, but then you’ll see even more divergence. And noting this pattern fits a 10min. time chart right now, will have to switch to a 15min. later.
I think we are in minuette four…one final wave up. Looks like we will have to wait for after the holiday week-end after all…
Lara’s alternate hourly bear count calls for a 4th wave to about 2083 or so followed by a new high for Minor 2. The invalidation point remains 2058 which is the high of minuette 1 of minute c of Minor 2. Until then, we can only hope it is Minor 3 underway.
On the 1 minute chart, it looks like a 4th wave triangle may be developing with one final push higher to come. It could also be a series 1-2’s. Which way it breaks out will be a clue.
5 min up and the next 5 min a strong reversal down to close the gap. Now we need to see a long red candle down for the following 5 min to 20 min.
would love to see 2099 then a reversal bar down today. Went long this morning E-minis at 2088.50 to protect my heavy short ETF’s. Rally up then reverse, or drop from here will get stopped out and then short futures too on the downside.
That would make for a nice bearish engulfing candlestick!
I’d love to see Minor 3 started before I go away for the week, next week.
I’m having commitment issues…lol.
Can’t tell which way Mr M wants to go…so here i sit, waiting for a clue.
As the day progresses, i believe volume will only shrink going into the holiday weekend.
why not, first
Nicely done 🙂