
Downwards movement was expected from the main Elliott wave count again yesterday, which is exactly what happened.
Upwards movement during the session was also expected for a second wave bounce.
Summary: The main wave count expects to see downwards movement accelerate in the next week or so as a third wave unfolds. The first short term target is at 1,988. The long term target remains at 1,423. The alternate today puts risk to short positions at 2,071.88. Bounces present an opportunity to join the trend.
To see last published monthly charts click here.
To see how each of the bull and bear wave counts fit within a larger time frame see the Grand Supercycle Analysis.
To see detail of the bull market from 2009 to the all time high on weekly charts, click here.
New updates to this analysis are in bold.
BEAR ELLIOTT WAVE COUNT
WEEKLY CHART
Click chart to enlarge.
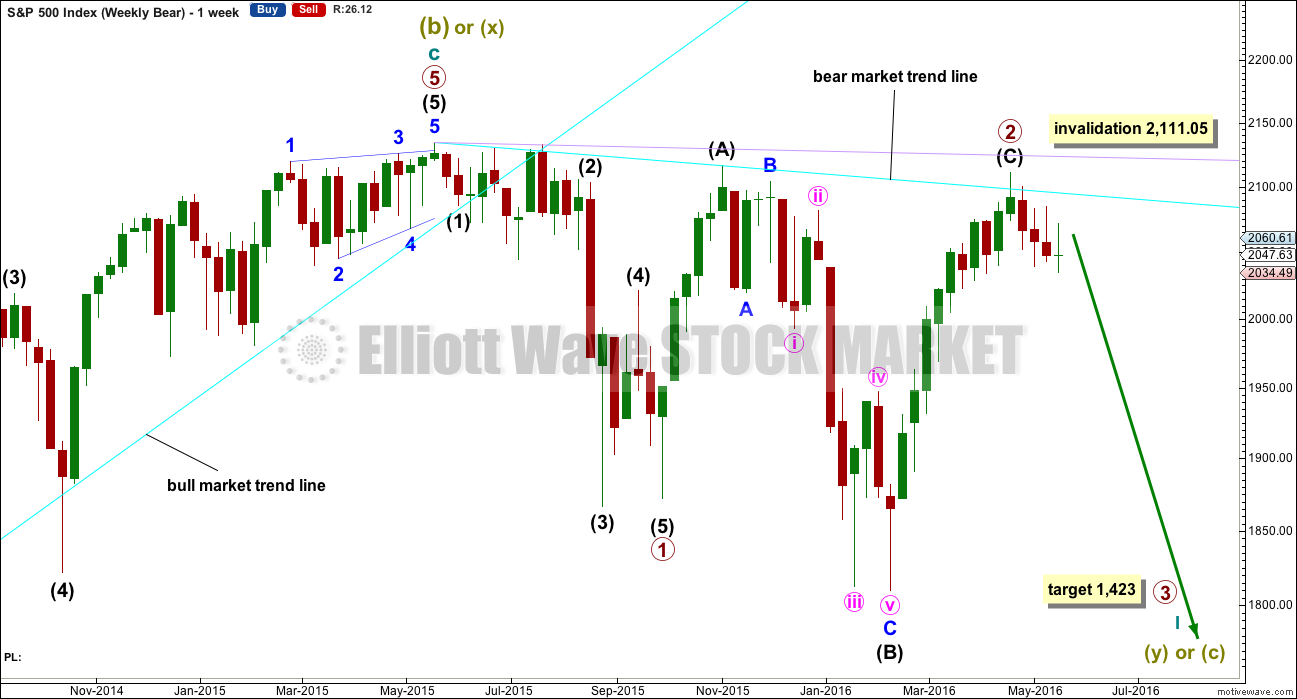
This bear wave count fits better than the bull with the even larger picture, super cycle analysis found here. It is also well supported by regular technical analysis at the monthly chart level.
Importantly, there is no lower invalidation point for this wave count. That means there is no lower limit to this bear market.
Primary wave 1 is complete and lasted 19 weeks. Primary wave 2 is over lasting 28 weeks.
An expectation for duration of primary wave 3 would be for it to be longer in duration than primary wave 1. If it lasts about 31 weeks, it would be 1.618 the duration of primary wave 1. It may last about a Fibonacci 34 weeks in total, depending on how time consuming the corrections within it are.
Primary wave 2 may be a rare running flat. Just prior to a strong primary degree third wave is the kind of situation in which a running flat may appear. Intermediate wave (B) fits perfectly as a zigzag and is a 1.21 length of intermediate wave (A). This is within the normal range for a B wave of a flat of 1 to 1.38.
Within primary wave 3, no second wave correction may move beyond its start above 2,111.05.
DAILY CHART
Click chart to enlarge.
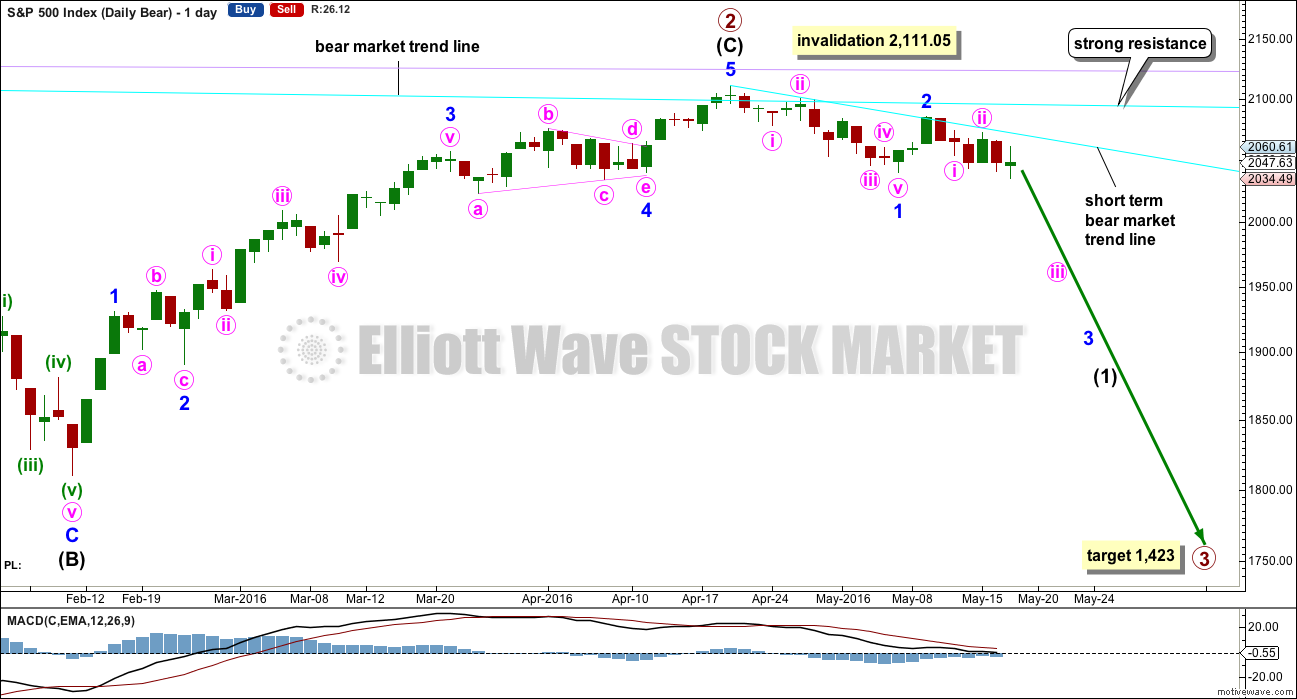
If intermediate wave (C) is over, then the truncation is small at only 5.43 points. This may occur right before a very strong third wave pulls the end of intermediate wave (C) downwards.
The next wave down for this wave count would be a strong third wave at primary wave degree. At 1,423 primary wave 3 would reach 2.618 the length of primary wave 1. This is the appropriate ratio for this target because primary wave 2 is very deep at 0.91 of primary wave 1. If this target is wrong, it may be too high. The next Fibonacci ratio in the sequence would be 4.236 which calculates to a target at 998. That looks too low, unless the degree of labelling is moved up one and this may be a third wave down at cycle degree just beginning. I know that possibility right now may seem absurd, but it is possible.
Alternatively, primary wave 3 may not exhibit a Fibonacci ratio to primary wave 1. When intermediate waves (1) through to (4) within the impulse of primary wave 3 are complete, then the target may be calculated at a second wave degree. At that stage, it may change or widen to a small zone.
At this stage, it looks slightly more likely that minor wave 3 is underway considering On Balance Volume at the weekly chart level, resistance at the short term cyan trend line, and structure at the hourly chart level.
At this stage, it looks extremely likely that minor wave 2 was over on 10th of May, lasting just two days and 0.63 the length of minor wave 1.
If it continues any further, then minor wave 2 may not move beyond the start of minor wave 1 above 2,111.05.
A short term bear market trend line is added from the high of primary wave 2 to the first small swing high of minute wave ii in cyan. This trend line is about where price is finding resistance. It is copied over to the hourly chart and the daily technical analysis chart.
MAIN HOURLY CHART
Click chart to enlarge.
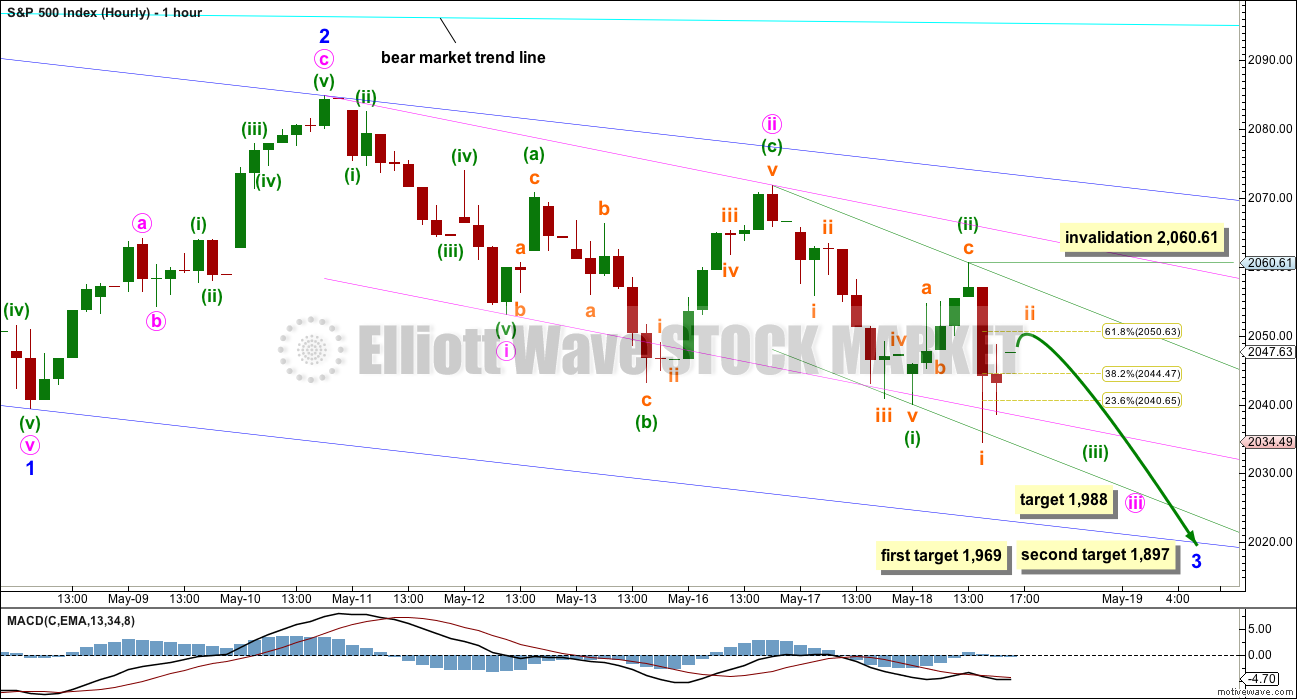
Within minor wave 3 downwards, there are now three overlapping first and second waves. This indicates a winding up of potential energy, which may be released in explosive downwards movement as the middle of the third wave down unfolds.
This whole structure is still within intermediate wave (1) of primary wave 3 downwards.
So far within minor wave 3 price has not managed to break below support of any of the three base channels drawn here.
Draw a base channel about each first and second wave. Draw the first trend line of a base channel from the start of the first wave to the end of the second wave, then place a parallel copy on the end of the first wave. The following third wave should have the power to break below support of these base channels. Along the way down, upwards corrections should find resistance at the upper edge of each base channel.
Minuette wave (ii) is very likely complete as a deep 0.64 zigzag. Now that minuette wave (ii) is complete any further corrections should find resistance at the upper edge of the green base channel drawn about minuette waves (i) and (ii).
As the lower edge of each base channel is breached, then it should provide resistance for any throwbacks.
Along the way down, corrections present an opportunity to join the trend at a good price. If price comes up again to touch the upper edge of the green base channel, then it should stop there. That should present a good opportunity to enter short with a low risk high reward ratio.
At 1,988 minute wave iii would reach 2.618 the length of minute wave i.
The targets for minor wave 3 remain the same. At 1,969 minor wave 3 would reach 1.618 the length of minor wave 1. If price gets to this first target and the structure is incomplete, or if price keeps falling through this first target, then the second target will be used. At 1,897 minor wave 3 would reach 2.618 the length of minor wave 1.
The small correction for subminuette wave ii may move a little higher tomorrow. It may end about the 0.618 Fibonacci ratio of subminuette wave i at 2,051. Subminuette wave ii may not move beyond the start of subminuette wave i above 2,060.61.
If price breaks above the upper edge of the green channel, then use the alternate hourly wave count below.
ALTERNATE HOURLY CHART
Click chart to enlarge.
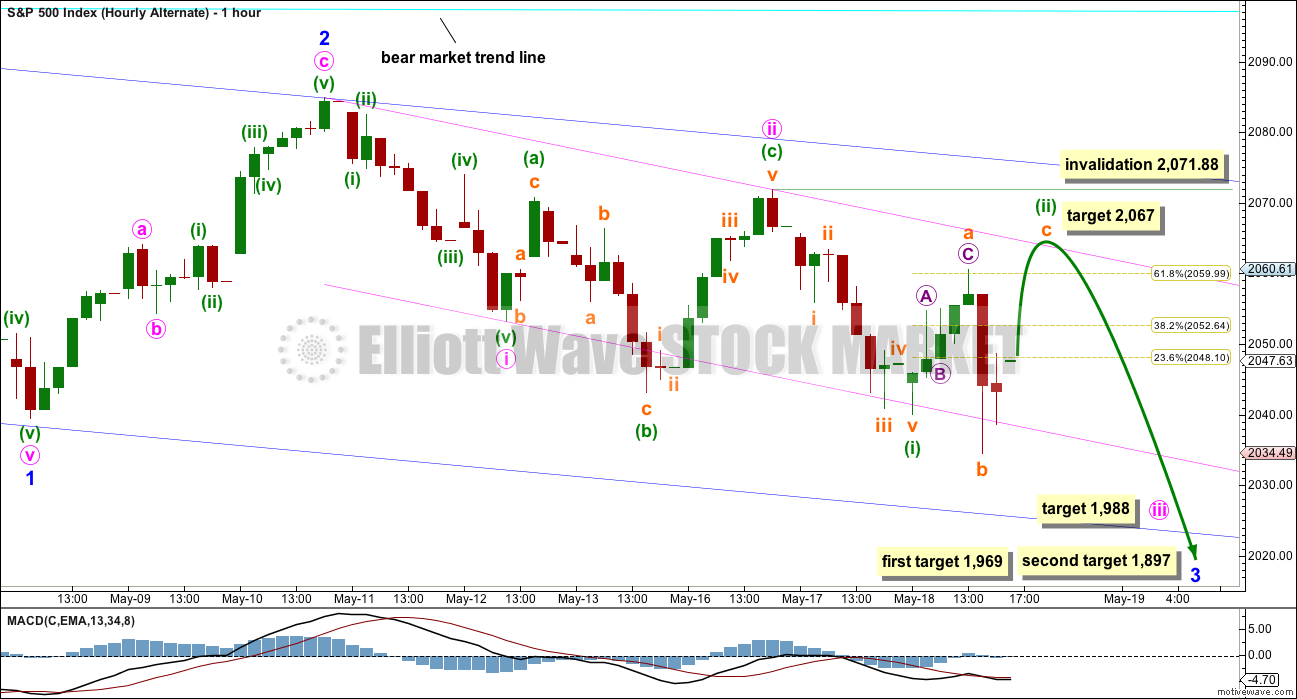
This alternate is new. It is not the same as yesterday’s hourly alternate wave count. That idea has now been discarded because the subdivisions no longer fit.
What if minuette wave (ii) is not over? Downwards movement labelled subminuette wave b will fit as either a three or five on the one and five minute charts, but it is not possible to determine with certainty if this wave is a zizgzag (with a triangle for the B wave within it) or an impulse (with the fourth wave a triangle), so both possibilities must be considered.
If minuette wave (ii) is incomplete, it may be an expanded flat, repeating the structure of minute wave ii one degree higher.
Within the expanded flat, subminuette wave a is a three. Subminuette wave b may also be a three wave structure and is a 1.32 length of subminuette wave a, within the normal range of 1 to 1.38. At 2,067 subminuette wave c would reach 1.618 the length of subminuette wave a.
This target would see a small overshoot of the upper edge of the pink base channel. This target may be a little too high; the upper pink line may provide strong resistance.
The short and mid term targets are exactly the same for this alternate.
Minuette wave (ii) may not move beyond the start of minuette wave (i) above 2,071.88.
BULL ELLIOTT WAVE COUNT
WEEKLY CHART
Click chart to enlarge.
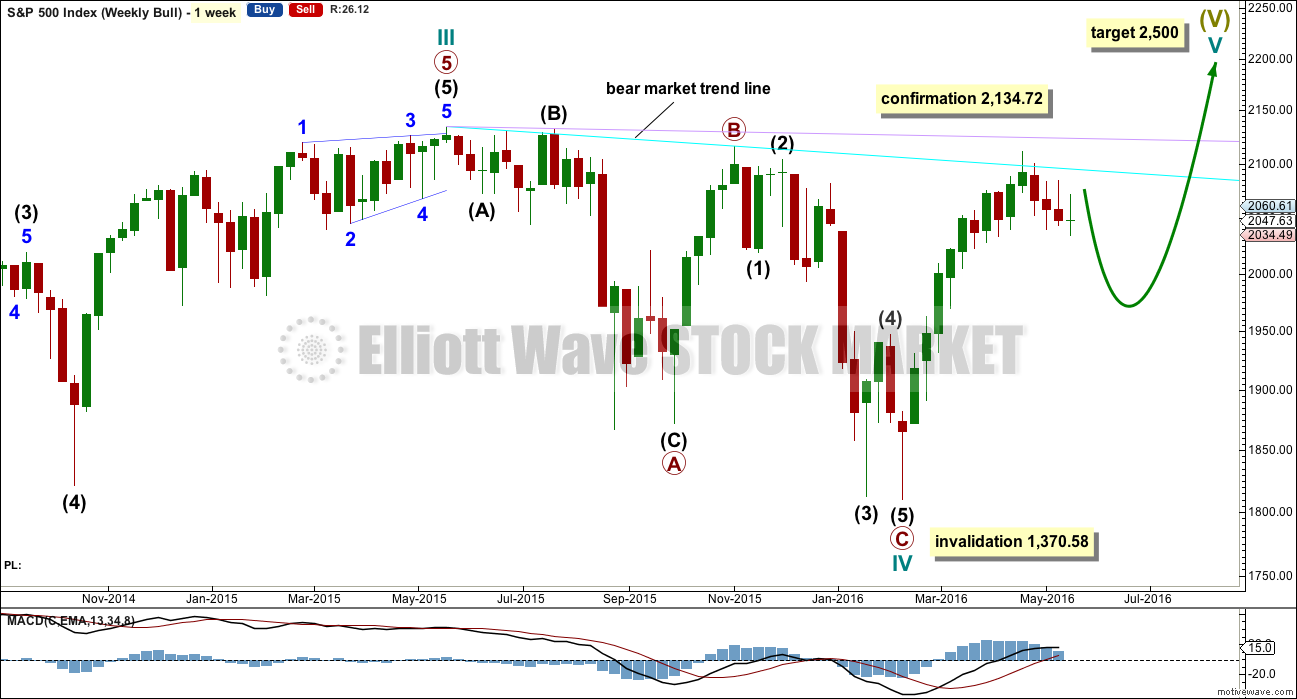
Cycle wave IV is seen as a complete flat correction. Within cycle wave IV, primary wave C is still seen as a five wave impulse.
Intermediate wave (3) has a strong three wave look to it on the weekly and daily charts. For the S&P, a large wave like this one at intermediate degree should look like an impulse at higher time frames. The three wave look substantially reduces the probability of this wave count. Subdivisions have been checked on the hourly chart, which will fit.
Cycle wave II was a shallow 0.41 zigzag lasting three months. Cycle wave IV may be a complete shallow 0.19 regular flat correction, exhibiting some alternation with cycle wave II.
At 2,500 cycle wave V would reach equality in length with cycle wave I.
Price remains below the final bear market trend line. This line is drawn from the all time high at 2,134.72 to the swing high labelled primary wave B at 2,116.48 on November 2015. This line is drawn using the approach outlined by Magee in the classic “Technical Analysis of Stock Trends”. To use it correctly we should assume that a bear market remains intact until this line is breached by a close of 3% or more of market value. In practice, that price point would be a new all time high which would invalidate any bear wave count.
This wave count requires price confirmation with a new all time high above 2,134.72.
While price has not made a new high, while it remains below the final bear market trend line and while technical indicators point to weakness in upwards movement, this very bullish wave count comes with a strong caveat. I still do not have confidence in it.
The invalidation point will remain on the weekly chart at 1,370.58. Cycle wave IV may not move into cycle wave I price territory.
This invalidation point allows for the possibility that cycle wave IV may not be complete and may continue sideways for another one to two years as a double flat or double combination. Because both double flats and double combinations are both sideways movements, a new low substantially below the end of primary wave C at 1,810.10 should see this wave count discarded on the basis of a very low probability long before price makes a new low below 1,370.58.
DAILY CHART
Click chart to enlarge.
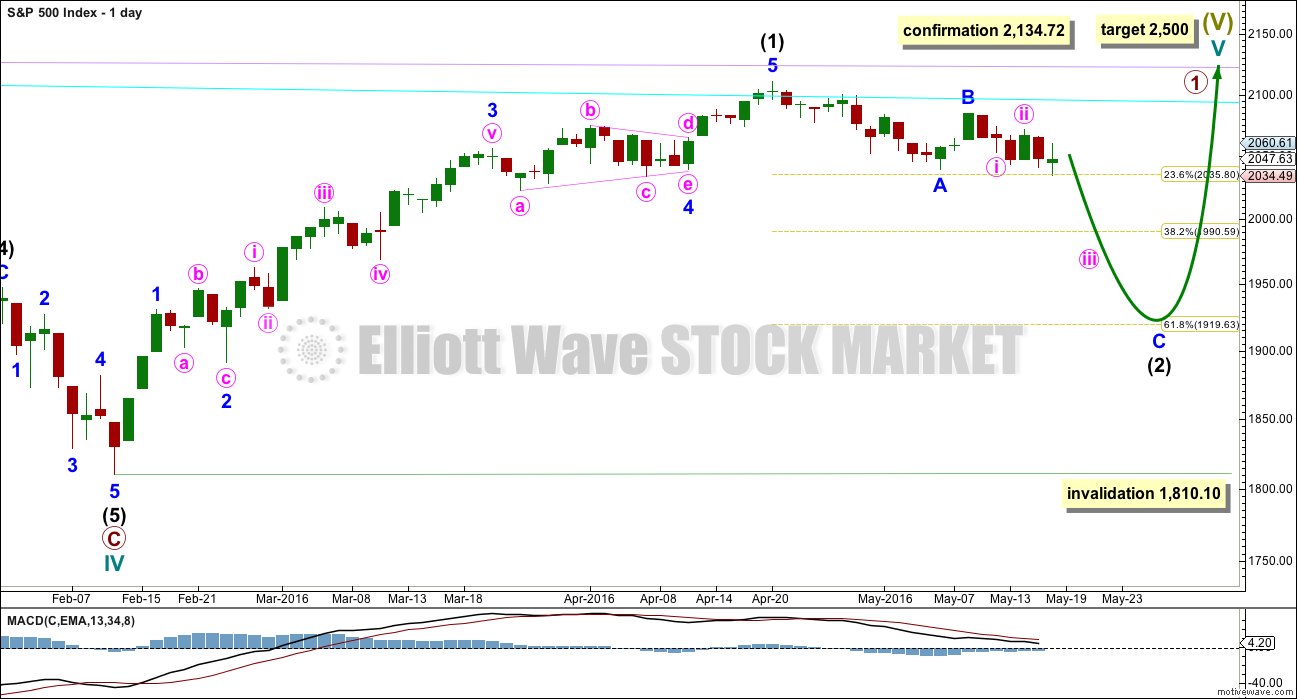
If the bull market has resumed, it must begin with a five wave structure upwards at the daily and weekly chart level. That may today be complete. The possible trend change at intermediate degree still requires confirmation in the same way as the alternate hourly bear wave count outlines before any confidence may be had in it.
If intermediate wave (2) begins here, then a reasonable target for it to end would be the 0.618 Fibonacci ratio of intermediate wave (1) about 1,920. Intermediate wave (2) must subdivide as a corrective structure. It may not move beyond the start of intermediate wave (1) below 1,810.10.
In the long term, this wave count absolutely requires a new high above 2,134.72 for confirmation. This would be the only wave count in the unlikely event of a new all time high. All bear wave counts would be fully and finally invalidated.
TECHNICAL ANALYSIS
WEEKLY CHART
Click chart to enlarge. Chart courtesy of StockCharts.com.
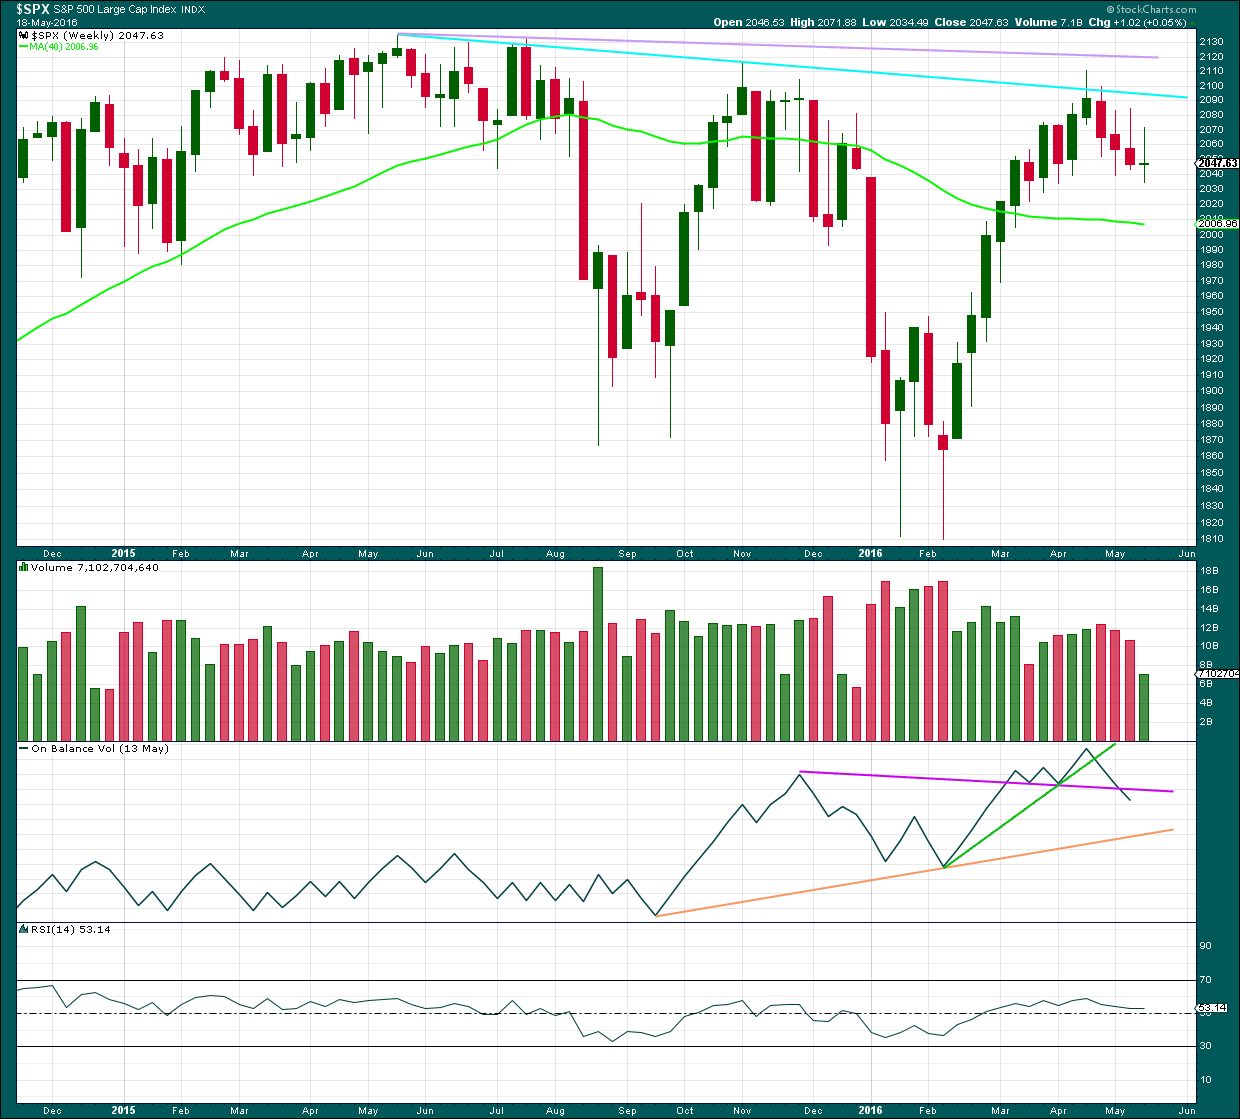
There is a bearish engulfing candlestick pattern at the last high. This has occurred at the round number of 2,100 which increases the significance. Volume on the second candlestick is higher than volume on the first candlestick, which further increases the significance. That it is at the weekly chart level is further significance.
Engulfing patterns are the strongest reversal patterns.
Now this pattern is followed by another red weekly candlestick. The reversal implications of the pattern are confirmed.
This is a very strong bearish signal. It adds significant weight to the expectation of a trend change. It does not tell us how low the following movement must go, only that it is likely to be at least of a few weeks duration.
Last week’s candlestick has a long upper shadow and is again red which is bearish.
There is another bearish signal from On Balance Volume this week with a break below the purple line. This does not indicate which hourly wave count is correct, but it does add weight to a downwards trend.
DAILY CHART

Click chart to enlarge. Chart courtesy of StockCharts.com.
Volume data on StockCharts is different to that given from NYSE, the home of this index. Comments on volume will be based on NYSE volume data when it differs from StockCharts.
Price is still finding reasonably strong support at the neckline of the head and shoulders pattern, and the horizontal trend line about 2,040. A close below these lines would be some confirmation of the head and shoulders pattern, particularly if it comes on a downwards day with increased volume. That has not happened yet. The pattern and its downwards implications for price is not yet confirmed.
Price overall moved higher today to complete a green candlestick with a small real body. The rise in price was supported by volume, and it was upwards movement during the session which had strongest volume. This has a slight bullish implication and may favour the alternate hourly wave count over the main hourly wave count.
However, that slight bullishness is mitigated by the candlestick itself. The bears began the session with a push lower but the bulls rallied for the majority of the session, and the overall rise in price was supported by bullish volume through the middle of the session. But the bears dominated the remainder of the session, pushing price back down to close only slightly above the open. The bulls were unable to hold the gains from the first part of the session. The small body of today’s candlestick with long upper and lower wicks represents a balance between bulls and bears with the bulls slightly winning.
ADX today is increasing indicating a downwards trend is now in place. ATR agrees: there is a trend and it is down. This adds confidence to the main wave count at the daily chart level.
On Balance Volume is finding strong support at the purple trend line. It has not managed yet to break below this line. Each time the line is tested it is strengthened. To the upside, OBV should find resistance at the yellow line. If OBV turns back down and breaks below the purple line, that would be a very strong bearish signal. A break below the pink or green lines would also be a strong bearish signal.
RSI is still close to neutral. There is room for price to fall.
Stochastics shows in divergence with price at this stage.
Now that a trend is clearer price may be expected to find resistance about the 13 day moving average. This may serve to hold the rise in price at today’s high.
When price manages to break through support at the neckline and horizontal trend line, then it may accelerate to the downside. If price turns up after breaking through for a throwback, it would offer a gift, a perfect entry to join the downwards trend.
VOLATILITY – INVERTED VIX DAILY CHART
Click chart to enlarge. Chart courtesy of StockCharts.com.
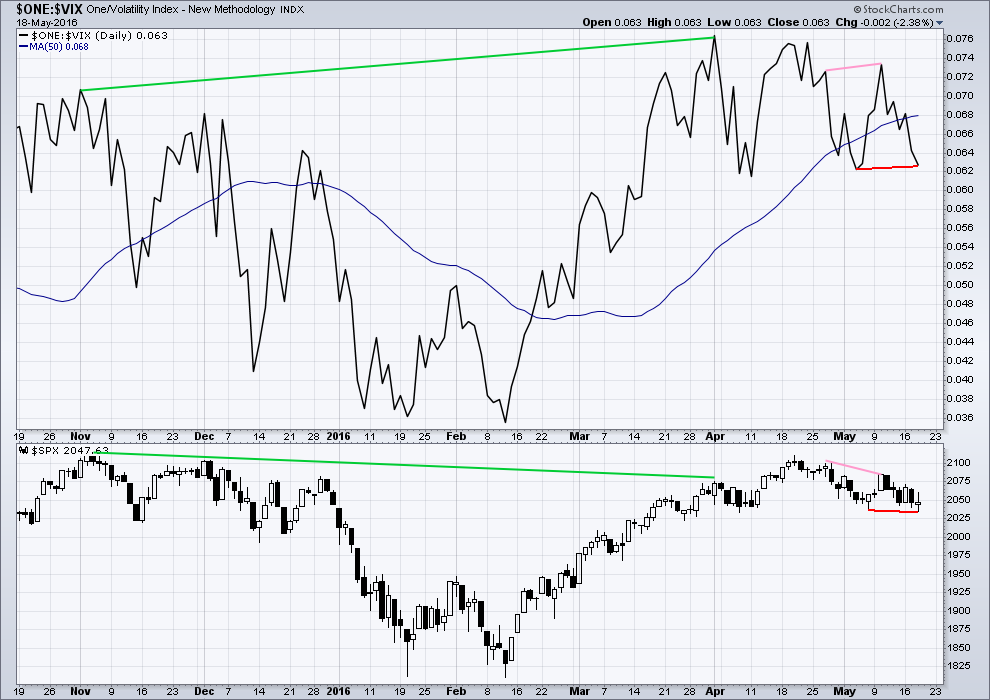
Volatility declines as inverted VIX climbs. This is normal for an upwards trend.
What is not normal here is the divergence over a reasonable time period between price and inverted VIX (green lines). The decline in volatility did not translate to a corresponding increase in price. Price is weak. This divergence is bearish.
There is very slight divergence today between price and inverted VIX, between the last swing low on 6th May and the new low today (red lines). Price has made a slight new low but inverted VIX failed to make a slight new low. While price made a slight new low, this was not accompanied by a corresponding increase in volatility. This divergence is bullish, but it is weak because it is very slight. This offers slight support for the alternate hourly wave count over the main hourly wave count.
BREADTH – ADVANCE DECLINE LINE
Click chart to enlarge. Chart courtesy of StockCharts.com.
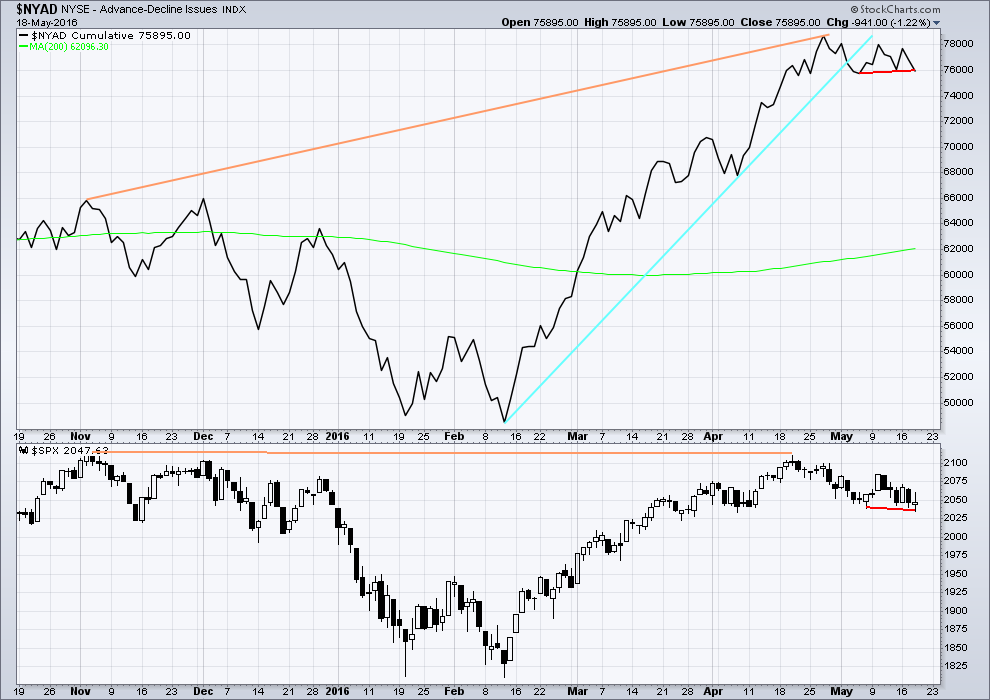
With the AD line increasing, this indicates the number of advancing stocks exceeds the number of declining stocks. This indicates that there is breadth to prior upwards movement.
From November 2015 to 20th April, the AD line made new highs while price far failed to make a corresponding new high. This indicates weakness in price; the increase in market breadth is unable to be translated to increase in price (orange lines).
The 200 day moving average for the AD line is now increasing. This alone is not enough to indicate a new bull market. During November 2015 the 200 day MA for the AD line turned upwards and yet price still made subsequent new lows.
The AD line is now declining and has breached a support line (cyan). There is breadth to downwards movement; more stocks are declining than advancing which supports the fall in price.
There is slight divergence today between the slight new low today and the AD line. Price made a slight new low below the prior swing low of 6th May, yet the AD line failed to make a corresponding new low. The downwards movement in price today was not accompanied by a corresponding new low in breadth. This downwards movement is slightly weak. This slightly supports the alternate hourly wave count over the main hourly wave count. The support is slight because the divergence is so small.
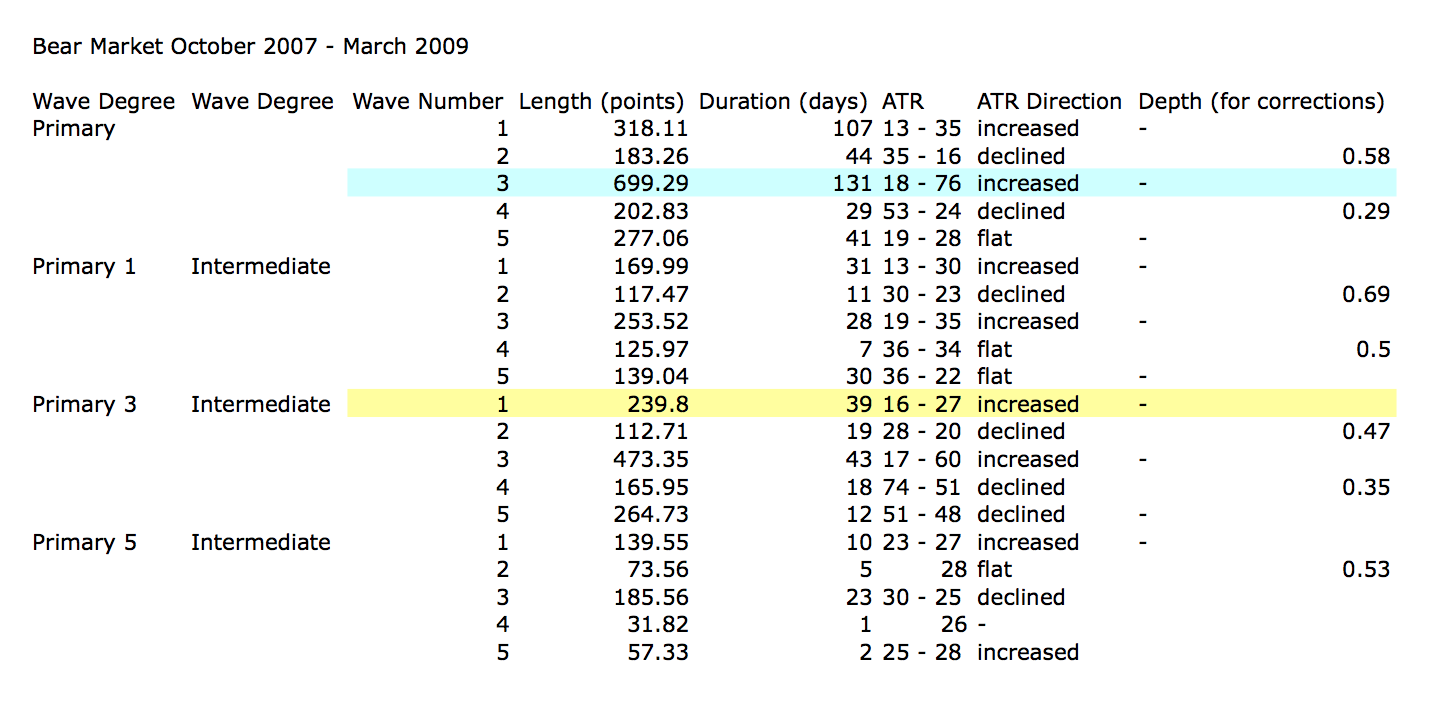
ANALYSIS OF LAST MAJOR BEAR MARKET OCTOBER 2007 – MARCH 2009
Click to enlarge.
In looking back to see how a primary degree third wave should behave in a bear market, the last example may be useful.
Currently, the start of primary wave 3 now may be underway for this current bear market. Currently, ATR sits about 19. With the last primary degree third wave (blue highlighted) having an ATR range of about 18 to 76, so far this one looks about right.
The current wave count sees price in an intermediate degree first wave within a primary degree third wave. The equivalent in the last bear market (yellow highlighted) lasted 39 days and had a range of ATR from 16 – 27.
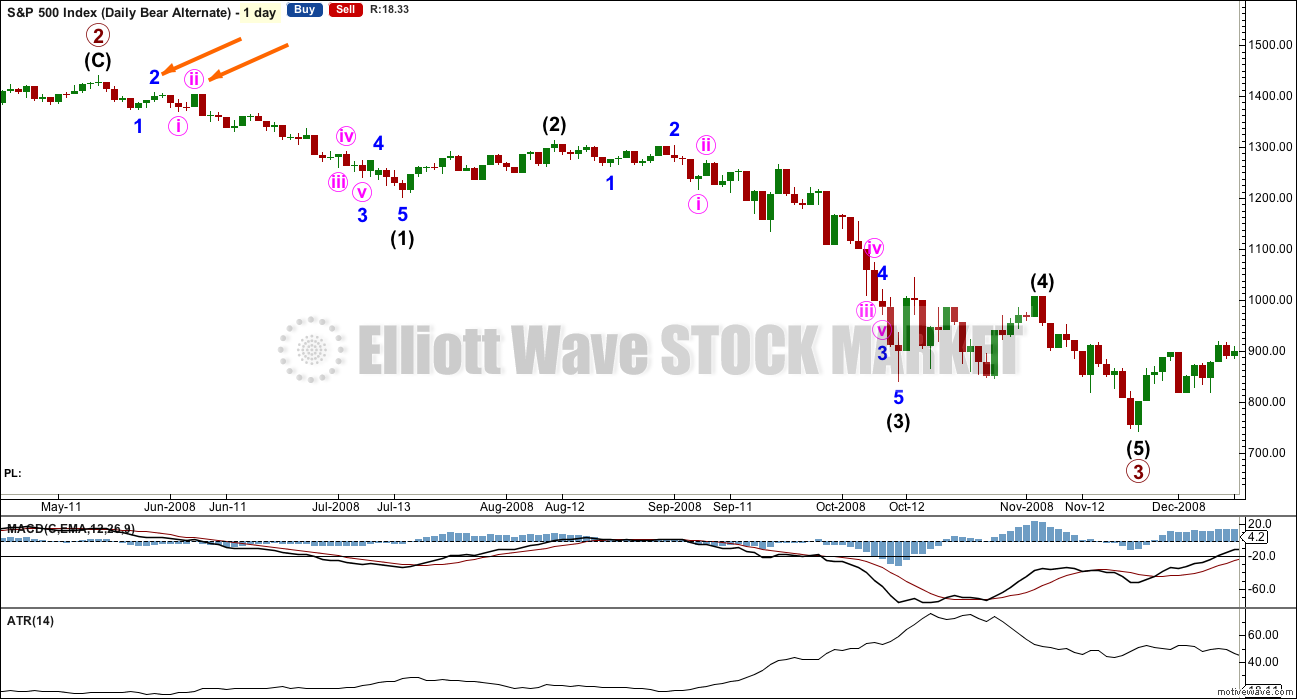
Click chart to enlarge.
This chart is shown on an arithmetic scale, so that the differences in daily range travelled from the start of primary wave 3 to the end of primary wave 3 is clear.
Primary wave 3 within the last bear market from October 2007 to March 2009 is shown here. It started out somewhat slowly with relatively small range days. I am confident of the labelling at primary degree, reasonably confident of labelling at intermediate degree, and uncertain of labelling at minor degree. It is the larger degrees with which we are concerned at this stage.
During intermediate wave (1), there were a fair few small daily doji and ATR only increased slowly. The strongest movements within primary wave 3 came at its end.
It appears that the S&P behaves somewhat like a commodity during its bear markets. That tendency should be considered again here.
Looking more closely at early corrections within primary wave 3 to see where we are, please note the two identified with orange arrows. Minor wave 1 lasted a Fibonacci 5 days and minor wave 2 was quick at only 2 days and shallow at only 0.495 the depth of minor wave 1.
Minute wave ii, the next second wave correction, was deeper. Minute wave i lasted 3 days and minute wave ii was quick at 2 days but deep at 0.94 the depth of minute wave i.
What this illustrates clearly is there is no certainty about second wave corrections. They do not have to be brief and shallow at this early stage; they can be deep.
This chart will be republished daily for reference. The current primary degree third wave which this analysis expects does not have to unfold in the same way, but it is likely that there may be similarities.
DOW THEORY
I am choosing to use the S&P500, Dow Industrials, Dow Transportation, Nasdaq and the Russell 2000 index. Major swing lows are noted below. So far the Industrials, Transportation and Russell 2000 have made new major swing lows. None of these indices have made new highs.
I am aware that this approach is extremely conservative. Original Dow Theory has already confirmed a major trend change as both the industrials and transportation indexes have made new major lows.
At this stage, if the S&P500 and Nasdaq also make new major swing lows, then my modified Dow Theory would confirm a major new bear market. At that stage, my only wave count would be the bear wave count.
The lows below are from October 2014. These lows were the last secondary correction within the primary trend which was the bull market from 2009.
These lows must be breached by a daily close below each point.
S&P500: 1,821.61
Nasdaq: 4,117.84
DJIA: 15,855.12 – close below on 25th August 2015.
DJT: 7,700.49 – close below on 24th August 2015.
Russell 2000: 1,343.51 – close below on 25th August 2015.
To the upside, DJIA has made a new major swing high above its prior major high of 3rd November, 2015, at 17,977.85. But DJT has so far failed to confirm because it has not yet made a new major swing high above its prior swing high of 20th November, 2015, at 8,358.20. Dow Theory has therefore not yet confirmed a new bull market. Neither the S&P500, Russell 2000 nor Nasdaq have made new major swing highs.
This analysis is published @ 10:42 p.m. EST.
Bulls expended lots of capital today and managed to buy back just about half the decline. Lara’s update would even have allowed for a small green print today as 2047.64 would have done it without violating the current count, and frankly been a lot more intimidating to the bears. Not only did they not get a positive close, it looks as if the market actually turned prior to the close.
yup, futures and nikky are looking frisky tonite,, perhaps those banksters are going to turn our count over to the alt tomorrow, they are so devious on opt. ex
Until we close below 2040 with conviction we are going higher. Much higher. Looking at a 60 minute chart the 2040 level has been defended (on a closing basis) multiple times for the past month. Call it banksters, manipulation, whatever – price pays and I don’t see us going much lower anytime soon. I appreciate the analysis but like we say, there is always an alternate. The Fed is gonna pump this market to no end.
The Fed is shooting blanks!
Regarding the daily hammer candle. If I recall properly back in late 2015 there was a discussion of a hammer occurring in a downtrend. Lara went back to the charts and looked for such occurrences. The conclusion was a daily hammer does not always mark a reversal especially in an early part of a downtrend. I suspect that is what we will observe this time as well, no reversal because of the hammer.
Yes, it’s a hammer now. The lower shadow is > 2X the real body.
It is 4.39 X the real body.
Yes, it doesn’t necessarily mean a reversal must happen here.
Furthermore a reversal means an end to the downwards trend by either sideways movement (entering a consolidation) or upwards movement. It does not necessarily have to be a change from down to up.
Hammers are also considered as having a low/moderate reliability as a reversal signal, I’m keeping my shorts on.
Looking at a weekly chart for SPX, I would say we had a Three Black Crows pattern which is far more bearish then a daily hammer
Pattern: reversal
Reliability: high
Identification
Three long black days occur with each successive open being within the body of the previous day and each successive close being below the previous day’s and near the day’s low.
The Psychology
In an uptrend or within a bounce of a downtrend, the three long black candles speak for themselves. If volume accompanies the move, the reliability of the pattern increases significantly.
I agree with your point that a reversal pattern at the weekly chart level is more bearish than a reversal pattern at the daily chart level.
The Three Black Crows aren’t supported by volume, and they’re not closing at or near their lows (with the exception of the third). So that slightly weakens the implications of the pattern.
I’d just like to clarify one point though in case any members come to the conclusion that Three Black Crows is a stronger signal than a hammer. It’s not. It’s just in this case the time frame; weekly vs daily which makes it a stronger signal.
From Nison’s book page 81: Most of the reversal patterns in Chapters 4 and 5 are comparatively strong reversal signals…. This chapter examines more reversal indicators that are usually, but not always, less powerful reversal signals”.
Hammers are covered early in the book, chapter 4. Three Black Crows are covered in chapter 6.
My conclusion from that is a hammer is a stronger reversal pattern than Three Black Crows. Most likely. Not always, it depends on the circumstances.
Oh yeah, and thanks John for pointing out the Three Black Crows. I missed that! Will add comment on that today in TA section 🙂
Cheers! and looking forward to today’s update, learning lots here as a newbie
I remember this quite well. It was back when SPX was at the 1800 level. We rallied straight up nearly 300 points. The poster was somebody that posted repeatedly over and over about how bullish the market was. Turns out he was right.
Lots of interesting news today relating to social mood. I am sure all have already heard of the tragic crash of the Egypt Air flight 804. Initial reports are that is most likely an act of sabotage.
Also, a border patrol agent took his own life and left a suicide note outlining a coming societal collapse in the US and the draconian plans the Federal government has for dealing with the aftermath of an economic meltdown, caused, interestingly enough, by a major bank failure as a result of Puerto Rico’s default. Interesting times indeed. Stuff of which primary waves are made.
Technician at Oppen. saying he sees inverse H & S & not a topping LT pattern…
also that the Feb low was a Bear Trap! See a set-up for a breakout higher.
Fits with a Bear P3… I hope!
More Wall STreet selling for new highs???
Good morning everybody 🙂
Another lower low and lower high.. so far. That is good to see.
Yet another first wave down, this one will be micro degree, and now another second wave up should be completing here, it is slightly deeper than 0.618 of its first wave.
The gap down at todays open may provide resistance if its a breakaway gap.
Invalidation may be moved down short term to 2,048.65 today. I’m moving my stop down. Now I have profit locked in I’m looking to add to my short position.
An important trading point: price is still just within minor 1 price territory. Any short positions entered here can ride all the way down to the end of intermediate (1) happily (assuming my wave count is right) as when minor 4 arrives it can’t move back into minor 1 territory.
Thanks for the quick update Lara. Looks good to me.
We did not think the banksters would not try to rattle bear cages now did we? 🙂
But seriously folk, you gotta keep your emotions in check when trading the market. I know that’s easier said than done but the analysis we have is second to none, banksters notwithstanding.
Plan your trade. Trade your plan. Have a great evening all!
Every time we end up with a series of overlapping first and second waves, I get a bit nervous. What if I’m wrong? What else could be happening?
But there’s an antidote to this possible nervousness /confusion.
Looking back at the last primary wave 3 down (within the last bear market) I can see plenty of small trading days; a fair few doji, more corrections that lasted about three days, and ATR during most of intermediate (1) was very close to where it is now, about 20.
It was at the middle that the impulse really accelerated, and it ended explosively.
The S&P in the last bear market really did behave like a commodity.
Luckily I have been analysing Gold daily for some years now (coming up to about 3 years now?) and about weekly for a fair time longer than that. I’m used to how that commodity market behaves, so I have an idea of what kind of behaviour to expect here.
When I remind myself of that, I’m not worried about this relatively small range day. Not yet anyway.
I’m going to do a short video today of that last P3 down, a few things I really want members to get in terms of how that wave behaved.
Awesome!!Appreciate it Lara!!
You’re welcome Alicia.
You have the same name as my only sister 🙂 I like it
Haha thanks, I like it too, it’s international– easy to pronunciate in different languages 🙂
Thanks Lara, your knowledge and guidance is much appreciated as I learn how to become a better trader.
You’re welcome too John 🙂
Today’s action not at all surprising considering options expiration tomorrow. No question more than a few short-side traders bailed on the slow, steady upward reversal. This is exactly what it was intended to do.
I got shaken out on the the prior minuette two second wave yesterday even though I clearly saw the bearish rising wedge. It also doesn’t hurt to err on the side of capital preservation if staying in a trade makes you loose sleep. 🙂
Word 🙂
SPX Volume Higher Than Yesterday! As well as most of the other indexes.
Nothing new folk. These moves are designed to shake out weak hands.
At the moment VIX up 3.39% on the day UVXY up 1.5% on the day…what a garbage instrument. Going forward I’m going to be taking a different approach with UVXY. If it is up 8% intraday, i’m selling and buying back. The instrument is designed to go to zero and always seems to offer a pullback.
That is the way to trade it. Unless you are extremely patient, not trading options, or not paying too much in fees to exit and re-enter positions. It is a very difficult beast to trade for beginners.
when not in the futures contracts, or for straddle type trades, I trade the SPXS etf. It was up 1.17% today and it has good volumes for easy in/out.
UVXY trades off VIX futures. If you use Thinkorswim the symbol is /VX N6 is for the current contract I believe
how frustrating
Agreed – but we have an impulse down from 2048 and the move up from todays lows looks corrective to me (messy overlapping – nothing like the impulse down).
Therefore the odds are high that this move up will be fully retraced imo. Invalidation to that view is just above 2048
Unfortunately Mr M is not in the business of making anyones life easy.
We have a hammer candlestick for today on the daily chart at this moment. We need to see the bears take control before the close and push it back towards the low of the day.
The lower shadow must be minimum 2X the real body for it to be a hammer
Current action cannot be a 4th wave so for main count it must be another 2nd wave. 61.8 fib @ 2040, 76.4 fib @ 2043. Invalidation approx 2048.63
Looks like the 2nd wave completed at ~2040 a 3-3-5 zig-zag. If correct, it implies we have started another 3rd wave down. Lets see if 2019 can be taken out.
Yeah I think so. I’m counting it as a double zig zag, but in any case it looks corrective atm. Looks like we just had small 5 down from 2039 – let’s see what any bounce looks like.
The 3rds are getting seriously coiled so I would expect fireworks before long if the main count is playing out.
If sub-min two is continuing it cannot exceed 2060.61
Is it possible that the banksters have consigned EW analysis to history through their market manipulation?
Nope 🙂
(imho 😉 )
No.
It still fits EW structure perfectly.
It’s just not accelerating when you want it to.
I think not. Artificial manipulation may somewhat influence small waves but the larger the wave, the more force and inertia, so wave will ultimately have it’s way.
Think Hurricane Katrina that flooded New Orleans some years ago, human intervention with dikes, levees, pumps could hold and divert minor waves but ultimately large wave force prevailed and rolled over New Orleans.
Banksters and computer algorithms may impede or slow minor market waves, but they can not control major market force.
Banksters use every know tool to “see” market waves (late JP Morgan allegedly used market astrologers and numerologists) then manipulate public sentiment short-term which buys banksters time to position and profit from inevitable large wave .
After all this price action, I bet we end up exactly flat for the day. Again.
c of small w4 complete possibly. Came up and kissed good-bye the channel we broke down through this am.
looks corrective to me off today’s low’s.
Chart – The alternate count is still a real threat until we go under 2019 imho (See ‘ALT’ labels). The downwards action (or lack thereof) is bugging me.
Are the Banksters planning an expanded flat Wave C ramp job tomorrow?? (ALT (c)(ii) on chart). We should get one more lower low anyway.
We are below the base channel which is a positive – perhaps price is just coming back up for a retest??
We might still just be getting a series of nested 1,2’s – my line in the sand is 2048.62. If price goes above there then the move down from 2060 will look like a three wave structure (probably sub min (b) of an expanded flat minuette 2).
Still 100% short atm 🙂
Exactly.
That’s how I see it too.
Couple of thoughts FWIW:
Today is the first day UVXY will close above its 20-day simple moving average since February 16th! (barring a big reversal, which would be unlikely imo) That’s over 3 months ago folks! Next stop is the upper BB, and I’m thinking its going to overshoot it for a day or two, and then hug it up until minor 3 is done…
Looking at the last major bear market (an invaluable part of Lara’s analysis), the minute iii’s of minor 3’s (for intermediate 1 and 3) lasted 18 and 20 days respectively. Today is day 3 of the current minute iii, and day 7 of minor 3…
I know history doesn’t repeat itself, but that fact will play at least some role in my trading… no need to get giddy trying to trade the small waves within minute iii 🙂
UVXY selling hard at the moment
Where is Olga?
I was just going to post that question. lol
I hope she’s out celebrating her stair-step buys on her UVXY yesterday… 🙂
🙂
Folk holding 15.00 and 16.00 UVXY calls expiring tomorrow who did not let the MM rattle them this week must be licking their chops. The MM’s are going to have take into account that these folk may opt to take delivery of their Unicorns if they have big enough accounts which means they (MMs)are going to have to go out and round up quite a few of ’em, He! He! …that ought to be hilarious… 🙂
$DJT Transports appear to be leading all indexes down so far today!
CNBC Trading crew believe strongly that we are in a trading range!
That is great news!
For P3 that is.
I can no longer endure the drivel of most of the networks…
SO what do you have on while viewing the charts?
I stream quite a bit of my news info, Bloomberg TV, Drudge Report, RT, Project Censored, Alex Jones and other alternative media in addition to reading oodles of newsletters and reports…a guy can stay remarkably busy just staying up to date without being tortured to death by those vapid talking heads… 🙂
UVXY short sellers in the 15.00-17.00 price range don’t seem to think they have anything to worry about… I was sure the failure to retake the 2040 pivot would make them a bit more nervous…. 🙂
Right now many of us are watching our short positions in the stock market, which is prudent.
But now you youngins’ learn to be wise too: begin planning what gold, oil or other stocks/ETF’s to buy into on those really big down days of the entire stock market (minus 4-7% type days). As when the overall stock market plunges pretty much all stocks drop, including gold, oil stocks/ETF’s. A cheap gold stock at $4.50 right now might take an intraday plunge to half that for example….great time to buy in then.
I have quite a shopping list for the miners…. 🙂
Which miners do you like?
Researching that too, esp. the juniors.
Orca, Patriot, Midway and especially McEwen (which has already had a big run).
I have been recommended the Gold Investment Letter, Eric Muschinski. Haven’t subscribed but he has an interesting blog which recently had an interview with the CEO of McEwen.
Like to hear some opinions about gold…
Silver Wheaton, Majestic Silver, Fortuna Silver Mines, Seabridge Gold, Franco-Nevada corporation, Royal Gold, Kaminak Gold Corpoartion, Nevsun Resources Ltd to name a few… 🙂
Long time holder of GORO as they can pay their dividends in the actual metal if you prefer…
The guy running McEwen used to run Silver Wheaton and Gold Corp among others. Fascinating guy and good interview on the Gold Investment Letter blog.
Thanks for the list!
haaa…I’ll be thrilled if I am capable of letting my runner run with out pulling the rip chord!
….1988 is still quite some distance away! 🙂
This third wave is just getting geared up I think. I get the impression that quite a few folk are still intimidated by the years of bankster meddling and ambushes. At some point the crows is going to recognize that we have a third wave unfolding and jump on the bandwagon. We should see at least a 50 point SPX plunge in the middle of this thing…
Based on the overall manipulation that has been ongoing, it will not surprise me to see 100 points drop on SPX as this down move unfolds.
That is the thing. Once the dam of illusion breaks, price will find its proper level and so so very quickly.
With all the grinding price action that has been unfolding – feels like we’re building up to a waterfall.
Maybe a flat expiration Friday followed by Black Monday?
Dave,
I suspect that is how majority are looking into the options expiration and MMs will work the markets in the opposite direction. Don’t forget there are still a lot of longs buying the market in anticipation of bounce and clueless on 3rd wave unfolding.
The real drop today is just 72 points as they scammed the traders yesterday by bringing the market from over 100 points drop.
Yeah, I agree, the market stays propped up, until it isn’t.
This market is still being promoted as a buying opportunity. Incredibly seems plenty of pros are still onboard with the notion.
It has been amazing how they’ve been protecting the final print of the tape by the EOD run up. We haven’t had anything that points to what is really coming down the road, yet.
Real fun starts if the markets go down over 300 points ..
Yea… to 1423
One caution or note, VIX is up against its upper Bolingerband and SPX down against its lower Bolinger band. This should provide some resistance. They certain do ride the BB during strong bear markets. But it is always prudent to note the end of a pattern may be nearing.
200 day ema is approximately 2013. This also often produces a bounce.
SPX 200 Day MA (simple) is at 2011.24 Today… so that will be the 1st test! TD Ameritrade Thinkorswim platform. Always accurate.
A close just below this will be a powerful catalyst to take out 2000 on either Friday or Monday!
Also Head & Shoulder neckline broken for SPX today!
Yes and Yes. I just eyeballed the 200 dma but knowing the accurate # is important. Thanks. My hope is SPX may blast right through the 200 dma and 2000 o n the same day.
Surprises to the downside. If targets are wrong they are generally too high. 1988 may fall!
For third wave down at this degree, I would expect price to stay pinned against those BB for at least a few days. When UVXY breaks above it will be time to take some profits and depending on where we are in the wave count, possibly even enter short on UVXY…
At the risk of sounding like broken record, I remain quite attentive to action around the round numbers. Price should accelerate as we approach SPX 2000 as opposed to visibly slowing. Third waves down at this degree have as their pedigree their ability to forcefully demolish prior pivot points and when that does not happen it is time for caution. This wave down needs to slice through 2000 with aplomb for me to be fully persuaded, leaving broken and bruised banksters in its wake…
Unicorn basing in 15.50 area. Next move down in SPX should see another wave of short covering and another gap up….
Vern,
Agree the force of downward move will be a strong indication on things to come. Watching and as markets will try to delay a steep drop close to the end of day as market makers don’t want a stampede happening early before they are ready to cash in on the same. 🙂
Yep. Options expiration tomorrow is a problem for them. I was tempted to get some puts expiring tomorrow but decided to pass as they are going to do their very best to delay the waterfall into next week. I curious to see what happens today.
Yeah, MMs are going to be defending their positions.
Was going to pile into short term debit spreads but expiration Fridays have been in the iron fists of the MMs.
SPX Volume is super higher than yesterday at this same time… 10:55AM…
If this continues at this rate, volume will be at least 2X’s yesterday.
SPX 200 Day MA is at 2011.24 Today… so that will be the 1st test!
That was beautiful … Average entry point short Dow Cash from 17500
Stops in place but looking forward to sitting back and riding this to the 1st target
Kept the comments coming all I know I have said it before but it is really appreciated and adds so much to Lara’s great analysis
🙂
Pullbacks more likely some longs taking profits early (too early in imo). A person would have to be absolutely nuts trying to short it here…
Vern,
You think this pullback will not hold and markets are going to bounce back.
If this is a minior three down and I think the evidence suggests that it is, pullbacks in both SPX and UVXY will be shallow…
Waves down unfolding in a series of coiling first and second waves, evidence of strong opposition to the developing trend. Things should speed up eventually…
Take a look at the length of candles since the top on the 5, 15, and 60 minute charts. All the longest candles are red. This is another indicator the trend is down and any correction will be fully retraced with further downside movement.
Unicorn shorts starting to feel the heat. Intra-day gap up evidence of initial stampede to cover. They a’int seen nothing yet….lots of short sellers between here and 17. A close above 17 and we make a quick run to 20
Volume of unicorn yesterday was over 60 million
The breakout of the rectangle formed for this most recent bottom pattern targets ~17!
C’mon w3, of w3, of w3, of w3….. come out and play today!
The banksters are desperately buying futures so we could see that flat for the second wave at the open. It would be an absolutely sweet entry point for the coming down-draft…
On April 8 SPX closed at 2047.60 and UVXY closed at 20.93. Yesterday SPX closed at 2047.63 and UVXY closed at 14.38.
There are an awful lot of folk short this animal(or a few brave individuals).
Not only are they short. They are apparently quite convinced near and midterm downside in SPX is quite limited. I suspect they will remain in relative comfort with their hineys exposed so long as the index does not take out its 200 dma.
I think we will see the first twitches, as it were, of discomfort with the initial take out of the 2000 pivot, which should come this week. They will no doubt be emboldened to “sit tight” if we get an initial bounce there for a probable minuette four. By the end of minor three down, those twitches should by then have morphed into some very serious “quivering”. 🙂
Vern,
You commentary describes where my plan went wrong. The average entry for my short positions on SPX was ~2075. My average entry price for TVIX is $3.95. In early March when SPX was at 2075 on the way to the top, TVIX was $4.75. I am fully aware of contango in these VIX derivatives. But I do not think that explains this price disconnection. What I did not plan was that the MM and short sellers would drive the price down relative to VIX and SPX like they have done. It has put me under water.
Here is my question to you, does this same disconnection in price work to the upside in a falling equity market especially when the short sellers have to cover their VIX derivative short positions? With the current Minor 3 underway, I have every confidence I will soon be in the black. But I am trying to learn how this animal, Unicorn as you call it, behaves.
Their plan to sit on their short positions does indeed work well in a bull trend and even in the early stages of a bear market. As we have seen, we got some deep re-tracements that encouraged even more short-selling driving these instruments to levels not at all commensurate with market price. If the market went on to new highs, of course they had nothing to worry about, and many of them have rolled the dice on that outcome. Traders long UVXY like myself will cheerfully wait them out…. 🙂
Remember all Triple Short ETF’s get shorted to the max by professionals as they invest for the natural erosion in price over time. Especially true when these guy’s are perma-bulls and the majority of the time it’s a very good bet.
Well thanks to all of you. Good thoughts. I am in the beginning of EW labeling these VIX derivatives. While many ETF such as SQQQ and SPXU, UPRO etc can be counted and used to confirm or invalidate SPX EW counts, the VIX derivatives are another animal all together. Since I believe anything involving price in an open market with large numbers of people involved will demonstrate EW patterns, I conclude the VIX derivatives should show similar, not identical or proportional, but similar patterns. Tendencies might be revealed.
Knowing these tendencies may provide an edge. For example, Vern has mentioned that often the 3rd wave of a pattern in UVXY exhibits the high price for the full five wave impulse / motive wave. If we can assemble a set of tendencies, we might have another tool or an edge in our trading strategies. Thanks again for your thoughts.
Most are short unicorn counting on the rapid and inevitable decay that UVXY has, as reliable as the sunrise. If the price tanks, maybe they don’t care if they’re in it for the longer term. More volatility just means faster decay. Even if it spikes through the roof, some may sit contentedly knowing it will just grind itself into dust over time.
Makes me wonder why I’m not in this trade too 🙂
Thanks David. By what you describe. I assume the draw down could be extensive. While I do not mind being underwater at times, I don’t necessarily want my short term funds tied up in something long term. With my long term accounts, I don’t want such a dramatic draw down. It could prove bad for my heart!
Also look out the 1-5 & 1-10 reverse splits!
I got in a little early with UVXY and the erosion is huge. If we spike I’ll be alright esp. with a little DCA, but man – you don’t to hold this for long.
And Joseph is right, get caught in a reverse split and game over.
PnF ATR suggests hourly downward target of either 1993.39 or 1987.64 which supports the minor wave 3 target estimate.
Jim,
2025-2026 and 2006 might provide little support looking at the chart before it hits the 1998/1988 target zone. Does that make sense?
Typically the more x and o’s the more support or resistance. This is only a 30 minute chart so I would consider it more of a pause 🙂
Thanks Jim! – much appreciated 🙂
Thanks for the update JIm. I am very interested to see how price behaves around 2000 as I think that will be an important signal for the degree of the current decline.
Interesting days ahead
hi ho
Silver!
hey Verne, how do you feel about options max pain? spy is 206 for fri. I think they(banksters) might try to peg it.
The best they can hope for is that minuette three down completes quickly and they get a deep minuette four bounce on Friday. Even then it will probably be over quickly and will not take SPY back into that area. The impulses down have been unfolding quickly and I think that will continue and become more violent as primary three unfolds, but you are right about the banksters’ fighting the decline tooth and nail.