
Downwards movement was expected for Friday, which is what happened.
Summary: Volume and On Balance Volume indicate that a bounce up may unfold for Monday / Tuesday next week as per the main hourly wave count. If price gets up that high, look for strong resistance at the bear market trend line. The larger trend remains down and the target remains at 1,423. Risk remains at 2,111.05. Alternatively, a third wave down may accelerate Monday / Tuesday but this looks less likely.
To see last published monthly charts click here.
To see how each of the bull and bear wave counts fit within a larger time frame see the Grand Supercycle Analysis.
To see detail of the bull market from 2009 to the all time high on weekly charts, click here.
New updates to this analysis are in bold.
BEAR ELLIOTT WAVE COUNT
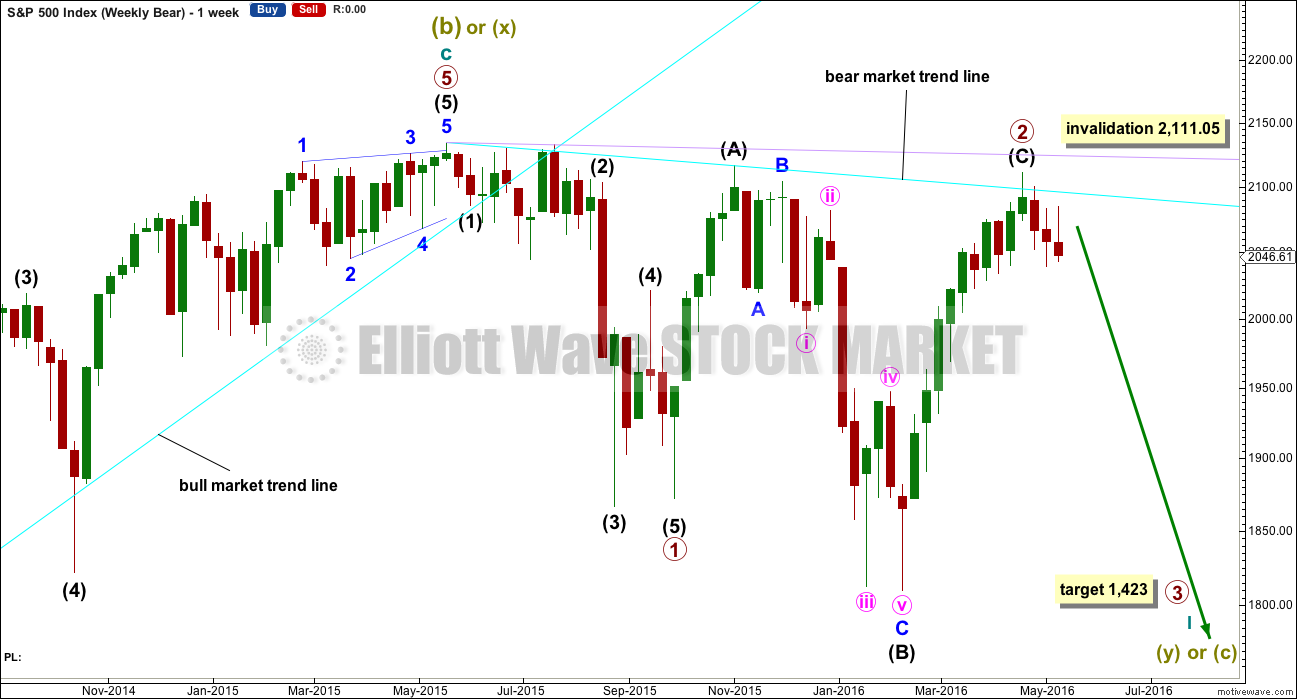
WEEKLY CHART
Click chart to enlarge.
This bear wave count fits better than the bull with the even larger picture, super cycle analysis found here. It is also well supported by regular technical analysis at the monthly chart level.
Importantly, there is no lower invalidation point for this wave count. That means there is no lower limit to this bear market.
Primary wave 1 is complete and lasted 19 weeks. Primary wave 2 is over lasting 28 weeks.
An expectation for duration of primary wave 3 would be for it to be longer in duration than primary wave 1. If it lasts about 31 weeks, it would be 1.618 the duration of primary wave 1. It may last about a Fibonacci 34 weeks in total, depending on how time consuming the corrections within it are.
Primary wave 2 may be a rare running flat. Just prior to a strong primary degree third wave is the kind of situation in which a running flat may appear. Intermediate wave (B) fits perfectly as a zigzag and is a 1.21 length of intermediate wave (A). This is within the normal range for a B wave of a flat of 1 to 1.38.
Within primary wave 3, no second wave correction may move beyond its start above 2,111.05.
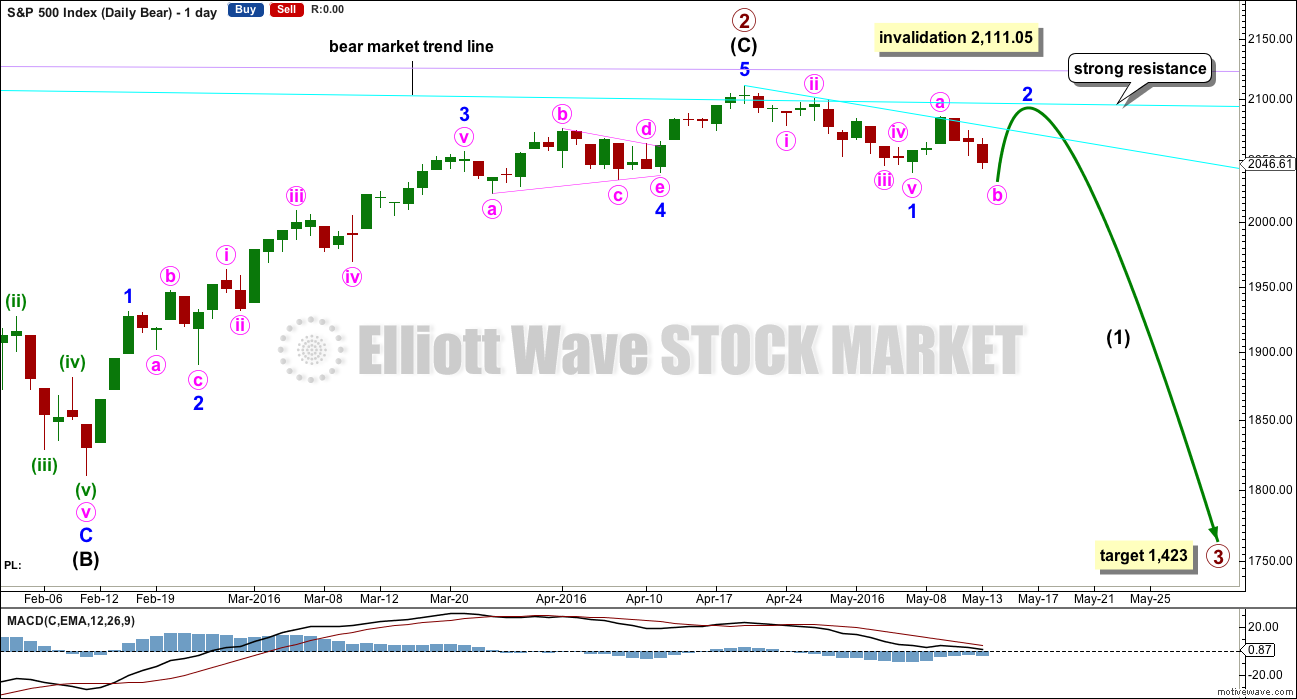
DAILY CHART
Click chart to enlarge.
If intermediate wave (C) is over, then the truncation is small at only 5.43 points. This may occur right before a very strong third wave pulls the end of intermediate wave (C) downwards. At the end of last week, price has confirmed a trend change with a new low slightly below 2,039.74.
The next wave down for this wave count would be a strong third wave at primary wave degree. At 1,423 primary wave 3 would reach 2.618 the length of primary wave 1. This is the appropriate ratio for this target because primary wave 2 is very deep at 0.91 of primary wave 1. If this target is wrong, it may be too high. The next Fibonacci ratio in the sequence would be 4.236 which calculates to a target at 998. That looks too low, unless the degree of labelling is moved up one and this may be a third wave down at cycle degree just beginning. I know that possibility right now may seem absurd, but it is possible.
Alternatively, primary wave 3 may not exhibit a Fibonacci ratio to primary wave 1. When intermediate waves (1) through to (4) within the impulse of primary wave 3 are complete, then the target may be calculated at a second wave degree. At that stage, it may change or widen to a small zone.
At this stage, if minor wave 2 has one or two more days of upwards movement to print one or two green daily candlesticks, then it would have a clear three wave counter trend look at the daily chart level. It does not have to do this, but this would give the most typical look. Another test of the bear market trend line, if that happens, should be taken as a gift from the market to enter low risk high probability short positions with an exceptionally good risk / reward ratio.
The equivalent minor wave 2 within the last big bear market was a 0.495 depth of minor wave 1 and lasted two days to minor wave 1’s five days.
The next possible equivalent minor wave 2 lasted one day longer than its minor wave 1 and was very deep at 0.81.
Overall, it is impossible to tell with certainty how deep and long lasting this minor wave 2 will be. Look out for possible surprises to the downside with a big third wave in its infancy.
Minor wave 1 lasted 12 days, one short of a Fibonacci 13. So far minor wave 2 has lasted five days. The risk today is still that it could be over.
Minor wave 2 may not move beyond the start of minor wave 1 above 2,111.05.
A short term bear market trend line is added from the high of primary wave 2 to the first small swing high of minute wave ii in cyan. This trend line is about where price is finding resistance. It is copied over to the first alternate hourly chart and the daily technical analysis chart.
I will publish three hourly wave counts in order of probability.
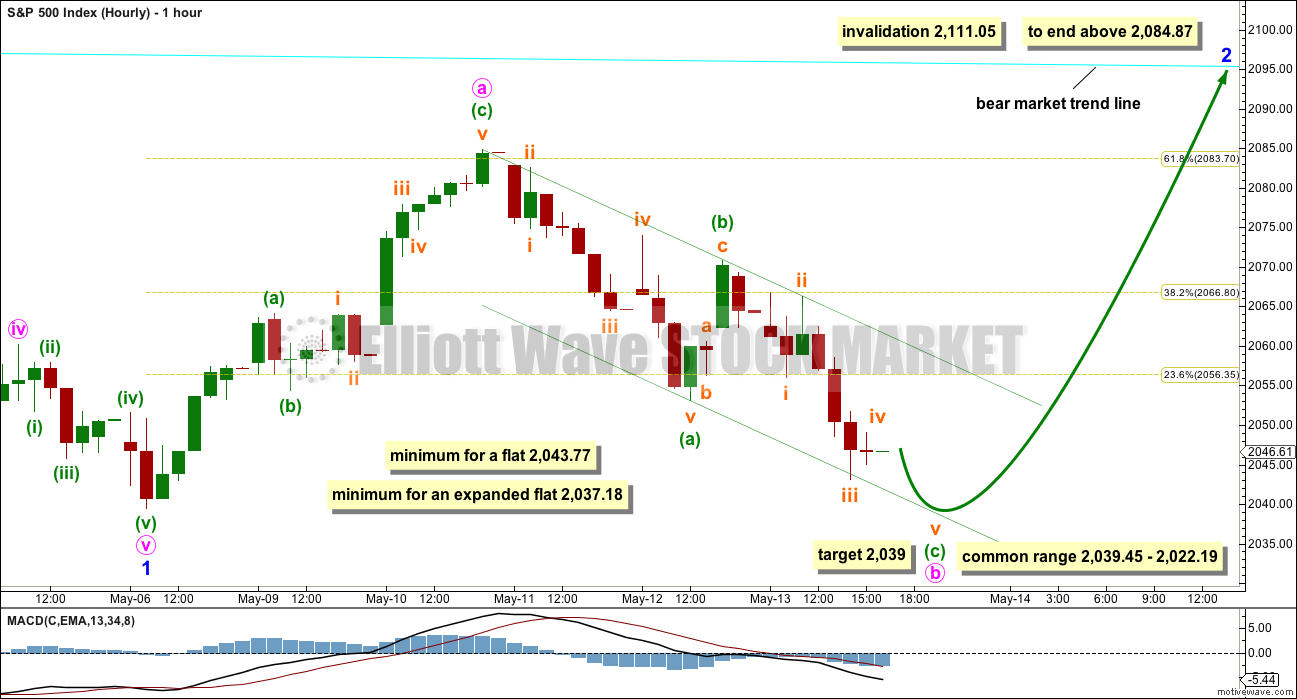
MAIN HOURLY CHART
Click chart to enlarge.
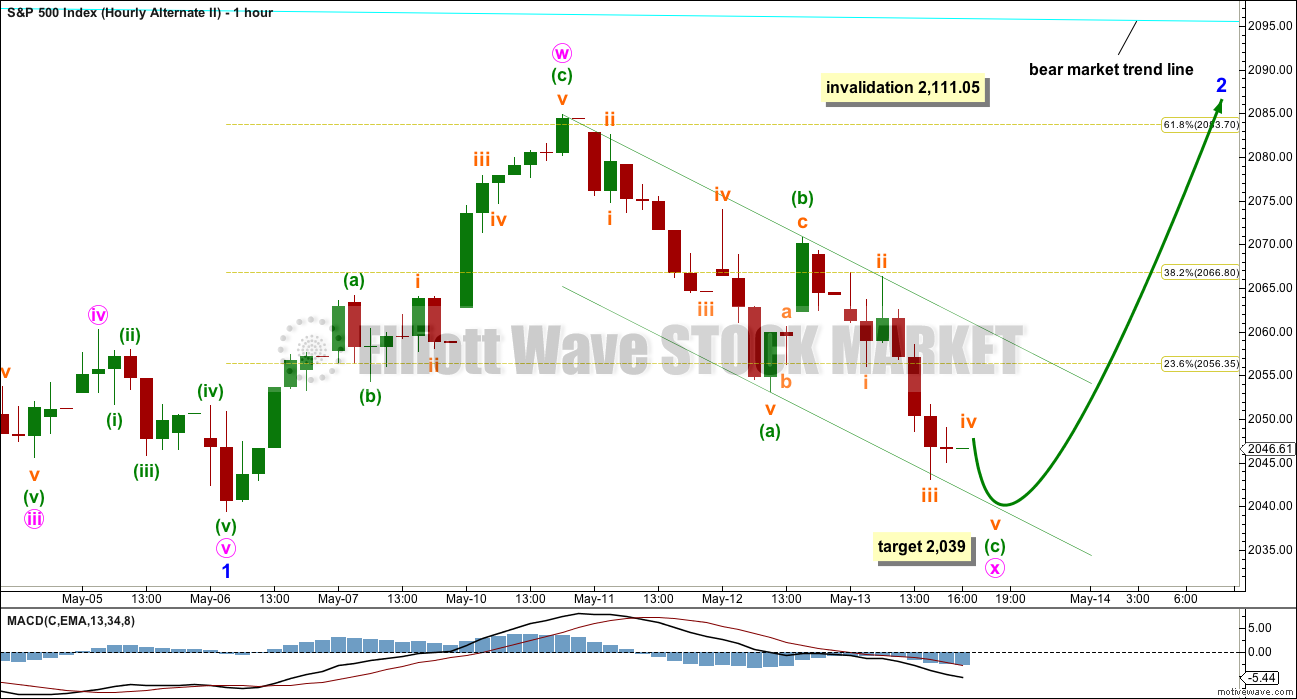
The most likely wave count for the short term picture would still be a flat correction continuing higher for minor wave 2.
This would see minor wave 2 better in proportion to minor wave 1 and a clear three wave structure on the daily chart. This would have the most typical look.
Within a flat correction, minute wave a must subdivide as a three. Minute wave a fits as a zigzag.
Within a flat correction, minute wave b must also be a three. It too is subdividing as a simple zigzag. Minute wave b has passed the minimum 0.9 length of minute wave a at 2,043.77.
The most common type of flat is an expanded flat. That requires minute wave b to be 1.05 the length of minute wave a or longer at 2,037.18.
The common range for minute wave b within the flat is from 1 to 1.38 the length of minute wave a giving a range from 2,039.45 to 2,022.19.
A new low below the end of minor wave 1 is fairly likely for this wave count, but it would not confirm for us that minor wave 2 is over and minor wave 3 is underway.
At 2,039 minuette wave (c) would reach equality in length with minuette wave (a). This is the most common ratio between A and C waves, and it may see minuette wave (c) end at the lower edge of the channel.
When the next five down for minuette wave (c) is complete, then the price point which will differentiate this main hourly wave count from the second *Edit: first alternate below is 2,070.78. A new high above that point at that stage would confirm this main hourly wave count and invalidate the second *Edit: first alternate below.
A breach of the upper edge of the channel about minute wave b (drawn in green) would provide trend channel confirmation that minute wave b is over and minute wave c upwards is underway.
When the end of minute wave b is known, then a target for minute wave c may be calculated. That cannot be done today. Minute wave c looks likely to find strong resistance at the bear market trend line. Minute wave c would be very likely to make a new high above the end of minute wave a at 2,084.87 to avoid a truncation.
Minor wave 2 may not move beyond the start of minor wave 1 above 2,111.05.
Within a flat correction, there is no rule stating a maximum limit in length for a B wave. There is a convention within Elliott wave which states that when the potential B wave reaches twice the length of the potential A wave the idea of a flat unfolding is so low it should be discarded. That price point would be at 1,994.03 which is too low to be of much use practically.
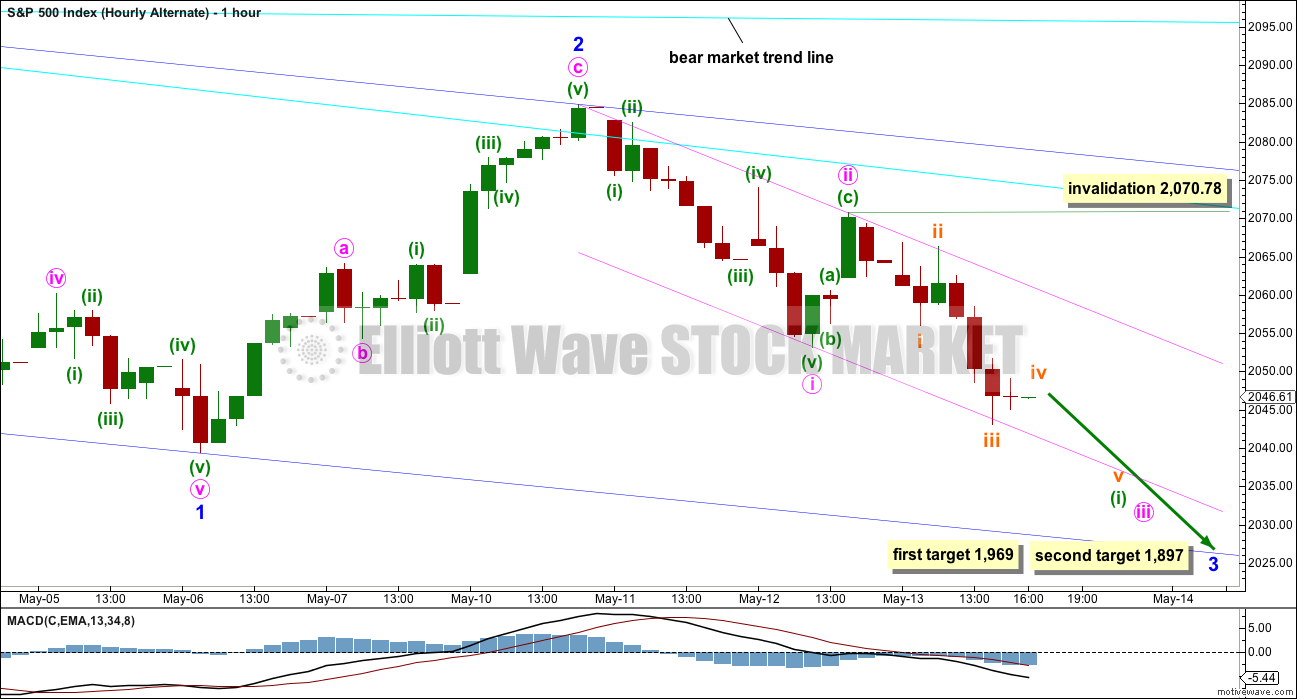
FIRST ALTERNATE HOURLY CHART
Click chart to enlarge.
Minor wave 2 may be over. The implications are important.
At 1,969 minor wave 3 would reach 1.618 the length of minor wave 1. If when price gets to the first target minor wave 3 is an incomplete structure, or if price just keeps falling through the first target, then the next target is at 1,897 where minor wave 3 would reach 2.618 the length of minor wave 1.
Minor wave 2 is a deep 0.634 zigzag. The only problem with it is the proportion: it lasted just two days if it is over here compared to the 12 days duration for minor wave 1.
Minute wave i fits perfectly as an impulse. Minute wave ii is complete as a zigzag.
If this wave count is correct, the important implication is an increase in downwards momentum over the next few days.
The dark blue channel is a base channel about minor waves 1 and 2. Draw the first trend line from the start of minor wave 1 to the high labelled minor wave 2, then place a parallel copy on the low labelled minor wave 1. Along the way down, lower degree corrections should find resistance at the upper edge of the base channel. When the base channel is breached by downwards movement, that is strong confirmation that a third wave down is underway. Third waves should have the power to break below base channels.
The five down which continued lower for Friday’s session is too short to be minute wave iii in its entirety. This may be another impulse for another first wave.
Add a second base channel. This one is drawn in pink about minute waves i and ii and is exactly the same as the green channel on the main hourly chart. For this alternate, now that minute waves i and ii are complete, upwards corrections along the way for lower degree second waves should find resistance at the upper edge of the channel, as subminuette wave ii did.
The first warning that this wave count may be wrong and the main wave count may be right would be a breach of the upper edge of the channel on Monday.
SECOND ALTERNATE HOURLY CHART
Click chart to enlarge.
It is also possible that minor wave 2 may continue sideways as a double combination.
The downwards wave labelled minute wave x still looks like an incomplete three. It will be a relatively deep correction in relation to the wave up labelled minute wave w. Double combinations normally have deep X waves. Double zigzags normally have shallow and brief X waves. This X wave is now too deep to have a typical look for a double zigzag, so that idea is discarded.
Both double zigzags and double combinations are labelled W-X-Y, but they are very different structures. Double zigzags are part of the zigzag family and should have a clear slope against the prior trend. Double combinations are part of the flat kind of family and should have an overall sideways look. There may be no more than one zigzag in a double or triple combination.
Within a double combination, the second structure exists to take up time and move price sideways (which is the same purpose of triangles). To achieve this purpose the second structure in the double should end about the same level as the first structure.
If minute wave y is time consuming enough, then it may be able to end very close to or possibly touching the bear market trend line. Minute wave y would most likely be a flat, but it may also be a triangle.
The target for minute wave x is now the same as the target for the main hourly wave count. At 2,039 minuette wave (c) would reach equality in length with minuette wave (a).
There is no rule stating a maximum length for an X wave within a combination. X waves within combinations may make new price extremes beyond the start of the correction, and are reasonably likely to do so. The same principle of B waves within flats will be applied. When downwards movement reaches 1,994.03 or below, then minute wave x would be twice the length of minute wave w, so this idea should be discarded based upon a very low probability.
The biggest difference between this second alternate and the main wave count is how price is expected to behave when the zigzag down for minute wave x or b is complete. This alternate expects choppy overlapping time consuming sideways movement, where the main wave count expects a strong impulse upwards.
Combinations are not as common as expanded flats. On that basis only this second alternate has a lower probability than the main wave count.
BULL ELLIOTT WAVE COUNT
WEEKLY CHART

Click chart to enlarge.
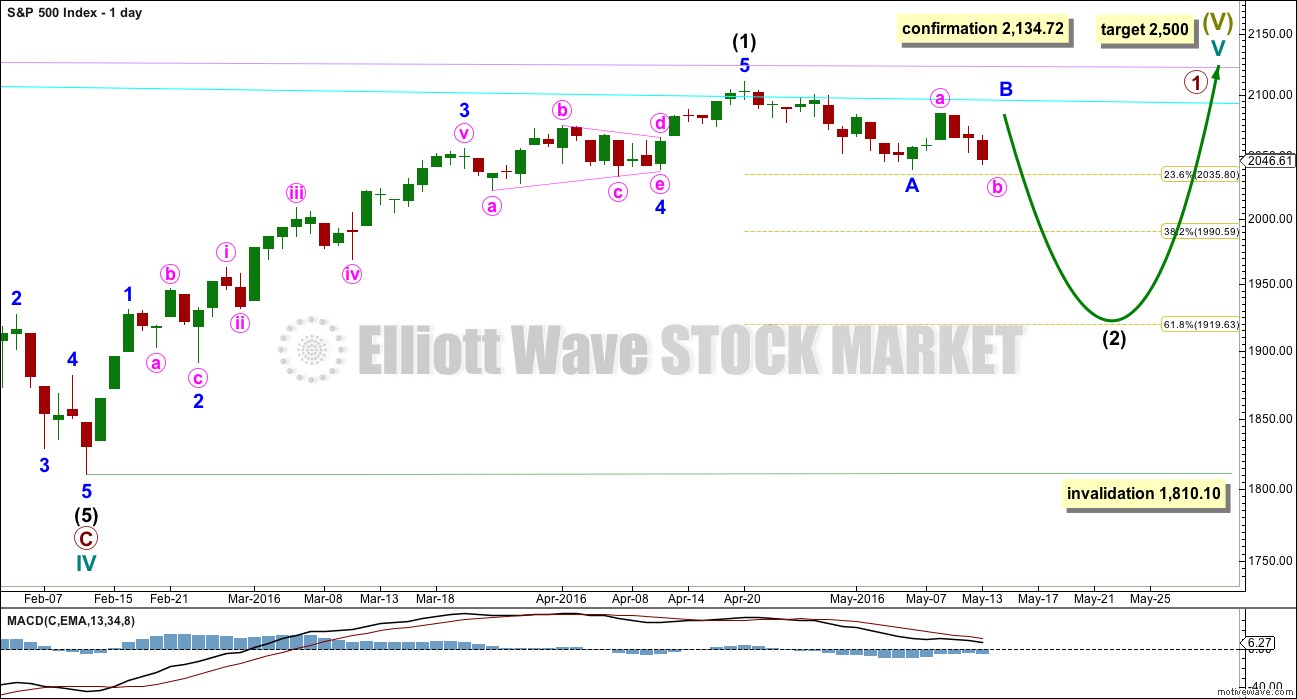
Cycle wave IV is seen as a complete flat correction. Within cycle wave IV, primary wave C is still seen as a five wave impulse.
Intermediate wave (3) has a strong three wave look to it on the weekly and daily charts. For the S&P, a large wave like this one at intermediate degree should look like an impulse at higher time frames. The three wave look substantially reduces the probability of this wave count. Subdivisions have been checked on the hourly chart, which will fit.
Cycle wave II was a shallow 0.41 zigzag lasting three months. Cycle wave IV may be a complete shallow 0.19 regular flat correction, exhibiting some alternation with cycle wave II.
At 2,500 cycle wave V would reach equality in length with cycle wave I.
Price remains below the final bear market trend line. This line is drawn from the all time high at 2,134.72 to the swing high labelled primary wave B at 2,116.48 on November 2015. This line is drawn using the approach outlined by Magee in the classic “Technical Analysis of Stock Trends”. To use it correctly we should assume that a bear market remains intact until this line is breached by a close of 3% or more of market value. In practice, that price point would be a new all time high which would invalidate any bear wave count.
This wave count requires price confirmation with a new all time high above 2,134.72.
While price has not made a new high, while it remains below the final bear market trend line and while technical indicators point to weakness in upwards movement, this very bullish wave count comes with a strong caveat. I still do not have confidence in it.
The invalidation point will remain on the weekly chart at 1,370.58. Cycle wave IV may not move into cycle wave I price territory.
This invalidation point allows for the possibility that cycle wave IV may not be complete and may continue sideways for another one to two years as a double flat or double combination. Because both double flats and double combinations are both sideways movements, a new low substantially below the end of primary wave C at 1,810.10 should see this wave count discarded on the basis of a very low probability long before price makes a new low below 1,370.58.
DAILY CHART
Click chart to enlarge.
If the bull market has resumed, it must begin with a five wave structure upwards at the daily and weekly chart level. That may today be complete. The possible trend change at intermediate degree still requires confirmation in the same way as the alternate hourly bear wave count outlines before any confidence may be had in it.
If intermediate wave (2) begins here, then a reasonable target for it to end would be the 0.618 Fibonacci ratio of intermediate wave (1) about 1,920. Intermediate wave (2) must subdivide as a corrective structure. It may not move beyond the start of intermediate wave (1) below 1,810.10.
In the long term, this wave count absolutely requires a new high above 2,134.72 for confirmation. This would be the only wave count in the unlikely event of a new all time high. All bear wave counts would be fully and finally invalidated.
TECHNICAL ANALYSIS
WEEKLY CHART
Click chart to enlarge. Chart courtesy of StockCharts.com.
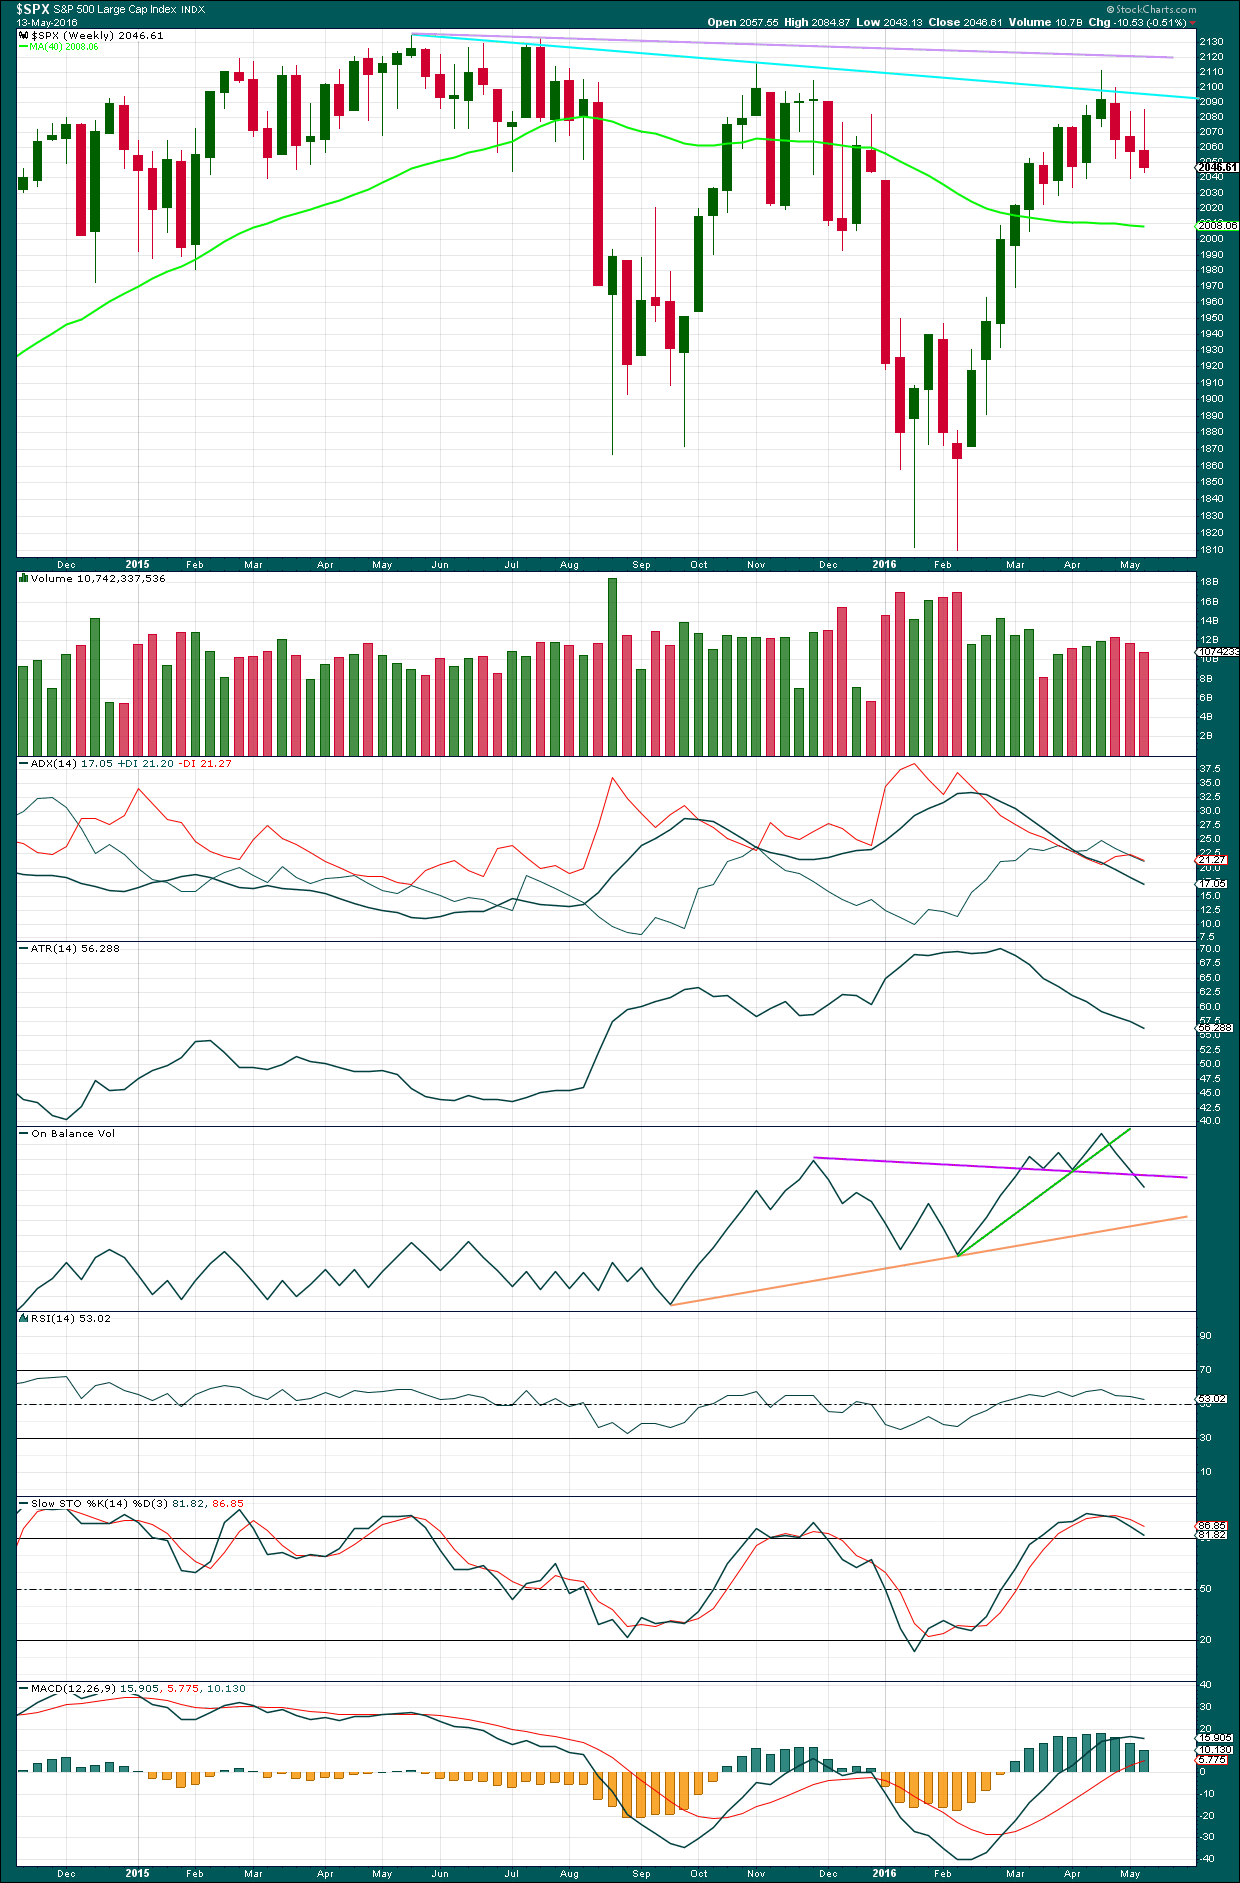
There is a bearish engulfing candlestick pattern at the last high. This has occurred at the round number of 2,100 which increases the significance. Volume on the second candlestick is higher than volume on the first candlestick, which further increases the significance. That it is at the weekly chart level is further significance.
Engulfing patterns are the strongest reversal patterns.
Now this pattern is followed by another red weekly candlestick. The reversal implications of the pattern are confirmed.
This is a very strong bearish signal. It adds significant weight to the expectation of a trend change. It does not tell us how low the following movement must go, only that it is likely to be at least of a few weeks duration.
This week’s candlestick has a long upper shadow and is again red which is bearish.
There is another bearish signal from On Balance Volume this week with a break below the purple line. This does not indicate which hourly wave count is correct, but it does add weight to a downwards trend.
There is hidden bearish divergence between Stochastics and price at the last high and the high of November 2015. Stochastics has moved further into overbought territory, but this has failed to translate into a corresponding new high in price. Price is weak. MACD exhibits the same hidden bearish divergence.
After a period of declining ATR, it should be expected to turn and begin to increase.
DAILY CHART
Click chart to enlarge. Chart courtesy of StockCharts.com.
Volume data on StockCharts is different to that given from NYSE, the home of this index. Comments on volume will be based on NYSE volume data when it differs from StockCharts.
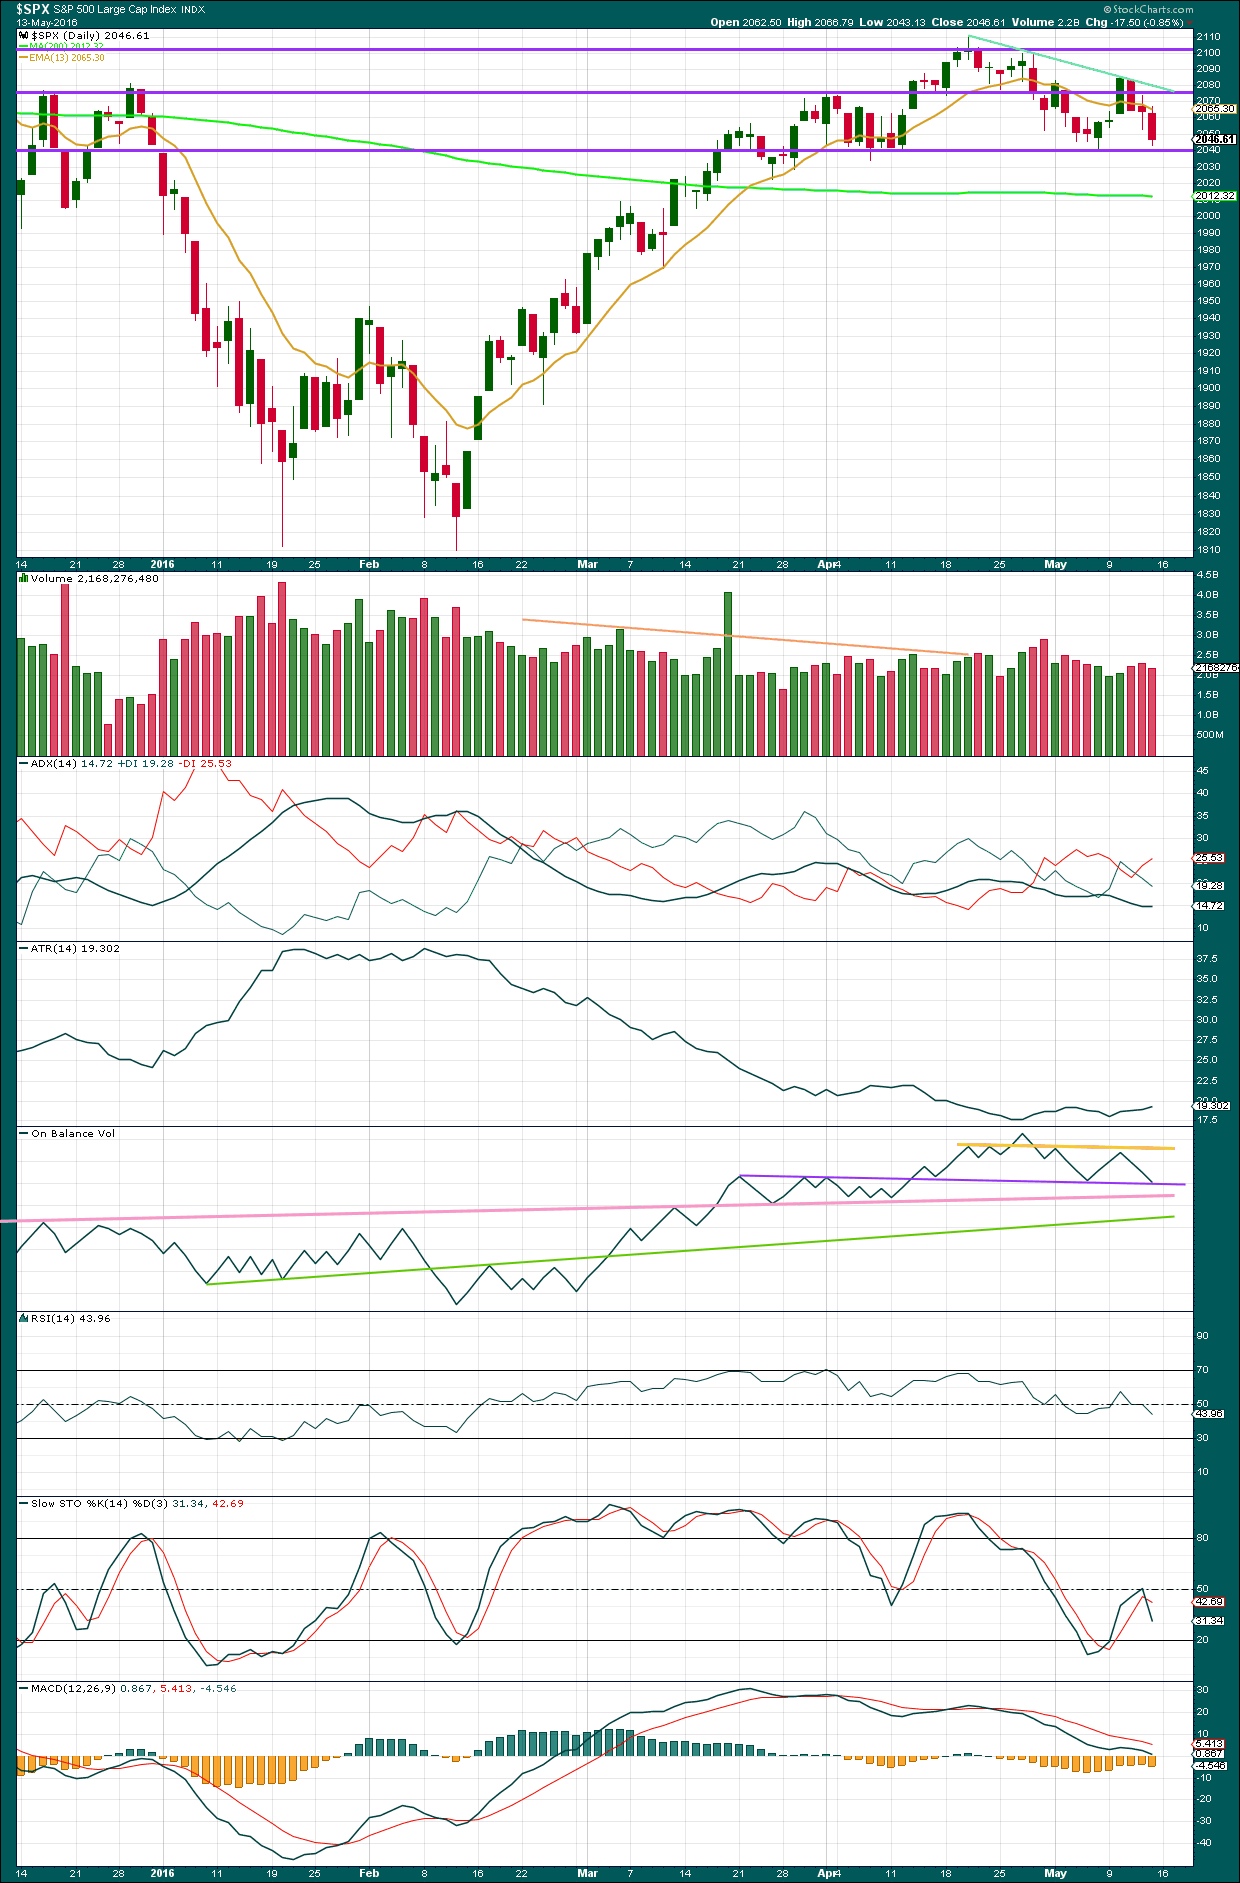
The fall in price for three days comes on light and now declining volume for Friday. The fall in price is not supported by volume. This slightly supports the main hourly wave count, although price can fall of its own weight.
A new bear market trend line is added to this daily chart in blue. Price is finding resistance at this trend line so far. Price may find some support at the horizontal trend line about 2,040 before breaking through.
ADX is flat indicating that the market is not currently trending. During a consolidation, the +DX and -DX lines fluctuate about each other. Currently, an upwards trend would be indicated if the ADX line increases, but with the directional lines so close together this could change quickly.
ATR agrees with ADX as it is overall flat.
On Balance Volume has come down at the end of the week to touch the purple line. This line may offer some support for OBV. This in conjunction with the support line for price may initiate a bounce for a day or two. This slightly supports the main hourly Elliott wave count.
OBV may again find resistance at the yellow line if it gets up that high.
A break below either the purple, pink or green lines by OBV would be a strong bearish signal. At that stage, a third wave down should be expected to be underway.
RSI is neutral. There is plenty of room for price to fall or rise.
Stochastics is close to neutral.
MACD is flattening off as would be expected during a counter trend movement.
VOLATILITY – INVERTED VIX DAILY CHART
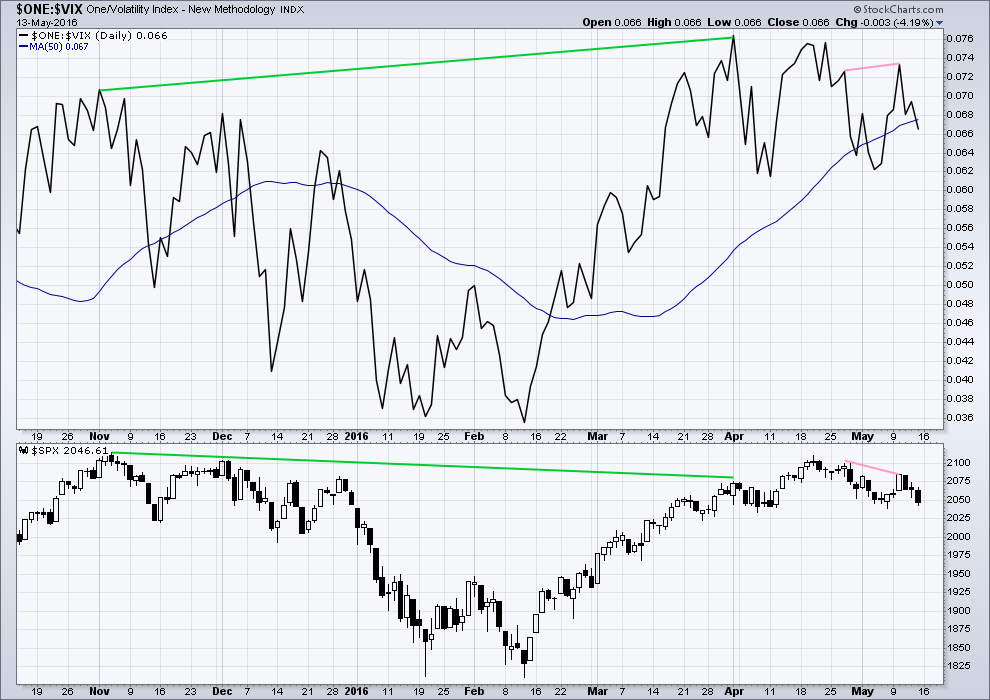
Click chart to enlarge. Chart courtesy of StockCharts.com.
Volatility declines as inverted VIX climbs. This is normal for an upwards trend.
What is not normal here is the divergence over a reasonable time period between price and inverted VIX (green lines). The decline in volatility did not translate to a corresponding increase in price. Price is weak. This divergence is bearish.
BREADTH – ADVANCE DECLINE LINE
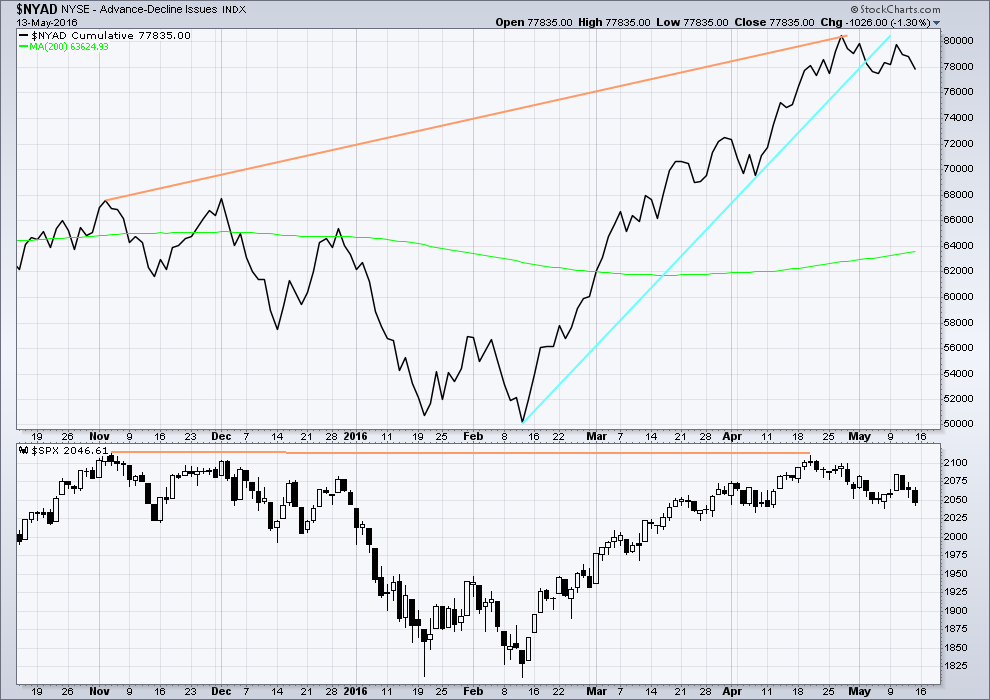
Click chart to enlarge. Chart courtesy of StockCharts.com.
With the AD line increasing, this indicates the number of advancing stocks exceeds the number of declining stocks. This indicates that there is breadth to prior upwards movement.
From November 2015 to 20th April, the AD line made new highs while price far failed to make a corresponding new high. This indicates weakness in price; the increase in market breadth is unable to be translated to increase in price (orange lines).
The 200 day moving average for the AD line is now increasing. This alone is not enough to indicate a new bull market. During November 2015 the 200 day MA for the AD line turned upwards and yet price still made subsequent new lows.
The AD line is now declining and has breached a support line (cyan). There is breadth to downwards movement; more stocks are declining than advancing which supports the fall in price.
ANALYSIS OF LAST MAJOR BEAR MARKET OCTOBER 2007 – MARCH 2009
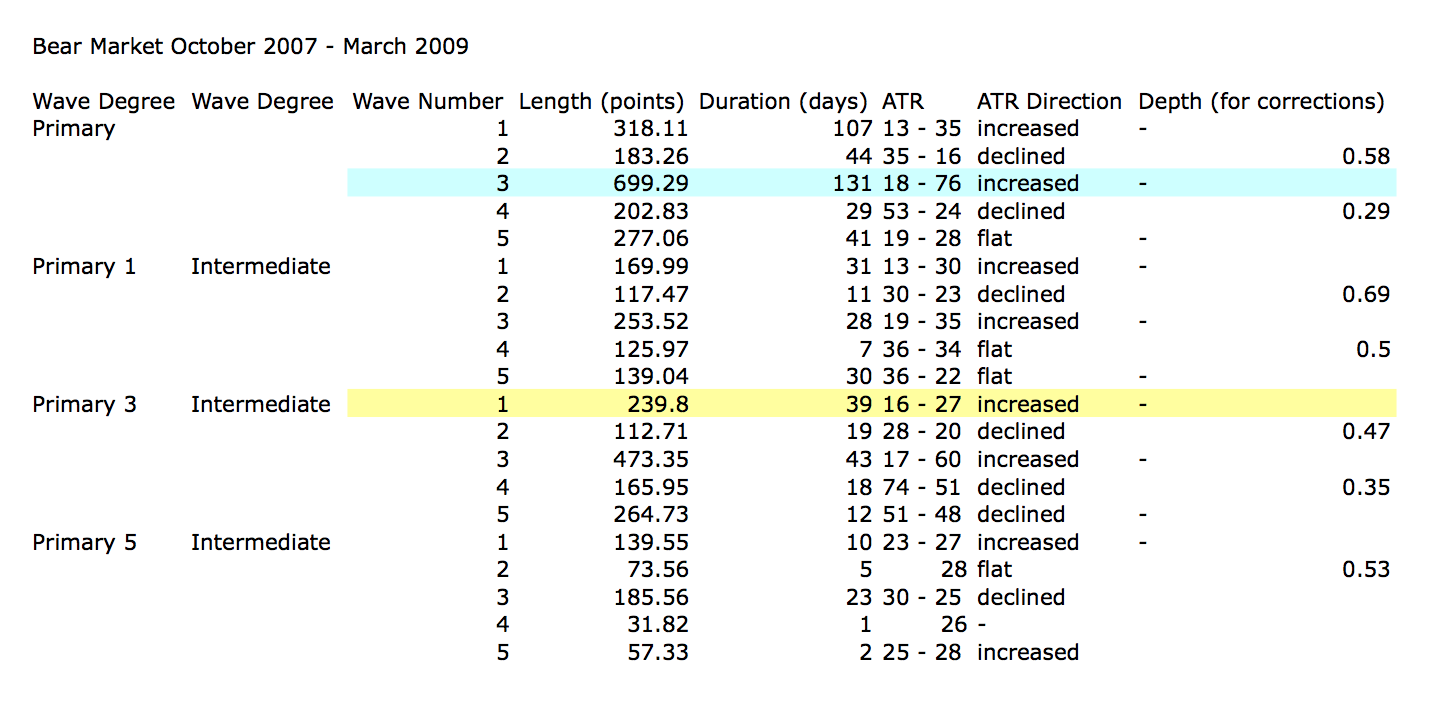
Click to enlarge.
In looking back to see how a primary degree third wave should behave in a bear market, the last example may be useful.
Currently, the start of primary wave 3 now may be underway for this current bear market. Currently, ATR sits about 19. With the last primary degree third wave (blue highlighted) having an ATR range of about 18 to 76, so far this one looks about right.
The current wave count sees price in an intermediate degree first wave within a primary degree third wave. The equivalent in the last bear market (yellow highlighted) lasted 39 days and had a range of ATR from 16 – 27.
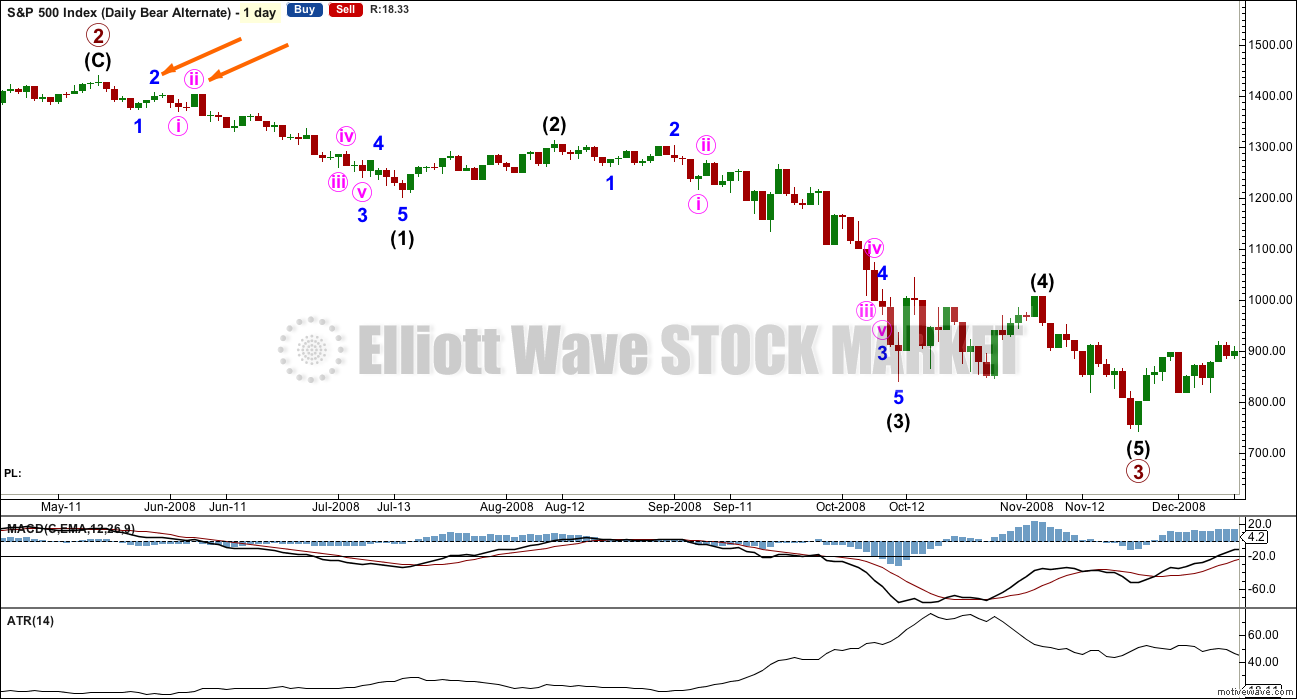
Click chart to enlarge.
This chart is shown on an arithmetic scale, so that the differences in daily range travelled from the start of primary wave 3 to the end of primary wave 3 is clear.
Primary wave 3 within the last bear market from October 2007 to March 2009 is shown here. It started out somewhat slowly with relatively small range days. I am confident of the labelling at primary degree, reasonably confident of labelling at intermediate degree, and uncertain of labelling at minor degree. It is the larger degrees with which we are concerned at this stage.
During intermediate wave (1), there were a fair few small daily doji and ATR only increased slowly. The strongest movements within primary wave 3 came at its end.
It appears that the S&P behaves somewhat like a commodity during its bear markets. That tendency should be considered again here.
Looking more closely at early corrections within primary wave 3 to see where we are, please note the two identified with orange arrows. Minor wave 1 lasted a Fibonacci 5 days and minor wave 2 was quick at only 2 days and shallow at only 0.495 the depth of minor wave 1.
Minute wave ii, the next second wave correction, was deeper. Minute wave i lasted 3 days and minute wave ii was quick at 2 days but deep at 0.94 the depth of minute wave i.
What this illustrates clearly is there is no certainty about second wave corrections. They do not have to be brief and shallow at this early stage; they can be deep.
This chart will be republished daily for reference. The current primary degree third wave which this analysis expects does not have to unfold in the same way, but it is likely that there may be similarities.
DOW THEORY
I am choosing to use the S&P500, Dow Industrials, Dow Transportation, Nasdaq and the Russell 2000 index. Major swing lows are noted below. So far the Industrials, Transportation and Russell 2000 have made new major swing lows. None of these indices have made new highs.
I am aware that this approach is extremely conservative. Original Dow Theory has already confirmed a major trend change as both the industrials and transportation indexes have made new major lows.
At this stage, if the S&P500 and Nasdaq also make new major swing lows, then my modified Dow Theory would confirm a major new bear market. At that stage, my only wave count would be the bear wave count.
The lows below are from October 2014. These lows were the last secondary correction within the primary trend which was the bull market from 2009.
These lows must be breached by a daily close below each point.
S&P500: 1,821.61
Nasdaq: 4,117.84
DJIA: 15,855.12 – close below on 25th August 2015.
DJT: 7,700.49 – close below on 24th August 2015.
Russell 2000: 1,343.51 – close below on 25th August 2015.
To the upside, DJIA has made a new major swing high above its prior major high of 3rd November, 2015, at 17,977.85. But DJT has so far failed to confirm because it has not yet made a new major swing high above its prior swing high of 20th November, 2015, at 8,358.20. Dow Theory has therefore not yet confirmed a new bull market. Neither the S&P500, Russell 2000 nor Nasdaq have made new major swing highs.
This analysis is published @ 05:47 a.m. EST on 14th May, 2016.
1st after the upgrade,, longer delay than expected,, how unethical was that,, hee hee (just kidding of course)
FYI:
We are upgrading our servers today for this website. There may be a little down time.
Once done this should make the site load faster.
Down time should be brief, if at all. It’s possible it could be up to 15-20mins worst case scenario.
Lara,
I would like to point out an observation. Your ability to teach EW through this medium has repeatedly been demonstrated to be excellent. Every person who has been on this blog / subscriber forum has grown in their skills and reasoning. I have seen this growth with my own eyes. I am so grateful to be a part of it and grateful for your teaching.
I just can’t get my head around your adversity to risk and yet, you surf in the ocean with the sharks and jelly fish! Yikes. I’ll take a grizzly bear over Jaws any day.
Will you post a photo of your diploma? Would love to see it.
Oh yeah, here’s some random useful (slightly) information I’m not sure I shared with the membership at the time.
I got my CMT III results some time ago. You may like to know that the section I aced and did the best on was ethics.
You have a very ethical analyst working for you 🙂
I’m so not surprised… 🙂
Totally agree. I don’t think anyone that’s been around here for more than couple weeks will be at all surprised by that, but it’s nice that it has been officially recognised.
Goes in hand in hand with the remarkable objectivity methinks!…. 🙂
I think anyone who monitors these post , your comments , and you daily interpretations – would ever think any different . I think everyone knows you sincerely have your subscribers interest first , and foremost . I enjoy , and use your analysis . I also enjoy the post from your other members . It all gives me a better understanding of Elliott . Always learning . Thank you Lara .
You’re welcome all.
This membership has been improving my trading on S&P as well with the sharing of knowledge and experience.
I’ve only begun trading this instrument (via CFD’s) in recent months. Prior to that I would only analyse it. It looked too volatile for my liking.
I’ve analysed this market daily for nearly 6 years… and only recently felt comfortable enough to trade it. Long standing members are aware of this, newer members may not be.
I prefer to trade NZDUSD. That’s my favourite. Some Oil and Gold trades from time to time, and EURUSD but not recently (it’s been in a horrible correction).
The other guys are beside themselves with bullishness and are posting what looks like a double combination corrective minor two, with X at the 2084.87 high, “a” down last Friday, and “b” up today. The support shelf drawn for the target for c looks like they are expecting c down to complete sa flat of some sort, “with more bearish potential”. Most interesting. 🙂
Hum,,, I dont know,,,,,(just kidding)
So which one is correct?
I can’t give an answer to weighting until the session has ended and I go through the classic TA.
Volume will be light, but that will be expected for both hourly ideas.
First alternate updated:
The expanded flat for minute ii is Olga’s idea below. I really like this. The subdivisions fit beautifully. Price has come up to touch the second short term bear trend line (it’s drawn on the main daily chart and copied over here to this hourly). that may provide resistance?
This is our risk today. Minor 3 may have begun and now be ready to accelerate downwards tomorrow. This is entirely possible!
To the upside the price point which differentiates this from the main hourly is 2,084.87.
To the downside the differentiation is 2,043.13.
wow…I didn’t even see this count???
My apologies Olga, I was confused in what you were saying.
Me too. We are just dummies aren’t we? 🙂 🙂
I just love,love,love it! It has the right feel with the big move down in the Unicorn today; the move up should have accomplished what would be its main purpose- dislodge the cubbies ahead of a big move down, and Olga is almost as awesome as you are Lara. Way to go girl! 🙂 🙂 🙂
Thanks buddy – but I wouldn’t go (anywhere near) that far!! A broken clock gets it right twice a day 🙂
No doubt Mr Market has plenty more tricks up his sleeve so not counting any chickens yet.
I’m watching whether we get a 5 or 3 down next like a hawk – that should tell us what Mr M has in mind – hopefully before we get to 2043.
Hats off to Quang for identifying the other count. Team effort.
Ah, but it’s all in the ability to see alternates. Which requires not getting stuck on any one idea and having an open mind.
That is the hardest thing to do in Elliott wave I think.
You’re really good at considering alternates, and “what if”
Thanks Lara – coming from the person who in my opinion is (by a long stretch) the best in the business that is a *huge* compliment 🙂
This is the count I was trying to express earlier when I messed up and said to strike it all. Once I transfer to IB, I’ll be able to post charts instead of trying to do everything descriptively in writing.
I think it fits well. I also think it have equal probability as the main bear hourly count.
Same, was trying to say this at time 12:21. Peter
I still claim glory – (10:35 am – ALT count) 😉 🙂 🙂
LOL
That’s why a chart is so much more helpful than words. Especially for those of us who think in pictures and colour.
StockCharts have the ability to put labels on them too.
I agree on the probability being about even too. I may relabel them I and II.
On Balance Volume isn’t telling us which one is correct. At the end of the session neither is structure.
Volume isn’t telling us which one is correct.
I hope I find something else which allows me to weight them because I don’t like an even probability.
Maybe Peter’s quite high bearish percentage swings it toward Minor 2 not yet being over?
Minor 3 being in progress would work out great for me so that in itself is always a good clue 🙂 lol
True. More upwards movement would relive the bearishness.. and create better conditions for a third wave down.
I’m working on getting volume put / call data from CBOE into Excel, charted, and updated daily to use as a sentiment indicator.
Once I’ve spent the time doing that I’ll add it to daily analysis. For now I’ll rely on Peter’s note of bearishness.
thanks Peter! 🙂
Yep. She’s pretty special I think. This count has such a neat fit.
Main hourly wave count updated:
At 2,089 minute c = minute a.
Minor 2 is a regular or running flat. Regular flats are much more common than running flats, so the target is reasonable. If it takes its time getting there it may even be able to reach the bear market trend line.
So far within minute c a five up is complete. This is extremely unlikely to be minute c in its entirety, it would be enormously truncated. That has an exceptionally low probability, I wouldn’t seriously consider it.
Price point which will differentiate this from the alternate (to be updated next) is now clear at 2,043.13. A new low below that point tells us minor 3 is underway.
Sweet! I will be happily laddering into short positions on the final pop up. 2089 (or thereabouts!) here we come!! 🙂
A close above 2100 means I bail like a cat on a hot tin roof…or as Olga would say, run sceaming for the exits as if my hair was on fire!! lol… 🙂 🙂
ROFL
The alternate today is looking very nice indeed. It ha a great fit, in terms of EW subdivisions slightly better than this main hourly today.
With no new low at the start of todays session the downwards wave labelled minute b fits better with the alternate now.
They are offering 0.55 cents for UVXY 10.00/12.50 bull credit spreads expiring next week. Risk is 250.00 per contract if UVXY below 10.00 at the end of next week. Reduces call options position by 0.55 per contract to 0.15 cents if UVXY above 12.50 at the end of next week. Very good risk/reward ratio based on expected EW count as well as other data…
Good morning everybody. Finishing up charts now, will have something to post soon.
For the main hourly wave count: I wouldn’t expect minute c to be over here. The truncation would be massive. Even within a big third wave that is too much.
Unicorn 5 points away from a new 52 week low at 12.95; very much in keeping with yet another second wave…trip below 13 merits a nibble on 15.00 strike call expiring next week. Filled @ 0.70; stop loss @ 0.45; buy stop to the upside at bid of 0.99…
Joseph is right though – the volume is incredibly low….thought the data ticker maybe was in error even at first.
First Alternate Hourly chart invalidated with that pass thru of 2070.78
Correction it did… 2070.83
SPX Volume now materially Lower today than Friday at this time. Volume is slowing now!
2070.83 so far
Noting on the daily chart there is a bullish concealing baby swallow (someone had a sense of humor). A very rare occurance. The low today on my chart I’m looking at – SPX index – does not show it matching or engulfing Friday’s low…..but it did in Sunday night futures trading.
Short term is way overbought though.
Adding it also looks like a bullish ladder bottom candlestick…just bringing attention to it.
This is looking more like what I expected. This move up should have accomplished its purpose by dislodging recently entered shorts. I think minor two is almost done.
All this on Lower SPX Volume today than Friday at this time of day.
That is huge!
I am loading initial shorts into the close….
Feels more like wave 1 up of c up of minor 2 to me.
C wave up of minor 2 should take another few more days to complete imo.
If you are right we should see a three wave corrective move soon…followed by a really big three up…
Yep – that’s why I’ve got a keen eye on whether the next move down is a 5 or a 3 wave structure.
The problem though is that price didn’t go low enough for Minor 2 to be an expanded flat (it needed to go down to 2037 minimum to meet the rule) – so we should not go much above 2085 as this must be a regular flat (if that’s what it is)
If this is only wave 1 it would suggest an expanded flat is unfolding so I think it has lower probability (unless I am missing something)
“…If this is only wave 1 it would suggest an expanded flat …”
Just trying to get my count correct, but why would this be so? Why would this only being wave 1 suggest an expanded flat? I just want to make sure I’m not missing something…which I prolly am…lol
Because we would still have W2,3,4&5 to go – which would very likely take price way above 2085 so creating an expanded flat (regular flat would not be expected to go much above 2085).
For it not to go way above 2085, you’d need a seriously short 3rd and 5th wave – prob both shorter than the 1st wave (which is possible as long as 3rd wave is not shortest – but unusual imho)
Thank you! Here’s another possibility….just to keep in mind, w2 down of c up could be really deep…61.8% or > of w1. As long as wave 3 isn’t the shortest wave, then w4 and w5….. in this scenario, no violation of any rules and still could be a regular flat here…IMHO.
With expanded flat, doesn’t wC have to start below end of wA…?
Just thinking out loud here and thanks again for your input.
An expanded flat requires C to be minimum 1.05 X A.
Yeah – for expanded flat wave B retraces at least 105% of Wave A (from memory) – so Wave C starts below Wave A as you stated.
Wave C can travel more than 100% of A, so you might be right but I think it is more common for a flat to have a sideways look (so finish just above A to avoid a truncation). I’m sure Lara will clear it up! 🙂
EDIT – Thanks Lara!
It also moves C in an area of formidable resistance as it approaches the round number pivot…
a of 2 took 3 days, b of 2 took 3 days, c of 2 should be…..???
2-3 days would be a reasonable expectation.
Currently at 2068 I am thinking we are in sub-minuette 3 of minuette 5 of minute c of Minor 2. Looking for the end around 2071+.
You mean you are looking for Minor 2 to complete around 2071?
Wouldn’t that make Minor 2 a running flat?
Or above.
Will use best fit channel lines about minute c to look for a break below before the channel line to indicate Minor 2 is done.
Just to complicate things further (actually I did post this count earlier today) – what about this? 🙂
2073 is 61.8 fib target – perhaps we went out the base channel because we have not yet seen the end of the 2nd wave (so base channel not yet correctly drawn)
I like it. This should be todays alternate
This could be an interesting idea Olga well spotted, looking at my chart if you draw a channel line from the possible minor 2 top and the next spike high then today has perfectly toutched the top of that line today. Hmmm
I REALLY gotta find my glasses. I looked (more like squinted) at this chart and COMPLETELY missed what Olga was saying or else I would have been literally bouncing off the walls with a ” YES!!” 🙂
For some reason I read that “2” as a “C” (dummy!)
Sorry about that. Strike the above. Sorry.
It cannot end in 2070’s without significant truncation. Strike it.
I should stick to my hourly charts and not try to do three or more things at once.
If we are expecting a strong third wave down, that could explain why the flat would not be expanded. It could still end up being a regular flat…which I am expecting…
Or represents just “a” wave of C up.
Again, serious problem of proportionality I think….other things considered, I would not expect much of a move higher…
C waves are 5 wave structures other than in triangles / diagonals etc
Looking to me like a test of neckline break in DJI…
I think we are in another second wave….looking at possible labels…
I don’t know about you guys but I am starting to wonder about this C up; seems an impulse up should be a bit more…well, impulsive…!
I would have expected a more spirited approach of the 2084.87 minute A high.
If we are only in minuette one up, it is going to be one helluva expanded flat. 🙂
We still haven’t taken out the wave highs @2066 and 2070 (almost there now but not quite yet), so 1,2’s are still on the table, albeit with price going out of the base channel that count (Minor 3) became a lower probability for me.
2071 is where c = 1.618 a if this is an expanded flat from 2053, which would avoid a truncation and a rare running flat. If we get up to 2071 and reverse then my favourite count would be that we are going to see 5 down tomorrow to below 2043 to complete Minute B, then the long awaited Minute C up.
I realise there are concerns about proportion, which could prove right, but if the C down and C up impulses expected by this count are very sharp / fast then maybe that would be resolved.
Passing this on, if you’re interested, if you maybe haven’t seen this before: BoA and Merrill Lynch (i have an account with them too for other purposes) track and record global liquidity. On Friday the information was released to the public and you can find it on various sites. Link below.
In a nutshell the graph(s) show the amount of highly liquid assets available in the world and for some regions/countries of the world. One has to study the charts closely, but note the green up trends, the red down trends, related to the stock index ups and downs. Plus note the divergences, the time delays, the times it is still green but sloping down, the times it is still red but sloping up, the peaks, the lows, etc. everything you can note from those charts. In short: when there are liquidities in the world or particular country the stock index goes up. When there isn’t liquidities stock indexes goes down. It has been extremely accurate….keep in mind the time delays. Since they created it (or began collecting the data) the predictability has really been 100%. And note now the peak was about 2 or 2.5 years ago and declining ever since. It has a small bump up into the green but now is declining again. So a big wave down should be coming as liquidity has been dropping for some time, and that does fit with some Elliott counts. It also fits with the feds stopping QE (at least for now) money printing. One reason I posted wave IV is not over yet, in my opinion.
https://spiderfinance.com/2016/05/15/global-liquidity-conditions-still-negative/
Thanks Peter! Very interesting….
Great link…..thanks for sharing Peter.
Thanks Peter!! Good info
Great info! Someone also posted earlier that apart from stock-buybacks things would be even more dire. Makes sense with all the baby-boomers leaving the work-place with resulting portfolio redemptions….
Don’t know if folks have seen this news
Fed’s Lacker says case for June rate hike looks ‘pretty strong’ http://www.marketwatch.com/story/feds-lacker-says-case-for-june-rate-hike-looks-pretty-strong-2016-05-16
Maybe they think this has no teeth or truth…
They are full of S _ _ T! Talking up a rate hike BUT then they leave it unchanged.
They ALL LIE!!!!!!
You know what is really funny? These comments give great insight into how these folk few the intellect of the general American public. It is truly remarkable! It would be truly funny it were not so sad…
Actions ONLY… no more words as words are ALL LIES!!!!
That should be “view the intellect” Am I suffering from spoonerism??!!
Or maybe dyslexia…. 🙂 🙂
I wonder is his nickname is “Lackluster”…? 🙂
Have we broken above the channel? My chart hasn’t yet?
I was looking at the minute B channel for my chart….I am not sure what portion you are looking at…
Same channel as yours from 10th may until today,
Currently this last hourly spike just reached my top channel and reversed so far?
I have something more important to pass on, getting it typed up now with a link for those of interested to consider it or who have not seen it.
Channel break somewhat tepid…will probably fall back to test before final move up…
We may still be in Minute B (a is done, b is done, now in c). Then Minute C will start the next day or two.
Chart? 🙂
You mean something like this?
Next move down being a 3 or a 5 should be telling – quite alot of alternates on the table atm.
Yes, with various corrective waves possible such as throwing in a “X” or something. My number one question is the market going up or down because I’m a speculator risking money, exact wave counts are secondary.
Noting to all reading – with my arithrits in my fingers and hands it can be painful and time consuming for me to do charts all the time. That is why I don’t do them a great deal.
Olga to the rescue. Sorry Peter you did mention that limitation.
The only comment is this would start to make minor 2 look a bit out of proportion with minor by the time it was done one imo…
If (a) finished where I have it as an ALT, price should move up to 2070 to avoid a truncation.
The move up from this morning looks more like a C wave than a B wave to me so I prefer the ALT if this count is playing out.
I agree. I expect it to end with a bang instead of a whimper, maybe an extended fifth. Trying to put some labels on a chart with great sheepishness when I look at Olga’s finesse…. 🙂
Correction: noting on Olga’s chart the bottom low should have a “b” on it, in “c” up now to complete B minor.
Yeah – as per my ALT (a) I presume for an expanded flat (b)??
I prefer that – todays move up looks like a c wave.
If that ALT labelling is correct, then this current wave up needs to get above 2070 to avoid a truncation and rare running flat otherwise it has very low probability imho.
Peter, that sounds like a valid possibility. However, at some point the count doesn’t have the right look. If we are only in sub-miniutte c of minute b of minor 2, I would think Minor 2 would look disproportionately long to Minor 1 and therefore is a lower probability.
I am done viewing the day to day! This thing is not going to happen!
Hang in there Joseph. Final wave up underway…should go just above 2080.00
I am in full agreement that we are in minute c of minor 2 and we are looking for fives waves to complete c & minor 2. So far on the 5 minute chart I can count a 1-2 completed and possibly at the top of the 3rd wave. If we develop a 4th wave and 5=3, we will have another 20 points up to go from the bottom / end of the 4th wave.
That being said, refer to Olga for expert and detailed analysis.
Yep. Channel break suggests minute b done….
Out of final upside hedge in the form of UVXY puts for 25%. Apart from IYT short position, short term market neutral…
I really need to get my glasses; completely forgot about a few UVXY puts I had until they hit my STC target and executed…
Look for UVXY to make the turn ahead of Mr. Market. Any green printed today is huge heads up imo…
Shaking the trees… 🙂
Minor two probably an expanded flat and should complete today….look for late day fade…
Or was Minute B of Minor 2 a double zig zag?? That would mean we are now in Minute C of Minor 2 which should rip higher (but a regular flat so only to around 2085).
We’re probably just finishing Minuette 1 of Minute C of Minor 2 now if this count is playing out. Clue will be if the next move down is a 3 – then this will be my favoured count – Mr Market never makes it easy!!
Sounds and looks good to me. Watching from the sidelines for now…
Wish I was! – been denied a final wave down *yet again* by Mr Market.
Think I’ll start bailing at the end of 3rd waves (UVXY usually better there anyway), then I won’t get caught out by moves like today. Wasn’t around when market bottomed on Friday so couldn’t close any of my position.
Will see what the next move down brings – if it’s a clear 3 I’ll bail on some of my position, albeit not at the price I was expecting to get 🙁
Mr Market is as slippery as an eel….I also bailed on my hedges and bought back UVXY calls a wee bit early over my confusion about that fourth wave but action playing out pretty much as expected….
I too was expecting one more mover lower to reload upside hedges…
VIX barely lower…a significant divergence from market price action…
Don’t feel too badly. I was looking right at the chart and totally confused sub-minuette one A and one of B… tall about clueless! Could have got another 30% on my calls and bought back my calls for 25% cheaper but for that error… 🙂
We should see at least one more enthusiastic cash dump just for good measure, in case a few cubbies still hanging on…the bears apparently only watching today…
Opening a few stink bids on UVXY calls in case we get a final big spike down….
Actually those zig zags should have ABC labels
Looking at Lara’s main hourly count, it looks as if sub-min one ended in the area of around 2077, so technically this makes the main count still viable until we violate that target; I do not think we have thus far…I think the “shake the trees” move still ahead…
I think that was Sub min 1 of Minuette a – we were in Minuette c so it’s the sub min 1 of Minuette c that is the invalidation.
Lara speaks about 2070 but also states “When the next five down for minuette wave (c) is complete” – which didn’t happen before the invalidation. As always everyone should trade based on their own judgement, certainly not mine.
I could be wrong (wouldn’t be the first time! 🙂 ) – but that’s how I interpret it from the EW rules and Laras comments.
Agreed, that’s how i read it also we have gone low enough for the expected flat just not low enough for the extended flat before a wave C higher.
Oops! That is what happens trying to read charts not properly bespectacled!
Sorry about that folks and you are absolutely right. Sub-min one of minuette C was much lower than what I was looking at and it has indeed been already exceed. Minute C up underway…no wonder what I thought was a fourth wave was looking so frisky! 🙂
Poss current action (Chart updated with ALT – maybe Minute 2 is an expanded flat??).
Atm it looks like simple nested 1,2s to me.
That makes sense to me. Nothing really scary about this move up so far. The banksters can do far better…trust me….bought back calls. Short term powder all dry and cannons loaded and ready to fire… 🙂
Thanks for the wave counts Olga. Looks good. 🙂
Has sub-min four violated sub-min one area yet? If not we still could see another wave down prior to C up….
This move up is running on fumes!
With that invalidation, and provided price remains below 2066 (or 2070 if the move down to 2043 was part of an expanded flat Minute 2) Minor 2 is very likely over imho, and we are at the start of Minor 3, seeing a series of nested 1,2’s.
With Minor 2 being so short timewise this is not what I expected to play out, but it is the best I can see atm.
During a bear market, surprises are to the downside. I need to shift my mindset from 6+ years of bullishness to a more consistent bearish disposition. This is not an easy task.
No question about the mid and long term scenario. The only question is whether minor two is over and I do not think it is. Everytime you find yourself second guessing the question of a third wave decline that is very reliable proof it has not arrived…
Much above 2077 probably means minute b down over and minute C up underway; it has to high enough and fast enough to make cubbies bail….
Just found that it’s also possible Minute B was a double zig zag which would mean Minor 2 isn’t over – I’l post the chart once I get it labelled.
There is another game that market makers play ahead of a big decline to rattle short positions. They post ridiculous and insulting bid/ask to make it looks as if short positions are worth far less than they actually are, often not even bidding the intrinsic value of options…beware; it’s nothing but a scam to run stops placed in the market.
As someone said, just because you are paranoid does not mean they are not out to get you! It occurs to me that there comes a point where a situation is so clear that it becomes evident to even a blind man, so to speak. Market are directionally driven primarily by sentiment, banksters notwithstanding, and we know that negative sentiment is the source of bear markets. The recent market top was historic in its optimism, and as night follows day, the opposite will be equal or greater to the downside. The short term bearishness will be relieved by the upcoming wave C as the cubbies bail.
As always, FWIW.
Cycles are showing a day or two upward choppy movement – then down, possibly forming the usual double bottom formation.
If I read it properly, all three bear hourly counts will be invalidated (short term only) with a move to 2056.04 which is the end of sub-minuette wave i (orange).
Yep – albeit this move up looks nearly done to me. Scary C wave impulse.
UVXY showing small div as is 1min RSI (atm)
EDIT – Div resolved now on both
If it invalidates, would you count minute b as complete and minute c underway towards 2085+?
Problem with that is that Minuette C of Minute B would be a clear 3 wave structure. I’d have to have a good look at it but it could mean we are seeing a series of 1,2’s to the downside (i.e. the begining of Minor 3). The base channel shown on Lara’s chart will be telling in that regard.
Going above 2066 would invalidate that (currently hypothetical) view.
For anyone else reading this, the above is not valid unless the current short term counts were invalidated (which at time of writing this they aren’t).
Short term count has now invalidated. I can always trust Mr Market to muck up my perfectly formulated plans!!
Next line in the sand is 2066 imho
76.5% of SP500 future trades at brokerage are short.
Thanks Peter 🙂
Yes, thank you very much Peter for keeping us informed of that.
Very striking how many capable analysts are calling for a market decline. One that I like, Sam Colllins, is actually recommended that traders go to half cash so he must be expecting something significant. Still looking like sub-min 4 will continue a bit higher…
Vern,
Some of the other TA folks are looking for a slight run higher and then plunge. Looks like they are getting big hitters lined up this morning starting with Buffet buying stake in Apple…:) Trying to manipulate index using the biggest % component
Buffet didn’t buy Apple… it was one of his young independent investment managers. Buffet had no input on the purchase.
The main street is spinning it as a Buffet pick 🙂
Of Course they are!
These guys are given X amount of dollars to manage and have complete autonomy… That’s a FACT!
The chart of apple completed a major five wave move to the upside months ago. Somebody has not been paying attention…Icahn apparently was 🙂
This comes right after Carl Ichan sold his billion dollar stake in Apple. Apple is leading the markets and forecasting what is to come.
Manipulation in full swing..:)
Sign of panic…! 🙂
I think the final run higher is going to be more than slight. It has to be violent enough to shake out the weak hands, and it probably will be…
Selling half my upside hedges on the current pop.
Waiting for more upside to buy back my UVXY calls…I vote expanded flat…
Based on what fundamentals?
My concern is that unless there was a significant change in fundamentals to support the ramp, it will be pretty darn hard to disguise the ramp.
Additionally, I expect Mr. Market to throw a significant enough fit to make FED weak again come June meeting and likely force them to give back the rate hike. That to me might be the impetus to ramp higher..:)
SPX neckline break pending…
Action in futures seem to militate against a minor three down underway so it is indeed looking like we get a completion of minute b down tomorrow-the best of all worlds imo…
Very interesting what is happening in Brazil. Looks very much like Ukraine redux.
Central banksters run amok. How I wish we would stop our meddling…not going to end well…. 🙁
I think we have an inverted hammer candlestick two day pattern on the weekly charts. However, I do not believe this is a bullish candle but rather it is quite bearish. If I read Nison correctly, interpreting this as bearish is permissible. Furthermore, Bulkowski makes this very clear. Here is the link:
http://www.thepatternsite.com/HammerInv.html
Here is the key thought from Bulkowski:
“An inverted hammer is a two line candle, also in a downtrend. The inverted hammer is supposed to be a bullish reversal candlestick, but it really acts as a bearish continuation 65% of the time. The overall performance ranks it 6 out of 103 candles, meaning the trend after the candle often results in a good sized move. ”
2 out of 3 times it acts as a bearish continuation pattern. That is a pretty high probability. This strongly favors the Bear Count Hourly Alternate I. It has a very high ranking of 6 out of 100+, which makes it very strong.
The fact that this candle appears on the weekly charts adds strength to it’s signal. This candle and interpretation add support to a strong downward move continuing next week. Along with McClellan’s projection of a collapse (based on NYMO) we need to be acutely aware of the possible collapse of equity markets next week.
Williams %R has crossed the -20 level and is headed down. The last time this happened was in early Dec. 2015 which was followed by an 80 point drop on the SPX the next week and the worst beginning of the year ever!
Just my thoughts. Have a joyful day and see you tomorrow in the pits.
“When the next five down for minuette wave (c) is complete, then the price point which will differentiate this main hourly wave count from the second alternate below is 2,070.78. A new high above that point at that stage would confirm this main hourly wave count and invalidate the second alternate below.”
Did you mean the first alternate? 🙂
Oops, yes, sorry I meant the first alternate.
Will fix that.
Thanks Verne!
Most welcome m’lady!
As you have noticed by now, I hang on your every word! 🙂
My goodness, coming from you Verne I take that as a huge compliment. Thank you!
#1
FWIW ..MaClellan now expecting a panic inducing selling to hit next week..
Ris,
When you speak of ‘McClellan’ do you mean the indicator or the person?
Very much in keeping with conclusion of a minor wave up. I have noticed a few more folk are now anticipating a corrective move; few think it’s going to be a major downside move. I really hope we get a bit more upward movement on Monday, even if only intra-day. A classic move would be a huge move to the upside that slowly gets fades as the day goes on and the early-bird traders get positioned.
MaClellan Financial a service similar to Lara’s. I use a variety of sources to get the information before trading the market.
Vern – I suspect Mr. Market probably knows a lot of folks are looking to jump into a short position. So in keeping with the past trend, I am expecting markets to open lower starting Monday so as to keep new shorts or potential shorts on the edge for that bounce..by the time they realize that the bounce is not going to happen, market would have dropped enough that they will start to second guess the risk/reward.
That expectation fits my prefered count which still requires a 5th wave down for a flat (or expanded flat if it goes below 2037 – which is what I am hoping for), before price rips higher.
I’ll be trying to catch the turn as low as possible if it plays out, so I can temporarily bail on a large part of my short position. If it keeps going down then that’s also fine with me, but if it shoots upwards and keeps going from the open it’ll become a bit more tricky to navigate (for me).
A possible initial move down is actually in keeping with the main wave count as it would complete sub-min five of minuette c of minute b. The delicious irony is that could give a potential even better entry than the one we missed at the end of minor one down. Futures that are down mildly could be an indication that this is the more likely scenario, and like Olga, would be my preferred outcome. I too would cash in some short positions and get prepared to buy back calls sold against my UVXY shares as well as cash out a few UVXY puts as and if the market bolts higher in minute C up. Futures ahead of really strong third waves down generally make it quite clear what is going to transpire at the open. As has been said so often, if you have to ask if it is a third wave, it’s probably not! 🙂
I cannot imagine how folk who are not looking at EW possibilities can avoid getting beaten up in this crazy market!
Vern,
What is the other guy saying based on Friday’s close and action?
They see a potential head and shoulders pattern in both DJI and SPX with DJI having broken its respective headline last week. They are calling the April 20 SPX top at 2111.05 minor one, and now see us in minor two to the downside. Targets are around 17000 in DJI and 1960-1969 for SPX. Their preferred wave counts are calling for new all time highs, but they do provide a bearish alternative that sees a top in place.
BTW, the neckline for DJI is around 17,600.00 so it may well double back to test the break…