
Upwards movement was expected as most likely for Thursday’s session. Price moved lower but not conclusively; a red doji candlestick was printed.
The situation short term remains unclear. The Elliott wave count mid / long term still looks right.
Summary: It is still somewhat more likely that tomorrow will see downwards movement to at least 2,043.77, then upwards movement to above 2,084.87 the next one to three days. Overall, it is still more likely that a second wave correction will continue sideways / higher for a few days. However, it is also entirely possible that a third wave down is in the very early stages. Look out for surprises to the downside. The larger picture is still clear: primary wave 3 looks like it is in its infancy. The target remains at 1,423.
To see last published monthly charts click here.
To see how each of the bull and bear wave counts fit within a larger time frame see the Grand Supercycle Analysis.
To see detail of the bull market from 2009 to the all time high on weekly charts, click here.
New updates to this analysis are in bold.
BEAR ELLIOTT WAVE COUNT
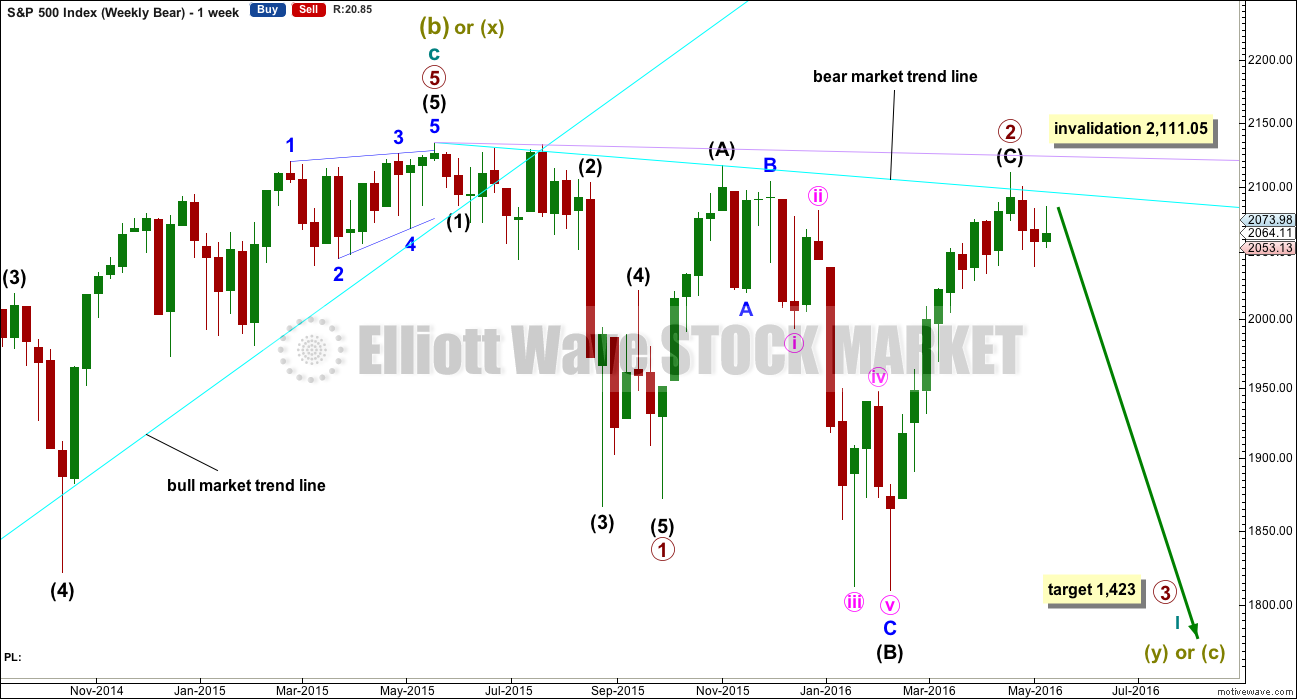
WEEKLY CHART
Click chart to enlarge.
This bear wave count fits better than the bull with the even larger picture, super cycle analysis found here. It is also well supported by regular technical analysis at the monthly chart level.
Importantly, there is no lower invalidation point for this wave count. That means there is no lower limit to this bear market.
Primary wave 1 is complete and lasted 19 weeks. Primary wave 2 over lasting 28 weeks.
An expectation for duration of primary wave 3 would be for it to be longer in duration than primary wave 1. If it lasts about 31 weeks, it would be 1.618 the duration of primary wave 1. It may last about a Fibonacci 34 weeks in total, depending on how time consuming the corrections within it are.
At the last high in April, the weekly candlestick has a long upper shadow which is bearish. The next candlestick completes a bearish engulfing pattern. That pattern is now followed by another downwards week, so it is reinforced.
Primary wave 2 may be a rare running flat. Just prior to a strong primary degree third wave is the kind of situation in which a running flat may appear. Intermediate wave (B) fits perfectly as a zigzag and is a 1.21 length of intermediate wave (A). This is within the normal range for a B wave of a flat of 1 to 1.38.
Within primary wave 3, no second wave correction may move beyond its start above 2,111.05.
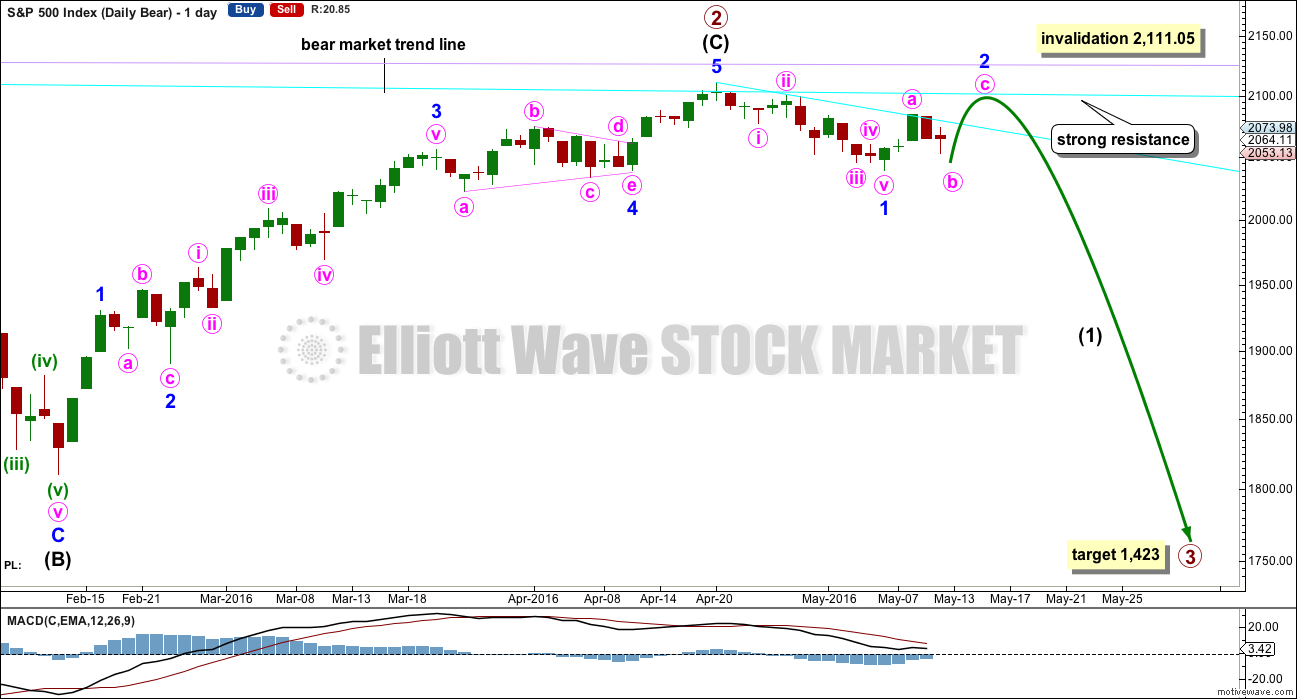
DAILY CHART
Click chart to enlarge.
If intermediate wave (C) is over, then the truncation is small at only 5.43 points. This may occur right before a very strong third wave pulls the end of intermediate wave (C) downwards. At the end of last week, price has confirmed a trend change with a new low slightly below 2,039.74.
The next wave down for this wave count would be a strong third wave at primary wave degree. At 1,423 primary wave 3 would reach 2.618 the length of primary wave 1. This is the appropriate ratio for this target because primary wave 2 is very deep at 0.91 of primary wave 1. If this target is wrong, it may be too high. The next Fibonacci ratio in the sequence would be 4.236 which calculates to a target at 998. That looks too low, unless the degree of labelling is moved up one and this may be a third wave down at cycle degree just beginning. I know that possibility right now may seem absurd, but it is possible.
Alternatively, primary wave 3 may not exhibit a Fibonacci ratio to primary wave 1. When intermediate waves (1) through to (4) within the impulse of primary wave 3 are complete, then the target may be calculated at a second wave degree. At that stage, it may change or widen to a small zone.
At this stage, if minor wave 2 has one or two more days of upwards movement to print one or two green daily candlesticks, then it would have a clear three wave counter trend look at the daily chart level. It does not have to do this, but this would give the most typical look. Another test of the bear market trend line, if that happens, should be taken as a gift from the market to enter low risk high probability short positions with an exceptionally good risk / reward ratio.
The equivalent minor wave 2 within the last big bear market was a 0.495 depth of minor wave 1 and lasted two days to minor wave 1’s five days.
The next possible equivalent minor wave 2 lasted one day longer than its minor wave 1 and was very deep at 0.81.
Overall, it is impossible to tell with certainty how deep and long lasting this minor wave 2 will be. Look out for possible surprises to the downside with a big third wave in its infancy.
Minor wave 1 lasted 12 days, one short of a Fibonacci 13. So far minor wave 2 has lasted only four days. The risk today is still that it could be over.
Minor wave 2 may not move beyond the start of minor wave 1 above 2,111.05.
A short term bear market trend line is added from the high of primary wave 2 to the first small swing high of minute wave ii in cyan. This trend line is about where price is finding resistance. It is copied over to the first alternate hourly chart and the daily technical analysis chart.
I will publish three hourly wave counts in order of probability.
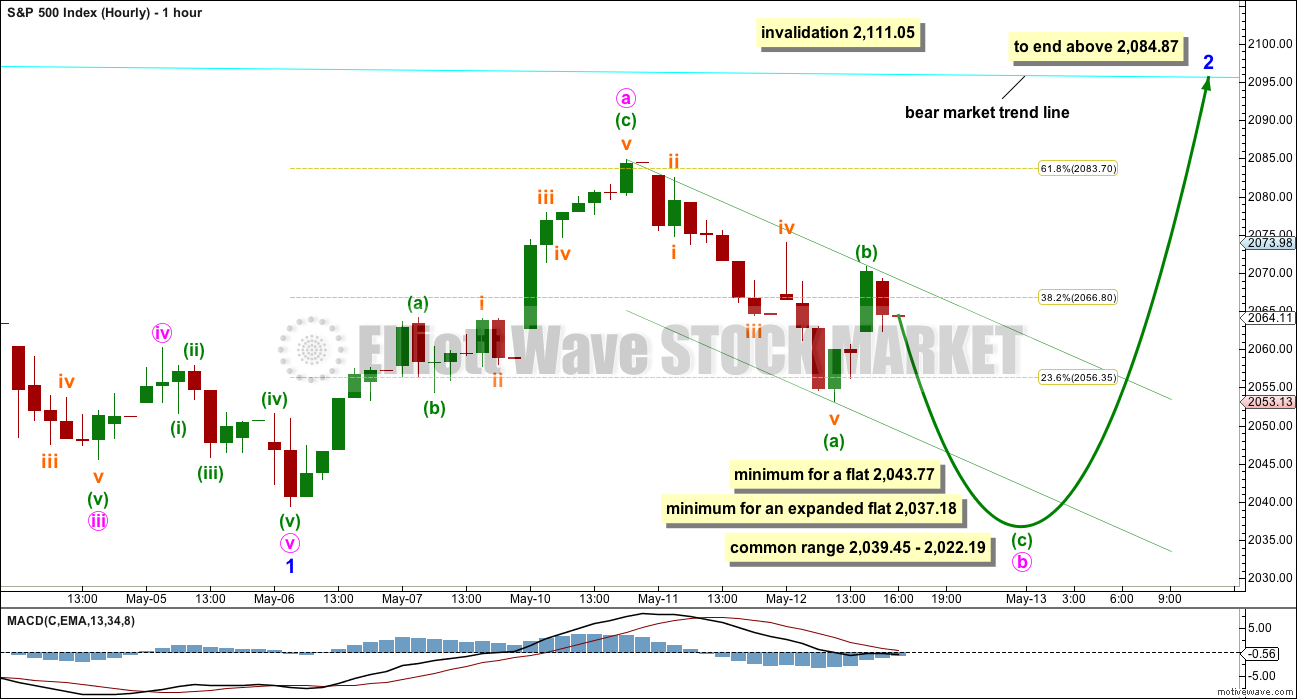
MAIN HOURLY CHART
Click chart to enlarge.
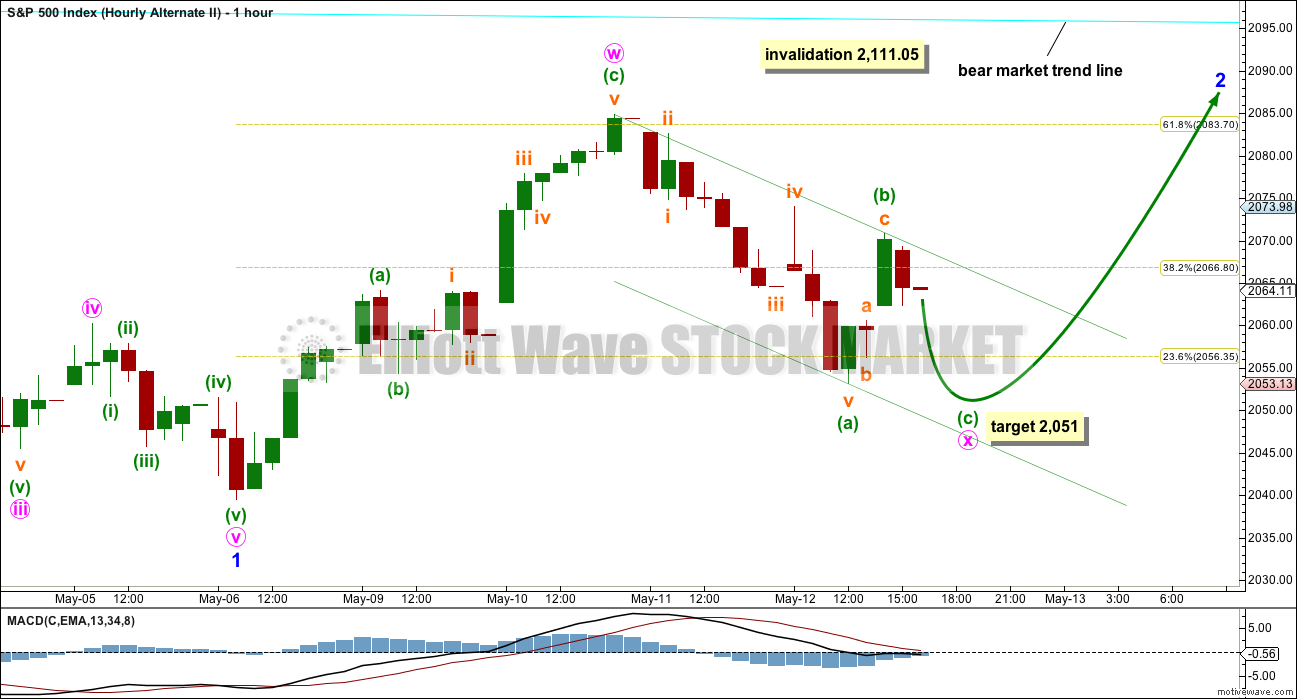
The most likely wave count for the short term picture would be a flat correction continuing higher for minor wave 2.
This would see minor wave 2 better in proportion to minor wave 1 and a clear three wave structure on the daily chart. This would have the most typical look.
Within a flat correction, minute wave a must subdivide as a three. Minute wave a fits as a zigzag.
Within a flat correction, minute wave b must also be a three. It too is subdividing as a simple zigzag. Minute wave b must reach down to a minimum 0.9 length of minute wave a at 2,043.77.
The most common type of flat is an expanded flat. That requires minute wave b to be 1.05 the length of minute wave a or longer at 2,037.18.
The common range for minute wave b within the flat is from 1 to 1.38 the length of minute wave a giving a range from 2,039.45 to 2,022.19.
A new low below the end of minor wave 1 is fairly likely for this wave count, but it would not confirm for us that minor wave 2 is over and minor wave 3 is underway.
When the next five down for minuette wave (c) is complete, then the price point which will differentiate this main hourly wave count from the second alternate below is 2,053.13. A new high above that point at that stage would confirm this main hourly wave count and invalidate the second alternate below.
When minute wave b downwards has met its minimum requirement at 2,043.77, then look for a complete five for minuette wave (c). Look out for a trend change as soon as that may be complete. A breach of the upper edge of the channel about minute wave b (drawn in green) would provide trend channel confirmation that minute wave b is over and minute wave c upwards is underway.
When the end of minute wave b is known, then a target for minute wave c may be calculated. That cannot be done today. Minute wave c looks likely to find strong resistance at the bear market trend line. Minute wave c would be very likely to make a new high above the end of minute wave a at 2,084.87 to avoid a truncation.
Minor wave 2 may not move beyond the start of minor wave 1 above 2,111.05.
Within a flat correction, there is no rule stating a maximum limit in length for a B wave. There is a convention within Elliott wave which states that when the potential B wave reaches twice the length of the potential A wave the idea of a flat unfolding is so low it should be discarded. That price point would be at 1,994.03 which is too low to be of much use practically.
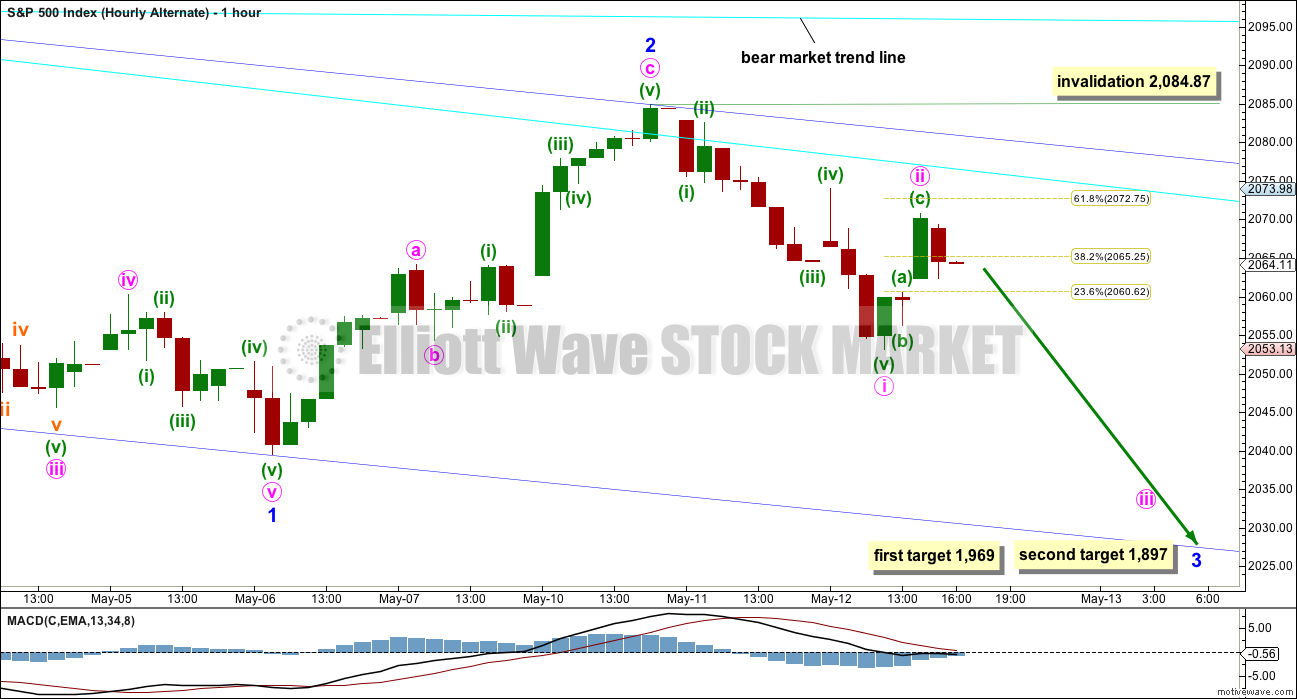
FIRST ALTERNATE HOURLY CHART
Click chart to enlarge.
Minor wave 2 may be over. With a five down and now a three up on the hourly chart today, this idea must be understood to be entirely possible. The implications are important.
At 1,969 minor wave 3 would reach 1.618 the length of minor wave 1. If when price gets to the first target minor wave 3 is an incomplete structure, or if price just keeps falling through the first target, then the next target is at 1,897 where minor wave 3 would reach 2.618 the length of minor wave 1.
Minor wave 2 is a deep 0.634 zigzag. The only problem with it is the proportion: it lasted just two days if it is over here compared to the 12 days duration for minor wave 1.
Minute wave i fits perfectly as an impulse. Minute wave ii may now be complete as a zigzag. It does look like a three on the hourly chart and it has corrected close to the 0.618 Fibonacci ratio of minute wave i.
If minute wave ii continues higher tomorrow, then it may not move beyond the start of minute wave i above 2,084.87.
If this wave count is correct, the important implication is an increase in downwards momentum over the next few days, which should start tomorrow.
The dark blue channel is a base channel about minor waves 1 and 2. Draw the first trend line from the start of minor wave 1 to the high labelled minor wave 2, then place a parallel copy on the low labelled minor wave 1. Along the way down, lower degree corrections should find resistance at the upper edge of the base channel. When the base channel is breached by downwards movement, that is strong confirmation that a third wave down is underway. Third waves should have the power to break below base channels.
When the next five down is complete, then it may be minute wave iii. At that stage, the invalidation point for this alternate will move down to the low of minute wave i at 2,053.13. The following small correction for minute wave iv may not move back up into minute wave i price territory. At that stage, the price point of 2,053.13 will differentiate this bearish wave count from the main hourly wave count.
SECOND ALTERNATE HOURLY CHART
Click chart to enlarge.
It is also possible that minor wave 2 may continue sideways as a double combination.
The downwards wave labelled minute wave x looks like an incomplete three. Because it needs to move lower to complete, when it is done it will be a relatively deep correction in relation to the wave up labelled minute wave w. Double combinations normally have deep X waves. Double zigzags normally have shallow and brief X waves. This X wave is now too deep to have a typical look for a double zigzag, so that idea is discarded.
Both double zigzags and double combinations are labelled W-X-Y, but they are very different structures. Double zigzags are part of the zigzag family and should have a clear slope against the prior trend. Double combinations are part of the flat kind of family and should have an overall sideways look. There may be no more than one zigzag in a double or triple combination.
Within a double combination, the second structure exists to take up time and move price sideways (which is the same purpose of triangles). To achieve this purpose the second structure in the double should end about the same level as the first structure.
If minute wave y is time consuming enough, then it may be able to end very close to or possibly touching the bear market trend line. Minute wave y would most likely be a flat, but it may also be a triangle.
The target for minute wave x to end is very short term. At 2,051 minuette wave (c) would reach 0.618 the length of minuette wave (a).
There is no rule stating a maximum length for an X wave within a combination. X waves within combinations may make new price extremes beyond the start of the correction, and are reasonably likely to do so. The same principle of B waves within flats will be applied. When downwards movement reaches 1,994.03 or below, then minute wave x would be twice the length of minute wave w, so this idea should be discarded based upon a very low probability.
BULL ELLIOTT WAVE COUNT
WEEKLY CHART
Click chart to enlarge.
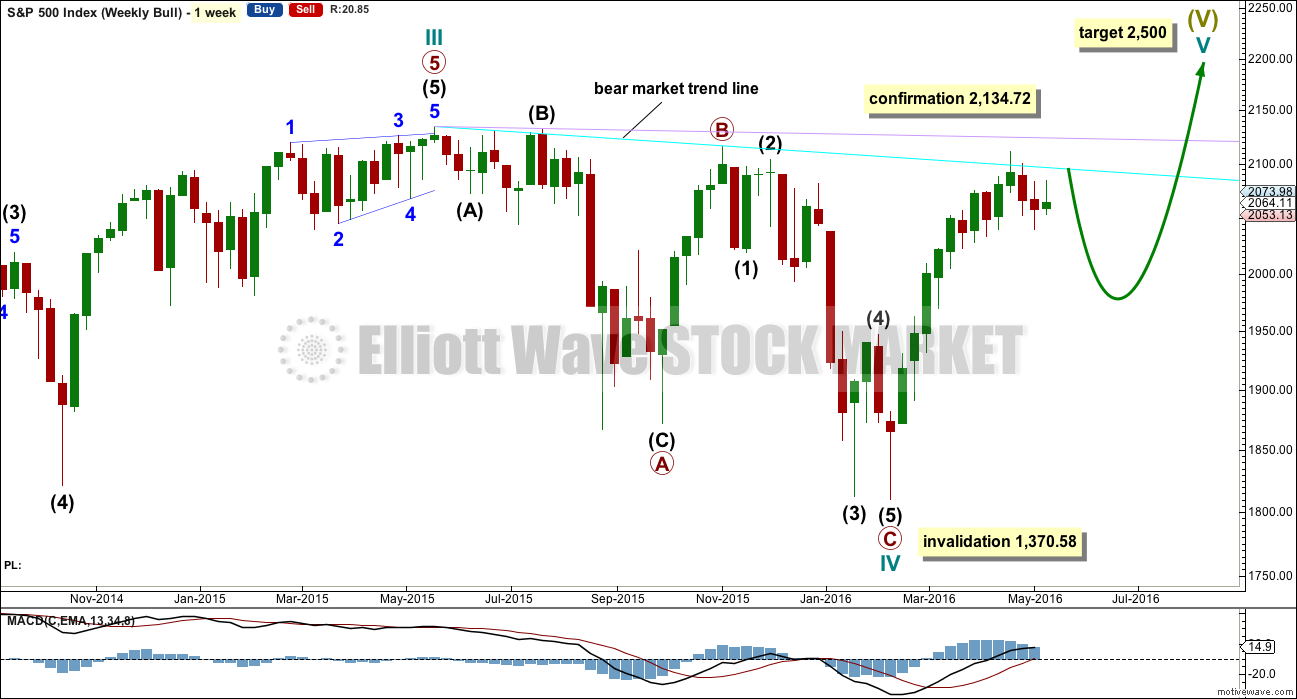
The bull wave count is altered slightly today in response to Peter’s charts and ideas. Cycle wave IV is still seen as a complete flat correction. Within cycle wave IV, primary wave C is still seen as a five wave impulse.
The change is in intermediate waves (2) and (3). Intermediate wave (2) is seen as complete earlier resolving the prior problem of its structure. Now it is a single simple zigzag which fits. Intermediate wave (3) begins earlier.
Now intermediate wave (3) has a strong three wave look to it on the weekly and daily charts. For the S&P, a large wave like this one at intermediate degree should look like an impulse at higher time frames. The three wave look substantially reduces the probability of this wave count. Subdivisions have been checked on the hourly chart, which will fit.
Cycle wave II was a shallow 0.41 zigzag lasting three months. Cycle wave IV may be a complete shallow 0.19 regular flat correction, exhibiting some alternation with cycle wave II.
At 2,500 cycle wave V would reach equality in length with cycle wave I.
Price remains below the final bear market trend line. This line is drawn from the all time high at 2,134.72 to the swing high labelled primary wave B at 2,116.48 on November 2015. This line is drawn using the approach outlined by Magee in the classic “Technical Analysis of Stock Trends”. To use it correctly we should assume that a bear market remains intact until this line is breached by a close of 3% or more of market value. In practice, that price point would be a new all time high which would invalidate any bear wave count.
This wave count requires price confirmation with a new all time high above 2,134.72.
While price has not made a new high, while it remains below the final bear market trend line and while technical indicators point to weakness in upwards movement, this very bullish wave count comes with a strong caveat. I still do not have confidence in it.
The invalidation point will remain on the weekly chart at 1,370.58. Cycle wave IV may not move into cycle wave I price territory.
This invalidation point allows for the possibility that cycle wave IV may not be complete and may continue sideways for another one to two years as a double flat or double combination. Because both double flats and double combinations are both sideways movements, a new low substantially below the end of primary wave C at 1,810.10 should see this wave count discarded on the basis of a very low probability long before price makes a new low below 1,370.58.
DAILY CHART
Click chart to enlarge.
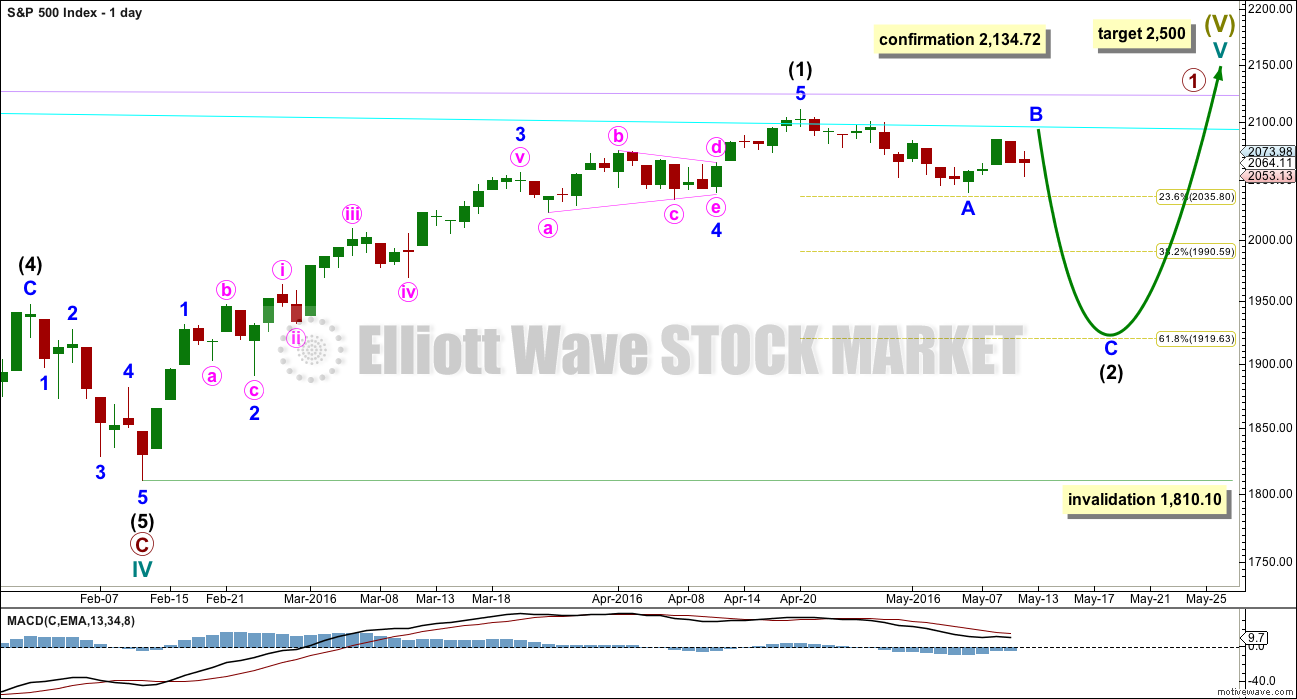
If the bull market has resumed, it must begin with a five wave structure upwards at the daily and weekly chart level. That may today be complete. The possible trend change at intermediate degree still requires confirmation in the same way as the alternate hourly bear wave count outlines before any confidence may be had in it.
If intermediate wave (2) begins here, then a reasonable target for it to end would be the 0.618 Fibonacci ratio of intermediate wave (1) about 1,920. Intermediate wave (2) must subdivide as a corrective structure. It may not move beyond the start of intermediate wave (1) below 1,810.10.
In the long term, this wave count absolutely requires a new high above 2,134.72 for confirmation. This would be the only wave count in the unlikely event of a new all time high. All bear wave counts would be fully and finally invalidated.
TECHNICAL ANALYSIS
WEEKLY CHART
Click chart to enlarge. Chart courtesy of StockCharts.com.
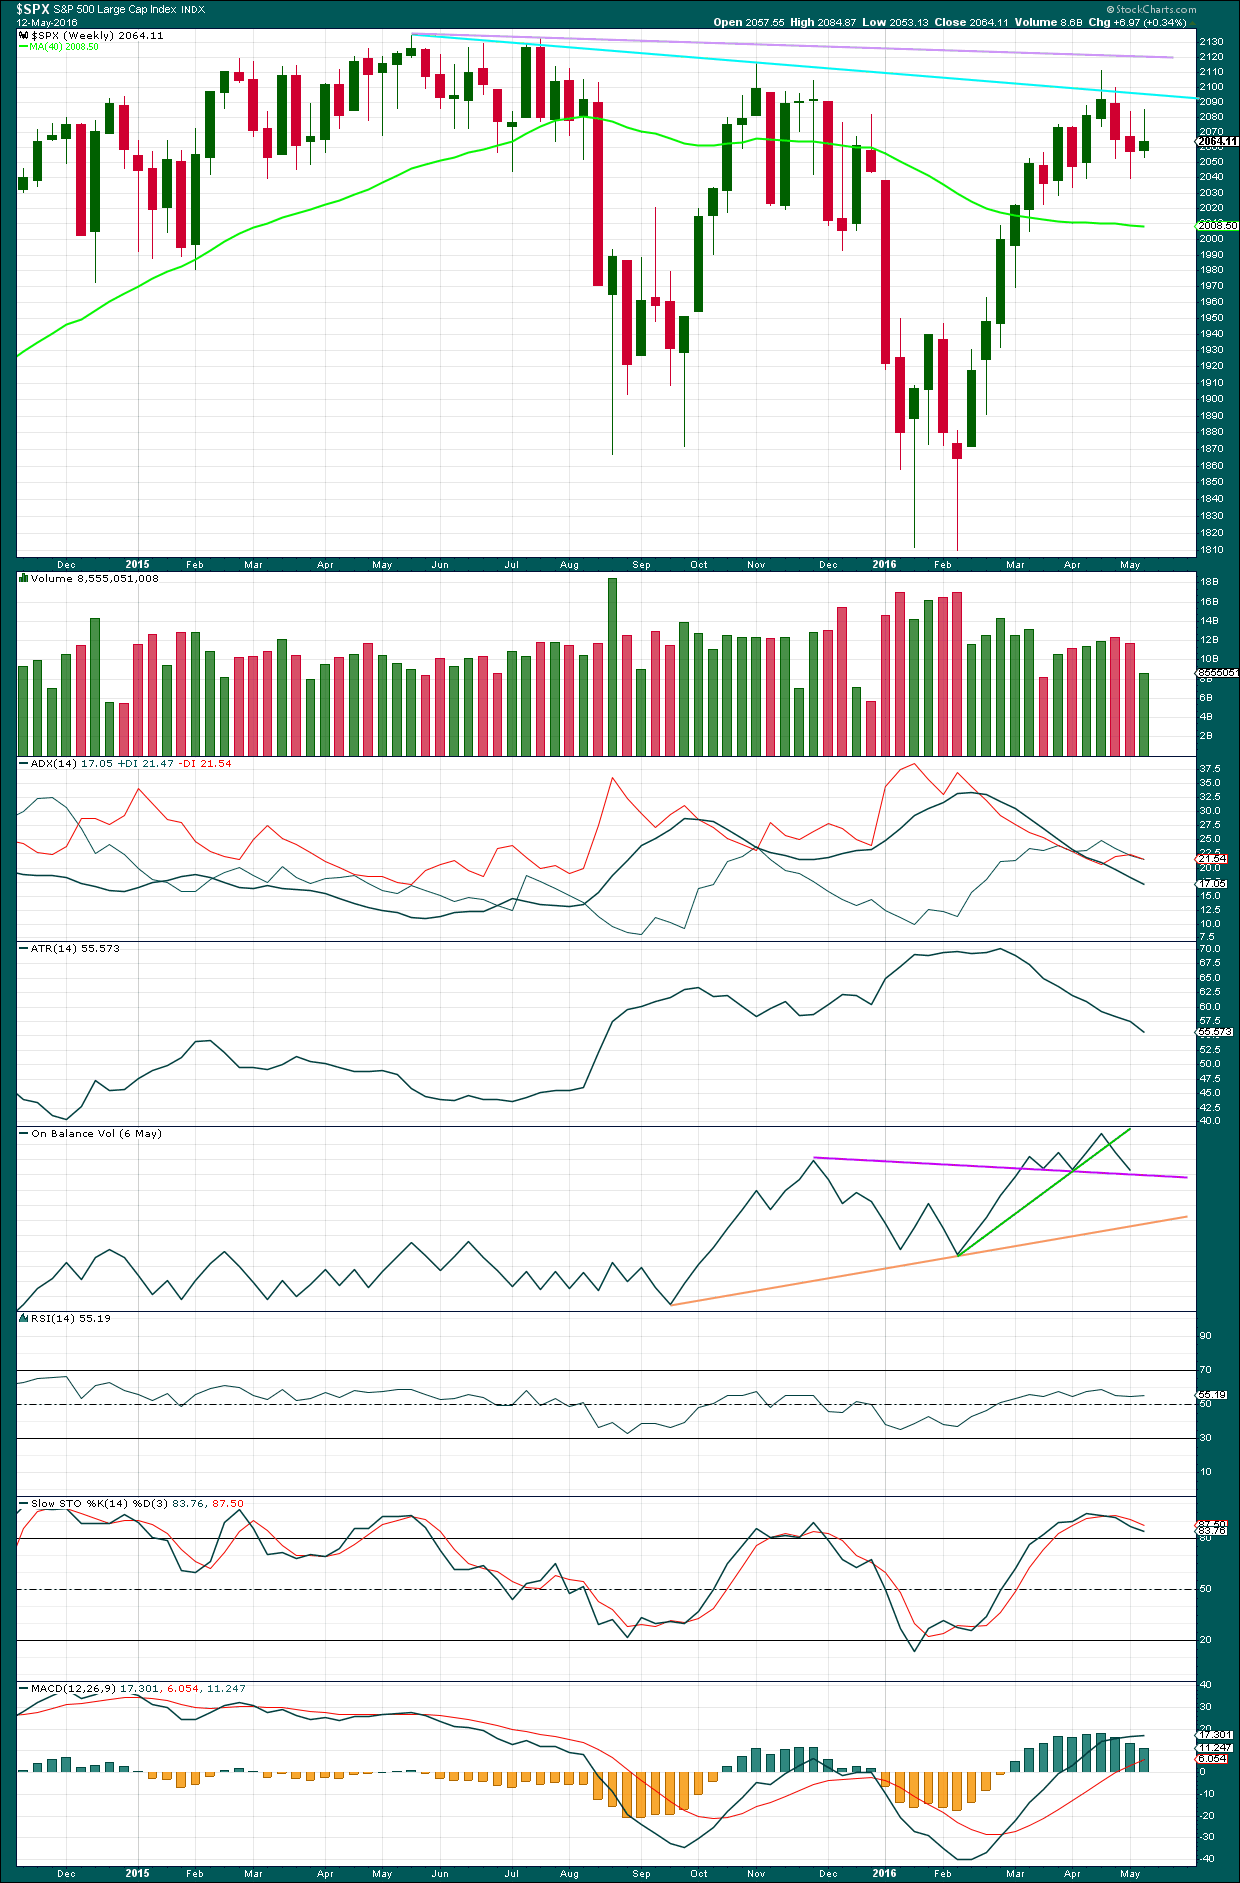
There is a bearish engulfing candlestick pattern at the last high. This has occurred at the round number of 2,100 which increases the significance. Volume on the second candlestick is higher than volume on the first candlestick, which further increases the significance. That it is at the weekly chart level is further significance.
Engulfing patterns are the strongest reversal patterns.
Now this pattern is followed by another red weekly candlestick. The reversal implications of the pattern are confirmed.
This is a very strong bearish signal. It adds significant weight to the expectation of a trend change. It does not tell us how low the following movement must go, only that it is likely to be at least of a few weeks duration.
There is a weak bearish signal from On Balance Volume at the weekly chart level with a break below the green line. A stronger bearish signal would be a break below the purple line. At the end of last week, OBV has come down to almost touch the purple line. Some support may be expected about here, so this may prompt minor wave 2 to bounce higher. This slightly supports the main and second alternate hourly wave counts over the first alternate. For the weekly OBV line to move up from here requires a longer lasting correction.
There is hidden bearish divergence between Stochastics and price at the last high and the high of November 2015. Stochastics has moved further into overbought territory, but this has failed to translate into a corresponding new high in price. Price is weak. MACD exhibits the same hidden bearish divergence.
After a period of declining ATR, it should be expected to turn and begin to increase.
DAILY CHART
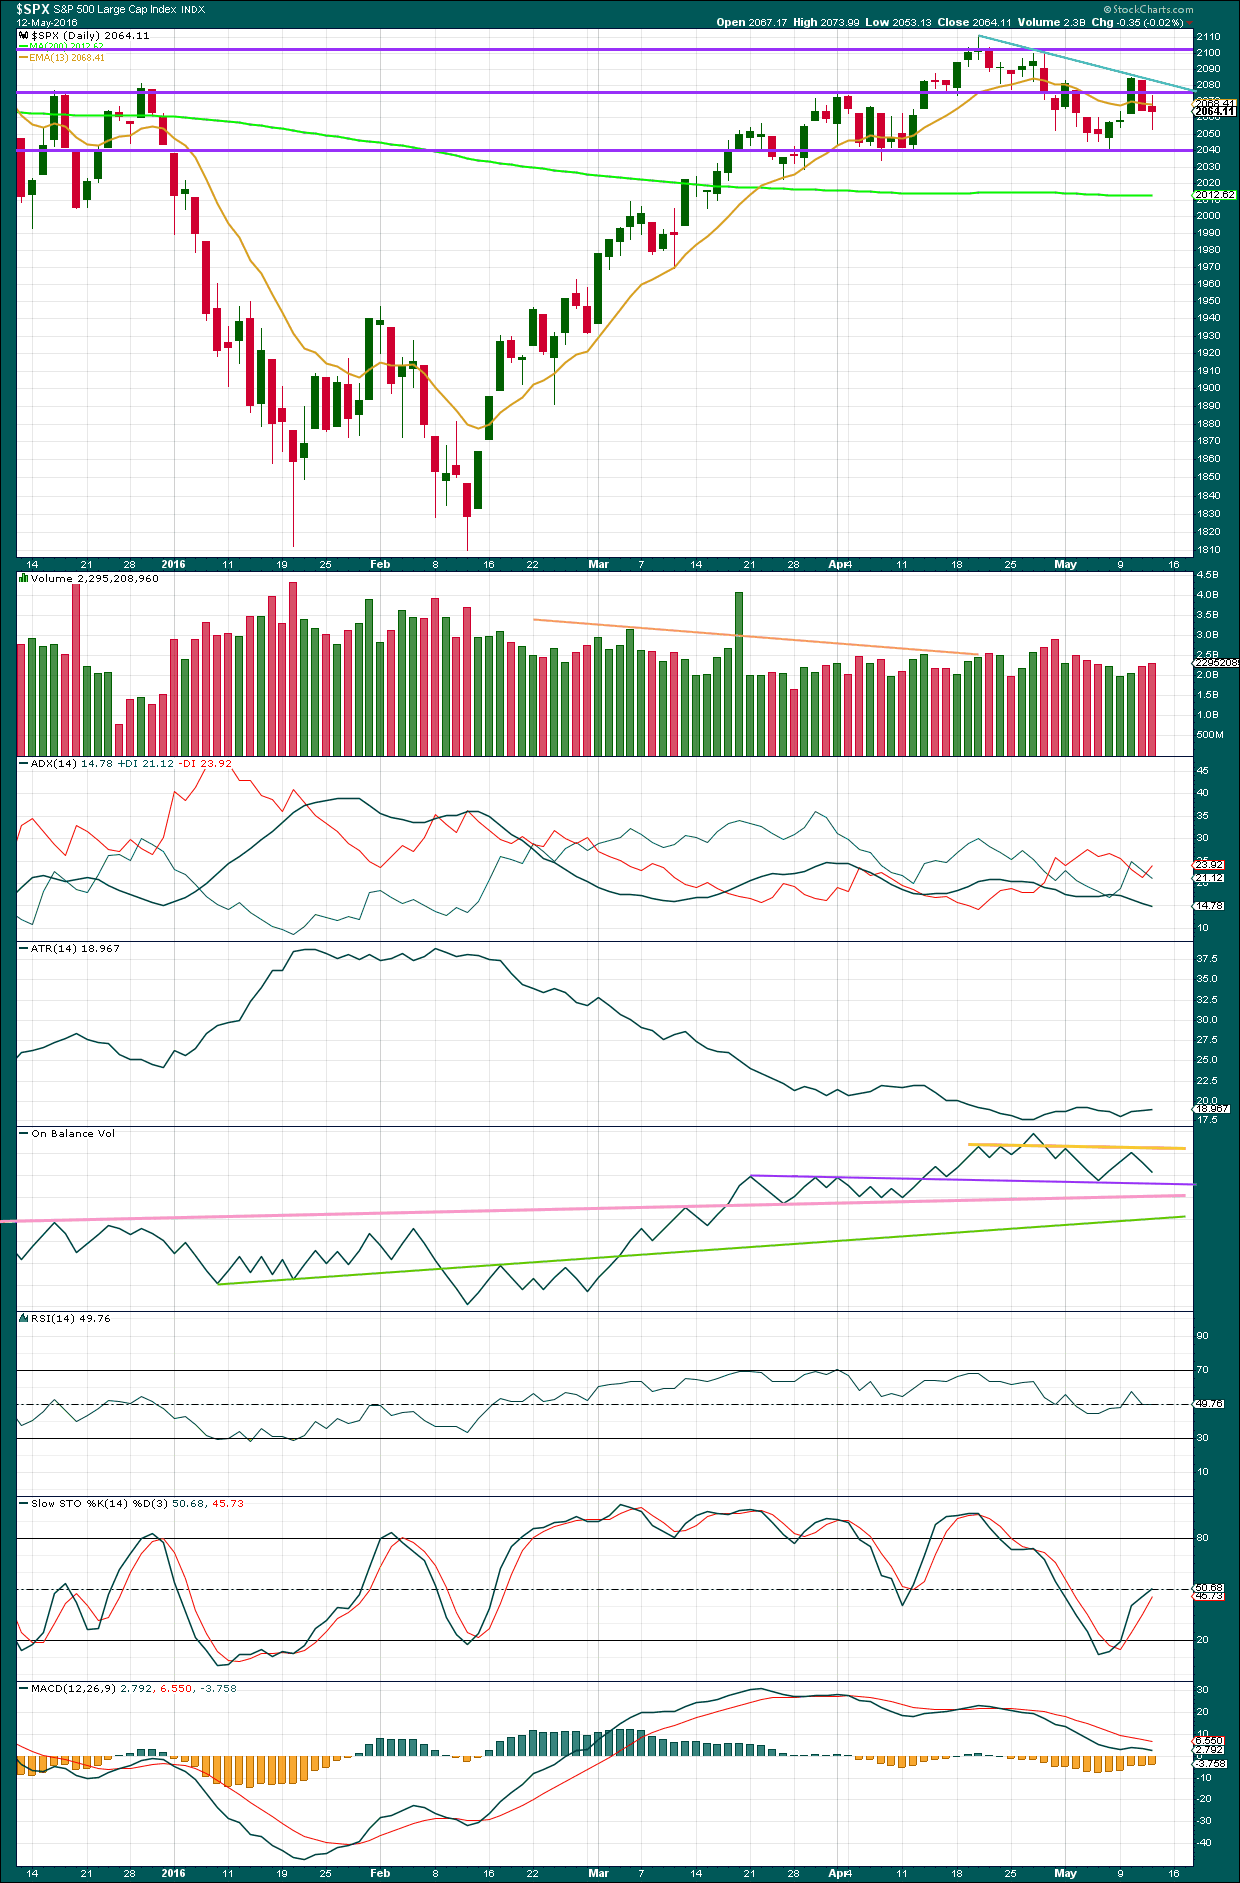
Click chart to enlarge. Chart courtesy of StockCharts.com.
Volume data on StockCharts is different to that given from NYSE, the home of this index. Comments on volume will be based on NYSE volume data when it differs from StockCharts.
As price rose for three days in a row, from the last low, it came with declining volume. Price today has overall moved lower and volume has slightly increased. There is support for the fall in price from volume. However, volume today remains lighter than the prior downwards days to the last low on 6th May. The volume profile continues to be bearish.
A new bear market trend line is added to this daily chart in blue. Price is finding resistance at this trend line so far.
ADX is still declining indicating that the market is not currently trending. This is a lagging indicator though as it is based on a 14 day average. During a consolidation, the +DX and -DX lines fluctuate about each other. Currently, a downwards trend would be indicated if the ADX line increases, but with the directional lines so close together this could change quickly.
ATR agrees with ADX as it is overall flat.
On Balance Volume has tested the yellow line and moved away. This supports the idea of upwards movement being over for now, but there are two problems with this view. It may support both the main hourly and second alternate hourly wave counts; the main hourly wave count could see more downwards movement for OBV to again test the purple line, then another wave up for OBV to again test the yellow line. The first alternate hourly wave count could see OBV move lower here and slice through the purple line. Both outlooks are equally valid from OBV. The other problem is the yellow line is not very long held and has been breached before, so it could be breached again. It does not offer strong technical resistance.
A breach of any of the purple, pink or green lines by OBV would be a strong bearish signal. At that stage, a third wave down would be expected to be underway.
RSI is neutral. There is plenty of room for price to fall or rise.
Stochastics is close to neutral.
MACD is flattening off as would be expected during a counter trend movement.
VOLATILITY – INVERTED VIX DAILY CHART
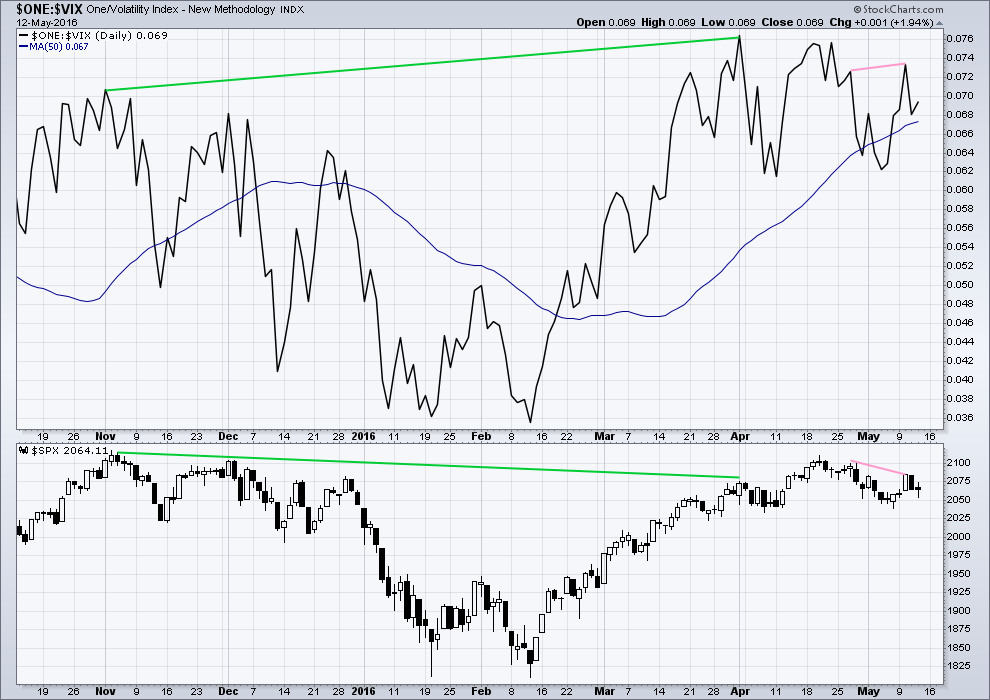
Click chart to enlarge. Chart courtesy of StockCharts.com.
Volatility declines as inverted VIX climbs. This is normal for an upwards trend.
What is not normal here is the divergence over a reasonable time period between price and inverted VIX (green lines). The decline in volatility did not translate to a corresponding increase in price. Price is weak. This divergence is bearish.
Inverted VIX has moved higher today indicating a decline in volatility. But price moved overall lower to complete a red daily candlestick. This is some small interday regular bearish divergence. It indicates the bears were weak during the session. The bears could not increase volatility for the session despite a new low in price and overall downwards movement. This is some small support for the main hourly wave count.
BREADTH – ADVANCE DECLINE LINE
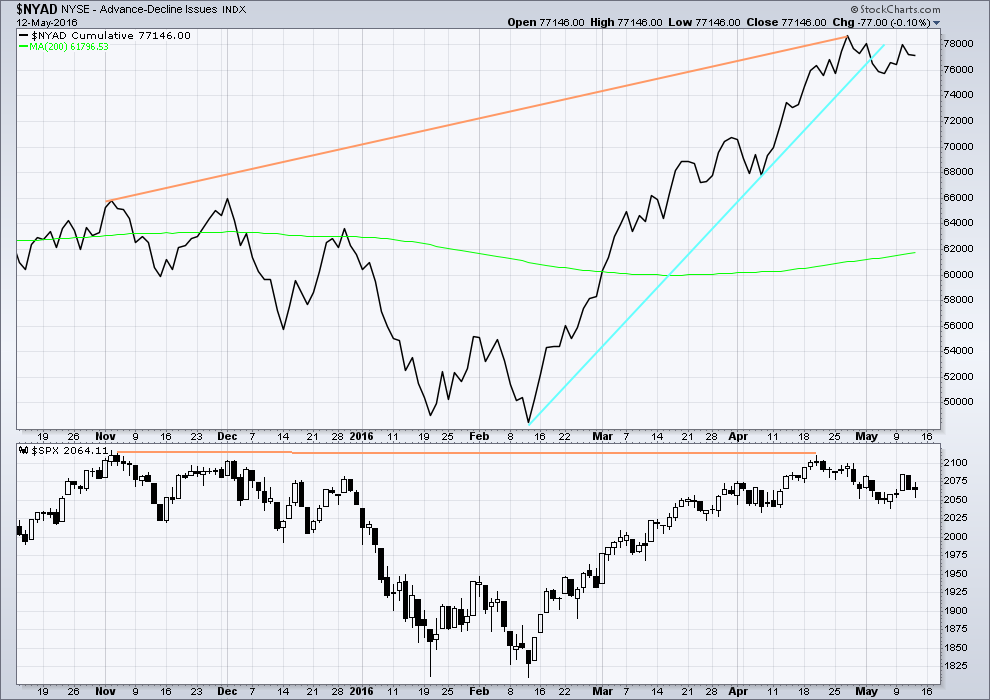
Click chart to enlarge. Chart courtesy of StockCharts.com.
With the AD line increasing, this indicates the number of advancing stocks exceeds the number of declining stocks. This indicates that there is breadth to this upwards movement.
From November 2015 to 20th April, the AD line made new highs while price far failed to make a corresponding new high. This indicates weakness in price; the increase in market breadth is unable to be translated to increase in price (orange lines).
The 200 day moving average for the AD line is now increasing. This alone is not enough to indicate a new bull market. During November 2015 the 200 day MA for the AD line turned upwards and yet price still made subsequent new lows.
The AD line is now declining and has breached a support line (cyan). There is breadth to downwards movement; more stocks are declining than advancing which supports the fall in price.
For three days in a row price increases while the AD line also increases. There is breadth to this upwards movement.
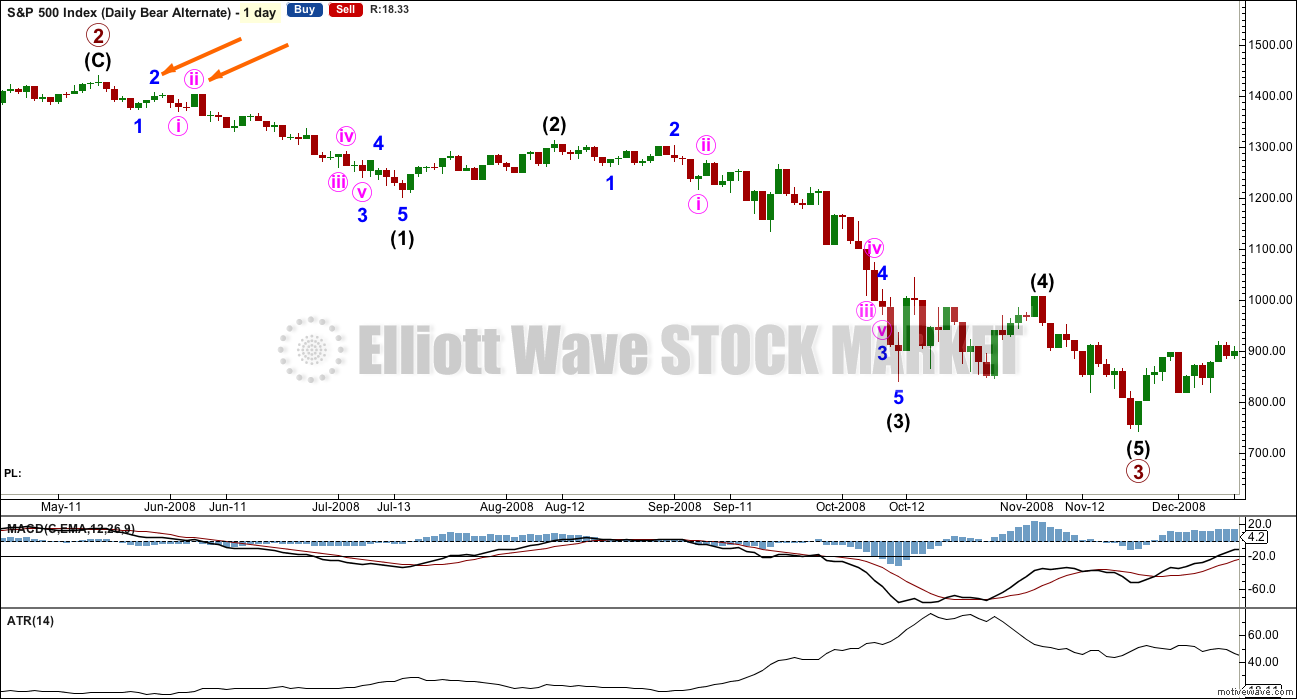
ANALYSIS OF LAST MAJOR BEAR MARKET OCTOBER 2007 – MARCH 2009
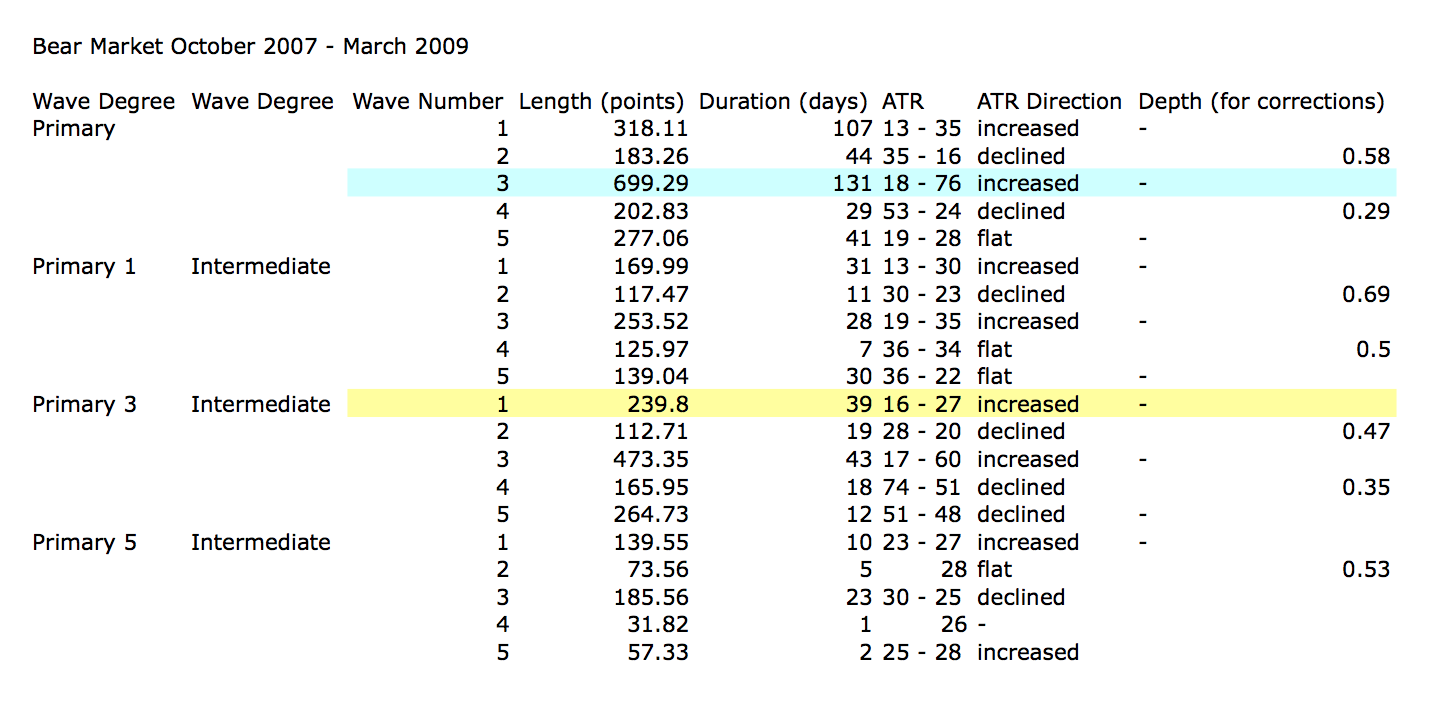
Click to enlarge.
In looking back to see how a primary degree third wave should behave in a bear market, the last example may be useful.
Currently, the start of primary wave 3 now may be underway for this current bear market. Currently, ATR sits about 19. With the last primary degree third wave (blue highlighted) having an ATR range of about 18 to 76, so far this one looks about right.
The current wave count sees price in an intermediate degree first wave within a primary degree third wave. The equivalent in the last bear market (yellow highlighted) lasted 39 days and had a range of ATR from 16 – 27.
Click chart to enlarge.
This chart is shown on an arithmetic scale, so that the differences in daily range travelled from the start of primary wave 3 to the end of primary wave 3 is clear.
Primary wave 3 within the last bear market from October 2007 to March 2009 is shown here. It started out somewhat slowly with relatively small range days. I am confident of the labelling at primary degree, reasonably confident of labelling at intermediate degree, and uncertain of labelling at minor degree. It is the larger degrees with which we are concerned at this stage.
During intermediate wave (1), there were a fair few small daily doji and ATR only increased slowly. The strongest movements within primary wave 3 came at its end.
It appears that the S&P behaves somewhat like a commodity during its bear markets. That tendency should be considered again here.
Looking more closely at early corrections within primary wave 3 to see where we are, please note the two identified with orange arrows. Minor wave 1 lasted a Fibonacci 5 days and minor wave 2 was quick at only 2 days and shallow at only 0.495 the depth of minor wave 1.
Minute wave ii, the next second wave correction, was deeper. Minute wave i lasted 3 days and minute wave ii was quick at 2 days but deep at 0.94 the depth of minute wave i.
What this illustrates clearly is there is no certainty about second wave corrections. They do not have to be brief and shallow at this early stage; they can be deep.
This chart will be republished daily for reference. The current primary degree third wave which this analysis expects does not have to unfold in the same way, but it is likely that there may be similarities.
DOW THEORY
I am choosing to use the S&P500, Dow Industrials, Dow Transportation, Nasdaq and the Russell 2000 index. Major swing lows are noted below. So far the Industrials, Transportation and Russell 2000 have made new major swing lows. None of these indices have made new highs.
I am aware that this approach is extremely conservative. Original Dow Theory has already confirmed a major trend change as both the industrials and transportation indexes have made new major lows.
At this stage, if the S&P500 and Nasdaq also make new major swing lows, then my modified Dow Theory would confirm a major new bear market. At that stage, my only wave count would be the bear wave count.
The lows below are from October 2014. These lows were the last secondary correction within the primary trend which was the bull market from 2009.
These lows must be breached by a daily close below each point.
S&P500: 1,821.61
Nasdaq: 4,117.84
DJIA: 15,855.12 – close below on 25th August 2015.
DJT: 7,700.49 – close below on 24th August 2015.
Russell 2000: 1,343.51 – close below on 25th August 2015.
To the upside, DJIA has made a new major swing high above its prior major high of 3rd November, 2015, at 17,977.85. But DJT has so far failed to confirm because it has not yet made a new major swing high above its prior swing high of 20th November, 2015, at 8,358.20. Dow Theory has therefore not yet confirmed a new bull market. Neither the S&P500, Russell 2000 nor Nasdaq have made new major swing highs.
This analysis is published @ 11:14 p.m. EST.
DJT is down hard. I can see now a nice five down for DJT on the daily. Maybe it’s ready for a second wave correction at the same time S&P completes minor 2?
FTSE is printing a green candlestick for Friday.
Shanghai has stalled for a small correction these last four days. Printing a red doji today.
Singapore also stalled the last four days, printing a green candlestick today.
The SPX Weekly 200 Day MA is within striking distance now at 1834.98…
So when 1810.10 is taken out, this time the Weekly 200 Day MA also will be taken out.
I missed my entry to go short today, had the correct direction….but hats off to trader Quang Vo for the bearish Harami candlestick he called 3 days ago for this little drop we’ve had.
Now that I update the alternate chart (minor 2 as complete, minor 3 underway) I realise that the important price point will be 2,070.78, not 2,053.13.
Before 2,070.78 is passed though the green channel on the main hourly chart would be the early warning that the main count is right and this alternate is wrong..
If this count is right then price should accelerate downwards. Corrections are becoming more brief and shallow.
When this impulse which is unfolding from the high of 2,070.78 is complete then if it is not long enough to be minute iii in its entirety it may only be another first wave. The following second wave correction may not move beyond its start above 2,070.78.
The pink channel here is the same as the green channel on the main hourly chart. Here it is correctly termed a base channel. Corrections along the way down should find resistance at the upper edge. The third wave should have the power to break below support at the lower edge.
So to the downside a breach of the pink and / or blue channels would be a strong warning that this may be the correct wave count. Third waves should breach base channels.
Here’s the main hourly chart updated.
Minuette (c) so far is subdividing nicely as an impulse. The fourth wave of subminuette iv looks to be currently unfolding.
If this is followed by a new low that would be subminuette v and the structure would be complete.
Target 2,039 is for minuette (c) to reach equality with minuette (a).
Price is perfectly sitting within the channel. Use that, it may show support for the end of this move, and when the channel is breached by upwards movement it will indicate a trend change.
The target would see minor 2 technically a regular flat, not the more common expanded flat. A regular flat normally has a C wave which is about even in length with the A wave and normally ends only a little beyond the end of the A wave, not substantially.
A regular flat may not be able to bring price up to touch the bear market trend line.
If my target is wrong and price reaches down to 2,037.18 or below then minor 2 may be an expanded flat. They normally have C waves 1.618 X the A wave, that would be able to take price up to touch the bear market trend line.
Good morning every body 🙂
Nice to see downwards movement as expected, and nice to see the minimum requirement for the flat is met.
As Olga says, this downwards wave has so far 1-2-3 and needs 4-5 to complete.
Once that is done the price point which will differentiate the continuation of minor 2 up as an expanded flat from the fall down of a possible minor wave 3 is 2,053.13. That is going to be a very important price point for us next week.
We’ve still got Wave 4 and 5 to go – should easily make it below 2039 for an expanded flat face ripping (c) wave up on Monday.
Right – I’ve really gotta go!!
bye Olga, play well,, do a hand stand on your piano for me..just make sure you have yer shorts on.
Bye Olga, you can pass the baton to me
Bouncing off the important 2043 pivot…
I see no importance in 2043… Why do you say it is important?
Laras minimum for B, if thats what it is, I hope it blows right though
That’s just a possible count and a min. for it, no major significance.
lower edge of lara’s hourly trend channel (green channel on main hourly count)…2043.77 level also a target minimum for this to be a flat
BLACK FRIDAY???
It is Friday the 13th!
15% or 25% down day??? or coming???
nearing lower channel on hourly
bounced right off the lower trendline
Looking at the hourly could this be the 3rd of a 5 down with 1 ending at 2053.13…?
I have to say I am starting to wonder if this is how developing impulses get going in the brave new era of determined banksterism…. we should be seeing a more vigorous bounce if one is coming…
Behaviour from this market over the year from the ATH certainly has seen somewhat slow starts to downwards waves. Particularly that first one.
Obama and affiliated globalist criminals (banksters, secretary of treasury, etc) desperate to keep the crash from happening on Obama’s watch–hoping to pin the inevitable on next POTUS. How long can they hold back a tsunami ?
SPX 50 day MA 2054.74….bulls going to try and hold this level. Oh for a flush to 2040!!!!
Something’s gotta give…
3rd waves and C waves can look so much alike.
At 2049, we are currently below the 13, 34 and 50 day moving averages.
The lower Bolinger Band on the daily chart is about 2040+. Strong resistance.
Folks, what we have here is a failed bankster hijacking. They blew a ton in overnight futures and a whole lot more today….
Eventually they run out of money!
Nah, they just print some more 🙂
It’s when they run out of suckers to take the debt that it crashes.
Yes! It’s all monopoly money–just an entry into a computer screen. Zero actual cost–could go on forever except for eventual dis-belief of the masses. Smartest guy in the room is a 65 yo accountant in basement of FED, the rest are just crooks and manipulators.
Short position on transports (via IYT ETF) springing to life. It may be acting like a canary in the coal mine and signaling limited SPX upside…I still think this move down is a head fake…I could wrong of course… 🙂
Fed chairwomen I believe speaks shortly this afternoon now. Sorry state we are in when the “free” markets hang on her every word.
I agree. Maybe that’s what just created the small spike higher in UVXY a few minutes ago. I stay away from any ‘news’ / talking heads whilst trading.
I don’t have a Scooby Doo what’s going on most of the time!!
Most wise!
To be fair – she is probably the markets biggest shareholder. They have to show some respect 😉
Someone just lit a flame under UVXY – shot higher before S&P started going down.
Short term bearish imho.
Triangle count below invalidated. Short term line in the sand 2066.32
Yep. Whoever bought my calls must be all smiles! 🙂
Strange price action. This is what I expected would unfold out the gate; did not think it would take all session with a distracting triangle in the middle.
Triangle got busted I think – was just a straight 1,2 with 2066.32 being the top of Sub min 2 of Minuette (c) of this Minute B wave down if my count is correct.
We should now be in a 3rd down of the final c wave down to finish Minute B then fly back up to the bear trendline in Minute C on Monday. I expect this third wave will extend so we might see some retraces, but it should stay below 2066.32 – that’s my stop atm.
Chart of that idea (always easier than words!).
I’ve got a gig again tonight so I’m outta here – have a great weekend everyone 🙂
Yep. Expect the kitchen sink for minute C up which I thought we would complete today.
We are getting long waves at smaller degrees. The next wave down should be a doozy…I am shorting anything that moves next week…. 🙂
Idea for current action – triangle may go sideways for a while longer to complete waves D & E.
If I’m rushing the count then might currently only be in wave B of the triangle.
Below 2053.16 I’d scrap the idea.
Peter – you mentioned a target around 2072 earlier – if you have a count in mind would appreciate if you could post it (If you dont label your charts (as is often the case with me – as it changes too often at small degree) then just very basic labels will do…. I’ll get the idea).
Failing that – just a small description of the count would be very useful.
My cope out is I have arthritis in my hands/fingers so it is laborious and painful for me to do all the minute and minuette labeling such as what you and others do, I’ll still go short around 2072 area if it gets up there yet. Of course putting in a stop loss above too.
Plus I’m new here and should defer to the longer timers like yourself, so will watch more for now versus over commenting.
I’m more for the larger trades, using exponential cost averaging in. Getting stopped out 10 times is fine, then let it ride the longer trend.
No worries Peter – was just wondering if you were seeing something I wasn’t. If you see anything suspicious in any of the counts I post (or an alternate that might get me side swiped) then please let me know – you might save me a fortune!!
Yeah I’m totally with you on not worrying too much about getting stopped out a few time with small losses / calculated risk. Keep it small then let the big ride pay for it (and then some). You’re clearly a pro 😉
Have a great weekend buddy (and everyone else) 🙂
Sentiment info
Thanks… This is useful. Do you trust he is using accurate current data?
Joseph,
I got a similar info from MaClellan folks indicating the Put/Call had hit extreme late last week or so. aClellan is looking for a bottom end of next week but unless markets sell off significantly between now and end of next week, I don’t know if 2039 is the only bottom we get to see…
Looks like a lot many people expecting the correction and market makers will not let that happen given the resources they have at their disposal…
I thought that shows Calls at an extreme currently.
No, I recall the statement that the put/call is surprising given the expected sell off. Important to note that QQQ and SPY showing low volumes thus showing no fear or very little fear in the markets.
Trouble with put/call is that when you look at ETF it skews the expectations I.e. Buying a put on ultra short Q is not same as a put on QQQ.
Probably accurate.
Here is a ratio chart that shows the same options data.
http://www.market-harmonics.com/free-charts/sentiment/putcall.htm#Equity
Another link for intra day put/call ratio
http://www.cboe.com/data/intradayvol.aspx
This is an excellent link… thanks.
Perfect. That’s what I was looking for. Thank you Ris.
Looking like minor two continuing as a double combination with a contracting triangle underway. Definitely not behaving like a wave C up. We should see a sharp break out of it to the upside to finish minute two I think…
Here is another interesting article questioning the capitalism…
http://time.com/4327419/american-capitalisms-great-crisis/?xid=newsletter-brief
We really don’t have capitalism anymore… It more a crony-cap system.
You pay for special favors in the Tax Code… for example the Solar & Wind industries and the electric car industry. DO you really need to give a $10K to $20K Tax credit to someone who can afford to purchase an $80,000+++ auto? NO you don’t!
Also, in a Capitalist system businesses need to fail and the system needs to cleanse… Now, nothing is allowed to fail… especially if you payoff the people in Washington and in the EU and in China & in Japan. Bailout Heavens!
In addition, a Capitalist System does NOT exist in an Over Regulated environment. A smart lean set of regulations should exist… certainly not what exists today. You have thousands of people working at Agency’s with nothing to do but write regulations and make s_ _ T up just to justify their jobs.
Sadly I don’t think most people–let alone Americans–know what capitalism or socialism is. There is one thing we can all be confident in when it comes to U.S. citizens that is we like our comforts. As soon as we start to feel the pain then we will all become capitalist again.
Please expand on what you mean by this statement… I just don’t get what you mean?
“As soon as we start to feel the pain then we will all become capitalist again”.
The Education system no longer teaches real History…
Please all go to your safe now!
Simply put once the U.S. becomes like Greece we will have to decide if we want a semi-free state or shall we prefer to dig ourselves deeper the way Greece is currently doing. In my opinion the future is stark.
Once US becomes Greece… Nobody left to bail anyone out!
That would be THE Worst Case Cleansing!
I don’t think we (US) get there… Something has to give this year IMO!
Do you all understand what all those bad Revenue & Earnings Reports Show this Quarter? No where left to run and hide!
Are there any other educated accountants out there that understand this stuff??? It’s not just numbers and words in a report!
2072 area should be a good short today to hold over the weekend.
Possible small inverted H&S pattern set up. Neckline connects from yesterday’s open to late afternoon high.
Key word here is “possible” and something to keep an eye on….short term
Very short term.
So we have a higher low then yesterday’s low…at least so far, if we take out yesterday’s late afternoon high, then short term bull is in control.
In light of all the manipulation that is going around in the markets around the world, what is the real likelihood that technical analysis will work in the short term (timeframe weeks/months/year). These folks have unlimited resources to continue manipulating the markets. I know one day this all might fail but that day might be in future that might be 5-10 years from now. I am just wondering if the game is rigged how best to leverage the TA. Any suggestions/thoughts?
Two weeks of trading to reach a minor 2
Registered sides of
The same models are available to Big Boys with lots and lots of money. Unless, we see a change to constraint their ability for manipulation the projected timing will not work as expected. Hence the question, if we can’t use the TA for timing, is it not more of an academic exercise than something real?
At market highs (and we are still close to an ATH) technical analysis becomes unfashionable.
Google can show you a huge depth of derision for technical analysis.
There are plenty of traders who don’t use technical analysis, they use fundamental analysis.
So there are plenty of money managers and traders out there who aren’t using the tools we are using.
Elliott wave is the most derided of all TA methods. It’s considered woo and BS by a huge number of market participants.
So the big boys may know of our methods, but they may not necessarily be using them.
The scale of central bank intervention is astounding. Buying these assets is one thing, unwinding these positions will be another. Do they expect to hold these assets forever? Unwinding positions of this scale would bring the markets to their knees and would also likely incur huge losses.
“Navigating During A Period Of Extreme Central Bank Intervention”
http://www.ciovaccocapital.com/wordpress/
Dave,
I am in agreement about the impact when they start to unwind but so far nothing is on the horizon that looks to be forcing their hand to unwind…especially if they are all in this together. Challenge that I see as a retail investor is how to time it cause if we can not use the TA for timing the market action, we are for most part trying to follow the market moves and catch them after they have started not proactive in planning them with some TA confidence.
Agreed, the central bank distortion on market dynamics can’t be overstated, and it messes up an individual investor’s market timing skills as a result.
Central banks buying bonds is one thing, their large scale intervention in the equity market is another. I agree, that this central bank buying makes TA moot because all the market does is go up. So all that is left is bullish trend following. Which works until someone yells fire in a crowded theater.
We have all seen the TA isn’t working as well as it has in the past. Between the central bank buying, and algos that are programed to work in concert with the buying, the individual investor suffers.
This could all go pear shaped pretty quickly, and if there is a sharp and prolonged meltdown, central banks may run out of bullets.
EW is based on emotion! The algos & HFT’s take that emotion out of the equation in the short-term. I don’t believe they can effect Weekly or Monthly EW analysis… After all… emotion is behind the design teams so ultimately it will play out.
Emotion forms the natural counts or waves.
No question in my mind the banksters have been providing inside information to their favorite hedge funds and algo boys to co-ordinate their efforts…
wordlessly 🙂
I used to have respect for Warren Buffet but his continuous endorsement and support of current administration, their financial actions makes me think if this is not part of the scheme from top 1% to protect their assets.
Do not be fooled by his jolly Santa Claus personality, Buffet was and is an inside player at the highest level. Remember Obama saying nobody is rich and successful on their own, it’s government that creates success. Buffet is a classic example. Soros, Buffet, Bill Gates, Zuckerberg are all tools of the system–they are not that smart or exceptional-they are creations of a system and play their roles.
Poss targets for Minute (b) of Minor 2 to end (all of which presume Minuette (b) ended yesterday @ 2070.89):-
(c) = (a) @ 2039.16 (which nicely meets requirements of a flat correction)
(c) = 1.618*(a) @ 2033.55 (for exp flat correction)
If Minuette (b) continues higher today then the targets above would change (maybe we’ve only had wave A of Minuette (b)??).
If Minute (b) goes below 1993 then an expanded flat correction playing out is very unlikely imho. Minor 3 would then most certainly become my highest prob count.
Until that point, only wave structure (and perhaps regular TA) would give us any clues as to what is more likely in the event price keeps falling imo. The above figure is based on convention not any rule.
Beware the statistics coming out of this thoroughly corrupt administration. Their penchant for subterfuge and outright dishonesty knows no bounds. What reasonable person is going to believe that there was a 1.3% rise in retail expenditures after the dismal results posted by the biggest players in the space?
Banksters hard at work. They bought the DAX from deeply in the red and CAC as well.
FTSE not far behind, Yellen and company pouring in billions…it will end badly…
I think Obama’s people in charge of compiling the Stats at the agency’s are taking a page right out of China’s play book!
Agree but this smoke and mirrors show will end badly
It didn’t end well for China. Nothing they did stopped a crash.
When a market is ready to crash it will crash.
The CCP is the closest to a God of Markets that there ever will be, and they can’t stop their market doing what it will do
Yep I couldn’t agree more, the economic statistics are bogus in my opinion. When the market begins to sell off despite the positively engineered econ numbers, then we’ll know things are ready to rock and roll to the downside.
The HORRIBLE Retail Stocks Earnings Data proves that the Bull Wave Count is NULL & VOID!
The Talking Heads can NO LONGER spin Bull S _ _ T into a growing economy.
Even the morons begin to see how bad Revenue & Earnings are!
Morons do have integrity and will react even if they are still morons.
Just saw on Bloomberg that retail sales for April jumped 1.3%.
All the Retail Stocks each projecting a much lower June revenue quarter… So exactly where is this 1.3% coming from???
Autos??? Who are slowing their production going forward?
Something smells!
Auto & Gas sales surged! Temp Blip… but the talking heads will spin the BS… But the morons will see through the BS this time!
In yesterday’s announcements, Macy’s indicated they have the largest inventory in their history.
Cancel all orders to toy manufacturers please. Layoffs shall continue.
It’s not just Macy’s… It’s all of Retail across the board.
Thanks for that part on Macy’s… I didn’t note it in my quick review.
WSJ says we are in “Peak Auto” and the surge in auto and pick-up sales was a replacement cycle that is largely playing out. Auto sales were a large part of the improving economic picture, so if that fades it will have a big negative impact.
The problem is they react more slowly than the rest of us. Sometimes there is no accounting for gullibility when it comes to the masses…. 🙂
79% are short the S&P500 per the scan of the trading book at the brokerage. Of note it averaged 91% during the month of February.
Exactly where are you getting this data and how do you have access to it?
Please post the specific links to the exact data that backs your post.
Thank You…
My link is the owner of the brokerage (top 20 in USA) who calls or emails each morning. A long time friend who stole my wife 40 years ago. I’m not sure if you would call that bearish divergence or not.
Must be small sample… because I have a hard time thinking of names of 10 Brokerages in the USA these days.
And you are still talking??!! You are a most gracious individual!! 🙂
Very interesting – thanks Peter.
Provides some support to the expanded flat idea with a rip higher in Minute (c) of Minor 2 to reduce the number of bears, rather than Minor 3 kicking off imo.
I’m trading based on this Minor 3 in it’s early stages (which I don’t think is most probable BTW) but keeping a keen eye out for this move down from recent highs being a three, so I can bail on some of my position.
Unless we get an intra-day implosion in the markets, which is not out of the question, I don’t think minor three down has arrived. We would have seen it in a huge decline in futures that could not be averted. I would expect that it would be ushered in with a strong gap up open in volatility which does not seem to be in the works for today’s open…
Thanks for the 411 Peter. That’s a good thing to know. 79% short…smells kind of bullish to me….lol.
This may not be representative if the data is from just one broker…
I assumed they were scanning the market rather than just their own order book?
He stated it’s one of the big boys, so I guess unless they cater to the pessimism society you could still expect it to be fairly representative of a larger customer base.
Only price matters to me for trading tbh, but stuff like this can help point me in the right direction as it’s rarely a one horse race.
It is a scan of the brokerages’ trading book – only on SP 500 big and mini contracts. Just a straight out number what percentage long, what percentage short.
How do you get access to that? or where is it published?
Answer posted at 10:13am….
I continue to like the expanded flat count as it fits the bankster personality absolutely perfectly. One should expect to see increasing volatility as they continue to fight the developing trend, and back to back C waves, one down at minuette degree, and one up at minute degree fits the bill. I expect the initial downdraft at the open will be sharp but reverse intra-day, trapping bears who are not nimble, or who do not have the benefit of Lara’s analysis. The banksters will then throw the kitchen sink (to borrow Olga’s phrase) at the decline resulting in the face-ripping minute C wave up, juiced by all the new shorts having to bail as the market reverses course and heads higher. For the adventuresome, it could re-present the opening we missed at the end of minor one down, with just about the same entry point for a potential trade to the upside. If futures remain lower, I will be taking profits on a few short positions as we approach the downside target, then trading the upside by again selling covered calls against my long UVXY position, once the reversal is confirmed, and using the proceeds to buy a few UVXY puts. A sharp move down, followed by a sharper move up fits the recent psychological profile of this crazy market to a T! It will be interesting to see how close we get to the bear market trend-line tomorrow, and that will have a big impact on any decision regarding keeping positions over the week-end. All this of course assumes minor three down has not as yet arrived! Not around till later today so have a great trading day everyone! 🙂
The banksters keep dumping cash into the futures market with little lasting effect…interesting!
It’s a plan! I’ve got a feeling that most of Minute c of Minor 2 up (if it plays out) will be seen on Monday.
As soon as we have another 5 waves down to complete Minute b, I’ll be selling alot of my UVXY position – especially if a reversal pattern comes within the ‘magic zone’ Lara has pointed out – if we then continue to tumble and make 5 waves down at Minute degree I’ll be buying straight back in.
I’ll most certainly be back at 100% short by the time price has fallen to 1993 (which is where Minute b (of Minor 2) = 2 x Minute a), but I think wave structure should reveal Mr Markets hand before we reach that point.
Futures lower. More importantly, they are lower in the face of what has been aggressive bankster buying the past few sessions, and that context could have some interesting and revealing implications…
Again I say thanks for the analysis and commentary. I am often amazed at how you can collect all the data, analyze the counts, write the commentary etc all in a day, after day. So thanks for your dedication and efforts.
I want to make sure I am clear on the earlier discussion of being underwater. First, I am not a risk adverse person by nature. Second, I am only responsible for myself. You have an entirely different place and responsibility in all that this service has become. I am not concerned with being underwater on a trade for a while. Different styles and different appetite for risk for different people. Each trader needs to know themselves.
I have every reasonable confidence in our understanding of the markets and associated risks. I firmly believe in a few months we will not be worrying over did the Primary 3rd start yet. But we will find something to worry about if we really need to worry. Caution and worry are two different dispositions. Me, I take risks. With my age they are much more calculated and made with some wisdom I hope. And I certainly try to avoid any danger to life and limb. But some of the best occurrences in my life have been because I took a risk; sometimes big risks.
Tomorrow we will know more. Have a great end of your day on the other side of the world.
Thank you Rodney 🙂
I may be up again early tomorrow and may be here in the NY afternoon of Friday’s session.
Happy trading everyone!
once, futures are down a bit