
A little upwards movement was expected for Monday to a target at 2,063.
Price moved higher, to 2,064.15.
Summary: Downwards movement may produce a red candlestick for Tuesday towards a target at 2,031. This is expected to be a fifth wave of the first impulse down within the new trend. The target may be met in one to three days and be followed by a deep second wave correction to end at the bear market trend line. The trend is down and the final target remains at 1,423.
To see last published monthly charts click here.
To see how each of the bull and bear wave counts fit within a larger time frame see the Grand Supercycle Analysis.
To see detail of the bull market from 2009 to the all time high on weekly charts, click here.
New updates to this analysis are in bold.
BEAR ELLIOTT WAVE COUNT
WEEKLY CHART
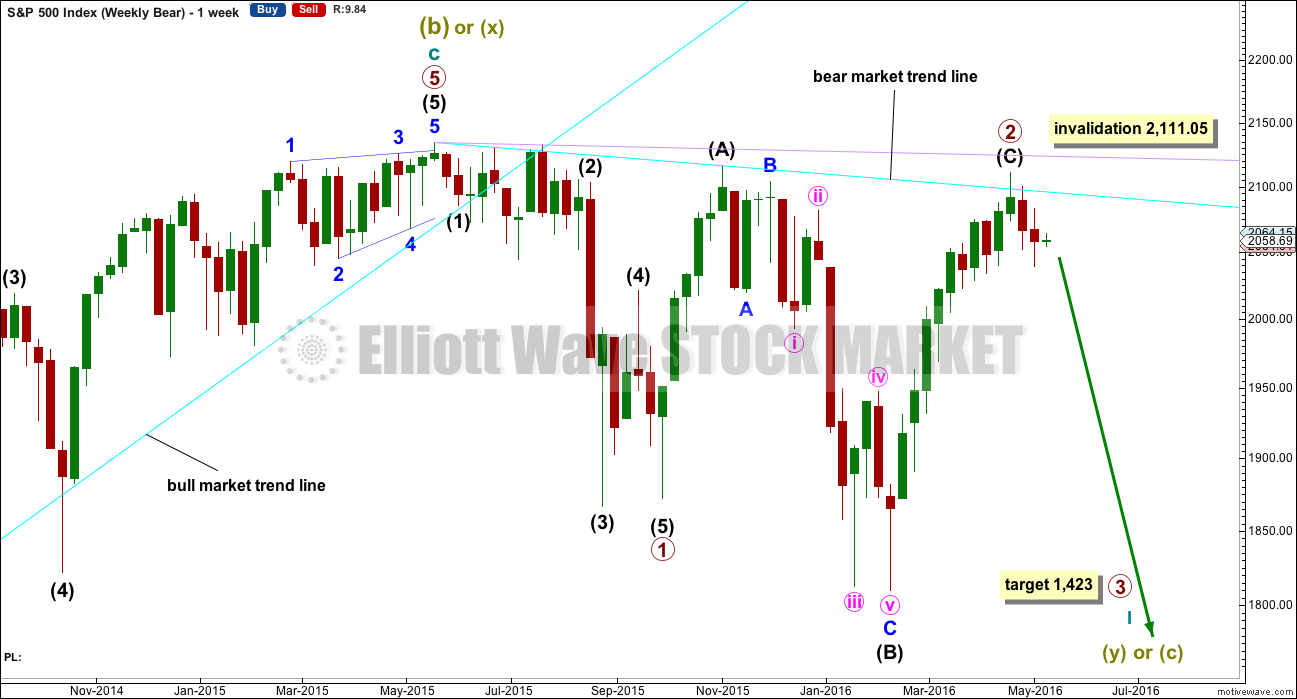
Click chart to enlarge.
This bear wave count fits better than the bull with the even larger picture, super cycle analysis found here. It is also well supported by regular technical analysis at the monthly chart level.
Importantly, there is no lower invalidation point for this wave count. That means there is no lower limit to this bear market.
Primary wave 1 is complete and lasted 19 weeks. Primary wave 2 is either over lasting 28 weeks, or it may continue for another one or two weeks.
An expectation for duration of primary wave 3 would be for it to be longer in duration than primary wave 1. If it lasts about 31 weeks, it would be 1.618 the duration of primary wave 1. It may last about a Fibonacci 34 weeks in total, depending on how time consuming the corrections within it are.
At the last high in April, the weekly candlestick has a long upper shadow which is bearish. The next candlestick completes a bearish engulfing pattern. That pattern is now followed by another downwards week, so it is reinforced.
Primary wave 2 may be complete as a rare running flat. Just prior to a strong primary degree third wave is the kind of situation in which a running flat may appear. Within primary wave 2, intermediate wave (A) was a deep zigzag (which will also subdivide as a double zigzag). Intermediate wave (B) fits perfectly as a zigzag and is a 1.21 length of intermediate wave (A). This is within the normal range for a B wave of a flat of 1 to 1.38.
Within primary wave 3, no second wave correction may move beyond its start above 2,111.05.
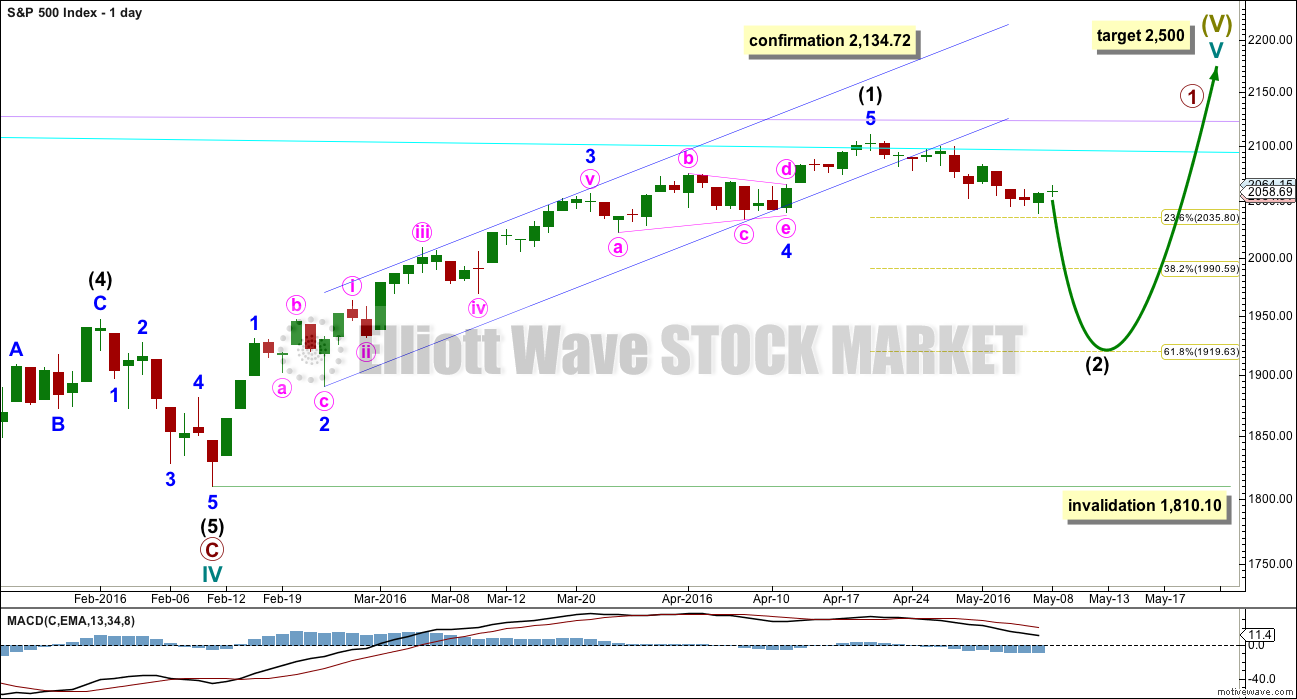
DAILY CHART
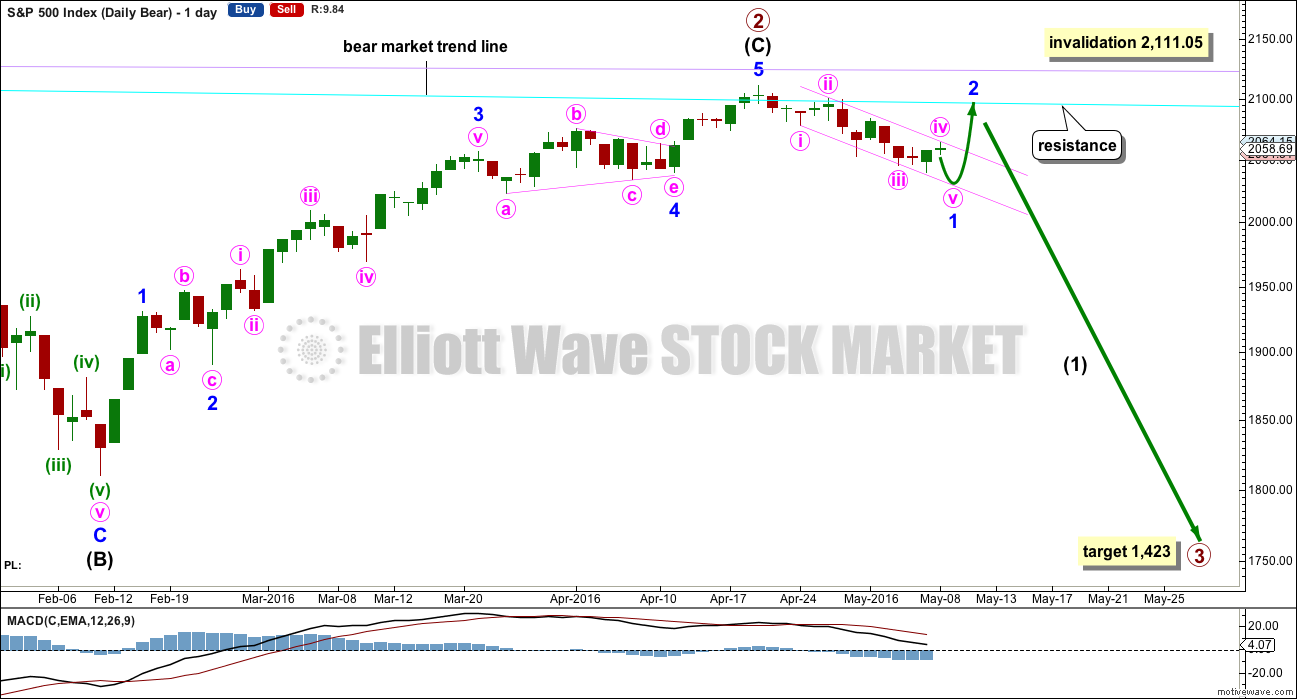
Click chart to enlarge.
If intermediate wave (C) is over, then the truncation is small at only 5.43 points. This may occur right before a very strong third wave pulls the end of intermediate wave (C) downwards. At the end of last week, price has confirmed a trend change with a new low slightly below 2,039.74.
The next wave down for this wave count would be a strong third wave at primary wave degree. At 1,423 primary wave 3 would reach 2.618 the length of primary wave 1. This is the appropriate ratio for this target because primary wave 2 is very deep at 0.91 of primary wave 1. If this target is wrong, it may be too high. The next Fibonacci ratio in the sequence would be 4.236 which calculates to a target at 998. That looks too low, unless the degree of labelling is moved up one and this may be a third wave down at cycle degree just beginning. I know that possibility right now may seem absurd, but it is possible.
Alternatively, primary wave 3 may not exhibit a Fibonacci ratio to primary wave 1. When intermediate waves (1) through to (4) within the impulse of primary wave 3 are complete, then the target may be calculated at a second wave degree. At that stage, it may change or widen to a small zone.
Draw a small channel about the new downwards movement using Elliott’s first technique: draw the first trend line from the ends of minute waves i to iii, then place a parallel copy on the end of minute wave ii. The upper edge may show where minute wave iv finds resistance, and the downwards edge may show where minute wave v finds support.
Once there is some downwards movement for minute wave v, a subsequent breach of the upper edge of the channel would indicate that the impulse for minor wave 1 would be over and the following correction for minor wave 2 may have begun. Minor wave 2 may be deep. The equivalent minor wave 2 within the last big bear market was a 0.81 depth of minor wave 1 and it lasted one day longer than minor wave 1.
For this upcoming minor wave 2, the expectation should be for it to be deep and either even in duration or longer in duration than minor wave 1. Minor wave 2 may be deep enough to find resistance at the bear market trend line. This line should now offer very strong resistance; I would not expect price to break above it.
Minor wave 2 may not move beyond the start of minor wave 1 above 2,111.05.
HOURLY CHART
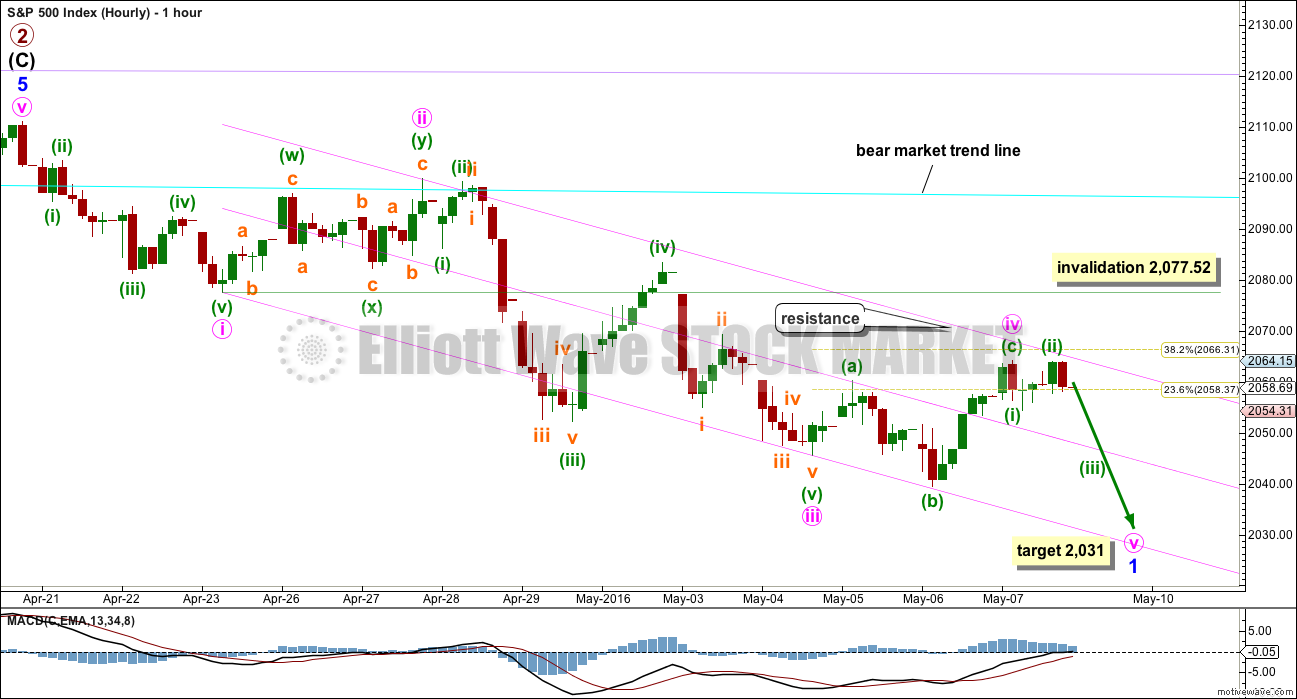
Click chart to enlarge.
Minute wave iii is just 0.09 points longer than 1.618 times the length of minute wave i. Minute wave iii shows an increase in momentum beyond minute wave i, and the strongest part is the middle of the third wave.
A channel drawn using Elliott’s first technique sees the middle of the third wave overshoot the lower edge. This looks typical. The upper edge of the channel may show where minute wave iv finds resistance.
Minute wave ii was a deep 0.67 double zigzag correction. Minute wave iv may now be complete as a shallow 0.34 expanded flat. Both minute waves ii and iv are perfectly even in duration lasting exactly 20 hours each. Because it is the proportions between second and fourth wave corrections which give the wave count the “right look”, this wave count has a textbook perfect look. That in conjunction with the ratio between minute waves i and iii means this wave count has a high probability.
It is not definite, although it is very likely, that minute wave iv is over . It may continue sideways as a triangle, double flat or double combination. All these are all sideways movements which should see price move within the range travelled so far by minute wave iv. If this happens, the perfect proportion between minute waves ii and iv would be lost and minute wave iv would be much longer in duration than minute wave ii. It is much more likely it is over here. If it continues any further, then minute wave iv may not move into minute wave i price territory above 2,077.52.
When there is a new low below the lower price range of minute wave iv at 2,039.45, then it would be confirmed that minute wave iv is over and minute wave v is underway.
Minute wave i lasted 20 hours. Minute wave v may be expected to be about the same duration.
The S&P can behave like a commodity during its bear markets in that it can exhibit swift strong fifth waves. However, this behaviour is seen more often for third wave impulses (the fifth wave to end the third is swift and strong) and during the last bear market did not show up until the middle to end of the whole bear market. I would not necessarily expect this tendency to show up here for minute wave v, but it is a possibility to be aware of.
BULL ELLIOTT WAVE COUNT
WEEKLY CHART
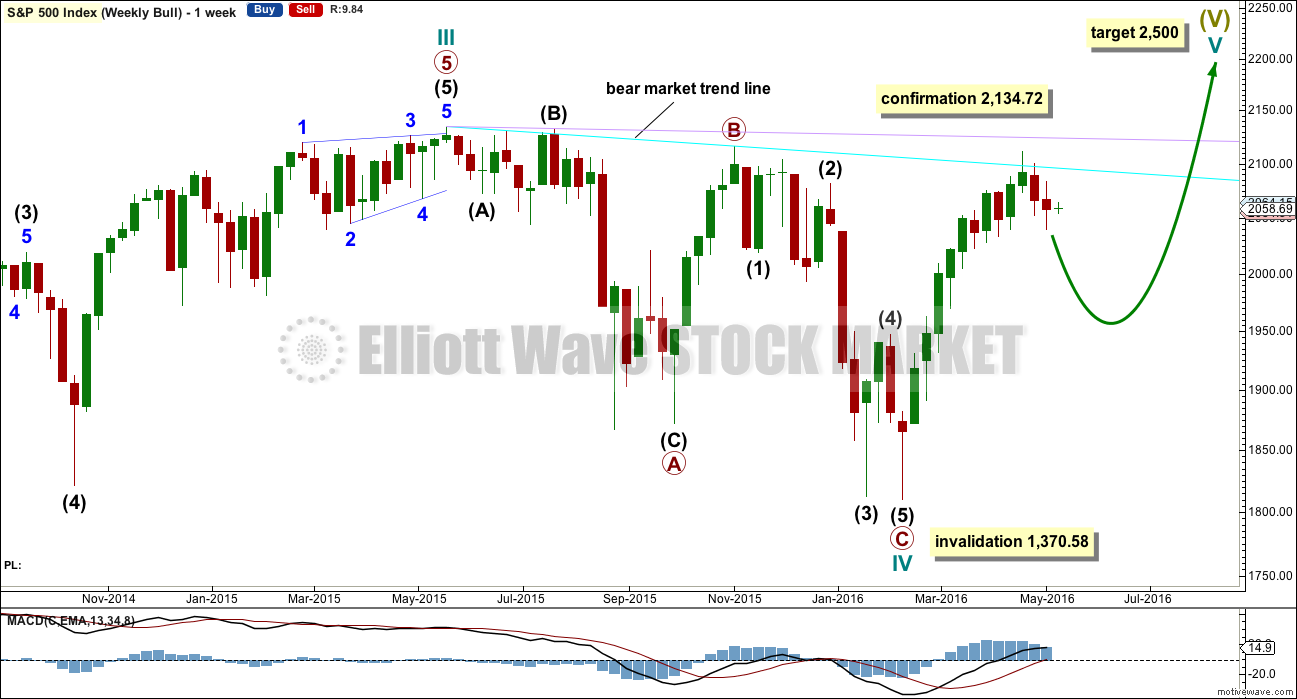
Click chart to enlarge.
Within primary wave C downwards, intermediate wave (2) is seen as an atypical double zigzag. It is atypical in that it moves sideways. Double zigzags should have a clear slope against the prior trend to have the right look. Within a double zigzag, the second zigzag exists to deepen the correction when the first zigzag does not move price deep enough. Not only does this second zigzag not deepen the correction, it fails to move at all beyond the end of the first zigzag. This structure technically meets rules, but it looks completely wrong. This gives the wave count a low probability.
This part of the structure is highly problematic for the bull wave count. It is not possible to see cycle wave IV as complete without a big problem in terms of Elliott wave structure.
Cycle wave II was a shallow 0.41 zigzag lasting three months. Cycle wave IV may be a complete shallow 0.19 regular flat correction, exhibiting some alternation with cycle wave II.
At 2,500 cycle wave V would reach equality in length with cycle wave I.
Price remains below the final bear market trend line. This line is drawn from the all time high at 2,134.72 to the swing high labelled primary wave B at 2,116.48 on November 2015. This line is drawn using the approach outlined by Magee in the classic “Technical Analysis of Stock Trends”. To use it correctly we should assume that a bear market remains intact until this line is breached by a close of 3% or more of market value. In practice, that price point would be a new all time high which would invalidate any bear wave count.
This wave count requires price confirmation with a new all time high above 2,134.72.
While price has not made a new high, while it remains below the final bear market trend line and while technical indicators point to weakness in upwards movement, this very bullish wave count comes with a strong caveat. I still do not have confidence in it.
DAILY CHART
Click chart to enlarge.
If the bull market has resumed, it must begin with a five wave structure upwards at the daily and weekly chart level. That may today be complete. The possible trend change at intermediate degree still requires confirmation in the same way as the alternate hourly bear wave count outlines before any confidence may be had in it.
If intermediate wave (2) begins here, then a reasonable target for it to end would be the 0.618 Fibonacci ratio of intermediate wave (1) about 1,920. Intermediate wave (2) must subdivide as a corrective structure. It may not move beyond the start of intermediate wave (1) below 1,810.10.
In the long term, this wave count absolutely requires a new high above 2,134.72 for confirmation. This would be the only wave count in the unlikely event of a new all time high. All bear wave counts would be fully and finally invalidated.
TECHNICAL ANALYSIS
WEEKLY CHART
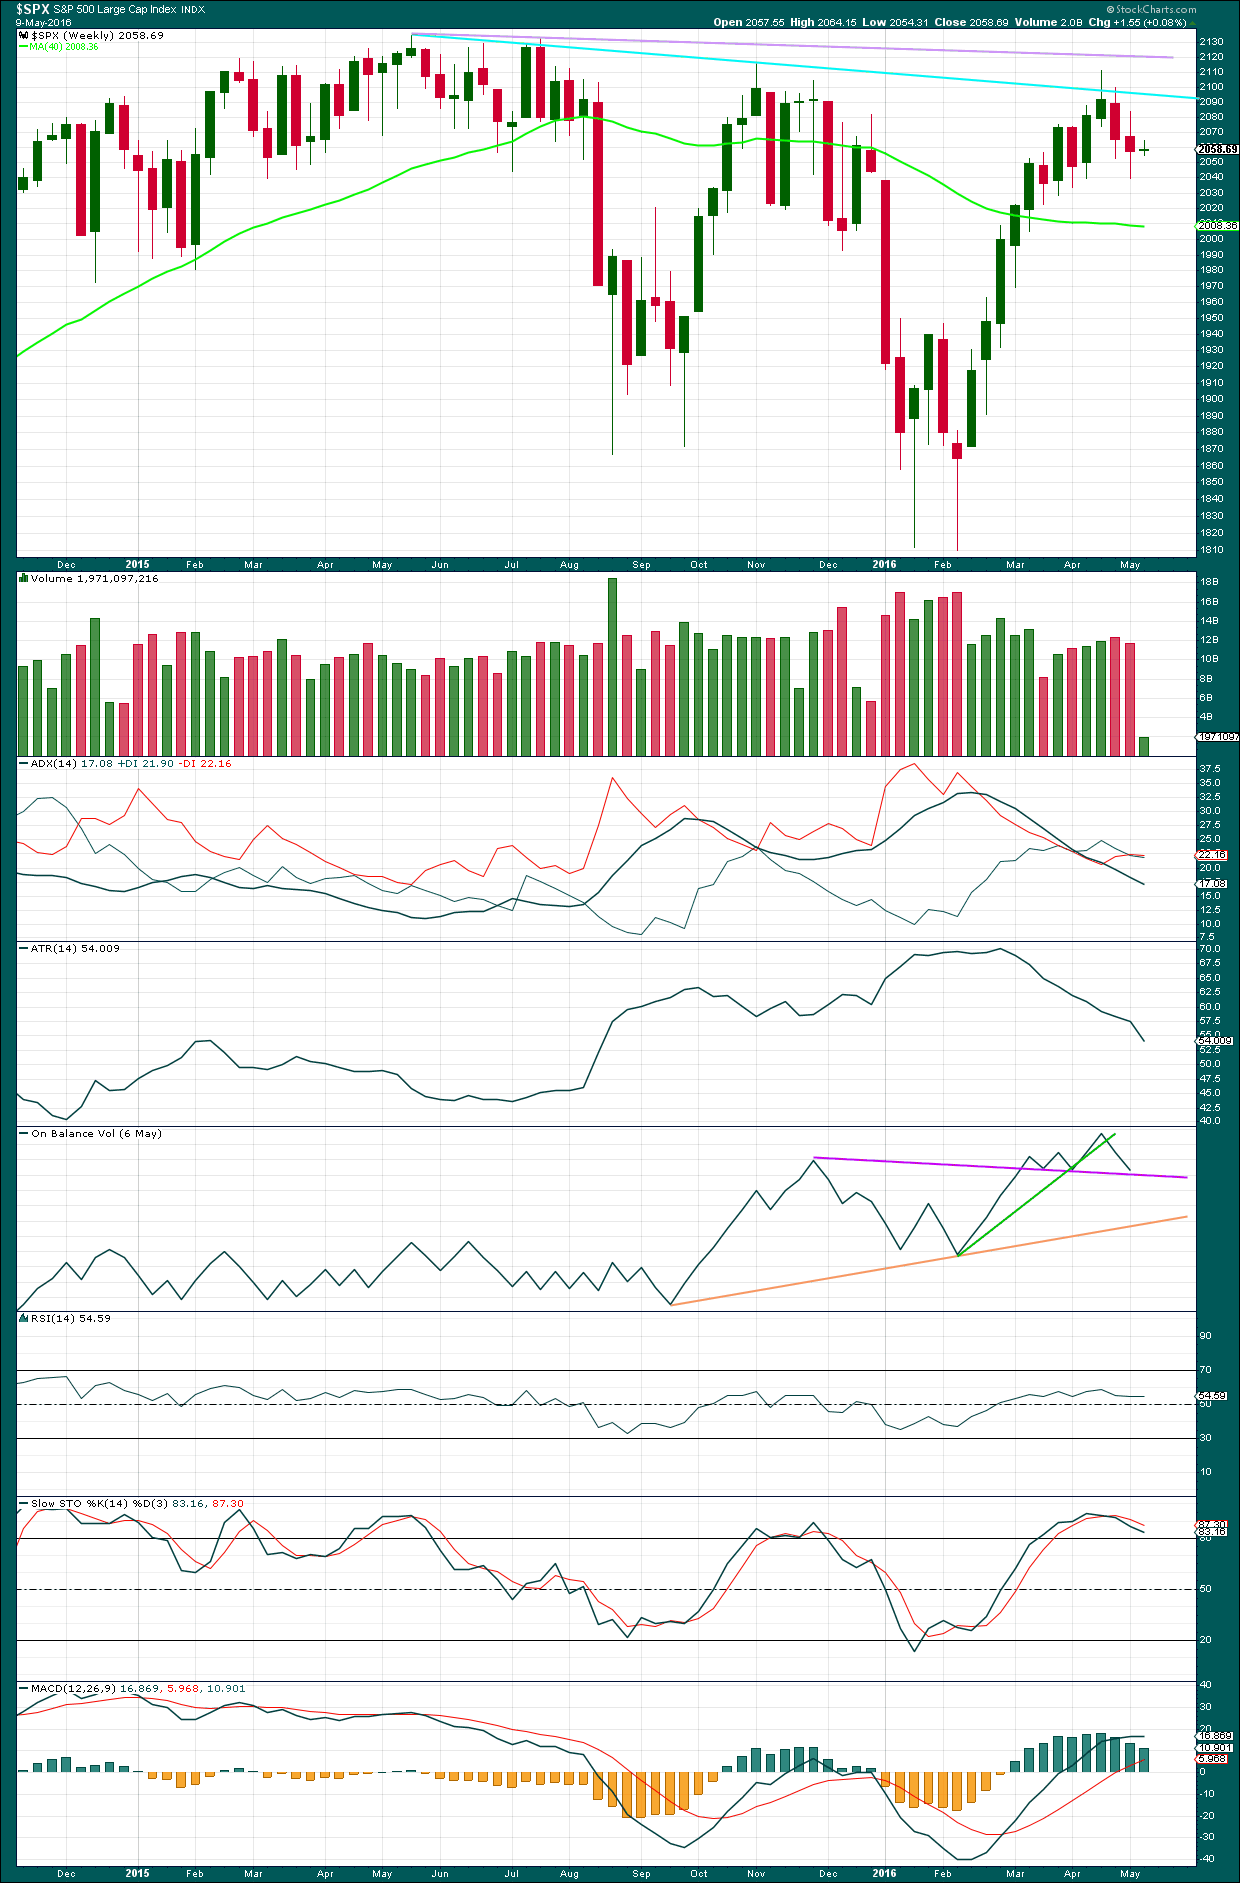
Click chart to enlarge. Chart courtesy of StockCharts.com.
There is a bearish engulfing candlestick pattern at the last high. This has occurred at the round number of 2,100 which increases the significance. Volume on the second candlestick is higher than volume on the first candlestick, which further increases the significance. That it is at the weekly chart level is further significance.
Engulfing patterns are the strongest reversal patterns.
Now this pattern is followed by another red weekly candlestick. The reversal implications of the pattern are confirmed.
This is a very strong bearish signal. It adds significant weight to the expectation of a trend change. It does not tell us how low the following movement must go, only that it is likely to be at least of a few weeks duration.
There is a weak bearish signal from On Balance Volume at the weekly chart level with a break below the green line. A stronger bearish signal would be a break below the purple line. At the end of last week, OBV has come down to almost touch the purple line. Some support may be expected about here, so this may prompt minor wave 2 to bounce higher.
There is hidden bearish divergence between Stochastics and price at the last high and the high of November 2015. Stochastics has moved further into overbought territory, but this has failed to translate into a corresponding new high in price. Price is weak. MACD exhibits the same hidden bearish divergence.
After a period of declining ATR, it should be expected to turn and begin to increase.
DAILY CHART
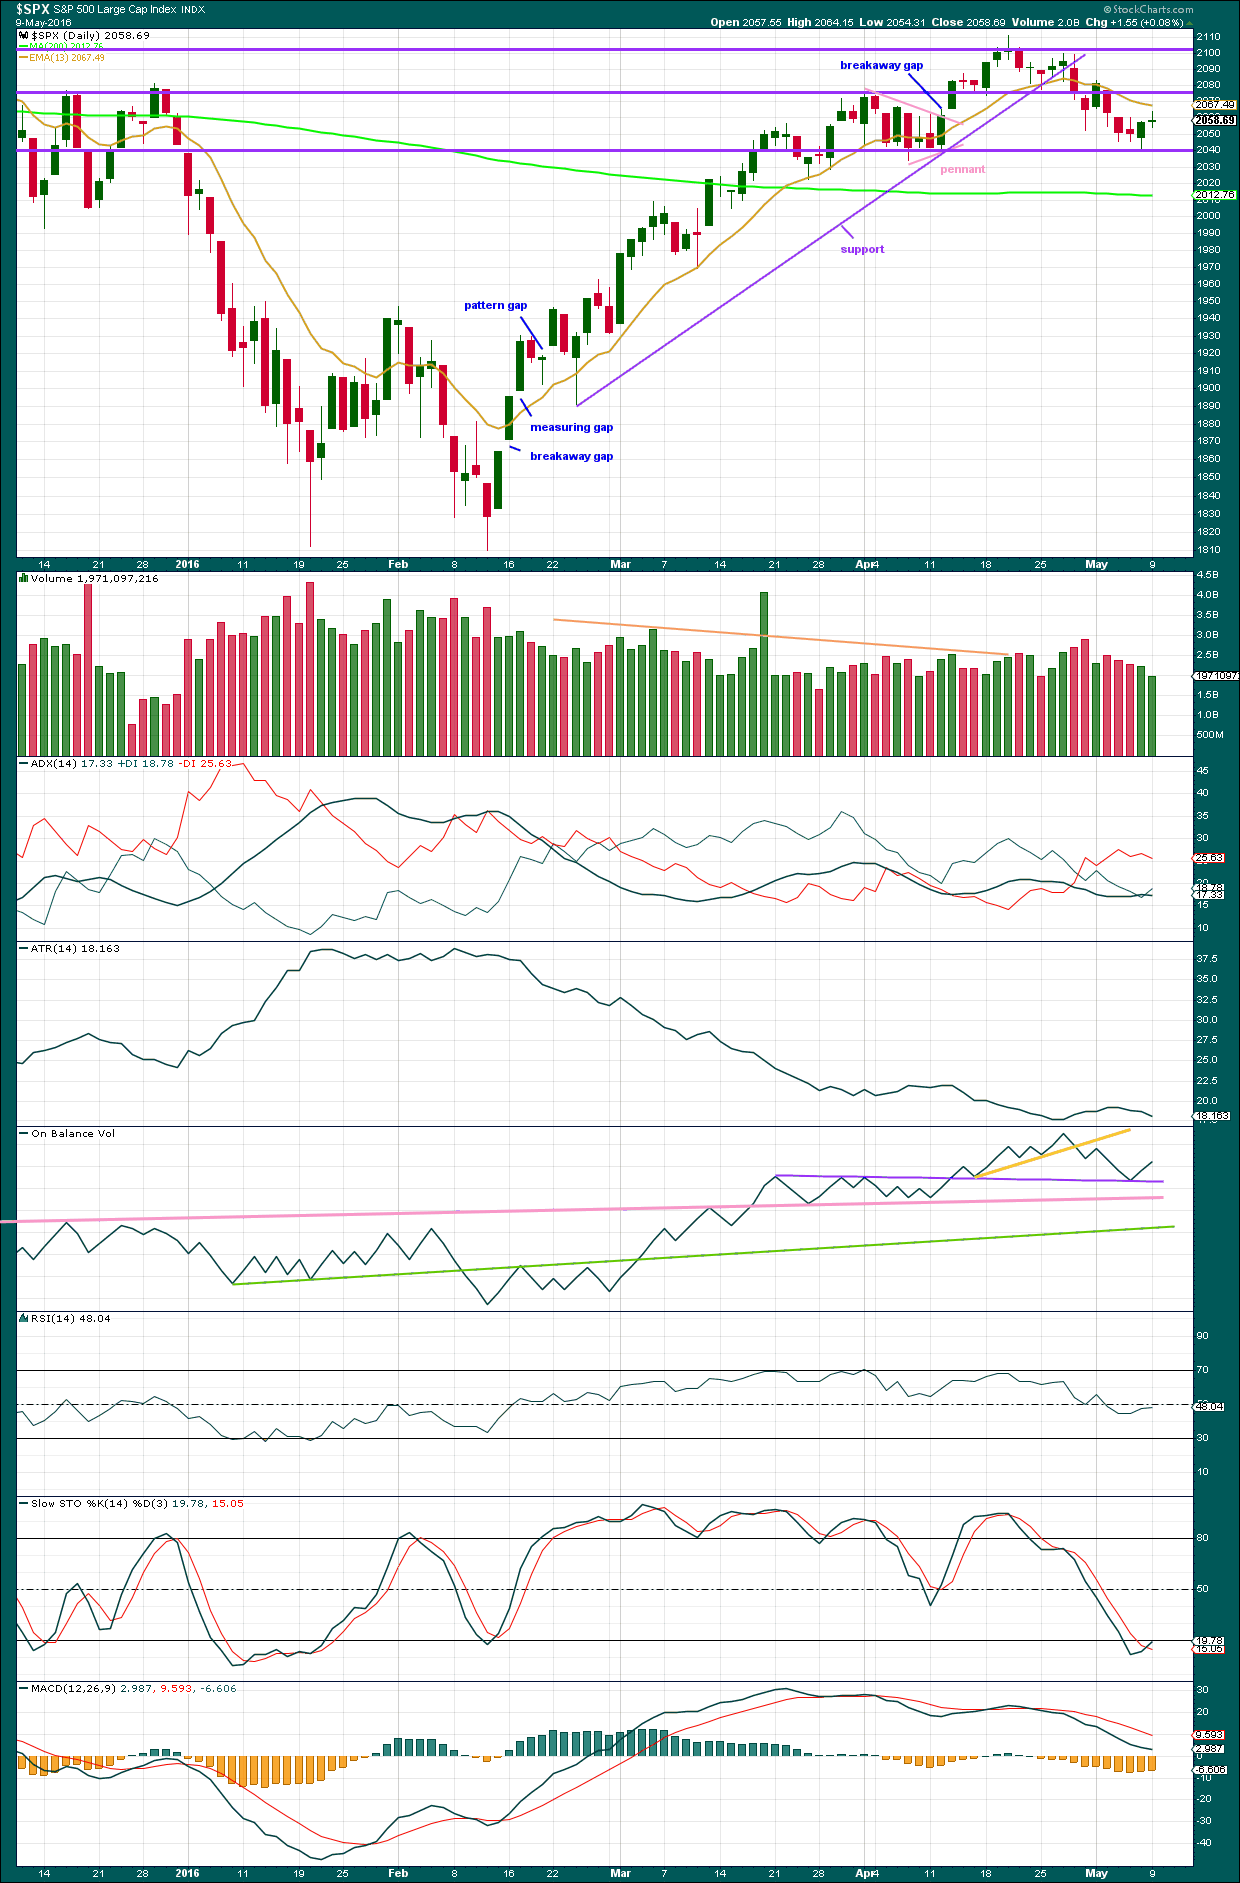
Click chart to enlarge. Chart courtesy of StockCharts.com.
Volume data on StockCharts is different to that given from NYSE, the home of this index. Comments on volume will be based on NYSE volume data when it differs from StockCharts.
Price has found support at the horizontal line about 2,040 and bounced up from there as expected. It may now find resistance at the 13 day moving average. This may turn price down from here. If it doesn’t, then the next line for resistance is the horizontal line about 2,070.
Two days in a row of upwards movement come on declining volume. The rise in price is not supported by volume, so it is suspicious. It is more likely this is a small counter trend movement and not a new upwards trend. Rising price must be supported by volume to be sustainable.
ADX is today flat indicating no clear trend. The -DX line remains above the +DX line. So if the ADX line again turns upwards, then a downwards trend would be again indicated. There has been no trend change.
ATR is declining also indicating there is no clear trend. Both these indicators are lagging as they are based on 14 day averages.
On Balance Volume has given a bullish signal with a bounce up from the purple line. This purple line may again hold if price comes lower as the Elliott wave count expects it to. Minute wave v may end when OBV comes to again touch the purple line.
RSI is neutral. There is room for price to rise or fall. If the Elliott wave count is right and a fifth wave down unfolds, then RSI will be watched carefully to look for divergence. If there is any small divergence between price and RSI, that may indicate the end of minute wave v downwards.
Stochastics is returning from oversold.
MACD indicates some increase in downwards momentum so far.
VOLATILITY – INVERTED VIX DAILY CHART
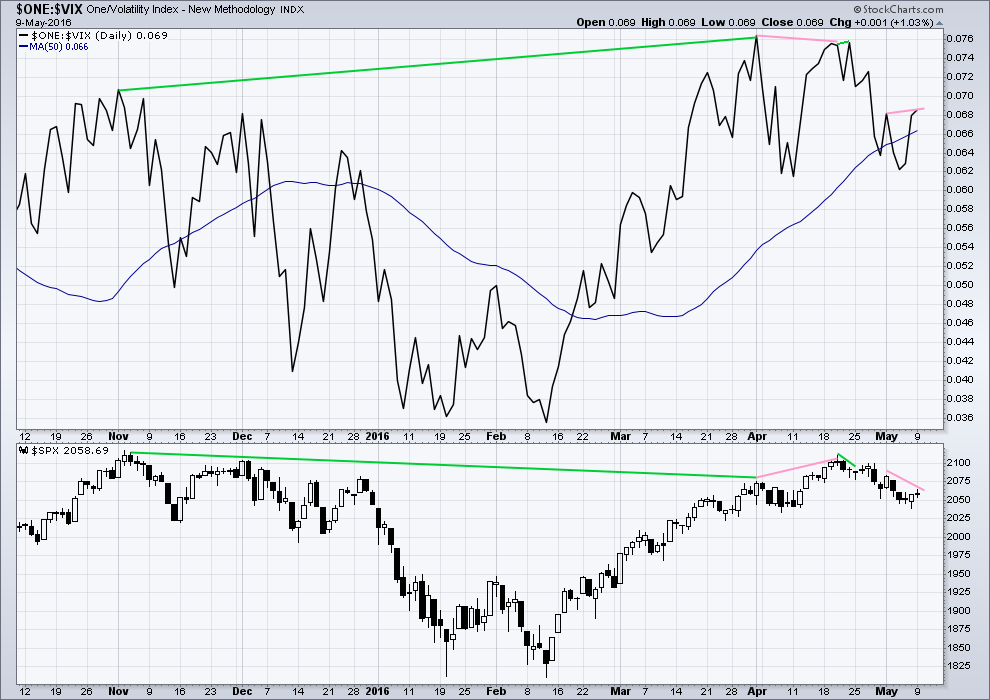
Click chart to enlarge. Chart courtesy of StockCharts.com.
Volatility declines as inverted VIX climbs. This is normal for an upwards trend.
What is not normal here is the divergence over a reasonable time period between price and inverted VIX (green lines). The decline in volatility is not translating to a corresponding increase in price. Price is weak. This divergence is bearish.
Price today has moved higher but not above the prior high of 2nd May. Yet inverted VIX has made a new high above 2nd May (pink lines). This is again hidden bearish divergence. The decline in volatility is greater than the prior level of 2nd May, yet this cannot be translated into a corresponding rise in price. Price is again weak.
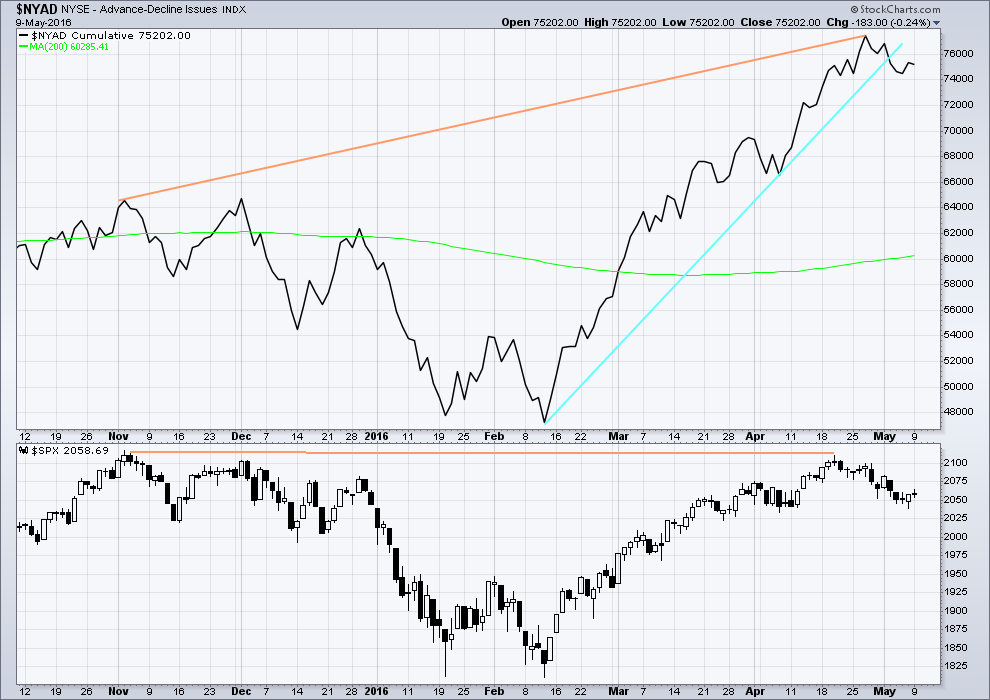
BREADTH – ADVANCE DECLINE LINE
Click chart to enlarge. Chart courtesy of StockCharts.com.
With the AD line increasing, this indicates the number of advancing stocks exceeds the number of declining stocks. This indicates that there is breadth to this upwards movement.
From November 2015 to now, the AD line is making new highs while price has so far failed to make a corresponding new high. This indicates weakness in price; the increase in market breadth is unable to be translated to increase in price (orange lines).
The 200 day moving average for the AD line is now increasing. This alone is not enough to indicate a new bull market. During November 2015 the 200 day MA for the AD line turned upwards and yet price still made subsequent new lows.
The AD line is now declining and has breached a support line (cyan). There is breadth to downwards movement; more stocks are declining than advancing which supports the fall in price.
SENTIMENT – COMMITMENT OF TRADERS (COT)
COT will not be published as a sentiment indicator. When I am more confident of my interpretation of COT, I will start publishing COT again.
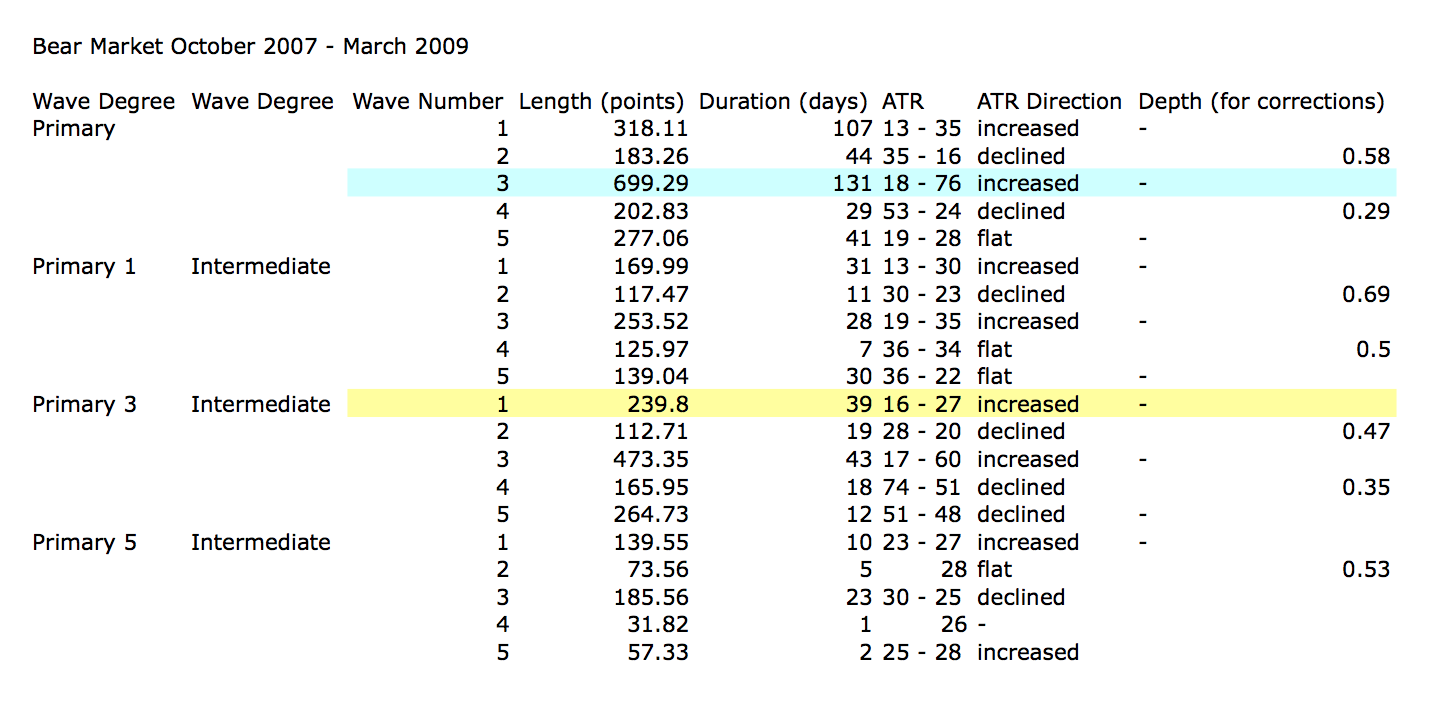
ANALYSIS OF LAST MAJOR BEAR MARKET OCTOBER 2007 – MARCH 2009
Click to enlarge.
In looking back to see how a primary degree third wave should behave in a bear market, the last example may be useful.
Currently, the start of primary wave 3 now may be underway for this current bear market. Currently, ATR sits about 19. With the last primary degree third wave (blue highlighted) having an ATR range of about 18 to 76, so far this one looks about right.
The current wave count sees price in an intermediate degree first wave within a primary degree third wave. The equivalent in the last bear market (yellow highlighted) lasted 39 days and had a range of ATR from 16 – 27.
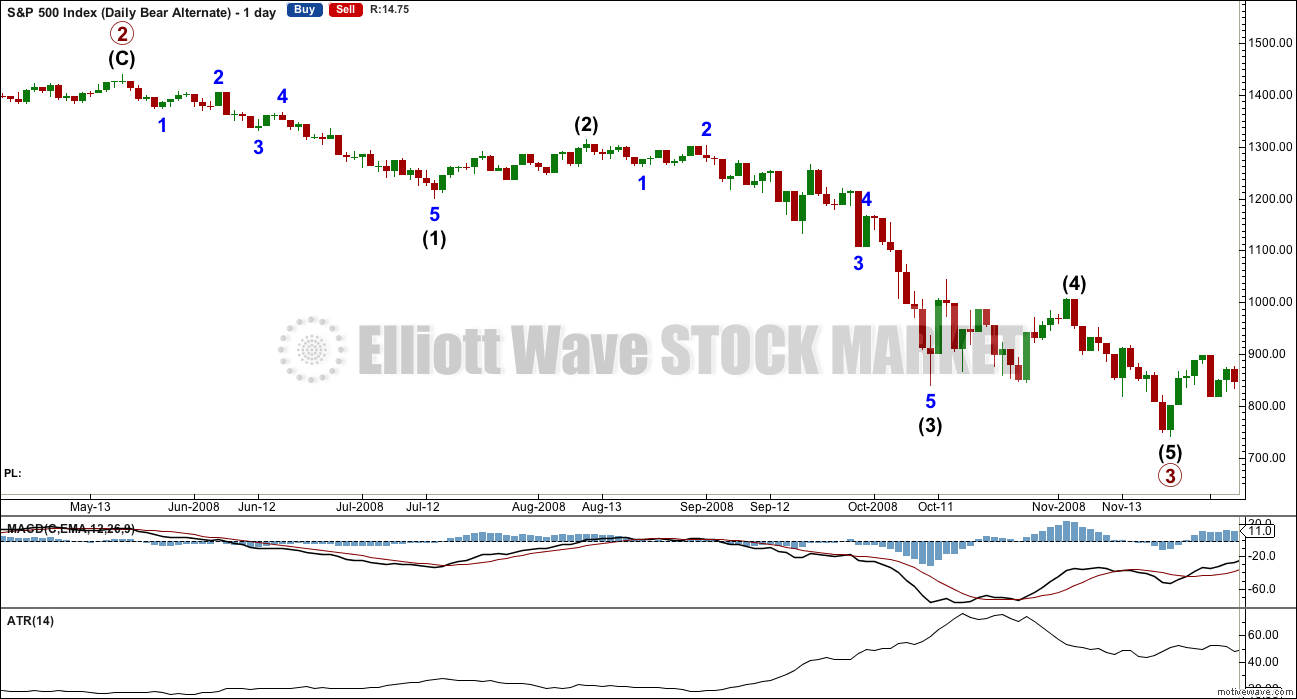
Click chart to enlarge.
This chart is shown on an arithmetic scale, so that the differences in daily range travelled from the start of primary wave 3 to the end of primary wave 3 is clear.
Primary wave 3 within the last bear market from October 2007 to March 2009 is shown here. It started out somewhat slowly with relatively small range days. I am confident of the labelling at primary degree, reasonably confident of labelling at intermediate degree, and uncertain of labelling at minor degree. It is the larger degrees with which we are concerned at this stage.
During intermediate wave (1), there were a fair few small daily doji and ATR only increased slowly. The strongest movements within primary wave 3 came at its end.
It appears that the S&P behaves somewhat like a commodity during its bear markets. That tendency should be considered again here.
This chart will be republished daily for reference. The current primary degree third wave which this analysis expects does not have to unfold in the same way, but it is likely that there may be similarities.
DOW THEORY
I am choosing to use the S&P500, Dow Industrials, Dow Transportation, Nasdaq and the Russell 2000 index. Major swing lows are noted below. So far the Industrials, Transportation and Russell 2000 have made new major swing lows. None of these indices have made new highs.
I am aware that this approach is extremely conservative. Original Dow Theory has already confirmed a major trend change as both the industrials and transportation indexes have made new major lows.
At this stage, if the S&P500 and Nasdaq also make new major swing lows, then my modified Dow Theory would confirm a major new bear market. At that stage, my only wave count would be the bear wave count.
The lows below are from October 2014. These lows were the last secondary correction within the primary trend which was the bull market from 2009.
These lows must be breached by a daily close below each point.
S&P500: 1,821.61
Nasdaq: 4,117.84
DJIA: 15,855.12 – close below on 25th August 2015.
DJT: 7,700.49 – close below on 24th August 2015.
Russell 2000: 1,343.51 – close below on 25th August 2015.
To the upside, DJIA has made a new major swing high above its prior major high of 3rd November, 2015, at 17,977.85. But DJT has so far failed to confirm because it has not yet made a new major swing high above its prior swing high of 20th November, 2015, at 8,358.20. Dow Theory has therefore not yet confirmed a new bull market. Neither the S&P500, Russell 2000 nor Nasdaq have made new major swing highs.
This analysis is published @ 09:31 p.m. EST.
Good Day, looking at today’s daily chart, it looks like to me that we could have an inverted cup and handle pattern. sorry about the chart size, I’m new at this
I feel excited about this minor 2 🙂 If we didn’t have price confirmation below 2039.74, I think I’d much more confused and frustrated. I would love to see price go up as much as it can, close to 2111. What a shorting opportunity that would be…
Lara,
Checking to see if you’re in the mood for a loaded question …
On a scale from 1-10, how high is your confidence a 5 wave is on its way down soon? 10 being very confident.
Thanks
I’m always in the mood to answer questions 🙂
I’d put it at 9.5 out of 10. Based on classic TA, particularly volume and On Balance Volume.
Also the persistent weakness of the bear market rally.
And the existence of a bear market as evidenced by Dow Theory, lower lows and lower highs, and the 200 day moving average declining.
Awesome!
Final SPX Volume:
517.100 Million Today
553.841 Million Yesterday
That is good, very good. Thanks.
Smoke and mirrors (heck of alot of smoke today!)
yup ,, this rally is on enemaic volume, oops I meant anemic volume, must have been thinking about the last enema. oh well too much info there, we can get up into the lows of the last high but with contracting volume thats all she wrote,,, then it is enema time !!
You guys never fail to make me LOL. Really. Almost spat my tea at my screen 🙂
I just love the happy wee community this site has turned into.
Interesting… very interesting.
Why StockCharts.com shows 2,017M for SPX?
StockCharts totals all volume traded during the day with no weight given to different values of each equity.
The volume on StockCharts will sometimes be different to that given on the website of NYSE.
At least, that’s how I understand it’s done.
Dammit!
Exited shorts anyway. Took a little profit, now waiting for a better entry.
So that textbook perfect impulse was just too perfect. And volatility indicators didn’t indicate the end of the fifth wave Verne? Uh huh. That’s the problem with indicators. They work… until they don’t.
Now to figure out when minor 2 is over.
For it to be over soon it would be very brief. I would expect it to look like a big three on the daily chart and have about an even duration with minor 1.
It’s close to the 0.618 Fibonacci ratio, but I don’t think it will stop there. From past behaviour (not always a good map for the future, but the best we can get) the first second wave corrections are very deep. So a test of the bear market trend line is what I would expect for this correction.
I’m labelling minute a and b complete, but that may change. That labelling may be premature.
I may move the degree of labelling within this down one, this may be either an incomplete impulse for minute a or an almost complete zigzag for minute a.
Actually, MACD did diverge with price at the low which is exactly what you’d expect to see for a fifth wave, but the problem was that fits perfectly for a B wave of an expanded flat for the fourth wave too.
And so a volatility decline at the last low could fit both ideas: a fifth wave or a B wave within the fourth.
The only way to tell is the structure. The last wave down now labelled minute v will subdivide either as a double zigzag or an impulse on the five minute chart. It is impossible to tell with certainty which one it is.
And that right there is the biggest problem and hardest thing about Elliott wave. Impulses, zigzags and double zigzags are all common structures. And they can all look the same.
And I realise I keep starting sentences with “and”. Oops. A bad habit.
Thanks Lara – the context provided by your fantastic analysis at least allows us to land straight on a horse when we fall off another.
You’re welcome 🙂
I’m not happy with my horse today. It’s not behaving itself.
Maybe a cube of sugar would help? 🙂
That’d probably do it. The horse has been on a blood sugar diet; no sugar, no coffee. Probably why it’s misbehaving.
We also did see a hammer on Friday. I have noticed lately that they are reversal signals that should not be ignored.
Nison, page 34, for umbrella lines (which encompass both hammers and hanging men):
“1. The real body is at the upper end of the trading range. The colour of the real body is not important.
2. It has a long lower shadow that should be at least twice the height of the real body.
3. It sold have no, or a very short, upper shadow.”
The daily candlestick for 6th May has a real body 9.37 points, and a long lower shadow 8.32 points. So it’s not a hammer.
But it still has bullish implications. The lower shadow is bullish and the colour of the body, green, is bullish. Just not as bullish as a hammer.
During that session the bears managed to push price to new lows, but the bulls were able to rally and bring price all the way back up to the high of the session, above the open. The bears made a new low but the bulls dominated the session. That’s bullish.
The candlestick of 29th April (daily chart) is a hammer.
Real body 6.52 points, lower shadow 13.02 points. Lower shadow just over 2X the real body.
And that didn’t lead to anything more than one day of upwards movement.
My conclusion: a hammer is another piece of the puzzle, but don’t give it too much weight. Only if it fits with the rest of the puzzle.
Actually, lower shadow just UNDER 2X the real body.
So purely technically, not a hammer either.
My bad.
Volume on the SPY with 40 minutes to go is a little over 50 million. This is the lightest volume since December 28, 2015. Hard for the market to sustain a breakout upwards with such light volume on what otherwise looks like a breakout day. Volume Monday was 74 million, Friday 89 million
I agree. I think the upward potential is very limited. Today’s action has all the earmarks of a bankster induced bear market rally. I am already eyeing ways to deploy my little remaining dry powder on the short side. Still sitting on my upside hedges so watch the market tank tomorrow… hopefully a bit more upward movement before it does…
Poss current action?? Major RSI div (1min).
Might be all of Minor 2 but more likely W I think (due to how little time it’s taken), so perhaps a 3 wave X wave down tomorrow before another zig zag up.
Yep. That’s pretty much what I have on my 5 minute chart too.
So this is either minor 2 over in just two days, or it’s a zigzag for minute a of a flat correction, or its a zigzag for minute w in a double zigzag to move higher.
As I’m expecting a test of the bear market trend line a double zigzag would be most likely.
Minor one must have ended last Friday at the low of 2039.45
If that is the case today’s pop would have to be viewed as the minuette C leg of an initial minute A corrective wave.
It is extremely strange that nothing about how volatility traded on Friday gave an indication of an interim low. It is possible that the reliability of those kinds of signals has diminished. Unless price drags on sideways for a few days, there is not a lot of upward room for minor two to continue.
Yet another 52 week low in UVXY consistent with a second wave correction.
If I recall correctly Verne, it did give a big signal. I remember SPX was down 0.4% initially in the day, and UVXY was also down almost 6% with it. I remember thinking at that time UVXY should have been well over 18.50 when we hit 2039 later that morning… it wasn’t. That was the signal…
Yep – my exact words at the time were ‘robbing banksters’ 🙂
Ah ha. Okay, thank you.
Crikey. This Elliott wave stuff is hard.
Oh well. I’ll look at it this way; we’re being offered a fantastic opportunity to enter at an amazing price. Especially if price comes up to touch the bear market trend line.
You are right. I just missed it. Normally it would at least initially move higher prior to reversing. What threw me off was that it never moved higher on Friday as minor one down completed and that was unusual. Live and learn…!
Believe it or not… volume today is slightly lower than yesterday at this moment in time.
Joseph,
Complacency is running at all time high, so many bulls not a sign of fear…not surprised about the volume as both QQQ and SPY have been recording low volumes so that tells me something else is pushing the markets higher. But it is moving higher none the less…so we have to sit and watch it develop.
No doubt about it. Today was a massive cash dump by the banksters.
It could just possibly hasten the completion of minor 2, especially if the tug of a third wave down is on deck…
Volume slowing further at this time vs yesterday.
I believe it. If we have a good upwards move on light volume that will nicely support the bearish wave count.
For price to rise sustainably it absolutely needs buyers to be more involved. Otherwise it’s a fake.
This market has more fakes than the night markets of Hong Kong.
SPX Hourly at downtrendline resistance…let’s see if it turns.
FWIW – interesting gap analysis
Nice chart and it is notable. Thanks.
Fascinating!
Very difficult (at least for me) to determine what is going on in terms of EW analysis with this very sharp move up. I imagine it has to be some kind of third wave. Jeff Clark thinks we are possibly forming the right shoulder of a head and shoulders topping pattern.
2 waves are usually sharp moves…like what we are experiencing today.
My count from the bottom, I get a 5-3-5-3-5 …double zz terminating right here with 2 trend lines right above it.
However….trying to wait patiently for a confirmation in a reversal. I totally missed the move up and hoping my count is correct.
Most of us did so don’t feel too badly about that. Although I was hoping to re-position at the end of minor one down, I don’t mind waiting out minor two up.
Obviously my calls expiring this week are going to take a drubbing but I am sitting tight on my UVXY shares. I think we will avoid a reverse split if they stay above 10.00
Vern,
Watching 2083.42 closely as that is the closet target to hit and turn :))
After the pop this morning, SPX tracing out a bearish rising wedge. Very interesting indeed.
Amazing pop on non-existent volume.
There you have it. A monster red candle at 2083.65. (1 min chart) Let’s see if it falls through the wedge
I guess easy to move the market when volume is thin and only FED (sorry I meant banks) left to make the markets.
A few weeks ago I recall reading a report stating majority of the funds are fully or near fully invested in the markets so no one left to buy…it was an all time high.
QQQ and SPY volume tells the tale…
Hello all…I’m new to the site. Been reading all the great posts here thanks for your insights and inputs.
Market looks extremely overbought here on multiple time frames…
Could this be the end of wave 2 here? I’m waiting for a confirmation of a reversal….
Hi Quang,
Welcome to the crazy house 🙂
Well well well! That furious bankster attack for a second wave up apparently arrived somewhat sooner than many of us were expecting! Lots of bear cages being rattled today. We are probably headed for another challenge of the 2100 pivot. The bear market trend line sits just below it so it should provide strong resistance. Boy, take your eye off the market for one second and the banksters start running wild! 🙂
lol I was wondering where you went I needed to hear about the banksters.
Well… looks like Lara won’t be exiting her shorts afterall 🙂
we might even hear a dammit out of her
Thanks for the laugh! 🙂
This might be a great opportunity to short UVXY. It decays so fast, and if we know now we’re in minor 2 up, then I’m looking to short this…
Lara writes “For this upcoming minor wave 2, the expectation should be for it to be deep and either even in duration or longer in duration than minor wave 1. Minor wave 2 may be deep enough to find resistance at the bear market trend line.”
I think its time to short this crazy fella. It will probably go sub 10 if minor 2 will be deep…
I was thinking this too.
With Minor 2 UVXY will likely under go under $10 then the possibility of a dreaded reverse split looms. This is a potential disaster for UVXY longs (such as myself).
Being short would be windfall profits.
You might be right but keep in mind that for Minor 2 to extend in time and price it will probably need to become a double zig zag, so you might be better waiting for the X wave to complete (and know that it is a 3 wave structure) before jumping in.
(c) of Minor 2 would reach the 76.4 fib at 1.618 * (a) so its possible we could do it all on this leg up, but time would be very quick compared to Minor 1 as pointed out by Rodney earlier so I think it has lower probability of going straight there.
The above will be my plan anyway.
Good point! Thank you…
As always, a great strategy! thanks!
If we get an X wave tomorrow then filling the open gap from today would be my downwards target.
For absolute safety (which is required when shorting UVXY!!), wait until price goes above the (b) wave so giving price confirmation you have a 3 wave downward structure.
Personally I won’t be shorting it if the above plays out, but I will be selling some of my position in order to get a better entry.
Good advice…
I don’t want to short this snake, but buying puts would be a defined risk play that could have a good reward. The likelihood of a reverse split makes it well worth doing.
If I recall properly, Lara often says a deep correction in a 2nd wave would be anywhere from 61.8% to 99.9%. We are at the 50% level now. And C = A at 2079
Yep. You do recall correctly 🙂
The first minor degree correction within primary 3 in the last bear market was 0.81 of minor 1.
They almost always are very deep.
Almost always is not the same as always. As always. LOL
im so confused? Wave 4 can never overlap Wave 1 so this is not wave iv we assume we are in minor 2.
To count 5 down we need to move wave iii and iv back which iv still invalidated i?
Your point is valid and correct. 4th waves of impulses cannot penetrate the 1st wave. I am guessing the entirety of Minor 1 will need to be reworked. Right now I am playing with the idea of a leading diagonal for all of Minor 1.
But I think it is safe to say that we have completed that wave down and started a wave up because on the hourly chart, we have several candles outside of the channel lines containing the down wave from 2110 to 2039.
This next wave, if it is corrective, is allowed to move all the way to the start of the wave it is correcting or basically 2109.
Until Lara gives us some heads up, I am just grasping to understand. So thanks for helping in that by posting.
Bought 10% UVXY @ 13.48 – will re-sell 10% if we invalidate.
Truck’s now full 🙂
Note to self: Next time wait until price gets down to 13.48 *before* buying the other 90%!!
we’ve invalidated as of 10:48 EST, right?
Yep
Sold 10% @ 13.45 🙁
Minor 2 it is then 🙂
And I am in for the ride up. Not my plan. But my plan went out the window with the leading diagonal or whatever the final labeling brings. Now we look for the 62% retracement of Minor 1 at 2084. Only 7 points from here. So I am locked in. Again, not my plan. I went wrong on expecting Minor 1 to make a much deeper sell off, at least to 2000. Oh well.
If in fact the 2085-2090 point holds, I may just turn out to be lucky that I did not know the end of Minor 1 and liquidate. I may have had some difficulty getting back in when Minot 2 may be complete today or this week. Just trying to see a silver lining top these clouds of confusion.
I wouldn’t beat yourself up about that – I said a few days back that I would be suprised if Mr Market made it so easy for bears to get on board. If it were easy then everyone would be Millionaires – none of us have a crystal ball and sometimes lower probabilities play out (a la today).
Main thing is that the trend is confirmed down – if we hadn’t had that price confirmation I’d be a bit more concerned.
do we really have price confirmation? I thought that whole count was invalidated?
Yes we went below Minor 4 (of Int (c) of Primary 2) @2039 confirming a trend change.
Not sure what you mean by the ‘whole count’. Only Minor 1 still requiring 1 more lower low was invalidated today
While the wave count will most likely be revised, the price point of 2039+ gave confidence that a new trend has started and that is downwards. I believe this will remain the case even with the revised wave count. But we have to wait to hear from Lara before finalizing anything in our minds. At least that is my approach.
Only the idea that we’re in minor 1 was invalidated, we’re likely in minor 2 right now. But the fact that we’re in primary 3 was confirmed by price below 2039.74.
Yes exactly ari – you explain it much better than me 🙂
Thank you….i’m learning.
I am trying to learn from my recent mistake without beating myself up. I think I am doing okay but thanks for the expression of concern. Silver lined clouds help a whole lot though. I do not like loosing in anything, anything. The fight goes on as this will be a relatively long process.
What we are counting in Minor 2 so far may turn out to be a W in a combination. As I think about Minor 2, I would not necessarily expect it to end in only 2 or 3 days.
‘W in a combination’ – yep, quite possibly the usual double zig zag.
RSI is signalling that this move up is struggling atm – I think this leg up is almost done, so maybe we’ll have an X wave tomorrow.
If so I might lighten up a bit and try and get a better entry (if it’s an obvious 3 otherwise I might end up missing the beginning of Minor 3 – again I don’t trust Mr M!!).
This is the best I can come up with at the moment..
@ 2079 (c) of Minor 2 would be equal to (a)
@ 2094 (c) would be 1.618 * (a) and also exactly the 76.4% fib
But I’m not totally sure where B started – if I’ve got that wrong then the targets will be wrong. That overlapping movement yesterday I have marked with a ‘?’ is a W1 diagonal I think – but it looks weird to me.
Exactly what I have. That scares me. He-He
Great minds and all that… 😉
In some ways you may be right that missing the end of minor one down could have been a blessing in disguise. While getting in at a slightly better price point would have been great, if the downside targets are correct it ultimately will not matter all that much.
It seems to me that the Nasdaq often leads the market down. Yesterday it was up more than the SP and Dow. Today it is lagging a bit. New highs/lows about the same on the nasdaq while volume percentage is higher than percentage of stocks going up. Could be the Nasdaq will gets through leg 2 up quicker than the other indexes.
He he – this is why I like to keep a bit of powder dry. Bargain time!! 🙂
I can count 5 up from 2057.84, but awaiting a reversal pattern.
2068.10 perhaps first confirmation. Think we might still go a bit higher
The main count is invalidated in the DOW (w4 crossed into w1).
If the SPX does the same, then I will guess we are already in Minor 2 as Daniel notes below.
SPX and DOW shouldn’t diverge that much. An extra warning, anyway.
What if wave 1 is different in the DOW and therefore not invalidated (yet)?
Good point, thought the same. Looks a bit forces, but could be..
Plot twist. Wave 2 is the flat and wave 4 is the zig zag.
I am doing my best to be logical, and not emotional.
This is now invalidated on the DOW too. 17910.20 high today over the end of Wave 1 17909.89 on the above chart.
Alternate Elliott suggestion for the DOW as I don’t know if it meets the rules to be a diagonal. W1 W5.
What if we are in minutte 4 of minute iii still?
Given the b wave is more than 200% of a wave, this is unlikely to be expanded flat of minute wave 4 and concern would be we are in minor 2 with 61.8% retracement about 2084. This would be confirmed above invalidation of 2077.52. In addition we have broken above upper trendline.
The more I look at the charts, the more I want to move the label for minute iii to the low of Friday at 2039+. That would mean we are currently in wave c of minute iv.
– Minute (iv) remains valid whilst price remains below 2077.
– We have had price confirmation of a trend change (at Primary (!!) degree).
– Whilst price remains below 2111 the larger trend is down.
– Mr Market is a sly old fox
Morning All 🙂
Good morning or afternoon for me 🙂
Yes good guess, South coast of UK
I know it well.
I’m in IoM – enjoying our 3 days of annual sunshine today 🙂
(can’t complain too much – I bail to warmer climates during winter)
UVXY below $14 pre-market (at least when I checked it was $13.69)
Another article hinting at the hidden hand controlling the markets…
http://www.marketwatch.com/story/this-sleepy-stock-market-is-about-to-get-a-wake-up-call-2016-05-10
Hopefully this is the start of Minute wave V if that was an expanded flat C in S&P also Nasdaq looking like a ending expanding diagonal?
So many ways to interpret what’s going on!!
Ouch – will definitely be some short covering this morning …
Futures are all ramped up, I guess on oil price moves
DOW 100+
S&P 12+
NASDAQ 24+
I think we have started minor wave 2
IMO We have finished the 4 minute. Also FTSE 100 is the same
Nick,
Could you please post a chart showing your count.
Could we be in some sort of double combination or an expanded flat only guessing by what i see and asking Google about patterns.
Which time frame are you referring to?
I was looking at the hourly chart, I don’t understand all the patterns yet.
Probably still the expanded flat. Minuette (c) moving higher.
As long as price does not move into minute i territory the wave count remains valid.
I think a few stops have just been hit on the S&P, resistance there has been solid.
I will take a fifth,,,
Hello Lara, off topic for this board but i will ask anyway. I have been reading today about the commodity bubble in China. Looking at FXI it is hard to see a bullish picture there either -wondering if you have thought through what China crash would have on NZ property market.
Pin that pricks the ballon?
I expect so.
When the Shanghai Composite was crashing our property market dropped a little.
When Shanghai plunges again (and it’s already turned I think, chart here) then much of the money floating around in China will cease to exist as it’s debt based. The CCP will also crack down again on money flowing out of China, with their markets crashing they’ll want all the money to stay and prop it up.
None of it of course will work. Like last time, nothing they did worked. But they’ll do it anyway. Because they will keep doing the same thing and expecting a different result?
I’ve read that $1 trillion flowed out of China to various other countries last year. And the flow continues. If that’s right, and I expect whatever it is it is large, then even a small portion will have a big effect on NZ because we are so small. Our population is only just over 4.5 million, the size of a small city in China (or the USA for that matter).
So what happens in China will have a big effect on NZ.
chart of Shanghai Composite. I think it’s turned.
Have not done analysis but quick view on a phone today made me wonder if the April top was the 2nd wave rebound from last year -scary if so. Thx for comment. Also, I lived in Auckland in 2011 -loved my time there. Noticed at that time, Auckland U had a lot of Chinese students – I thought a lot of money was flowing into NZ (and all of SE asia)
There’s so much overlapping, each of the three bear market rallies has overlapped back to above the low of the drop before.
So if this is going to have a corrective count when it’s done then it needs at least one more wave down to new lows. Most likely more.