
Downwards movement was expected from both hourly Elliott wave counts.
Summary: The probability that the upwards wave is over and the next wave down has begun is very high indeed. If the bear wave count is right (and it is supported by technical analysis), the target for primary wave 3 is at 1,423. In the short term, a little upwards movement to about 2,073 may present a good opportunity to join the downwards trend at an excellent price.
To see last published monthly charts click here.
To see how each of the bull and bear wave counts fit within a larger time frame see the Grand Supercycle Analysis.
To see detail of the bull market from 2009 to the all time high on weekly charts, click here.
New updates to this analysis are in bold.
BEAR ELLIOTT WAVE COUNT
WEEKLY CHART
Click chart to enlarge.
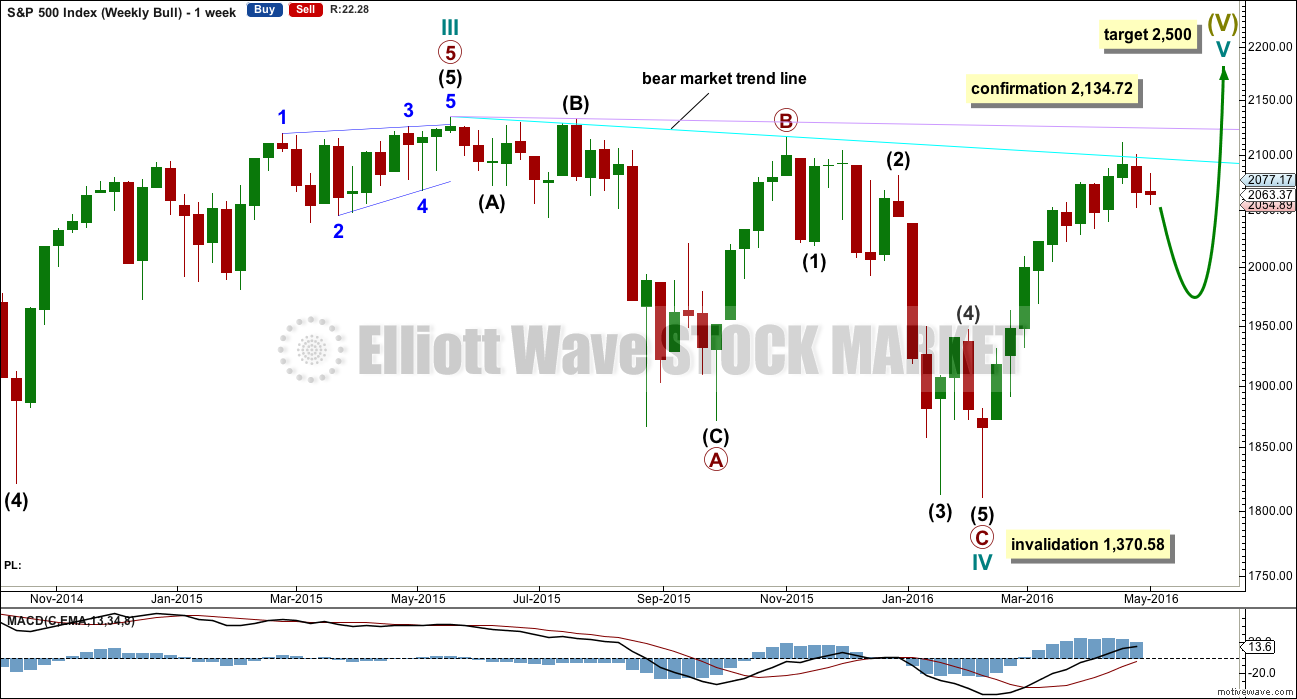
This bear wave count fits better than the bull with the even larger picture, super cycle analysis found here. It is also well supported by regular technical analysis at the monthly chart level.
Importantly, there is no lower invalidation point for this wave count. That means there is no lower limit to this bear market.
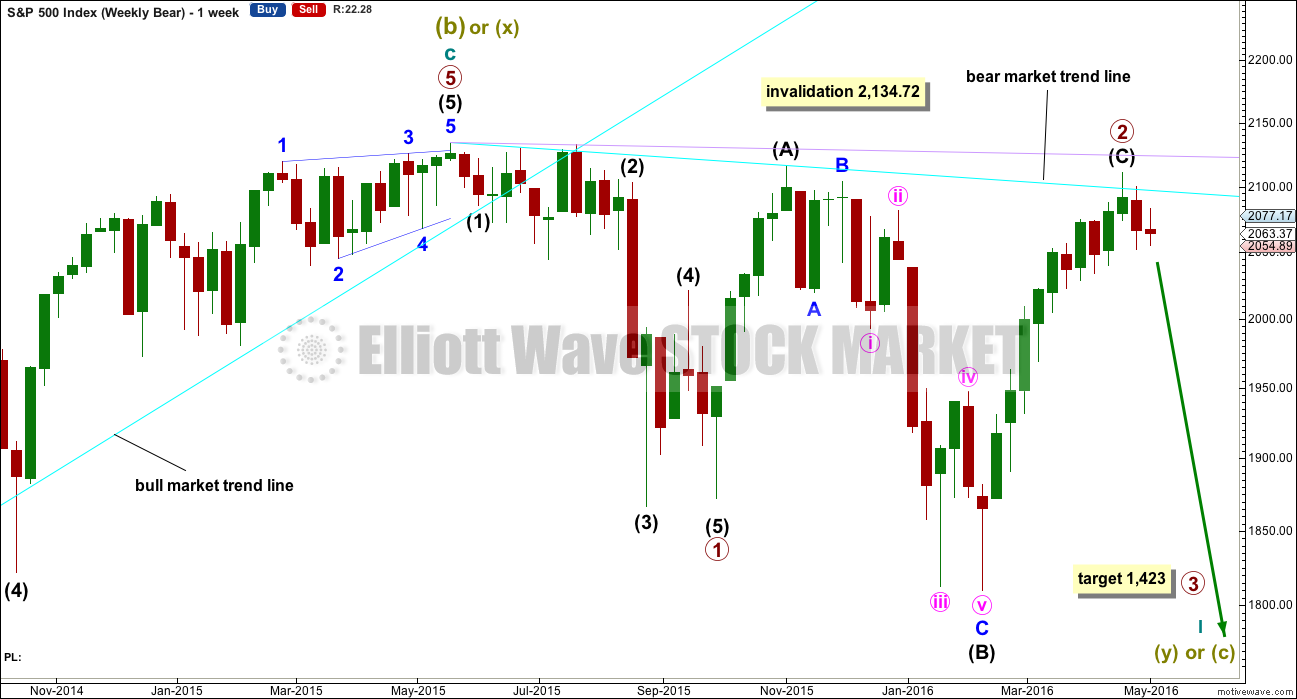
Primary wave 1 is complete and lasted 19 weeks. Primary wave 2 is either over lasting 28 weeks, or it may continue for another one or two weeks.
The long upper shadow on last week’s green weekly candlestick is bearish. Last week completes a bearish engulfing candlestick pattern.
Primary wave 2 may be complete as a rare running flat. Just prior to a strong primary degree third wave is the kind of situation in which a running flat may appear. Within primary wave 2, intermediate wave (A) was a deep zigzag (which will also subdivide as a double zigzag). Intermediate wave (B) fits perfectly as a zigzag and is a 1.21 length of intermediate wave (A). This is within the normal range for a B wave of a flat of 1 to 1.38.
It is possible but highly unlikely that primary wave 2 could yet move a little higher. If it does, then intermediate wave (C) should end above 2,116.48 to avoid a truncation. Primary wave 2 would then be a very common expanded flat.
Primary wave 2 may not move beyond the start of primary wave 1 above 2,134.72. When there is some price confirmation that primary wave 2 is over, then the invalidation point may be moved down to its end. Price is the ultimate determinator. This is the risk while we do not have final price confirmation.
DAILY CHART
Click chart to enlarge.
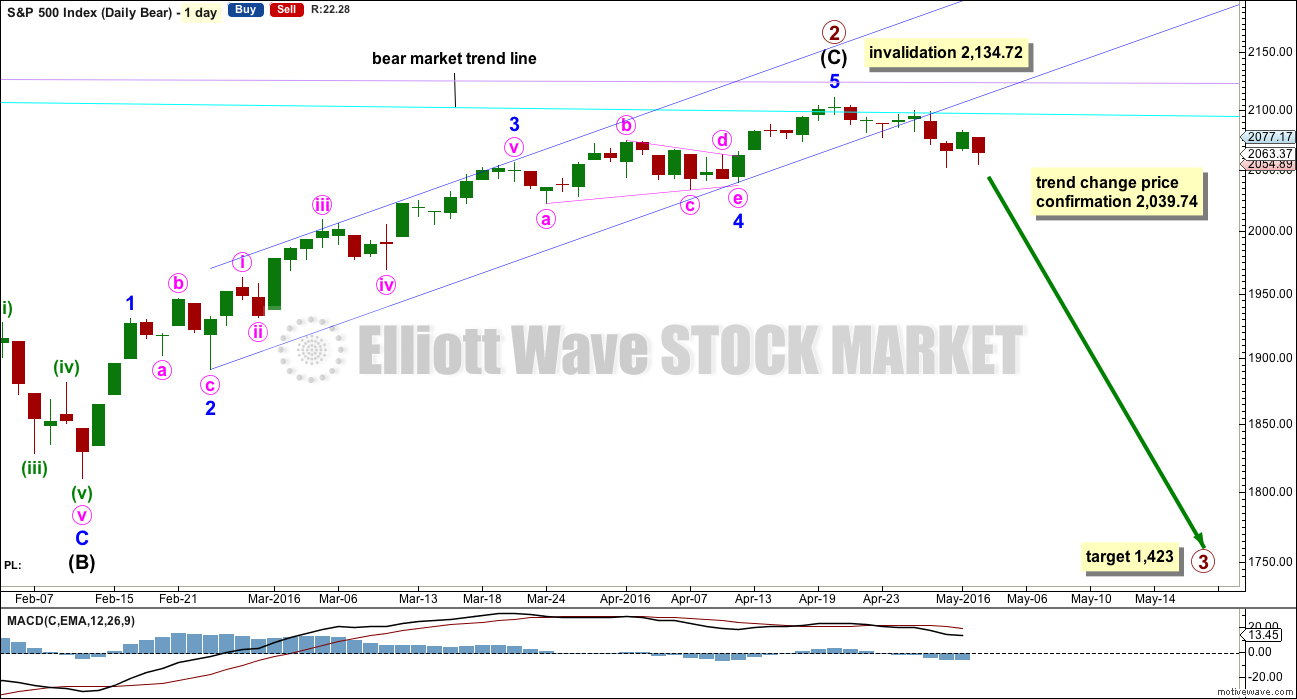
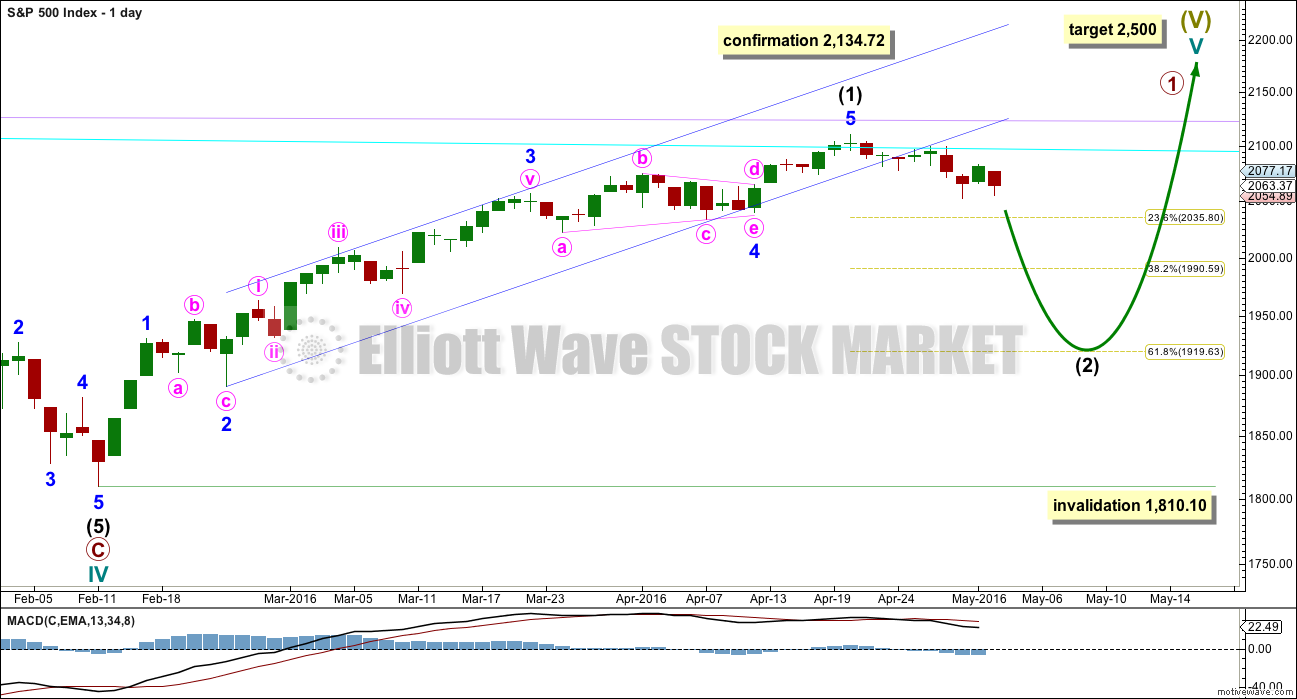
If intermediate wave (C) is over, then the truncation is small at only 5.43 points. This may occur right before a very strong third wave pulls the end of intermediate wave (C) downwards. Price confirmation of a trend change would come with a new low below 2,039.74.
The next wave down for this wave count would be a strong third wave at primary wave degree. At 1,423 primary wave 3 would reach 2.618 the length of primary wave 1. This is the appropriate ratio for this target because primary wave 2 is very deep at 0.91 of primary wave 1. If this target is wrong, it may be too high. The next Fibonacci ratio in the sequence would be 4.236 which calculates to a target at 998. That looks too low, unless the degree of labelling is moved up one and this may be a third wave down at cycle degree just beginning. I know that possibility right now may seem absurd, but it is possible.
Alternatively, primary wave 3 may not exhibit a Fibonacci ratio to primary wave 1. When intermediate waves (1) through to (4) within the impulse of primary wave 3 are complete, then the target may be calculated at a second wave degree. At that stage, it may change or widen to a small zone.
Draw the channel about the impulse of intermediate wave (C) using Elliott’s second technique: draw the first trend line from the ends of the second to fourth waves at minor degree, then place a parallel copy on the end of minor wave 3. Minor wave 5 may have ended midway within the channel. The channel is now breached decisively at the daily chart level. This provides some reasonable confidence in a trend change.
Because expanded flats do not fit nicely within trend channels, a channel about their C waves may be used to indicate when the expanded flat is over. After a breach of the lower edge of the channel, if price then exhibits a typical throwback to the trend line, then it may offer a perfect opportunity to join primary wave 3 down. At this stage, price may not move high enough to touch the dark blue trend line. It may find strong resistance at the cyan bear market trend line which is now just below 2,100. It looks like the typical throwback to resistance was quick and completed on the 28th of April.
Within minor wave 5, no second wave correction may move beyond the start of its first wave below 2,039.74. A new low below 2,039.74 could not be a second wave correction within minor wave 5, so at that stage minor wave 5 would have to be over. This would confirm a trend change.
Primary wave 1 lasted 98 days (not a Fibonacci number). Primary wave 2 may have lasted 140 days.
HOURLY CHART
Click chart to enlarge.
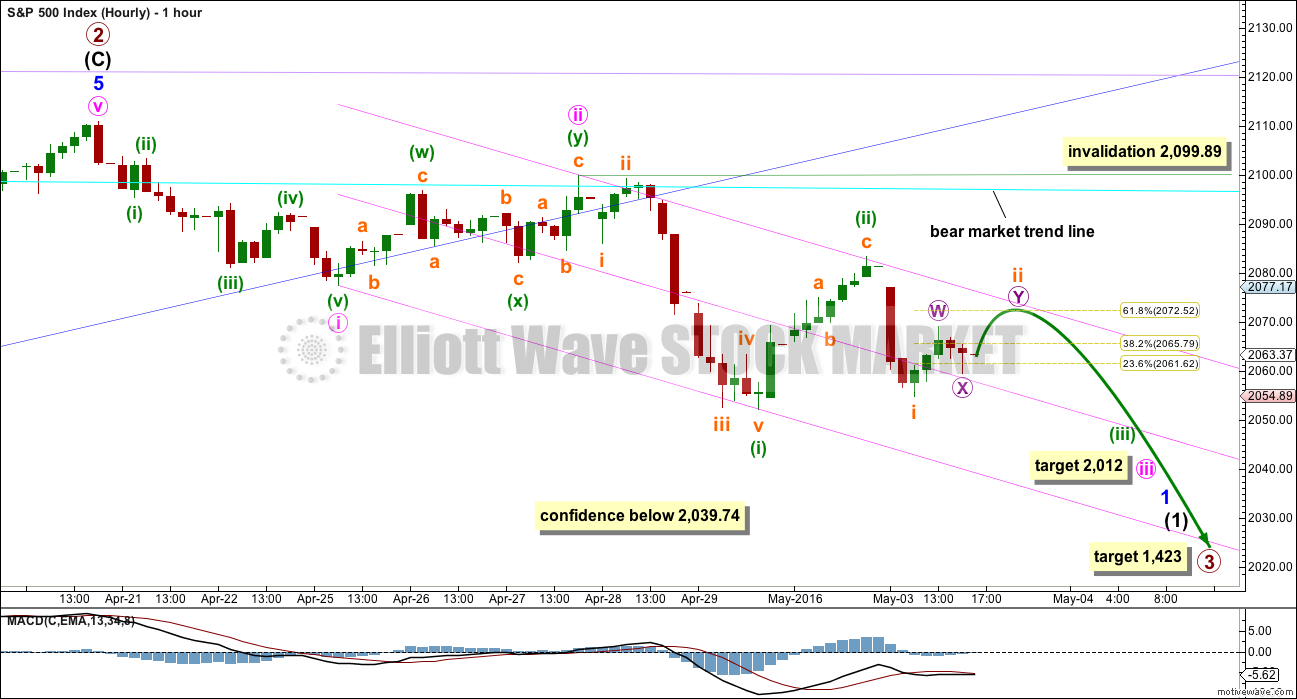
So far to the downside there is not a complete five wave impulse. Minor wave 1 still needs minute waves iv and v to complete.
Minute wave iii looks like it is extending. At 2,012 it would reach 2.618 the length of minute wave i. If this wave count is right, then this short term target may be met in a very few days.
Minuette wave (ii) is now a deep zigzag, close to the 0.618 Fibonacci ratio of minuette wave (i). Upwards movement may find resistance here at the upper edge of the channel which is now correctly termed an acceleration channel.
If minuette wave (ii) continues higher tomorrow, then it may find resistance at the bear market trend line which is copied over from the weekly and daily charts and now sits just below the round number of 2,100. At this stage, it looks unlikely as the downwards movement labelled subminuette wave i fits best as a five rather than a three on the five minute chart. This indicates it is more likely that minuette wave (ii) is complete.
Another first and second wave correction may now be completing. Subminuette wave i fits well as an impulse. Subminuette wave ii may move a little higher to begin tomorrow’s session (or after hours) to end closer to the 0.618 Fibonacci ratio at 2,073. If it is long enough in duration, then it may end when price again touches the upper edge of the pink channel.
At this stage, every time price comes up to touch the upper edge of the channel presents an opportunity to join the trend. For the more conservative and risk averse, stops may be set just above the high of minuette wave (ii) at 2,083.42. For the more risk tolerant, stops may be set just above 2,099.89.
When the middle of minor wave 1 has passed, then stops may be moved down to just above the lows of the first waves. A series of small fourth wave corrections should all remain below first wave price territory. The wave count is not there yet.
For those who are highly risk averse, then waiting for price confirmation below 2,039.74 is a viable option to reduce risk. The alternate will be invalidated once that price point is breached and more confidence in a downwards trend, at least short / mid term, may be had.
For those members who took yesterday’s trading advice and entered short, positions should now be profitable. Those members may like to consider moving stops to break even, because if price goes against the position here, then no loss would be incurred and a better entry point may be sought. If price moves strongly lower very soon as this analysis expects, then short positions should be held until targets are met or a trend line / channel is breached by upwards movement.
ALTERNATE HOURLY CHART
Click chart to enlarge.
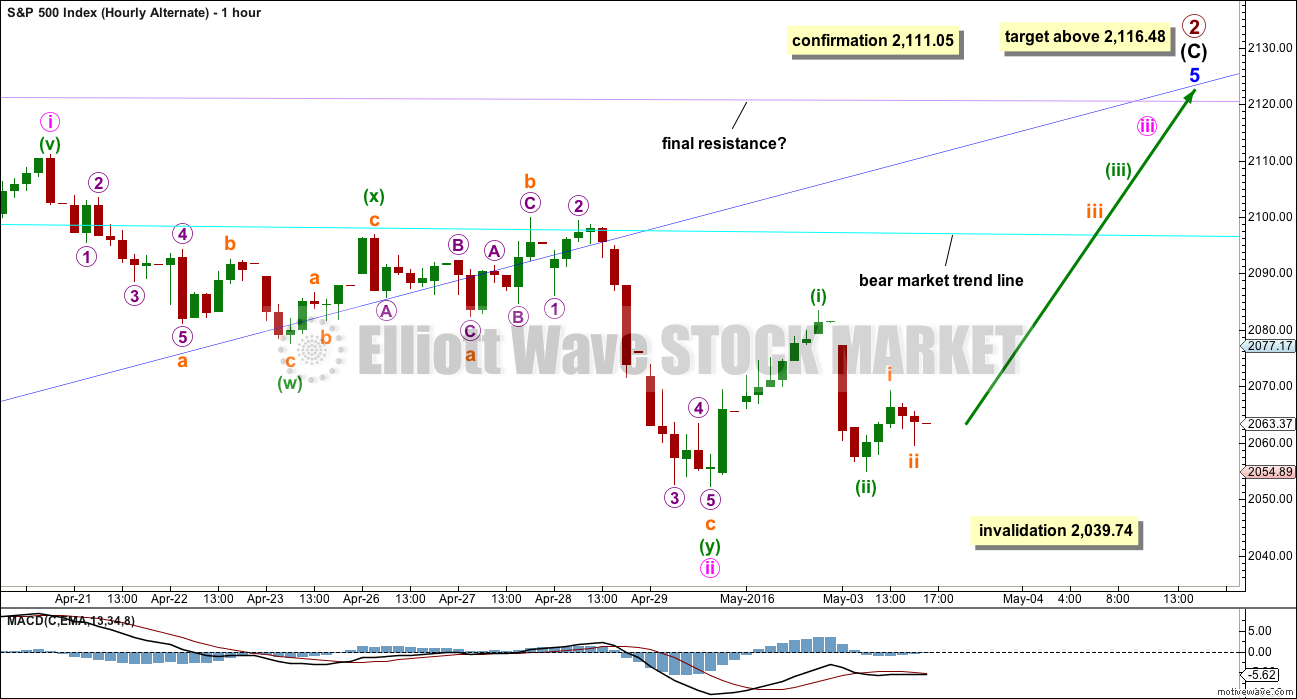
It is still just possible that primary wave 2 may not be complete. Intermediate wave (C) may yet be able to move above 2,116.48 to avoid a truncation and a rare running flat.
The degree of labelling within minor wave 5 is moved down one degree. The upwards wave to the last high may be only minute wave i within minor wave 5.
Minute wave ii may not move beyond the start of minute wave i below 2,039.74.
Minute wave ii is seen here as a double combination, but it no longer looks right. The second structure in the double is technically an expanded flat, which is okay. But it is deepening the correction, giving the whole structure of minute wave ii a downwards slope where it should be just sideways.
The first structure in the double labelled minuette wave (w) is a zigzag. The double is joined by a three, a simple zigzag in the opposite direction labelled minuette wave (x).
The second structure is an expanded flat labelled minuette wave (y). Both of subminuette waves a and b subdivide as threes, as they must for a flat. Subminuette wave b is a 1.21 length of subminuette wave a. This is over the requirement of 1.05 for an expanded flat, and within normal range of 1 to 1.38 for a B wave within a flat.
Subminuette wave c is a complete impulse and has no Fibonacci ratio to subminuette wave a.
This wave count requires a new high above 2,111.05 for confirmation. Classic technical analysis has reduced the probability of this wave count. The probability is low. Low probability is not the same as no probability; this wave count still illustrates the risk to any short positions here.
At the end of Tuesday’s session, the probability of this wave count is further reduced but not eliminated. The upwards waves labelled minuette wave (i) and subminuette wave i fit best as threes on the five minute chart, but this wave count must see them as fives. The downwards wave labelled minuette wave (i) fits best as a five and must be seen as a three. However, impulses and zigzags are very difficult to identify as one or the other with certainty. They can look very similar, so both options should be considered.
BULL ELLIOTT WAVE COUNT
WEEKLY CHART
Click chart to enlarge.
Within primary wave C downwards, intermediate wave (2) is seen as an atypical double zigzag. It is atypical in that it moves sideways. Double zigzags should have a clear slope against the prior trend to have the right look. Within a double zigzag, the second zigzag exists to deepen the correction when the first zigzag does not move price deep enough. Not only does this second zigzag not deepen the correction, it fails to move at all beyond the end of the first zigzag. This structure technically meets rules, but it looks completely wrong. This gives the wave count a low probability.
This part of the structure is highly problematic for the bull wave count. It is not possible to see cycle wave IV as complete without a big problem in terms of Elliott wave structure.
Cycle wave II was a shallow 0.41 zigzag lasting three months. Cycle wave IV may be a complete shallow 0.19 regular flat correction, exhibiting some alternation with cycle wave II.
At 2,500 cycle wave V would reach equality in length with cycle wave I.
Price remains below the final bear market trend line. This line is drawn from the all time high at 2,134.72 to the swing high labelled primary wave B at 2,116.48 on November 2015. This line is drawn using the approach outlined by Magee in the classic “Technical Analysis of Stock Trends”. To use it correctly we should assume that a bear market remains intact until this line is breached by a close of 3% or more of market value. In practice, that price point would be a new all time high which would invalidate any bear wave count.
This wave count requires price confirmation with a new all time high above 2,134.72.
While price has not made a new high, while it remains below the final bear market trend line and while technical indicators point to weakness in upwards movement, this very bullish wave count comes with a strong caveat. I still do not have confidence in it.
DAILY CHART
Click chart to enlarge.
If the bull market has resumed, it must begin with a five wave structure upwards at the daily and weekly chart level. That may today be complete. The possible trend change at intermediate degree still requires confirmation in the same way as the alternate hourly bear wave count outlines before any confidence may be had in it.
If intermediate wave (2) begins here, then a reasonable target for it to end would be the 0.618 Fibonacci ratio of intermediate wave (1) about 1,920. Intermediate wave (2) must subdivide as a corrective structure. It may not move beyond the start of intermediate wave (1) below 1,810.10.
In the long term, this wave count absolutely requires a new high above 2,134.72 for confirmation. This would be the only wave count in the unlikely event of a new all time high. All bear wave counts would be fully and finally invalidated.
TECHNICAL ANALYSIS
WEEKLY CHART
Click chart to enlarge. Chart courtesy of StockCharts.com.
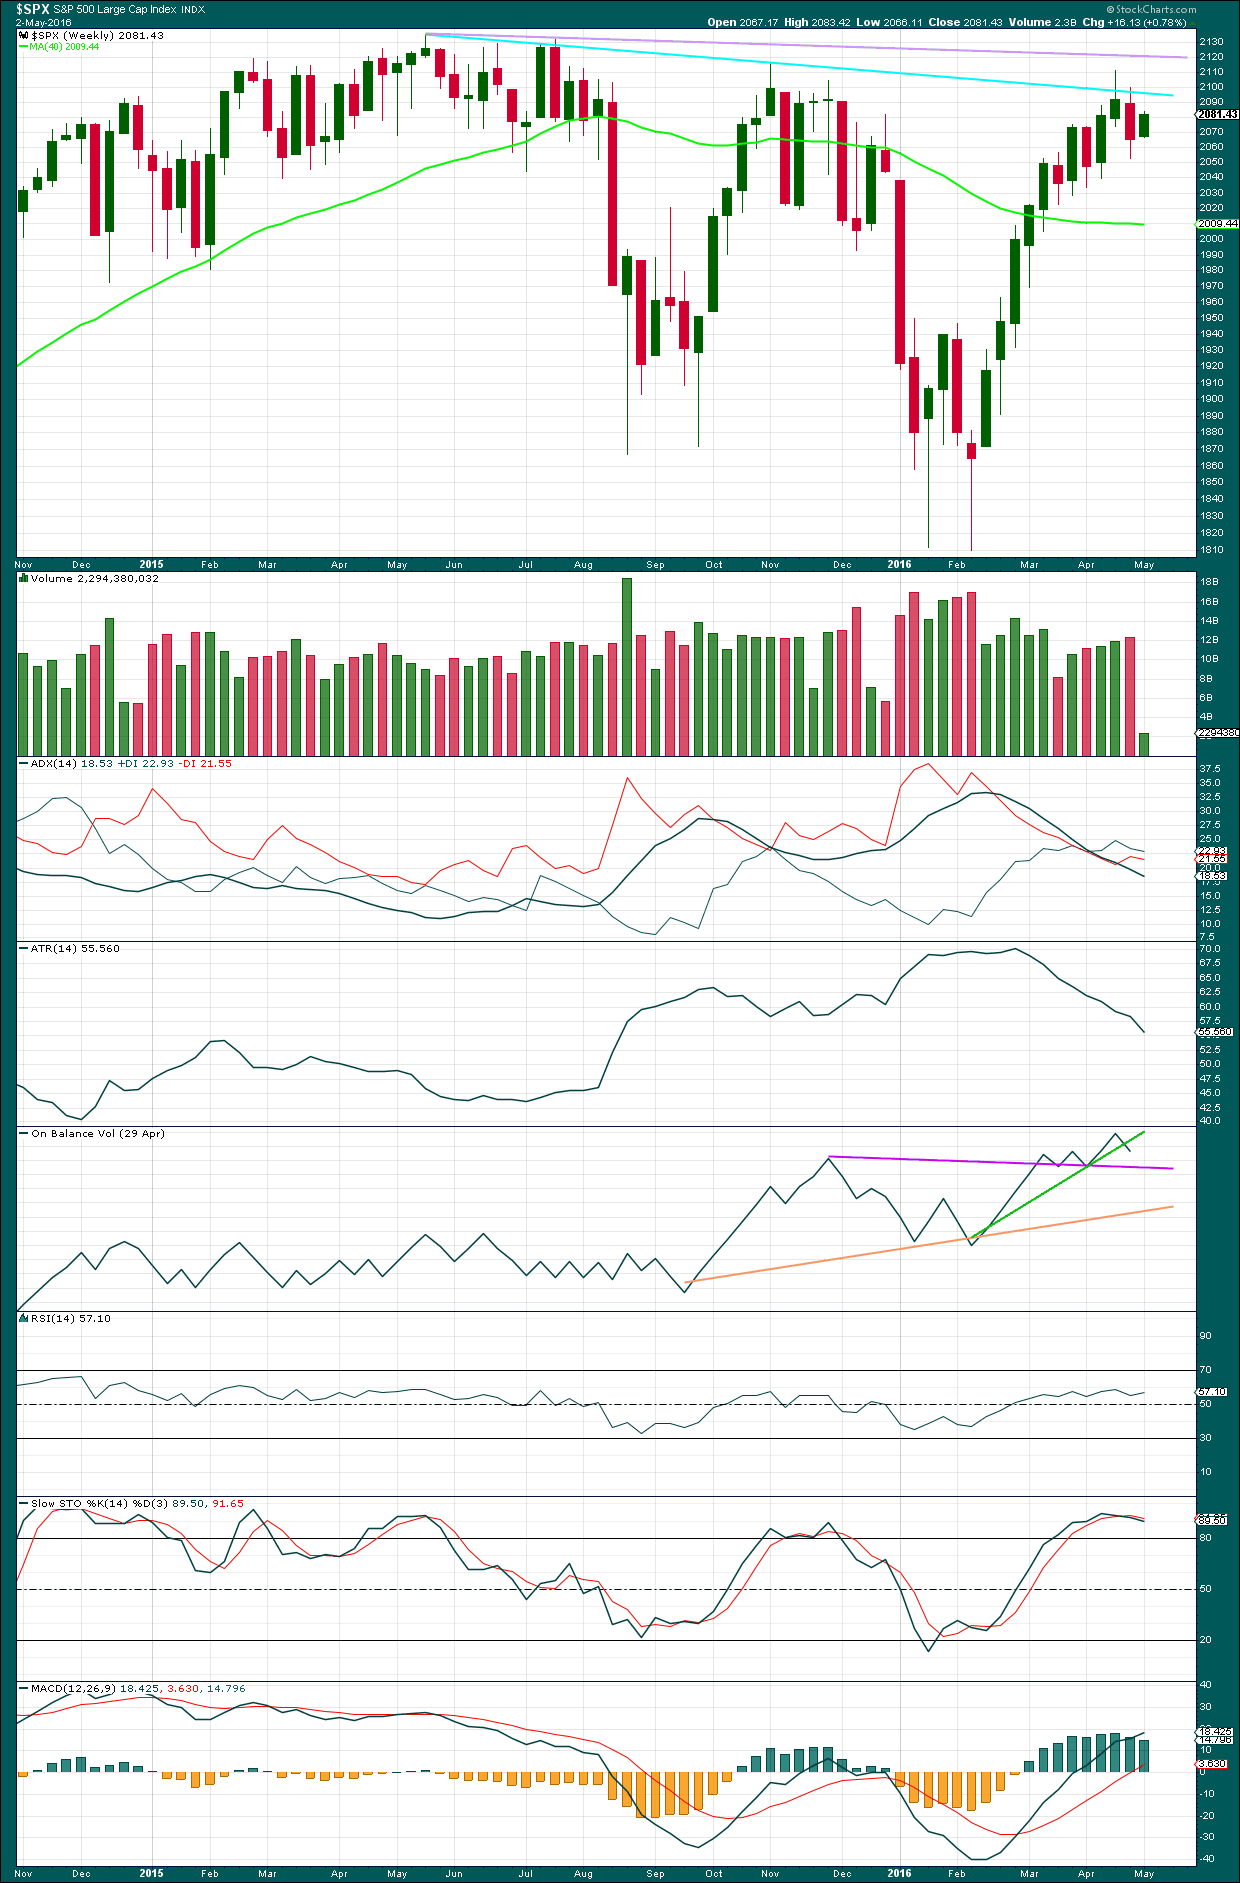
We have a bearish engulfing candlestick pattern at the end of last week. This has occurred at the round number of 2,100 which increases the significance. Volume on the second candlestick is higher than volume on the first candlestick, which further increases the significance. That it is at the weekly chart level is further significance.
Engulfing patterns are the strongest reversal patterns.
This is a very strong bearish signal. It adds significant weight to the expectation of a trend change. It does not tell us how low the following movement must go, only that it is likely to be at least of a few weeks duration.
There is a weak bearish signal from On Balance Volume at the weekly chart level with a break below the green line. A stronger bearish signal would be a break below the purple line. OBV looks bearish.
There is hidden bearish divergence between Stochastics and price at the last high and the high of November 2015. Stochastics has moved further into overbought territory, but this has failed to translate into a corresponding new high in price. Price is weak. MACD exhibits the same hidden bearish divergence.
After a period of declining ATR, it should be expected to turn and begin to increase.
DAILY CHART
Click chart to enlarge. Chart courtesy of StockCharts.com.
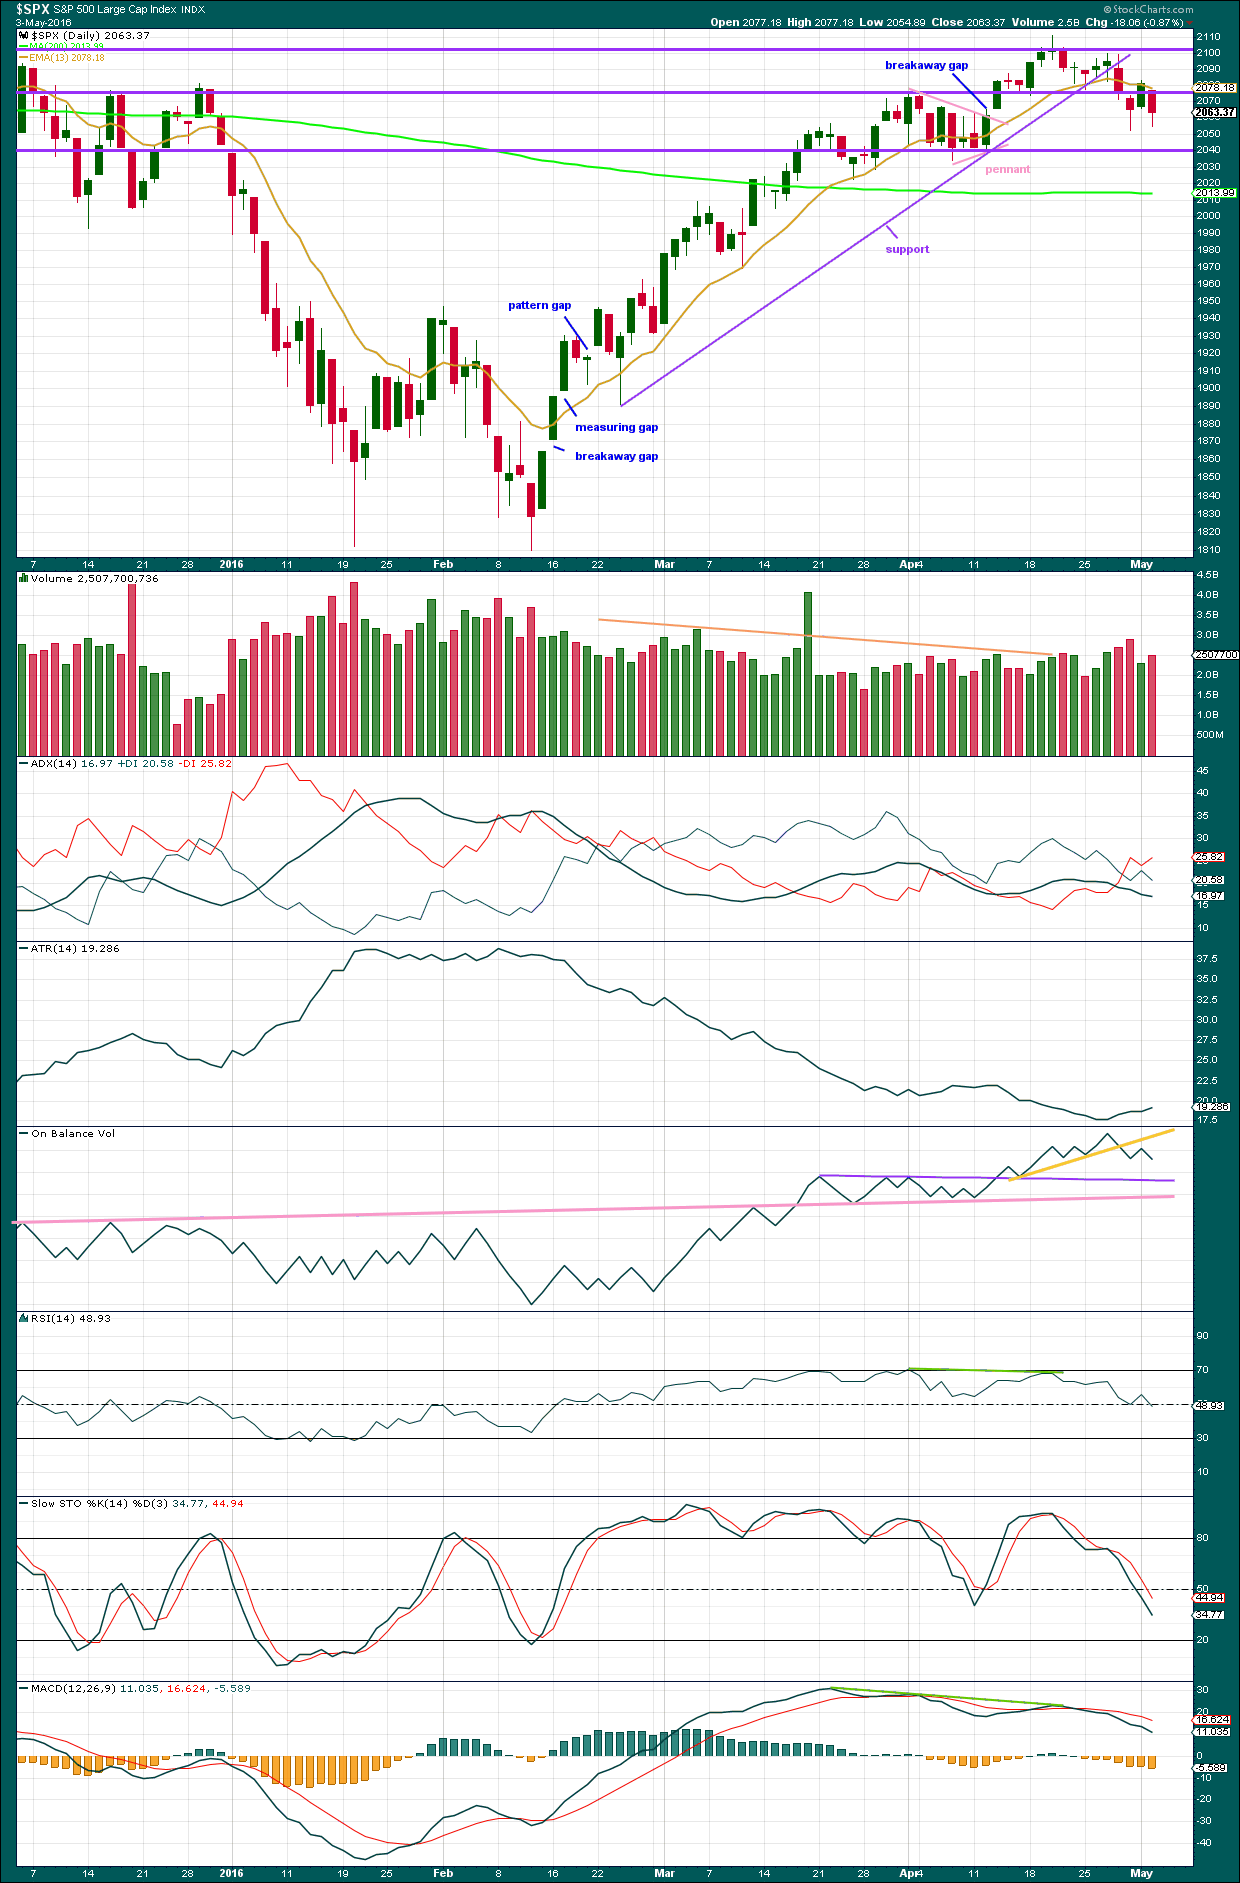
Volume data on StockCharts is different to that given from NYSE, the home of this index. Comments on volume will be based on NYSE volume data when it differs from StockCharts.
The support line is clearly and decisively breached. This strongly indicates the S&P has seen a trend change.
From the last high close to the round number at 2,100, there is volume support for falling price. Volume rises as price falls, and as price rises volume is lighter. Price today again fell on higher volume than the prior upwards day.
The two downwards days of 28th and 29th of April have stronger volume than all prior days back to 4th of March (excluding the options expiry day of 18th March). This again supports the idea of a trend change as there is clearly strong volume support for downwards movement.
Price broke below the support line and then had a quick throwback on 28th April. Price has now broken below the horizontal support line about 2,080 and is finding some resistance about there.
The next round number horizontal support line is added about 2,040. This area has previously provide support / resistance. It may do so again. If it does and a bounce is initiated from there, it would be another opportunity to join a downwards trend.
ADX is still declining indicating there is no trend currently. It has indicated a potential trend change as the +DX line crossed below the -DX line.
ATR is beginning to show some slow increase. This may be indicating the start of a new trend.
On Balance Volume gave a weak bearish signal with a break below the yellow line and now a retest of resistance there. This signal is weak because the line is steep, not long held and not often tested. A stronger bearish signal from OBV would come with a break below either the pink or purple lines.
RSI is neutral. There is plenty of room for price to fall.
Stochastics is just below neutral. There is plenty of room for price to fall.
MACD is showing some small increase in downwards momentum, but it has not yet built significantly.
INVERTED VIX DAILY CHART
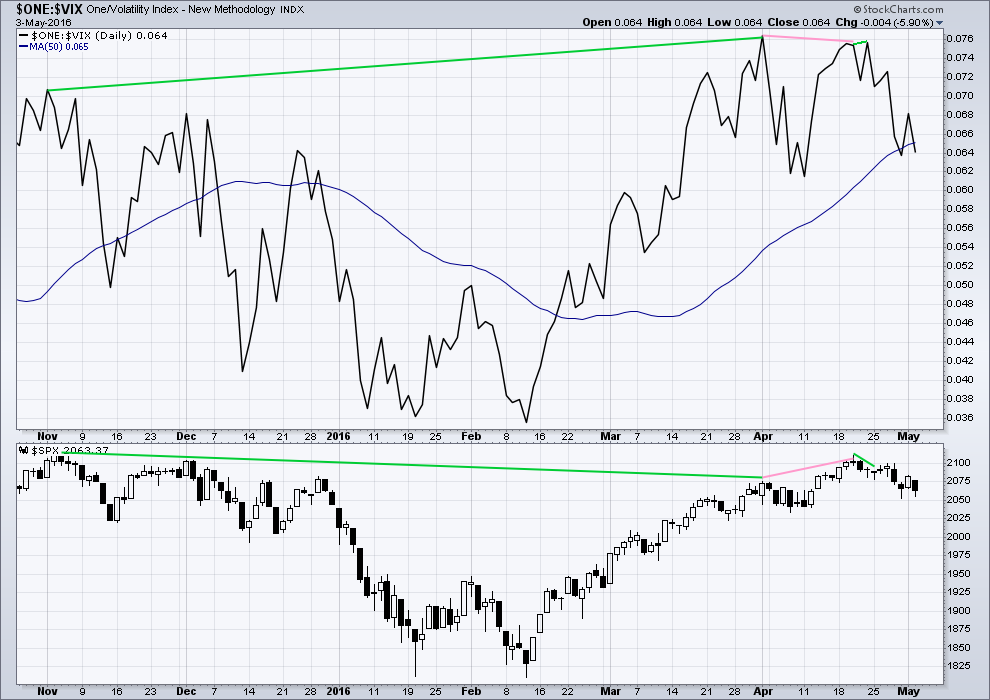
Click chart to enlarge. Chart courtesy of StockCharts.com.
Volatility declines as inverted VIX climbs. This is normal for an upwards trend.
What is not normal here is the divergence over a reasonable time period between price and inverted VIX (green lines). The decline in volatility is not translating to a corresponding increase in price. Price is weak. This divergence is bearish.
Price made a new short term high, but VIX has failed to make a corresponding high (pink lines). This is regular bearish divergence. It indicates further weakness in the trend.
ADVANCE DECLINE LINE
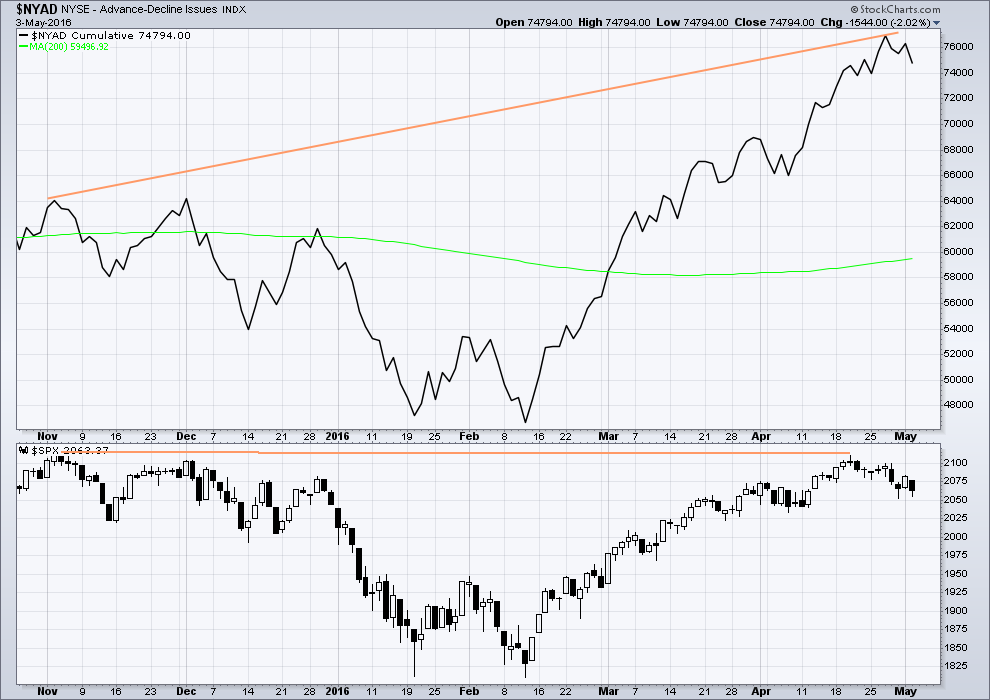
Click chart to enlarge. Chart courtesy of StockCharts.com.
With the AD line increasing, this indicates the number of advancing stocks exceeds the number of declining stocks. This indicates that there is breadth to this upwards movement.
From November 2015 to now, the AD line is making new highs while price has so far failed to make a corresponding new high. This indicates weakness in price; the increase in market breadth is unable to be translated to increase in price.
It remains to be seen if price can make new highs beyond the prior highs of 3rd November, 2015. If price can manage to do that, then this hidden bearish divergence will no longer be correct, but the fact that it is so strong at this stage is significant. The AD line will be watched daily to see if this bearish divergence continues or disappears.
The 200 day moving average for the AD line is now increasing. This alone is not enough to indicate a new bull market. During November 2015 the 200 day MA for the AD line turned upwards and yet price still made subsequent new lows.
Now the AD line is declining. The AD line today made a new low below the prior low a few days ago of 29th April. This indicates more stocks are declining than advancing. However, price failed to make a corresponding new low today. This indicates some weakness to downwards movement. It may be a warning that downwards movement may be interrupted short term.
COMMITMENT OF TRADERS (COT)
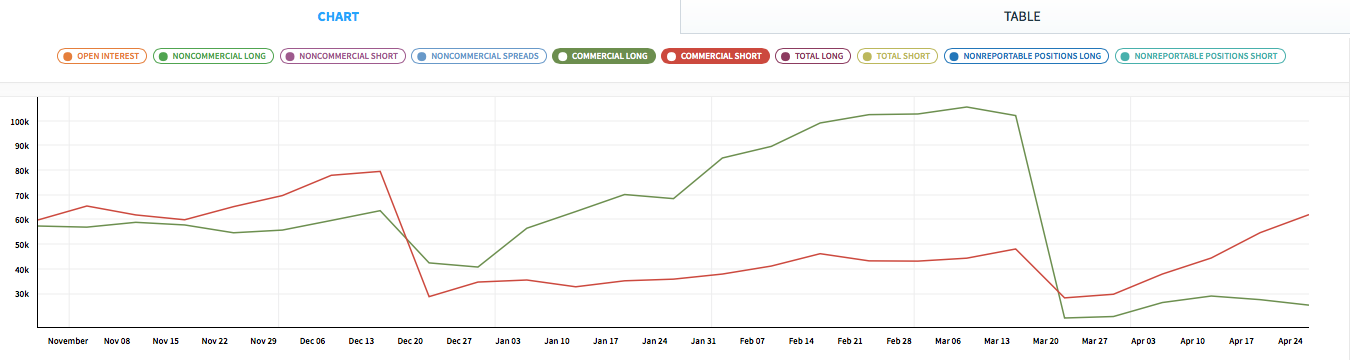
Click chart to enlarge. Chart courtesy of Qandl.
This first COT chart shows commercials. Commercial traders are more often on the right side of the market. Currently, more commercials are short the S&P than long. This has increased last week while long positions have decreased. This supports a bearish Elliott wave count, but it may also support the bullish Elliott wave count which would be expecting a big second wave correction to come soon. Either way points to a likely end to this upwards trend sooner rather than later. Unfortunately, it does not tell exactly when upwards movement must end.
*Note: these COT figures are for futures only markets. This is not the same as the cash market I am analysing, but it is closely related enough to be highly relevant.
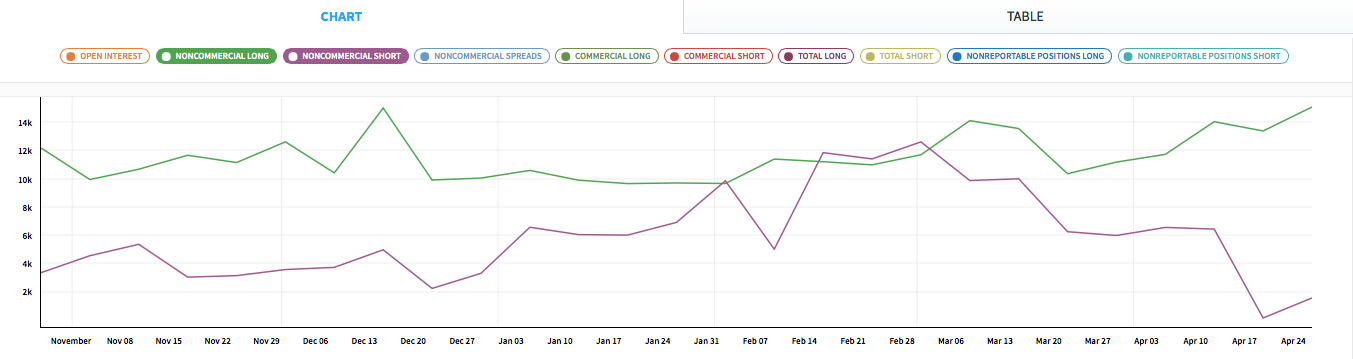
Click chart to enlarge. Chart courtesy of Qandl.
Non commercials are more often on the wrong side of the market than the right side of the market. Currently, non commercials are predominantly long, and increasing. This supports the expectation of a trend change soon.
DOW THEORY
I am choosing to use the S&P500, Dow Industrials, Dow Transportation, Nasdaq and the Russell 2000 index. Major swing lows are noted below. So far the Industrials, Transportation and Russell 2000 have made new major swing lows. None of these indices have made new highs.
I am aware that this approach is extremely conservative. Original Dow Theory has already confirmed a major trend change as both the industrials and transportation indexes have made new major lows.
At this stage, if the S&P500 and Nasdaq also make new major swing lows, then my modified Dow Theory would confirm a major new bear market. At that stage, my only wave count would be the bear wave count.
The lows below are from October 2014. These lows were the last secondary correction within the primary trend which was the bull market from 2009.
These lows must be breached by a daily close below each point.
S&P500: 1,821.61
Nasdaq: 4,117.84
DJIA: 15,855.12 – close below on 25th August 2015.
DJT: 7,700.49 – close below on 24th August 2015.
Russell 2000: 1,343.51 – close below on 25th August 2015.
To the upside, DJIA has made a new major swing high above its prior major high of 3rd November, 2015, at 17,977.85. But DJT has so far failed to confirm because it has not yet made a new major swing high above its prior swing high of 20th November, 2015, at 8,358.20. Dow Theory has therefore not yet confirmed a new bull market. Neither the S&P500, Russell 2000 nor Nasdaq have made new major swing highs.
This analysis is published @ 10:34 p.m. EST.
I just noticed another bearish piece of evidence on the daily SPX chart. Today’s candle opened beneath yesterday’s close and closed beneath today’s open. According to Nison, this is evidence the bear’s are still in control.
I do not recall ever observing (on the daily chart) so many consistently bearish candlesticks and patterns in succession and proximity of one another. But then again, I wasn’t really observing the candles in depth or diligently. In any event, I think this is significant, powerful and strong support for the EW bear count.
Lara you are to blame for creating a candlestick nut by turning me to Nison.
🙂
VIX, UVXY and other derivatives based on VIX are not going to be spiking now. It is too early. If VIX is an accurate measure of fear, and UVXY is an accurate measure of VIX, contango aside, we will not see the massive percentage spikes in VIX derivatives until fear is vastly increased. When that happens, VIX derivatives will explode exponentially.
I am guessing when we break 2039 and 2000 and start descending into the 1900’s, fear will begin to pick up. My target to unload some or all of my wagons is around and about that time. It is not unreasonable to expect UVXY to be around the 60 mark at that time. And It will only take a week or two to get there once it launches. (I know, my teacher said never start a sentence with the word ‘and’. Well I was a PITA then just as I am now!)
Vern,
Earlier today your wrote to me “Sorry about all the belly-aching bud…”
I did not hear any belly-aching. I heard concern. When you are concerned, I want to hear about it. I agree, the last couple of days like so many others are strange. I also agree with you when you say you have a simple rule, “If you have to ask if it is a third wave, it is not.”
Unfortunately before the third, comes 1&2 and coiling. It doesn’t look like a third because we are not yet there for Minor 1.
So, absolutely no problem by me if you or anyone else wants to express concern. I always appreciate it. Except for maybe ‘options’. Remember him. Too much concern. Or was it ‘kingoffinance’? I’d get the two mixed up except I think they are one and the same.
He’s still a member, I have removed his commenting privileges after his request.
I agree Rodney. I want to hear too if Verne is concerned.
Verne’s concerns about the last wave down were valid, it turned out to be a B wave (most likely, if my wave count is correct). There is something wrong with B waves.
When Verne gets concerned I get concerned. I start thinking “what if?” and looking harder for alternates.
And I have what may be the short term answer to Verne’s concerns.
The hourly chart will be changed today for short term labelling.
The “Other Guys” continue to label the move up from the Feb 11 lows to the 2111.05 high on April 20 as minor one. Has anyone seen this label from anyone else beside EWI?
I just cannot believe they are so bullish after all these years! By their count they see the current move down as a minor wave two. These guys are supposed to be the EW masters of the universe…?!
If they are right, and we should know this week, a UVXY reverse split is surely in our future…but I seriously doubt that they are….very puzzling indeed, in the face of all the contrary evidence….it really makes one wonder….
No worries – their subscribers won’t need to concern themselves about being stopped out until 1810….
Buy and hold – yer can’t go wrong 🙂 🙂
(even if they are right, I’d still expect price to dive down to 1924)
Hyuk! Hyuk!
I do enjoy your keeping us informed about the “other guys”. Every comment makes me so happy that I’m no longer their subscriber.
I should make them pay me to read that stuff! 😀
I was hoping for a Foot Long for breakfast.
Mr Market is making me hungry!
The trade of the day goes to Olga, for seeing the divergence b/w the SPX lows of the day failing to make UVXY highs… and subsequently dumping the stuff at its 2 peaks of the day…
That’s a master market trader artist, working the paint…
The paint ain’t dry no more folks…
Thanks for those updates 🙂 They helped me keep my profits also 🙂
Thanks ari – but I was always going to be flat by 2039 tbh – just got lucky on the dump points (ok – RSI and EW structure helped a bit).
Not counting any chickens yet though – price might gap down 100 points tomorrow leaving me coughing in the dust. I agree with Laras count so I am fairly sure selling was the wrong thing to do.
But a plan is a plan – if Mr Market wants me to keep my hard earned in the hat, then he’d better show the colour of his own money 😉
Well said 🙂
I would like to have seen a huge gap and go myself, but I can’t ignore the fact that 2 days ago when SPX hit 2052 (a new low at the time) UVXY hit a high of 18.40. And as we’ve been going lower, UVXY is not even close to that level.
So that’s fishy to me. I might have to trade another instrument; I have traded SQQQ’s and feel comfortable with it. But the returns are not nearly as dramatic…
Its SOH time for now until tomorrow…
The key to trading this animal (unless you are patient enough for leaps) is loading up just before impulsive waves take off, especially thirds. Definitely not a buy and hold instrument. I bailed on my last batch intra-day cause it was misbehavin’ …the shorts will eventually cover, and it will absolutely sky-rocket..
Yeah I was hoping we were in one… We still might be, although the futures are pointing up right now. Something tells me the market will be closing the last 2 gaps down (2063, and 2083), which would mean that either minute 2 of minor 1 (if we’re in a LD), or minor 2 will probably fill those gaps at some point…
Another option I have considered and charted this morning is what if minute i itself is a leading diagonal? (I see LD’s mentioned in comments below).
Charted it looks wrong. It would be expanding because 4 is longer than 2 and 3 is longer than 1. But the trend lines barely diverge. They do, but just. It meets all rules. It requires the fifth wave to be longer than the third to meet the rules, that would be below 2,035.81.
This is what it would look like. I don’t know that I want to publish this idea in the analysis today. Those trend lines look wrong.
Leading diagonals in first wave positions aren’t very common (not rare though). Leading expanding diagonals are less common. So this is a less common structure, and it has a problem with the trend lines.
I don’t think the probability is high enough for publication. But I’ll follow it. If it shows itself to be true; if momentum favours it and price limps lower tomorrow, then I may publish it.
Good morning everybody 🙂
Well this is a slow grind lower isn’t it. Not really convincing as the start of a third wave… yet.
I’m going to spend some time today going back over the last big bear market and gather some data on wave durations and depth of corrections. Maybe also ATR as the waves unfolded.
For now, the structure at the hourly chart level will have subminuette i and ii complete, now another first and second wave.
The structure of micro 1 subdivides neatly as an impulse, with an ending contracting diagonal for the fifth wave, on the five minute chart.
The diagonal makes sense and explains market action. One of the characteristics of the diagonal’s personality is that it reflects initial resistance to important trend changes and one could argue that is exactly what we have taking place in the markets right now. Let’s see how the battle progresses tomorrow. I think the other indices are going to play catch up to NDX. The action in UVXY suggests short sellers remain quite confident, but I assure you, not for long… 🙂
FTSE is also moving lower nicely 🙂
we could just have finished a minute wave 1 as a leading diagonal.
The fifth wave isn’t long enough, it would need to move lower to meet the rule for wave lengths
Wow, that’s some gap up!
Will we take out 2046.71? Or will the bears wus out again today as they did yesterday?! 🙂
Vern
Reading UVXY charts now and looks like UVXY needs to close above $17.70 ideally to signal trend change and for sure above $17.38 for bullish bias. Thoughts?
Yeah. I was a bit disappointed as I was sure it would clear 20 today. It may be the third down is just getting a slow start but it is certainly not acting they way one would expect ahead of the third wave decline…I am hoping we close above 17.00
vern,
I know we have been talking a lot and expecting the 3 to start during the regular trading hours but I get the feeling it will happen in the futures pit triggered by something overseas (or at least as a excuse). I wonder if it might involve a foreign nation offloading US debt to make a political point. Banksters need to make it feel like normal ups and down happening in the market.. JMHO
I have actually been thinking along similar lines. This is the kind of situation in which some kind of exogenous shock serves as a catalyst to catapult the market along a path it had been long preparing for. It could come in the form of a news item, not even necessarily financial….
Another problem I see with the third wave thesis is the weakness of the UVXY candles. Serious impulses generally begin with a strong gap open on increasing volume and a close near the high of the day. The open gap filled this morning was the first red flag and I think it set the tone for the entire day. It could be we get the break-away tomorrow but today sure did not look like it…
I once joked about how banksters know EW as well as the rest of us. I am now absolutely convinced they are reading Lara’s material and keeping an eye on her confirmation points!
🙂 🙂 🙂
I don’t think so. I’m such a tiny fish in a huge ocean. I expect almost none of them have ever come across me or my sites 🙂
Anyhoo… UVXY. I’m looking at the last rise there from the low of 5th August 2015 to the high of 1st September 2015.
It began with some mucking around up to and including 19th August. On 20th August it exploded upwards.
Maybe we’re just seeing another mucking around early stage? If this wave we expect down on S&P right now is as big as we think it may be, then it will also be extended in time. Which means the slow start may also take longer.
If in another week the explosion doesn’t come then I’d be very worried.
For now I’m listening seriously to your concerns, and I’m looking for alternates.
low volume day with no conviction. We are essentially flat after the gap down.
Volume Running at the same pace as yesterday. The last hour will tell the tale.
Yes, I was checking and comparing the volume and typically last 30 minutes is when the big boys come out to complete their trades.
Waiting for TSLA earnings after market close.
That’s another overvalued company… Market Cap to Sales
Down big in the final hour would put the 2039 level in range for Thursday.
Volume will end much lower today
A LD would explain the many overlaps. Interesting proportions: W3 bottomed at 2052 = 1.38 x W1; W5 @ 2045 = 1.61 x W1. All nicely in a channel. FWIW.
I was thinking the same actually…. 🙂
Noobie where..I get the 5 waves you’ve laid out…but what’s LD stand for?:)
LD for leading diagonal.. within the channel on Lara’s main hourly.
I can’t get W5 to subdivide as a 5, and W4 would be quite high so the trendlines don’t converge.
Whilst below 2059 I still think we are probably stair stepping lower in nested 1,2’s.
Lowest risk trade right now is to the upside – He he. Any takers?? 🙂 🙂
Sold UVXY @ 17.40 (less then my last batch – robbin banksters!!) – Position now @ 10%
Might let remaining 10% ride on through 2039 if it ever gets there. If we take out 2051 I’m out awaiting confirmation.
Not me. I don’t even want to try at 2nd and B waves much less this mess of a count today. But, you do your art work and I will sit back and admire. Actually I need to leave in a bit for the rest of the day. I may have to see your artwork later.
You’re so funny!! 🙂
UVXY now under $17 so perfect timing Olga. 🙂
That’s it – I’m out awaiting price confirmation (or a tempting correction 🙂 )
Mr Market needs to either finish his business or get off the damn pot!! (the porcelain kind BTW 🙂 )
Hear! Hear! I am just about ready to take that pot away and make him go to the outhouse… 🙂
now under 2047…big fight happening to keep it higher than 2047
Not looking good for Tesla..Two Tesla Production Chiefs to Leave Ahead of Model 3 Ramp-Up just out
Another high flyer that everyone should own leap puts on- a guaranteed 10 bagger imo…. 🙂
By the way folks, all the sound and fury about this morning’s action has primarily application for those of us who are making short term trades. The price action in no way alters the over-all bearish picture as per Lara’s main count. Please ignore the excited chatter if you are position trader. Thank you! 🙂
I see a long coiling snake from this mornings gap down on five minute chart…
I have another comment for those who are relatively new to EWSM and this blog. I have been here long enough to learn that when vernecarty is concerned, I have concerns. Vern has proven time and again that his ‘feel’ for the market is excellent. It is always good, however, to clarify at what level / degree Vern is referring to when he has concerns.
Yesterday Lara commented about her expertise and experience in EW counting especially relative to trading. I have said before, trading is an art as well as a science. EW counting is almost all science, almost but not all. But trading definitely needs pure science and math combined with art, wisdom and experience.
I might add the word ‘balls’ to that last list but then I would risk getting kicked off the blog.
Only on the fourth…! Four balls, and you walk bud…! 🙂
One possible alternate.
Friday’s low of 2052 is the completion of an impulse down.
The move from 2052 to 2084 is an A wave of a correction.
From 2084 to today’s low of 2047 is a B wave.
From 2047 to above 2084 will be wave C to complete a correction.
Just a possibility from this amateur wave counter.
Yep – my line in the sand is 2069.17 for that reason, but would make Minuette ii (which is what you are talking about I presume) out of proportion with Minute ii (albeit not by much).
Atm as long as lower lows and lower highs continue I think it is more likely we are just stair stepping lower in a load of 1,2s which will start to gather steam eventually.
If we take out 2053.66 to the upside I’ll start to get suspicious.
TOS charts say a new low of the day now 27.40
uh, that would be 2047.4 – dunno how that happened 🙂
We have taken out the 13 and 34 day ema’s. We are now up against the 50 day ema at 2040. Then comes the 250 day ema at 2031 and finally the 200 day ema at 2013. Each of these will provide resistance.
It is to be expected that these resistance points to the downside combined with the formation of the wave patterns 1-2, 1-2, and so one will not only take time but will be slow and thus, frustrating. Momentum may not build until we pass the midway point of Minor 1 or even midway of Intermediate wave 1. At that point we see things falling off a cliff or producing the waterfall effect.
So often the kick off of this process is followed by a gap down on the daily charts that is not filled during this leg of the bear market. It is called the midway or measuring gap. Until then patience is required to combat worry and frustration.
Hey Rodney:
Shouldn’t the 250 day ema be lower than the 200?
So right. Sorry about all the belly-aching bud…. 🙂
If we take out 2047.52, that little zig zag down and up was just another 1,2 added to previous 1,2’s… Look out below!
How many times now have we been eagerly awaiting the arrival of a powerful third wave down only to have the market pull a fast one??!!
I’ve lost count!! 🙂 🙂 🙂
Somebody please check and let me know if third waves went extinct….! 😀
Wow! FIVE bounces off the lows on 15 minute chart…
No… it’s alive and well.
Keep in mind … pre 1982 bear markets were a death by a 1000 cuts. (and this is a fact because I studied in college – This seems to be lost in current times/teachings)… slow long drawn out declines… IMO… this is what we are seeing now until we hit a breakdown point (IMO 2000 or 1810 not sure which) ONLY then will we feel the full force of THE 3! Also IMO that part of this will NOT begin in an overnight session.
Remember, Lara has said a million times that THE 3 starts slow.
I am headed to the Elliott Wave Historical Museum this afternoon. I’ll look around to see if they have a display of dinosaur waves. If I find one I’ll take a selfie with it in the background. To whom shall I address it?
LOL! I’d love a pic. 🙂
To me please?
Actually, I think I’ll come along too. I have some work to do with the dinosaurs.
I am not a bean counter nor a wave counter. But I am seeing impulsive waves down and corrective waves up. If we break 2047.52 in a few minutes that perspective is continuing. 2039-2034 should be taken out sometime afterwards, maybe today and maybe not.
New lows for the day and thing start looking a LOT better.
One troubling thing – the long up candles had a ton of volume behind them.
We’re sinking down but without conviction.
That could empale the bears in the afternoon session.
It takes buyers to push the price up. It only takes a lack of buyers to cause it to fall. Perhaps the large volume trades to the upside are the banksters. It can go on like this for a while.
I sure wish the Fed and all central banks had to meet margin calls with something other than funny money or digital money..
It’s all funny money.
A great reminder of the importance of Lara’s confirmation points. One good thing about the wrangling around the 2050 pivot is that the market will probably slice through the 2000 pivot like a hot knife through butter. The bull burned an awful lot of capital the last two days…
The last two day’s… All I still see are Stair Stepping 1, 2’s down on the 5 min. chart.
I would like to see 1, 2’s and 1, 2’s all the way down below 2000 with the final 2 kissing the underside of 2000…. then THE 3!
For a minute or two this morning I was thinking: “Are they really going to print a green candle today???!!”
Never underestimate the banksters…. 🙂
This is totally insane…yet another bounce off this morning’s lows folks…
You give these people too much credit! At some point they all run out of money!
You are so right. How did you like it when BOJ announced more QE and in response the yen shot through the roof?
I thought that was a signal event in coming era of bankster impotence.
While they can print unlimited amount of paper, even that clearly has its limits…
Patience
This is happening. Put your stops in and wait
A once in a life time chance to ride this wave
Paresh, good to hear from you. I never did hear how you enjoyed the marathon. Hope it was good.
Took the money and ran on UVXY shares…..not bad at 1.70 per share gain…
Now a C up of an ABC?
C = A around 2060; easy because of the double bottom!
Reminder to everyone, Friday May 6th is Non Farm Payroll Release 8:30 EST
ADP this morning reported 156K in April vs expected 195K…
Thanks DSProspering for the reminder.
A price shock, probably to the downside?
This is one of the strangest days I have ever seen in the markets. If I were to give it title I would call it “The day the market stood still” 🙂
Does anyone know if this meets the rules for a leading diagonal down?
I think the sub-waves all have to be zig-zags…
Leading Diagonal
When diagonal triangles occur in the fifth or C wave position, they take the 3-3-3-3-3 shape that Elliott described. However, it has recently come to light that a variation on this pattern occasionally appears in the first wave position of impulses and in the A wave position of zigzags. The characteristic overlapping of waves one and four and the convergence of boundary lines into a wedge shape remain as in the ending diagonal triangle. However, the subdivisions are different, tracing out a 5-3-5, or 5-3-5-3-5 pattern. The structure of this formation (see Figure 10) does fit the spirit of the Wave Principle in that the five-wave subdivisions in the direction of the larger trend communicate a “continuation” message as opposed to the “termination” implication of the three-wave subdivisions in the ending diagonal. This pattern must be noted because the analyst could mistake it for a far more common development, a series of first and second waves, as illustrated in Figure 5.
The main key to recognizing this pattern is the decided slowing of momentum in the fifth subwave relative to the third. By contrast, in developing first and second waves, phenomena such as short term speed of movement and breadth (i.e., the number of stocks or subindexes participating) often expands.
Source: Elliott Wave International
That’s a ending diagonal 3-3-3-3 in a final wave,leading is off the top of my head 5-3-5-3 and is found is W1 & A waves I think
Thanks guys!
I have a few mid term positions deep in the money and am taking half off the table…too much ambiguity in the market right now for my liking. This kind of wrangling more often than not will see a bullish resolution, notwithstanding our expectations based on the wave count…just my two pennies folk…
Sold UVXY @ 17.50 – position now at 30% intend to buy back at 2038.
Nice profit but feel UVXY should be higher. At some point in the near future (below 2039) it should take off and not look back.
If we bounce in 3 waves I might do a bit of scalping above 2039. I’m still in ‘conservative’ mode 🙂
I moved my UVXY stop up to 17 on my most recent buy….
This is nuts! SPX again bounced exactly at this morning’s lows!
What’s up with that??!!
O.K. We must be in a zig-zag (or regular flat)for a small second wave and if that is true we need a C wave up to conclude this nonsense….
I am closing out a few short term trades for a small profit. I don’t like what I am seeing.
Made a quick double in IBB short.
I hate banksters!!! 🙂 🙂 🙂
I think we are going to get some kind of sharp break from this triangle formation; if it breaks to the upside it could be a good short entry point….watching….
Efforts underway trying to keep S&P from breaking below 2048. Lot of money being spent to maintain the level.
I have never seen quite anything like this. The banksters have totally lost it…! I guess they have decided to defend the 2050 pivot…It should break pretty hard or else I am going be a bit worried…
Something’s gotta give..
Only means this thing will break hard and it will be a landslide when that happens. It is building up to that breaking point now.
Yeah. We could see a massive gap down once they break the banksters’ put…
I just noticed something interesting. Short positions are not giving up any value with this sharp move back up. It looks like somebody is shaking a few trees….
If we dont break the low of today i am starting to see a larger triangle forming simular to the april one? if that played out it could give a pop to the topside looking for the origional target of 2122 is area? what are your thoughts or am i just over thinking?
I am not sure what the structure is but I agree if this morning’s lows are not taken out and soon, something other than a third wave down would have to be considered…
If we don’t break the today’s lows that is a big problem – and we will most likely move back up. If not today then tomorrow. Lots of technicals point to going up. I could see sideways and up today, followed by a strong move up tomorrow. Then down. We really need some confirmation…
Where is the selling pressure??
Fat candles in the moves up, tiny candles in the moves down…. 🙁
Are the bears playing with their food??!
We should know that in 10 minutes…. 🙂
One piece of information that should build confidence is that NASDAQ / COMPQ had taken out 4747.65 which is Lara’s target equivalent to 2039 on the SPX. The NASDAQ has been leading. In fact, Lara’s chart shows Intermediate 1 & 2 completed on NASDAQ.
So, SPX should follow the leader.
Yeah, that is what is so strange about today. NDX has already taken out all its major moving averages so SPX should by all expectations be playing serious catch-up…
I am not about to sell calls against my UVXY position ahead of a possible T3 down so I am moving my hard stop to close to today’s low at 16.50 to protect gains…
UVXY may be saying not to sweat it….heading higher after filling open gap…
Everyone should just RELAX and let it all play out!
Stair Stepping 1, 2’s down on the 5 min. chart… keep it going just like that to below 2000. 1 again now.
THE 3 will not start in the overnight session!
It will start during the regular trading session and trap as many of the BTFD crowd as possible.
I am starting to think the bears are going to do to the bulls today, what the bulls did to the bears yesterday….
It’s 1:30PM and I still only count 1, 2’s stair stepping down.
I am thinking some kind of combination with a contracting triangle as a part of it.
Unfortunately, relentless bankster intervention tends to produce these kinds of complicated waves that makes it hard to get a good read on what’s actually going on…it really sucks! 🙂
Gold is rearing up to go higher, which should correlate with the SPX going down.
Generally third waves down take all asset classes with ’em…at least initially…
What bothers be about today’s action is that after surrendering so much of yesterday’s decline the bears should have be locked and loaded for today…they are clearly not so far, and for an expected third wave decline that is to say the least abnormal…
I did not like the action in the futures, I like today’s action even less. I think we have something other than a third wave developing here….
Hourly candle stick failing to close below 2054 actually make it looks like a more legitimate double bottom than we had yesterday? Running flat all the way back up to 2081-2082 in play possibly? (I’m a noobie but just postulating :))
Not sure whats going on but looking at my chart we bounced off the lower trendline of the triangle we had at the start of april (now top since they crossed) now we have just touched the bottom of the small triange we broke thismorning.
This is not good! Not the way a third wave down should be unfolding…caution warranted here….
You are right in that caution is warranted especially until we get past 2039. If we are in another 1-2 of a lower degree, things are okay. It is coiling and about to spring. However, you and I both remember how many times we have seen T3 and Q3 (quadruple third) only to see it evaporate. The most recent example is January – February 2016.
Patience and caution are the words for today.
I have a very simple rule. If you are wondering whether or not it is a third wave down, it’s not!
Take out of 2048.48 suggests another first and second wave…
1, 2’s are fine… they are always followed by a 3.
I would like to see 1, 2’s and 1, 2’s all the way down below 2000 with the final 2 kissing the underside of 2000…. then THE 3!
Lara, would you give a time estimate for Primary 3 target of 1423? I accept it’s just an estimate but yours is better than mine.
“Primary wave 1 is complete and lasted 19 weeks. Primary wave 2 is either over lasting 28 weeks, or it may continue for another one or two weeks.”
Will add that into todays analysis.
Primary 1 lasted 10 weeks. Primary 2 lasted 28 weeks.
In days: primary 1 lasted 91 days, primary 2 lasted 140 days.
No Fibonacci numbers in there at all. The primary 2 is close to a Fibonacci 144 days, that’s the closest.
So an estimate using Fibonacci numbers may not help.
In days primary 2 is somewhat close to 1.618 the duration of primary 1.
So primary 3 may be longer in duration and length than primary 1. My estimate would be a Fibonacci 21 weeks.
Thank you.
So far so good; now let’s get that measly SPX confirmatory ten points to the downside out of the way so we can really get this thing going…
UVXY should be punching through 18.50 and in short order if this is a T3 down…
Lower low – odds continue to stack in the bears favour. Short term line in the sand 2069.17
T3 ?? What is this.
BTW, gap open in UVXY then the pullback to fill is complete. Time to move up to new high for the move. Thereafter, it is off to the races.
Triple third….
It will be interesting to see of the banksters make a run at the gap from yesterday’s close at 2063.37 or the low at 2054.89…I really would like to see us accelerate away from this markers and sooner rather than later..
A new VIX ETF attempts to solve the contango price erosion problem of existing VIX products
“Is The Holy Grail of VIX Investing Finally Here?”
https://vixcontango.com/Site/Blog
Great referral. Thanks. I have only briefed the article. But it looks like I will learn a lot by reading it.
VIX is notoriously bad for mis-pricing options since you cannot exercise them prior to expiration…
Looks like we are going to have another day of fiercely contested price action. The banksters have been fighting the trend dumping tons of cash into the futures market. I was actually hoping to see much more futures downside for a triple third upcoming wave so this situation bears watching closely, no pun intended….
I would like to see us down at least 15 SPX handles out the gate…
Hi Lara,
is target for Minute III still 2012? This seems a bit high?
200 dma is at 2013.99 so that sounds just about right. Minor one will probably end in that area and lead to minor two up. If it slices through it, as well a P3 down might, all you- know -what is going to break loose. Traders are going to be looking for a reversal in that area and we might not get it exactly for that reason.
So many have had their instinct absolutely ruined by the banksters over the last several years as the market repeatedly ignored all kinds of red flags and continued to march higher, I suspect a lot of folk still do not realize that there is a new sheriff in town, and her name is Momma Grizzly…
I plan on pulling the trigger on short term trades at the end of minuette three as I suspect minor two will be deep. After minuette five slightly breaks the minuette three low will be a good place (for the nimble) for an upside scalp…
Ooops! I meant to say minute three, and minute five…but y’all knew that! 🙂
Vern,
Have you looked at PCLN pre-market down over $125 and counting?
I always thought that one was a dog and was under water on my short as it always seemed able to defy gravity. I think it has a lot farther to All the former high flyers are going to take at least a 50% haircut in the next 12 months. This a good example of how valuable leaps can be when a fundamental thesis is sound.
I am actually amazed that you remembered that I shorted that baby!
I forgot mentioning it! 🙂
Subminuette three of minuette one moved down about 25 points…subminuette three of minuette three should show more momentum and distance…
Is it true that if wave 2 is sharpe 4 will be flat and vice versa, i assume if after minute iii down minute iv could be flat as minute ii looks sharp, that way iv wont overlap i and then a dip for the v.
Yes – alternation is very common, but it is a guideline not a rule.
Sometimes you don’t get alternation, but I generally give counts that exhibit it higher probability than alternates that don’t.
W2s are often sharp. You might find it very useful to read about the ‘personality’ of each wave as it makes it easier to understand the reason why some patterns go sideways / are sharp etc (it is human emotion creating those patterns based on greed, fear etc).
Once you understand the purpose and personality of each wave you are in a much better position to judge if your highest probability count makes sense or not.
That target was for minuette degree imo, not minute – I have a target for minuette iii @ about 2006 which would make it 1.618 the length of minuette i.
I think maybe Lara’s 2012 target was based on minuette ii going a little higher a couple of days ago – maybe she did not update her chart (or perhaps she was basing her target on something else)??
You can work targets out as follows (all my price points are approx):-
Minuette i was about 77.08 in length
47.64*1.618 = 77.08 projected length for Minuette iii
Minuette ii likely ended @ approx 2083.40
So target for Minuette iii = 2083.40 – 77.08 = 2006.32
If that target is too high (price blasts right through), then 2.618 is the next most common fib target.
CORR: Minuette i was about 47.64 in length
I have minute i as 33.53 points in length. Minute ii ending at 2,099.89.
The target for minute iii is 2.618 X minute i
2,099.89 – (33.53 X 2.618) = 2,012.11
Then I round to the nearest whole number.
Hi Lara,
I am a bit confused about the timing put on your messages. Presumably it is about 9:30 pm in NZ at the moment but your latest message says 5:29 am?
Probably using the server time which maybe hosted in the US
^ This.
All time stamps on the site are EST
FTSE is moving strongly lower during it’s morning session. I expect S&P will follow when NY awakes.
Nice your analysis on the FTSE is playing out well so far, i was going to short that on the trendline pop it had a while back but decided against it, stick to trading S&P, too many trades might not workout well for me.
I like to trade about two or three different markets. If one doesn’t work so well, another generally will.
Malcom,
Yesterday, I was involved a bit posting about mistakes made in the past. Olga, Vern and I shared some experiences from long ago as well as most recently. I reflected on this conversation during the day. I am of the opinion as complexity of trades and positions increases so does probability of mistakes. At least this is true for me. So right now, I trade one market and one market only. Once I think I have a satisfactory handle on this market, I may choose to add another. But it will not be another equity market. It will be something else like precious metals.
Just some thoughts. By the way, I appreciate your recently increased participation in the blog. Thanks.
We may have just broken out lower of a triangle from what i see, lets see if it can take out the low or will it merge into something else?
With a slight new low it looks like subminuette ii was over already.
The middle of a third wave looks close now.
Still within minor wave 1.
So are we in a third of a third wave, i assume we expect a bounce shortly for a fourth wave followed by a fifth wave down to complete minute iii?
Triple thirds. Subminuette three, of minuette three, of minute three, of minor one…
hey,,, you guyz are on it , competition is getting tough, I’m the turd again
Yep! Turdy, er….I mean tardy once again…! 🙂
Hi
Got it. #1.
Nicely done 🙂