
The main Elliott wave count expected downwards movement for Friday to a target at 2,046.
Downwards movement unfolded as expected, but fell 6.28 points short of the target.
Summary: The probability that the upwards wave is over and the next wave down has begun is very high indeed. If the bear wave count is right (and it is supported by technical analysis), the target for primary wave 3 is at 1,423. In the short term, a small fourth wave correction may continue on Monday and be followed by another fifth wave down. That would complete a five down and should be followed by a three up, which may offer a good entry point to join the trend.
To see last published monthly charts click here.
To see how each of the bull and bear wave counts fit within a larger time frame see the Grand Supercycle Analysis.
To see detail of the bull market from 2009 to the all time high on weekly charts, click here.
New updates to this analysis are in bold.
BEAR ELLIOTT WAVE COUNT
WEEKLY CHART
Click chart to enlarge.
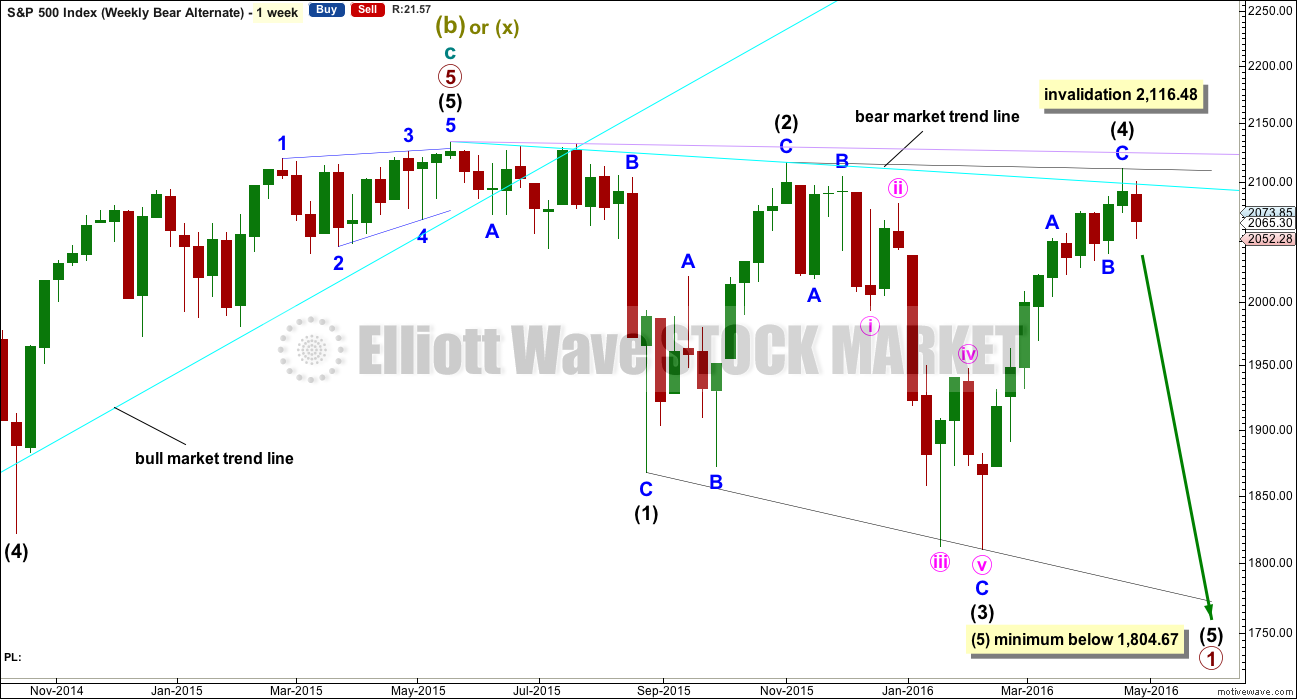
This bear wave count fits better than the bull with the even larger picture, super cycle analysis found here. It is also well supported by regular technical analysis at the monthly chart level.
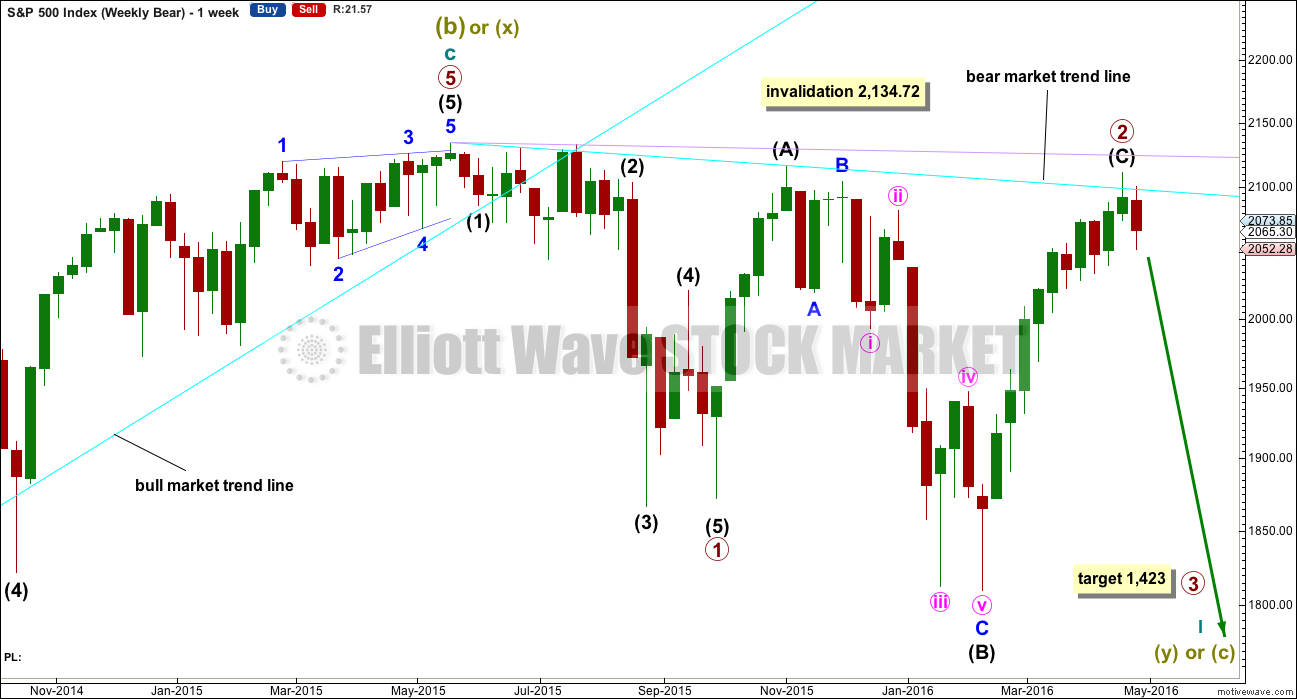
Importantly, there is no lower invalidation point for this wave count. That means there is no lower limit to this bear market.
Primary wave 1 is complete and lasted 19 weeks. Primary wave 2 is either over lasting 28 weeks, or it may continue for another one or two weeks.
The long upper shadow on last week’s green weekly candlestick is bearish. This week completes a bearish engulfing candlestick pattern.
Primary wave 2 may be complete as a rare running flat. Just prior to a strong primary degree third wave is the kind of situation in which a running flat may appear. Within primary wave 2, intermediate wave (A) was a deep zigzag (which will also subdivide as a double zigzag). Intermediate wave (B) fits perfectly as a zigzag and is a 1.21 length of intermediate wave (A). This is within the normal range for a B wave of a flat of 1 to 1.38.
It is possible but highly unlikely at the close of this week that primary wave 2 could yet move a little higher. If it does, then intermediate wave (C) should end above 2,116.48 to avoid a truncation. Primary wave 2 would then be a very common expanded flat.
If price moves above 2,116.48, then the alternate bear wave count would be invalidated. At that stage, if there is no new alternate for the bear, then this would be the only bear wave count.
Primary wave 2 may not move beyond the start of primary wave 1 above 2,134.72. When there is some price confirmation that primary wave 2 is over, then the invalidation point may be moved down to its end. Price is the ultimate determinator. This is the risk while we do not have final price confirmation.
DAILY CHART
Click chart to enlarge.
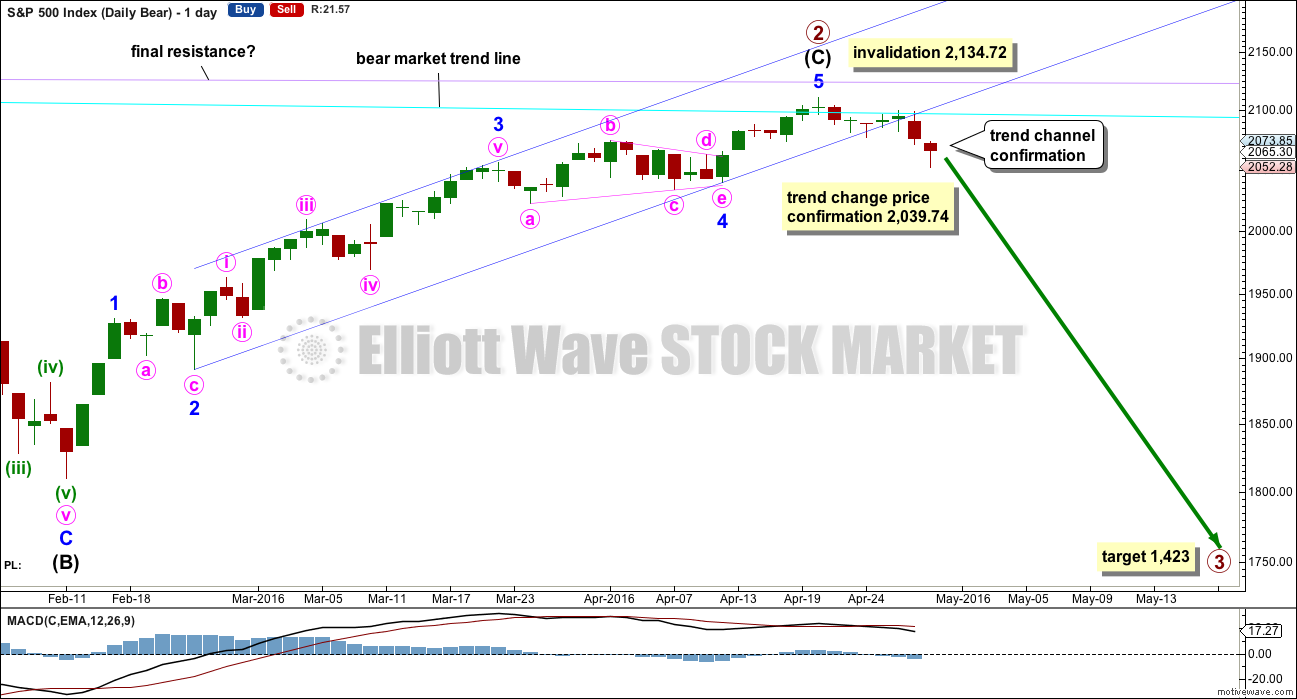
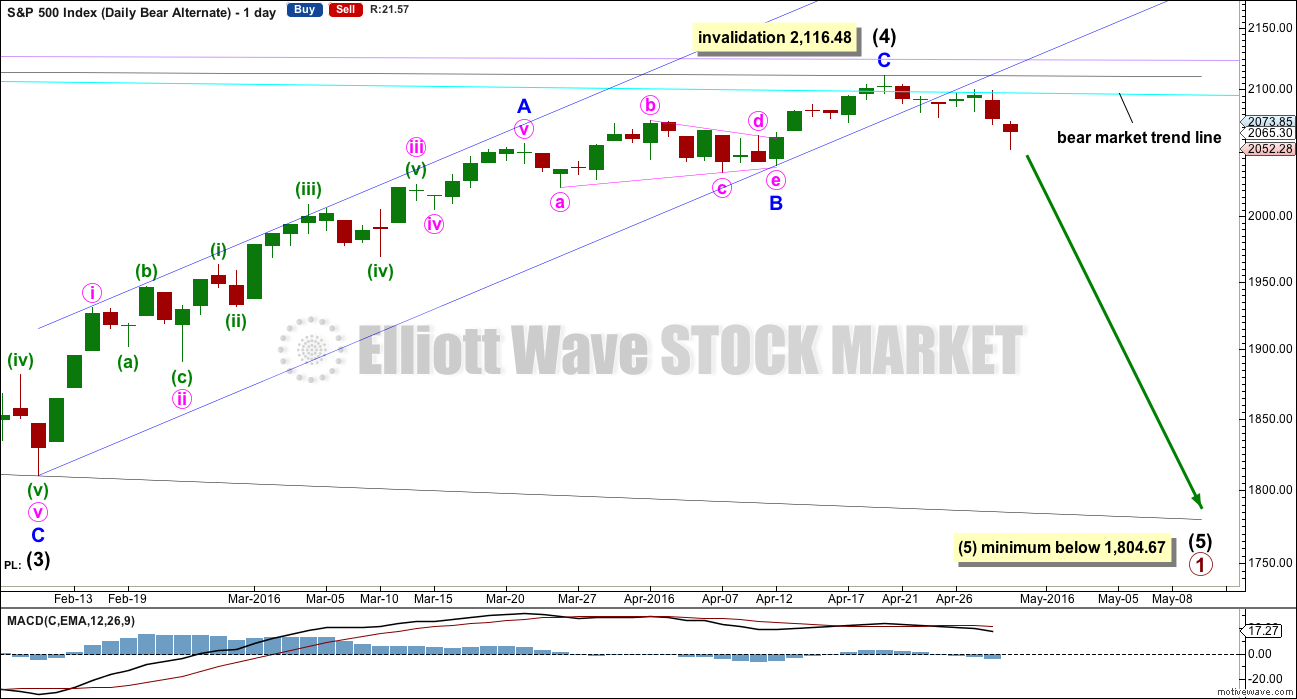
Intermediate wave (A) fits as a single or double zigzag.
Intermediate wave (B) fits perfectly as a zigzag. There is no Fibonacci ratio between minor waves A and C.
Intermediate wave (C) must subdivide as a five wave structure. It may be a complete impulse.
If intermediate wave (C) is over, then the truncation is small at only 5.43 points. This may occur right before a very strong third wave pulls the end of intermediate wave (C) downwards. Price confirmation of a trend change would come with a new low below 2,039.74.
The next wave down for this wave count would be a strong third wave at primary wave degree. At 1,423 primary wave 3 would reach 2.618 the length of primary wave 1. This is the appropriate ratio for this target because primary wave 2 is very deep at 0.91 of primary wave 1. If this target is wrong, it may be too high. The next Fibonacci ratio in the sequence would be 4.236 which calculates to a target at 998. That looks too low, unless the degree of labelling is moved up one and this may be a third wave down at cycle degree just beginning. I know that possibility right now may seem absurd, but it is possible.
Alternatively, primary wave 3 may not exhibit a Fibonacci ratio to primary wave 1. When intermediate waves (1) through to (4) within the impulse of primary wave 3 are complete, then the target may be calculated at a second wave degree. At that stage, it may change or widen to a small zone.
Redraw the channel about the impulse of intermediate wave (C) using Elliott’s second technique: draw the first trend line from the ends of the second to fourth waves at minor degree, then place a parallel copy on the end of minor wave 3. Minor wave 5 may end midway within the channel. The channel is now breached decisively at the daily chart level. This provides some reasonable confidence in a trend change.
Because expanded flats do not fit nicely within trend channels, a channel about their C waves may be used to indicate when the expanded flat is over. After a breach of the lower edge of the channel, if price then exhibits a typical throwback to the trend line, then it may offer a perfect opportunity to join primary wave 3 down. At this stage, it looks like this is not going to happen in a bigger way. The upper edge of Thursdays candlestick may have been a small throwback.
Within minor wave 5, no second wave correction may move beyond the start of its first wave below 2,039.74. A new low below 2,039.74 could not be a second wave correction within minor wave 5, so at that stage minor wave 5 would have to be over. This would confirm a trend change.
Primary wave 1 lasted 98 days (not a Fibonacci number). Primary wave 2 may have lasted 140 days.
HOURLY CHART
Click chart to enlarge.
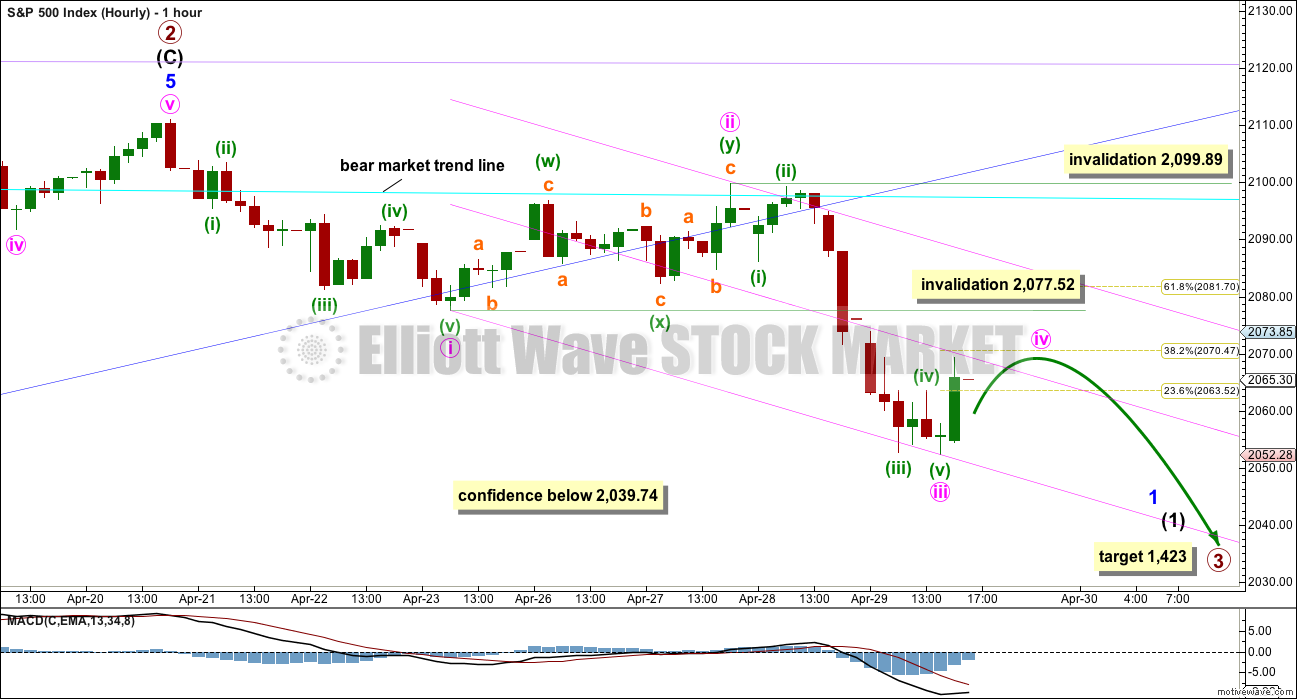
So far to the downside there is not a complete five wave impulse. Minor wave 1 still needs minute waves iv and v to complete.
There is no Fibonacci ratio between minute waves i and iii. This makes it more likely that minute wave v will exhibit a Fibonacci ratio to either of minute waves i or iii. Because minute wave iv is not over, the start of minute wave v is not known, so a target may not yet be calculated. The most common Fibonacci ratio for a fifth wave is equality with the first, which would see minute wave v about 33.53 points in length. The next common ratio is either 0.618 or 1.618 the length of the first. This would see minute wave v either 20.72 points in length of 54.25 points in length.
Draw a channel using Elliott’s first technique about minor wave 1 down: the first trend line from the ends of minute waves i to iii, then a parallel copy on minute wave ii. For this instance add a mid line. Minute wave iv may end about mid way within this channel.
Minute wave ii was a deep 0.68 double zigzag. Given the guideline of alternation, minute wave iv may be expected to be shallow and either a flat, combination or triangle. It may also be a quick shallow single zigzag. Alternation is a guideline, not a rule, and the S&P just does not always exhibit perfect alternation.
The most likely point for minute wave iv to end would be about the 0.382 Fibonacci ratio at 2,070. Minute wave iv may not move into minute wave i price territory above 2,077.52.
If price moves above 2,077.52 on Monday, then it may not be a fourth wave correction. At that stage, the degree of labelling within minute wave iii would be moved down one degree. Minuette wave (i) would be complete and upwards movement would be minuette wave (ii) which may not move beyond the start of minuette wave (i) at 2,099.89. At that stage, upwards movement would be expected to end either at the 0.618 Fibonacci ratio at 2,082, or to find final resistance at the cyan bear market trend line about 2,100. If that happens on Monday, it would offer a perfect entry point for a short position.
Trading Advice:
Firstly, expect surprises now to be to the downside. If I am wrong, it will be with targets not low enough and corrections expected but not turning up or being more shallow than expected. Look at the big picture, the weekly chart. Any entry point about here may be profitable within a week most likely. Risk reward ratios are at this stage very high indeed. Stops may now be set short term just above 2,077.52, or for the more adventurous and risk tolerant just above 2,111.05. That would allow for another second wave correction, and there is one to come.
In the short term, if this wave unfolds smoothly, then right now is not the best entry point. A five down should complete, and be followed by a three up. That would be the best entry point, but traders may have to be nimble to catch it. The risk is primary degree third waves can move VERY fast, with quick shallow corrections. There is a risk right now that the S&P could fall off a cliff very fast. Which means that right now may be a good entry point.
There are two approaches right now: tolerate more risk and enter short on Monday. Or be nimble and try to reduce risk by waiting for the upcoming second wave correction and enter short on the bounce. How each trader approaches this is an individual choice. Some are more risk tolerant. If you don’t mind waiting a few days to a week while your position may be underwater, then enter here. If you prefer to see your position underwater for only a day or so and you can be nimble, then wait. But that involves a risk that either I am wrong about the second wave bounce to come or that it is quicker and shallower than expected and you miss it.
My personal approach will be to wait for the second wave bounce to increase my short position. I will be up watching the market when I expect it may happen, so I will be here to contribute to the comments section on that day. My tolerance for risk is very low.
Do not risk more than 3-5% of equity on any one trade. Always use a stop loss order to protect your account.
ALTERNATE HOURLY CHART
Click chart to enlarge.
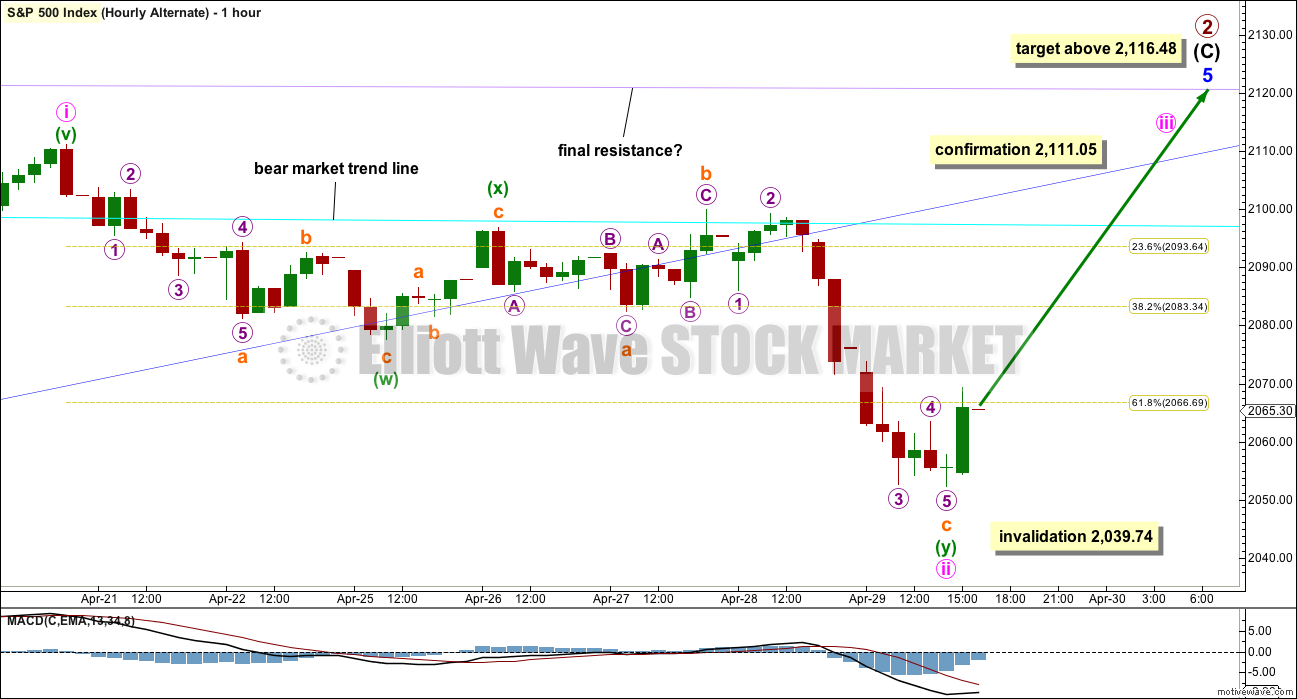
It is still just possible that primary wave 2 may not be complete. Intermediate wave (C) may yet be able to move above 2,116.48 to avoid a truncation and a rare running flat.
The degree of labelling within minor wave 5 is moved down one degree. The upwards wave to the last high may be only minute wave i within minor wave 5.
Minute wave ii may not move beyond the start of minute wave i below 2,039.74.
Minute wave ii is seen here as a double combination, but it no longer looks right. The second structure in the double is technically an expanded flat, which is okay. But it is deepening the correction, giving the whole structure of minute wave ii a downwards slope where it should be just sideways.
The first structure in the double labelled minuette wave (w) is a zigzag. The double is joined by a three, a simple zigzag in the opposite direction labelled minuette wave (x).
The second structure is an expanded flat labelled minuette wave (y). Both of subminuette waves a and b subdivide as threes, as they must for a flat. Subminuette wave b is a 1.21 length of subminuette wave a. This is over the requirement of 1.05 for an expanded flat, and within normal range of 1 to 1.38 for a B wave within a flat.
Subminuette wave c is a complete impulse and has no Fibonacci ratio to subminuette wave a.
This wave count requires a new high above 2,111.05 for confirmation. Classic technical analysis has today reduced the probability of this wave count. The probability is low. Low probability is not the same as no probability; this wave count still illustrates the risk to any short positions here.
ALTERNATE WEEKLY CHART
Click chart to enlarge.
Primary wave 1 may subdivide as one of two possible structures. The main bear count sees it as a complete impulse. This alternate sees it as an incomplete leading diagonal.
The diagonal must be expanding because intermediate wave (3) is longer than intermediate wave (1). Leading expanding diagonals are not common structures, so that reduces the probability of this wave count to an alternate.
Intermediate wave (4) may continue higher now and may find resistance at the bear market trend line.
ALTERNATE DAILY CHART
Click chart to enlarge.
Within a leading diagonal, subwaves 2 and 4 must subdivide as zigzags. Subwaves 1, 3 and 5 are most commonly zigzags but may also sometimes appear to be impulses.
Intermediate wave (3) down fits best as a zigzag.
In a diagonal the fourth wave must overlap first wave price territory. The rule for the end of a fourth wave is it may not move beyond the end of the second wave.
Within diagonals the second and fourth waves are commonly between 0.66 to 0.81 the prior wave. Here, intermediate wave (2) is 0.93 of intermediate wave (1) and intermediate wave (4) is 0.98 of intermediate wave (3). This is possible, but the probability of this wave count is further reduced due to the depth of these waves.
Expanding diagonals are not very common. Leading expanding diagonals are less common.
Intermediate wave (5) must be longer than intermediate wave (3), so it must end below 1,804.67. Confirmation of the end of the upwards trend for intermediate wave (4) would still be required before confidence may be had in a trend change, in the same way as that for the main bear wave count.
BULL ELLIOTT WAVE COUNT
WEEKLY CHART
Click chart to enlarge.
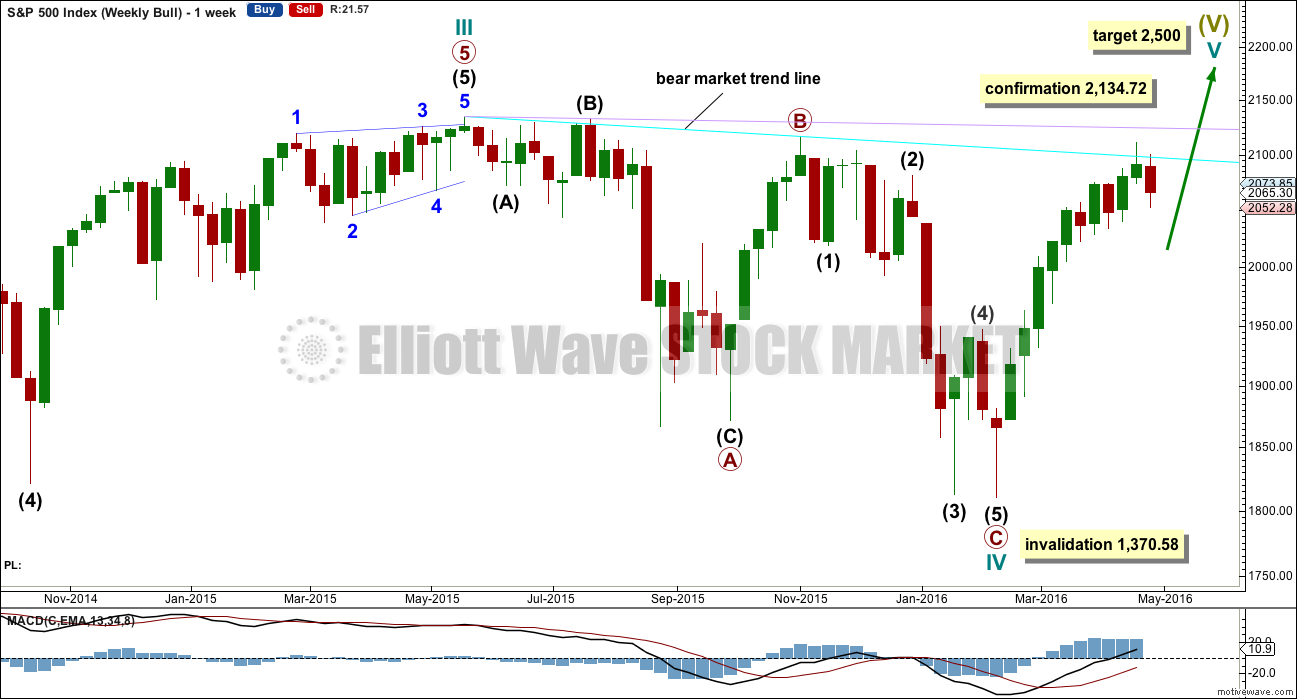
Within primary wave C downwards, intermediate wave (2) is seen as an atypical double zigzag. It is atypical in that it moves sideways. Double zigzags should have a clear slope against the prior trend to have the right look. Within a double zigzag, the second zigzag exists to deepen the correction when the first zigzag does not move price deep enough. Not only does this second zigzag not deepen the correction, it fails to move at all beyond the end of the first zigzag. This structure technically meets rules, but it looks completely wrong. This gives the wave count a low probability.
This part of the structure is highly problematic for the bull wave count. It is not possible to see cycle wave IV as complete without a big problem in terms of Elliott wave structure.
Cycle wave II was a shallow 0.41 zigzag lasting three months. Cycle wave IV may be a complete shallow 0.19 regular flat correction, exhibiting some alternation with cycle wave II.
At 2,500 cycle wave V would reach equality in length with cycle wave I.
Price remains below the final bear market trend line. This line is drawn from the all time high at 2,134.72 to the swing high labelled primary wave B at 2,116.48 on November 2015. This line is drawn using the approach outlined by Magee in the classic “Technical Analysis of Stock Trends”. To use it correctly we should assume that a bear market remains intact until this line is breached by a close of 3% or more of market value. In practice, that price point would be a new all time high which would invalidate any bear wave count.
This wave count requires price confirmation with a new all time high above 2,134.72.
While price has not made a new high, while it remains below the final bear market trend line and while technical indicators point to weakness in upwards movement, this very bullish wave count comes with a strong caveat. I still do not have confidence in it.
DAILY CHART
Click chart to enlarge.
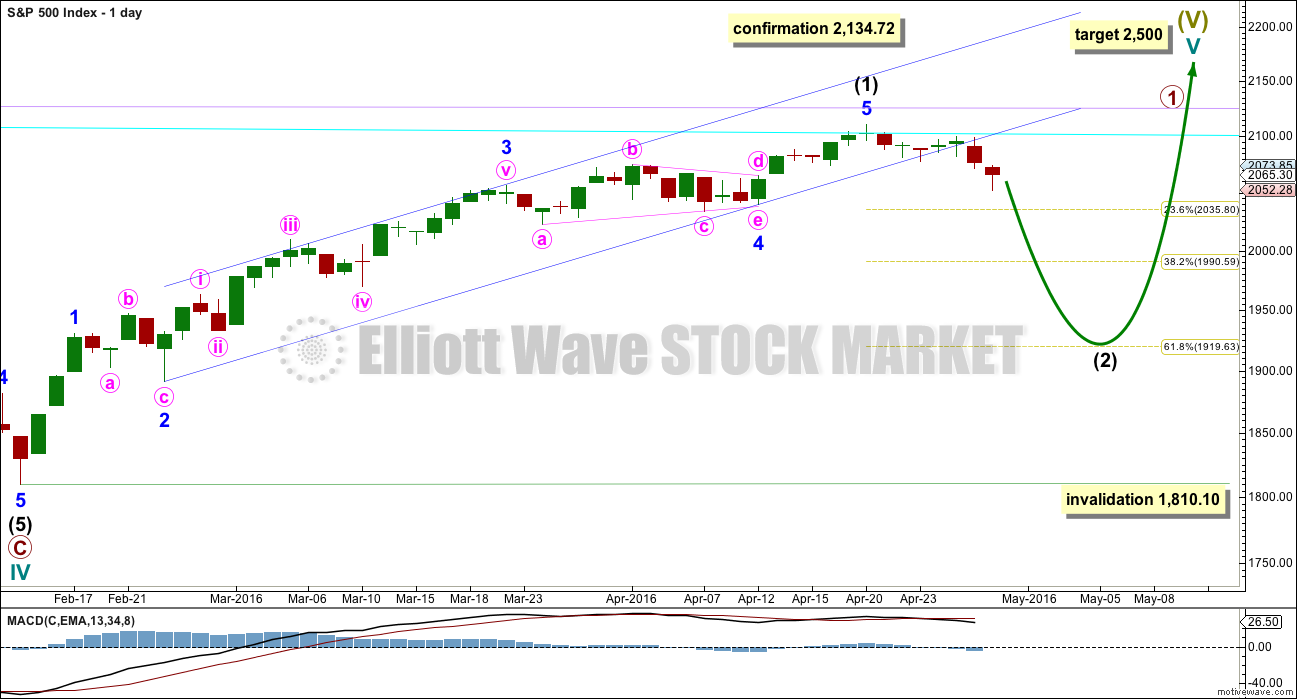
If the bull market has resumed, it must begin with a five wave structure upwards at the daily and weekly chart level. That may today be complete. The possible trend change at intermediate degree still requires confirmation in the same way as the alternate hourly bear wave count outlines before any confidence may be had in it.
If intermediate wave (2) begins here, then a reasonable target for it to end would be the 0.618 Fibonacci ratio of intermediate wave (1) about 1,920. Intermediate wave (2) must subdivide as a corrective structure. It may not move beyond the start of intermediate wave (1) below 1,810.10.
In the long term, this wave count absolutely requires a new high above 2,134.72 for confirmation. This would be the only wave count in the unlikely event of a new all time high. All bear wave counts would be fully and finally invalidated.
TECHNICAL ANALYSIS
WEEKLY CHART
Click chart to enlarge. Chart courtesy of StockCharts.com.
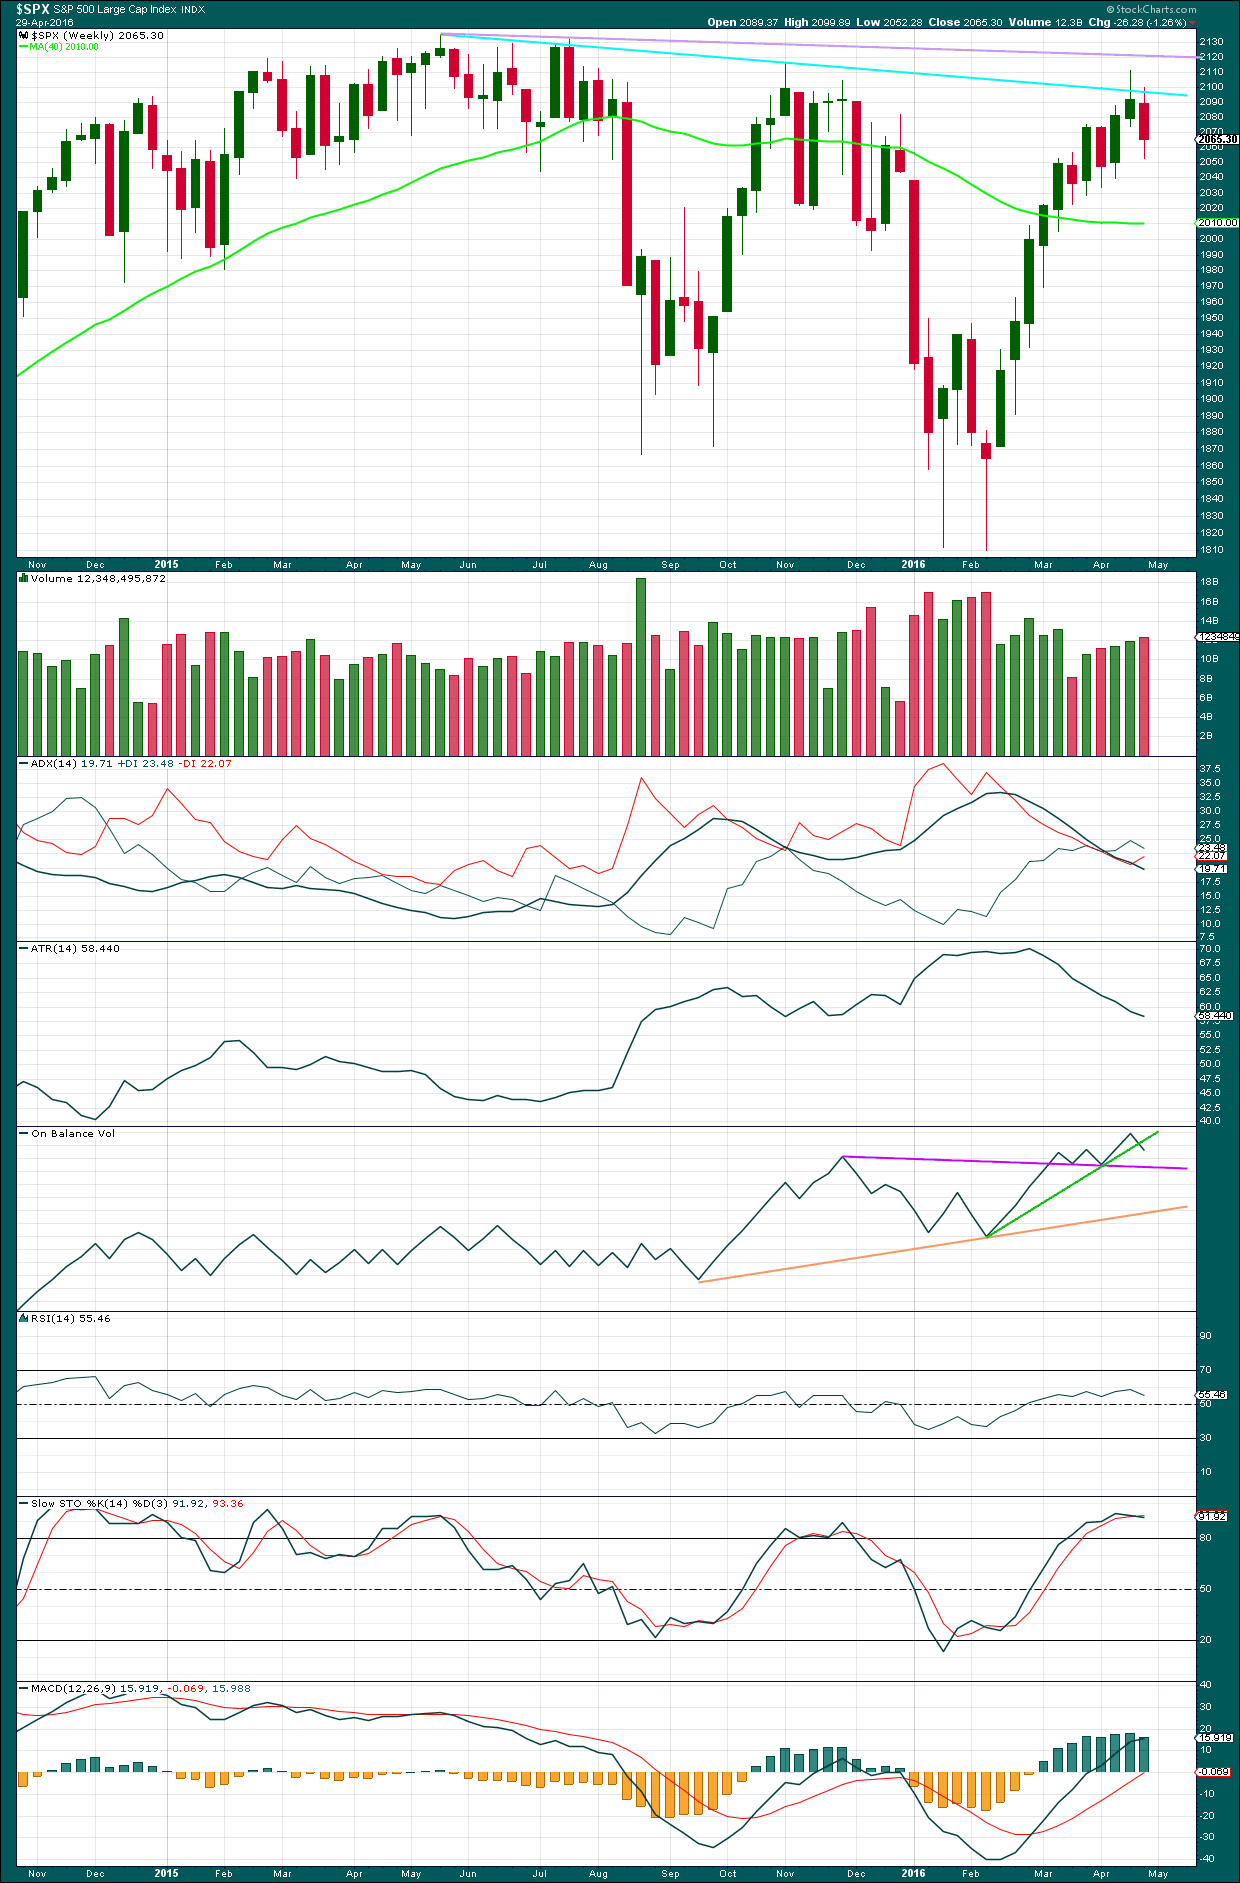
We have a bearish engulfing candlestick pattern at the end of this week. This has occurred at the round number of 2,100 which increases the significance. Volume on the second candlestick is higher than volume on the first candlestick, which further increases the significance. That it is at the weekly chart level is further significance.
Engulfing patterns are the strongest reversal patterns.
This is a very strong bearish signal. It adds significant weight to the expectation of a trend change. It does not tell us how low the following movement must go, only that it is likely to be at least of a few weeks duration.
There is a weak bearish signal from On Balance Volume at the weekly chart level with a break below the green line. A stronger bearish signal would be a break below the purple line. OBV looks bearish.
There is hidden bearish divergence between Stochastics and price at the last high and the high of November 2015. Stochastics has moved further into overbought territory, but this has failed to translate into a corresponding new high in price. Price is weak. MACD exhibits the same hidden bearish divergence.
After a period of declining ATR, it should be expected to turn and begin to increase.
DAILY CHART
Click chart to enlarge. Chart courtesy of StockCharts.com.
Volume data on StockCharts is different to that given from NYSE, the home of this index. Comments on volume will be based on NYSE volume data when it differs from StockCharts.
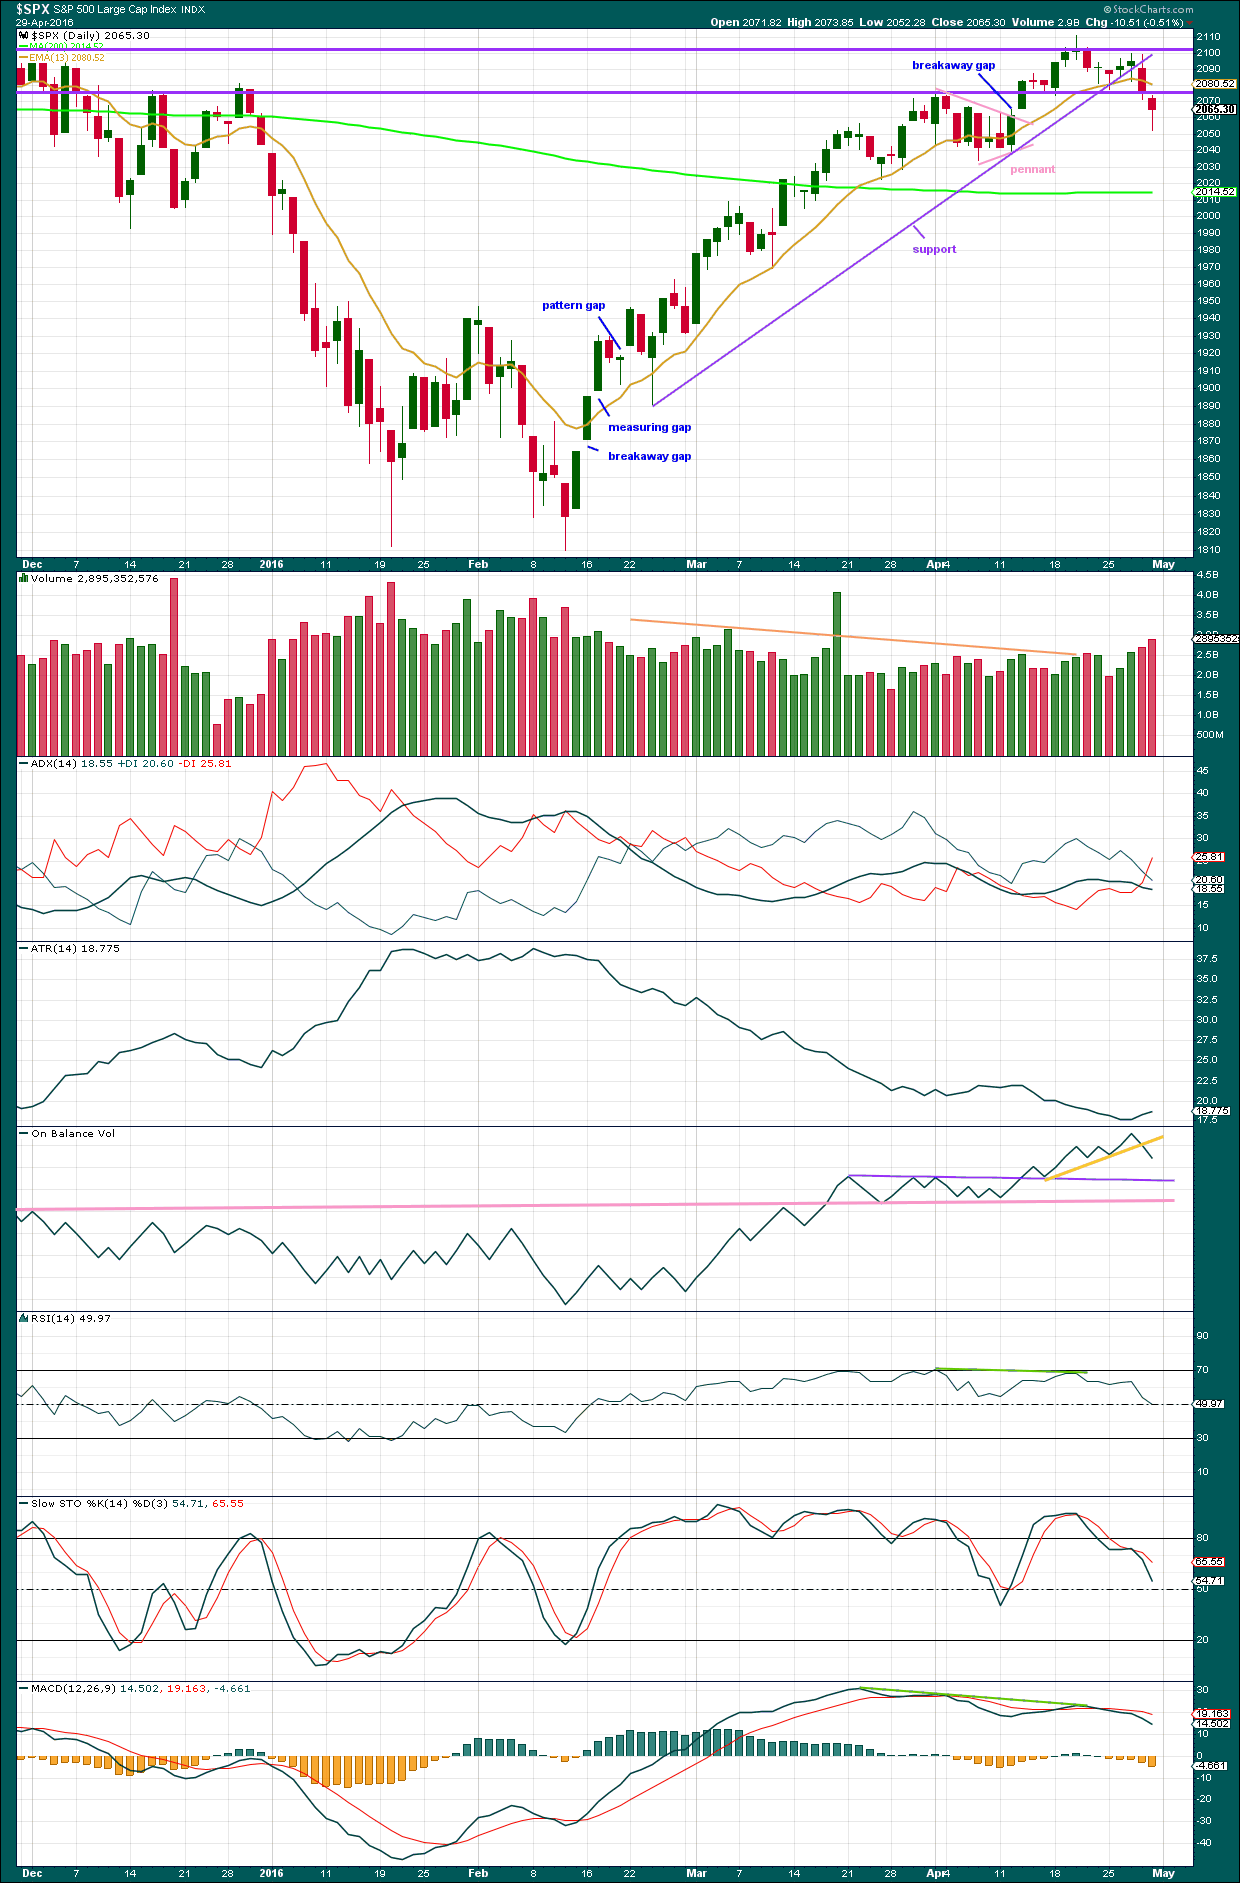
The support line is clearly and decisively breached. This strongly indicates the S&P has seen a trend change.
Two days in a row of falling price come on increasing volume. Both days have volume higher than all prior upwards days right back to 7th March. This looks like a downwards break below support.
Now that price has broken below the purple horizontal support line at 2,080, it may find resistance there for a throwback. If price moves above 2,080, then it may possibly come back up to the support / resistance line at 2,100 although this now looks less likely.
The 200 day moving average has flattened off after showing a very slight increase. It is again indicating the bear market is intact. There has been no new major swing high, so the last wave up from February to April is likely to be fully retraced.
An Evening Doji Star candlestick pattern is completed at the last high. This is a reversal pattern and offers some support for expecting a high is in place. The fact that this pattern has occurred at the round number of 2,100 is more significant. There is light volume on the first candle in the pattern and heavier volume on the third candle in the pattern. This increases the probability of a reversal.
On Balance Volume today is giving a bearish signal with a break below the yellow line. This is decisive, but the line does not have strong technical significance. A stronger signal would come with a break below the purple or pink lines.
ADX is today indicating a trend change with the +DX line crossing below the -DX line. If the ADX line now turns up, it would be indicating a new downwards trend.
ATR may beginning to turn up. After a long period of declining, ATR should be expected to again show an increase. It is important to note that ATR declined while price moved higher for over 40 days. This is not normal for a trending market. There was something wrong with that wave up. If it was a bear market rally and not a new bull market, then declining ATR makes more sense.
Neither of RSI, MACD nor Stochastics are extreme. There is plenty of room for this market to fall.
INVERTED VIX DAILY CHART
Click chart to enlarge. Chart courtesy of StockCharts.com.
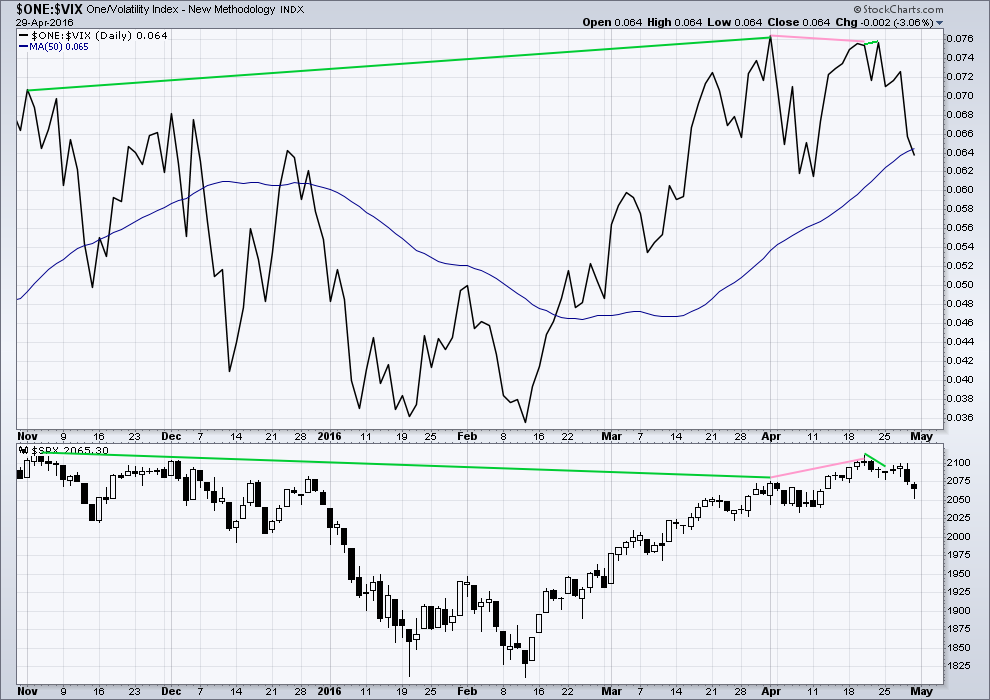
Volatility declines as inverted VIX climbs. This is normal for an upwards trend.
What is not normal here is the divergence over a reasonable time period between price and inverted VIX (green lines). The decline in volatility is not translating to a corresponding increase in price. Price is weak. This divergence is bearish.
Price made a new short term high, but VIX has failed to make a corresponding high (pink lines). This is regular bearish divergence. It indicates further weakness in the trend.
22nd April’s small green doji candlestick overall saw sideways movement in price, closing very slightly up for the day. Yet inverted VIX has made new highs above the prior high of 20th of April. Volatility declined for 22nd April, but this was not translated into a corresponding rise in price. Again, further indication of weakness in price is indicated. This is further hidden bearish divergence.
ADVANCE DECLINE LINE
Click chart to enlarge. Chart courtesy of StockCharts.com.
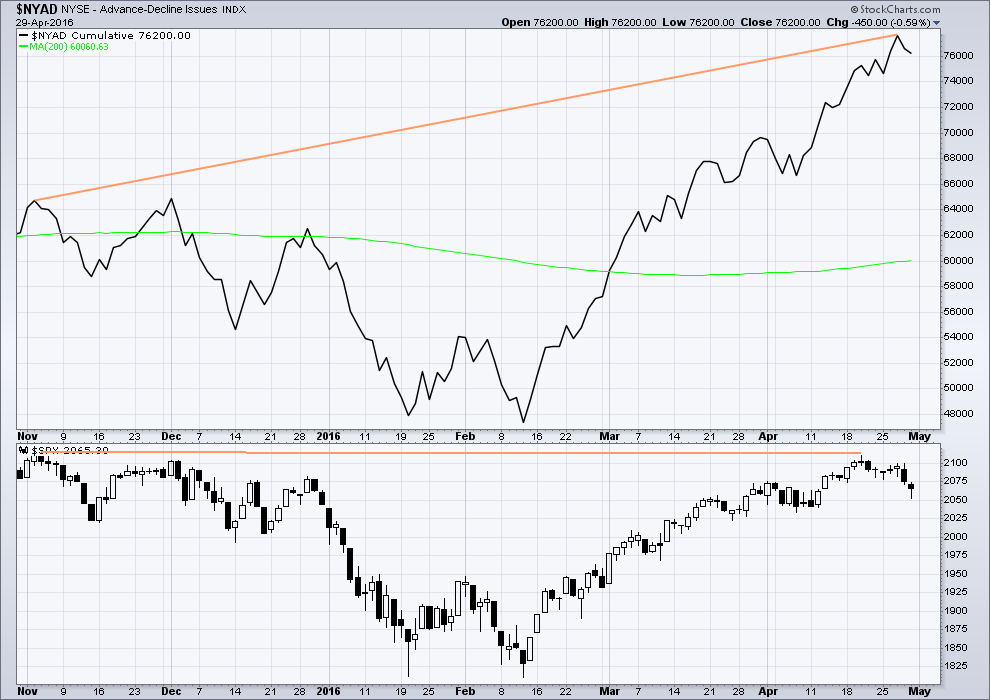
With the AD line increasing, this indicates the number of advancing stocks exceeds the number of declining stocks. This indicates that there is breadth to this upwards movement.
From November 2015 to now, the AD line is making new highs while price has so far failed to make a corresponding new high. This indicates weakness in price; the increase in market breadth is unable to be translated to increase in price.
It remains to be seen if price can make new highs beyond the prior highs of 3rd November, 2015. If price can manage to do that, then this hidden bearish divergence will no longer be correct, but the fact that it is so strong at this stage is significant. The AD line will be watched daily to see if this bearish divergence continues or disappears.
The 200 day moving average for the AD line is now increasing. This alone is not enough to indicate a new bull market. During November 2015 the 200 day MA for the AD line turned upwards and yet price still made subsequent new lows.
For two days in a row, the AD line has declined along with downwards movement in price. This indicates there is some breadth to the downwards movement.
COMMITMENT OF TRADERS (COT)
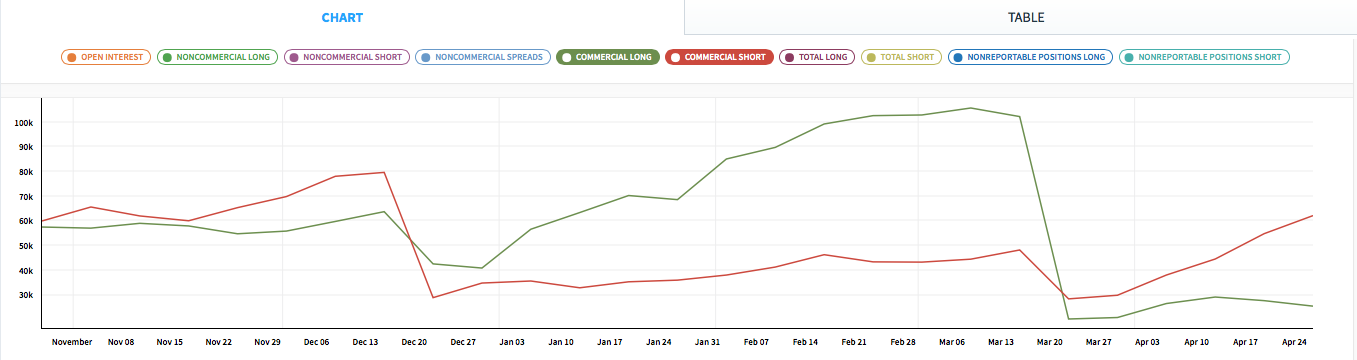
Click chart to enlarge. Chart courtesy of Qandl.
This first COT chart shows commercials. Commercial traders are more often on the right side of the market. Currently, more commercials are short the S&P than long. This has increased this week while long positions have decreased. This supports a bearish Elliott wave count, but it may also support the bullish Elliott wave count which would be expecting a big second wave correction to come soon. Either way points to a likely end to this upwards trend sooner rather than later. Unfortunately, it does not tell exactly when upwards movement must end.
*Note: these COT figures are for futures only markets. This is not the same as the cash market I am analysing, but it is closely related enough to be highly relevant.
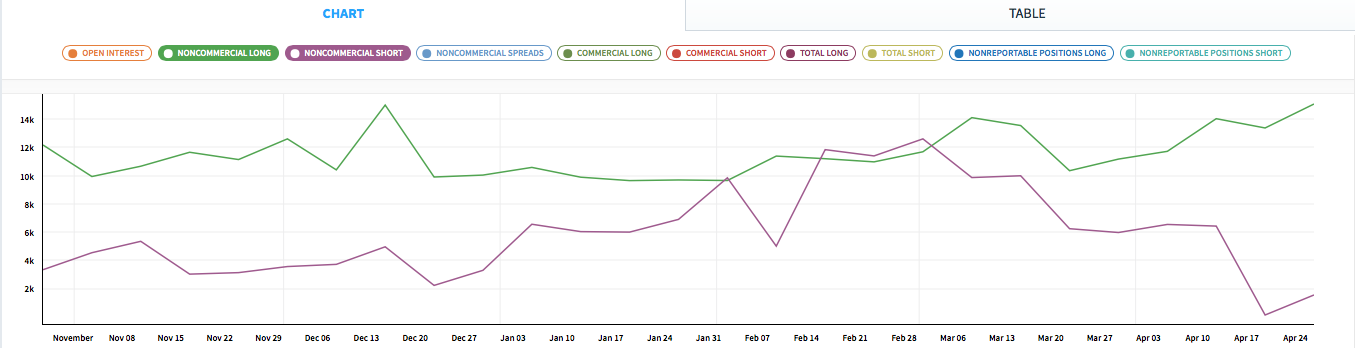
Click chart to enlarge. Chart courtesy of Qandl.
Non commercials are more often on the wrong side of the market than the right side of the market. Currently, non commercials are predominantly long, and increasing. This supports the expectation of a trend change soon.
DOW THEORY
I am choosing to use the S&P500, Dow Industrials, Dow Transportation, Nasdaq and the Russell 2000 index. Major swing lows are noted below. So far the Industrials, Transportation and Russell 2000 have made new major swing lows. None of these indices have made new highs.
I am aware that this approach is extremely conservative. Original Dow Theory has already confirmed a major trend change as both the industrials and transportation indexes have made new major lows.
At this stage, if the S&P500 and Nasdaq also make new major swing lows, then my modified Dow Theory would confirm a major new bear market. At that stage, my only wave count would be the bear wave count.
The lows below are from October 2014. These lows were the last secondary correction within the primary trend which was the bull market from 2009.
These lows must be breached by a daily close below each point.
S&P500: 1,821.61
Nasdaq: 4,117.84
DJIA: 15,855.12 – close below on 25th August 2015.
DJT: 7,700.49 – close below on 24th August 2015.
Russell 2000: 1,343.51 – close below on 25th August 2015.
To the upside, DJIA has made a new major swing high above its prior major high of 3rd November, 2015, at 17,977.85. But DJT has so far failed to confirm because it has not yet made a new major swing high above its prior swing high of 20th November, 2015, at 8,358.20. Dow Theory has therefore not yet confirmed a new bull market. Neither the S&P500, Russell 2000 nor Nasdaq have made new major swing highs.
This analysis is published @ 04:41 a.m. EST on 30th April, 2016.
Final SPX Volume:
599.422 Million Today
880.882 Million Friday
Volume continues to support a bearish outlook.
Rising price on declining volume isn’t sustainable.
And that declining volume goes back years. If any members haven’t done so already take a look at the monthly TA chart. That decline in volume is stark.
I am bemused as to why any technical analyst wouldn’t give weight to that. Look at Google. Huge decline in volume over the years as price moved higher. AAPL too.
This is just not sustainable. The bankers will be called to account sooner rather than later I think. The public may not have an appetite for bailouts of “too big to fail” when it is shown that their behaviour hasn’t changed. And so the pumping of money into the financial sector will have to end.
It all needs a big washout.
Just my opinion of course. Anyone is welcome to disagree with me.
Sorry to hear that they’re doing that in NZ also. I thought it was just us and Europe.
I was referring to the USA and Europe mostly actually.
Here in NZ we have a property market bubble. But that’s mostly fuelled by household debt. Our government bailed out finance companies in the GFC. They’d better not do it again IMO.
SPY which is an ETF that tracks the S&P had its lowest volume day of the year. Volume on the ETF was 61.9 million. Last Friday it was 142.4 million.
Yep. Banksters at work. The bears are letting ’em bid it up…
Candle pattern: Downside Gap Three Methods
Pattern: continuation
Reliability: moderate
Identification
A long black day is followed by a second long black day that gaps in the direction of the trend. The third day is white and fills the gap between the first two days.
The Psychology
In a downtrend a gap simply gets filled. As long as the black candles have higher volume than the white, the one white profit taking day for the shorts shouldn’t be a big concern. The downtrend should continue if indeed the stock is as weak as it appears. ..see link for more details http://www.leavittbrothers.com/education/candlestick_patterns/bear/downside_gap_three_methods_bearish.cfm
Yea but look at the white candle engulfing 5 sessions coming off support?
Thanks again John. I am trying to learn a lot more about candlestick charting so I appreciate your comment. Not only that, it continues the bearish pattern that I am looking for.
Here’s a 5 minute chart for you.
I think the structure of the final fifth wave may be incomplete.
The channel is a best fit. If its clearly and strongly breached then it may be over for this correction.
Nice worth keeping an eye on! Glad we got that bounce I was hoping for 🙂
Good morning everybody 🙂
Another gift from the market perhaps today?
So taking a classic TA approach and looking at the daily chart: for those not yet positioned short this upwards correction is offering an opportunity. The risk is just above 2,099.89.
(When I set my stops I add 3 X my brokers normal spread. Spread widens in times of volatility, I don’t want my position to be stopped out because of that only to see price turn and move in the expected direction.)
Now this could go higher. We could wait for a better entry. There are a few options on how to find an entry here. Entering now involves risk up to 2,099.89. Price may continue for a very deep correction to find resistance at the bear market trend line, which is very close to that invalidation point.
We could draw a channel about todays upwards movement on the hourly chart and wait for it to be breached by downwards movement before entering.
We could wait one more day and enter tomorrow morning.
I have the option of trading after hours with my broker so I’ll wait until the session is closed and then reassess the structure and may enter then.
This upwards move looks like a typical throwback underway. My favourite entry set up, because we have trend channel confirmation of a change.
My broker is CMC, a Kiwi outfit, and I’m trading CFD’s on the S&P.
That throwback is also evident on UVXY at the hourly chart. It is a breakout of a downward sloping wedge with the throwback today.
Yessir! 🙂
I think we are minute 3, alternate hourly unfortunately
Possible. That is the risk with any shorts here.
Look at MACD… 😉
And volume, and RSI.
Got filled at 15 BTW 🙂 🙂
Still quite small position (40%)
Banksters shaking the trees…! 🙂
Exhaustion gap on one minute…
UVXY fell out of the bed today with this low volume SPX upmove….
A Plus is that volume to this time point today (3:34.99PM) is still much lower than Friday.
397.562 Million Today (3:34.99PM)
506.857 Million Yesterday (3:34.99PM)
Thanks Joseph
Lower trendline broken (again!!)
Massive cash dumps going into the close….as ususal….
Big fat engulfing candlestick on SPX one minute…
A Plus is that volume to this time point today (3:04.99PM) is still much lower than Friday.
We should all be thanking the banksters for their generous largesse…. 🙂
I would have much preferred a short 4th wave up this morning and 5 down to around 2040 S&P. Now if we are in wave 2 up, invalidation is quite a ways away….
I would wait for a small 5 wave move to the downside followed by a 3 up.
I’m scaling in atm (so in effect picking a top for this move) which is not really a good idea but I sold most of my position at a profit on Friday so there if some method in my madness.
I wish I could recommend trendlines but the one I drew this morning was broken and the market still just made a new higher high!!
I’m watching the 2082 area for a possible reversal.
Buying 1000 shares of UVXY @ 15.31
Entering STC order with 5 point trailing stop…
I’ve got a buy set at 15 – lets see if it gets filled.
I might need to nudge it up a bit if we start tanking.
I’m averaging 16.12 so wouldn’t mind bringing that down, but don’t want to create too large a position just yet.
I think this move from Fridays low is a zig zag – if I have my a/b price points correct then c=0.618a @ about 2082.60 (which is also close to the 61.8fib).
I have got wave b at 2068.80. Still looks to me like we have W4 & W5 of zigzag (c) to go unless the sideways mess was all Wave b, in which case wave c might be done.
2min RSI div so dunno if it’s gonna get there. Price poking out of the lower trendline right now. Below 2075 it’s probably done.
Or possibly a double….
Don’t tell me we are making yet another run at those @^**#&! pivots??!!! 😀
Just looking at structure – this retrace is very deep and sharp for a fourth wave. But this market is doing some pretty extreme moves so until 2085.65 (or so) is taken out, I’m keeping an open mind.
I’m starting to think maybe this is a second wave as per Rodney’s thoughts.
61.8 fib @ 2081.64
76.4 fib @ 2088.61 (which would also invalidate Minuette (iv) idea)
Getting in on a break below the lower trendline (drawn between about 2054.20 and 2070.38) might be the safer trade right now.
Smart to wait for confirmation. 🙂
MInute four eliminated as it entered minute on territory over 2077.52
I am thinking we are in minuette two up and that would be consistent with an extended minor one down. That also makes sense for a long primary wave down.
Yeah, but until it goes above 2085.65, it could still be Minuette (iv) though that is starting to look a bit odd to me (far too deep and steep imho).
Could well be a W2 – Minuette degree would make sense if this things is intent on falling off cliff sometime soon.
We need to remember all the bearish signals from the last two weeks. Today’s action so far does not discount all those signals.
Surprises should be to the downside.
When 1min, 5 min, 15 min charts become troubling, I always like to return to the hourly charts / counts to clarify the situation. On the hourly, SPX looks like 1-2, i-ii as per Lara’s alternate presented on the video only.
I’ve got no issues with any timeframe atm tbh – just trying to scale in as close to the top of the move as possible (mugs game I know – but I’ll never learn 🙂 )
If trendlines are to be trusted then this move should now be over. Let’s see how that works out!!
2075 is my next confirmation point, then approx. 2068.90 should prove this move up was corrective (kitchen sink time!!).
Nothing at all surprising about today’s action. Exactly what we should expect from a second wave….
Okay. I guess I was misreading expressions. That is one downside to digital communication.
One Plus is that volume to this time point today is much lower than Friday.
IMO any impulsive looking wave down from here may be the signal that this is all starting.
That’s very significant imho
Exactamundo!
BTO June SDS 19 calls for .61
Picking up a few 🙂
could be looking at the hourly alternate or a leading diagonal with fourth wave just finishing.
IN the video Lara say’s minute ii (if iv invalidated)target 2081.70 (or no higher than) if 2077.52 is breached. Or something to that effect.
This would be in play before the alt hourly that is published above.
You all should view that section again.
Great pick up Joseph. I listened to the video again. Lara said if 2077.?? is exceeded the count could be 1-2 , i-ii with the the new invalidation at the start of i which is 2099.89. I think this is a very good possibility although I would prefer it to end short of 2099. the 61.8% retrace would be about 2082. The 13 day moving average is right about 2080.
Between 2082 and 2099 is a great entry price with a stop at 2100 or there about.
Guess I should start watching the videos and reading the text (I usually just look at the charts) 🙂 🙂
I am initiating a short position on SPX at 2077.83 using CFDs. My stop is at 2100.
That should be a very good entry point – very good risk / reward.
Three waves up off the 2052.28 low on Friday. It is now or later…. 🙂
I’m enjoying the discounted UVXY shopping spree 🙂
Unless we go above 2100 – which would quickly wipe the smile off my face…
Gonna take a trendline approach to buying more so to limit risk a bit but I’m not expecting we’ll go above 2085. Nearer 2085 I might take a punt 🙂
That invalidation was a gift really – clears things up a bit.
Agreed. Only one scenario ATM I can see on the hourly for the bear.
2077.52 taken out (just!) I think??? (unless my data is dodgy) – so next most likely is that this move is Minuette (iv) imho. Invalidation point for that idea (so leaving only Rodneys 1,2 idea), is approx 2085.65
If so then I’m happy – we should get another Minute (iv) bounce to scalp.
Data is good… 2077.64 is the current high today.
2078.14 now
Thanks for confirmation – I never know with IB data
We may have a 1-2, i-ii down from the top of 2010. If so, the wave ii invalidation point is around 2099.
Yeah – I was thinking the same. This might be the first 5 of a zig zag (or we maybe in the 2nd zig zag now).
2099 is a bit extreme but this market has plenty of form in that department.
If 2086 is taken out then that would be my favourite atm. We’ve just backed off Minute (i) low – will it hold???
It is remarkable the diversity of voices commenting of the current market situation. I am intrigued by the diametrically opposed views of two analysts at an outfit I subscribe to (Stansberry Research) with one of their analysts insisting we are “nowhere near” a top because we do not see the euphoria in the market that should accompany a top. Porter Stansberry on the other hand, is strongly advising investors to have market stops in place to protect against what he thinks is impending carnage in the markets. I think the bullish analyst has totally lost his mind, and he is a very bright guy with a doctorate in statistical math and computing. In addition , I do not think stops are going to do anyone any good if we are at the threshold of a primary wave down. A lot of folk mistakenly think that a stop price guarantees a sale at the specified stop and nothing could be farther from the truth, as I am sure everyone here knows…
There is something eerie about the lack of a market reaction to Puerto Rico’s announcement of its intention to default…possibly the calm before the storm..??!!
AC NJ avoided default today by making a payment. But that just pushes the issue to a future month as they cannot meet payments + services.
PR has defaulted… they did not make the payment.
Wow, I missed that. Haven’t read much news for a while outside of little NZ and the odd squiz at The Guardian.
The tug-of war- will likely continue into the close with the final leg down and reversal coming tomorrow. Not much to do but watch the wrangling…..
Third wave up in UVXY…series of 1,2’s in SPX
This might be the last time we see UVXY at this level for a long time – that is of course unless the ALT bear turns out to be correct.
I’m hoping that we get another minute W4 bounce after this one so I can continue to scalp it, but not holding my breath.
It might not play along (might not fall to these levels) even on a Minor 2 bounce especially if Minute (v) is strong…
Yeah…Ris mentioned an EW analyst who is calling for a three week bounce based on Hurst Cycles which I would have to assume would co-incide with a minor two bounce; I have a hard time envisioning a three week minor wave two in a primary three wave down…
Vern,
I am with you and very puzzled as I am having a tough time understanding what drivers exist to allow for push higher in this market with anemic fundamentals.
One can never underestimate the ability of banksters to prop up this market. Nonetheless, I really doubt they can forestall a third wave down at primary degree for that long…
Maybe a contracting triangle for this fourth wave underway…intended to wear out the impatient…. 🙂
Looking for 2052.28 to fall to day to confirm final leg down. If that happens we could see a bounce starting overnight just to keep everyone off balance….
hell of a fight going on here!
Could finish with three shooting stars on the hourly if we sell off a bit more. I name this the “Outer Space Candlestick Pattern!” 🙂
I was expecting it would not get resolved today but it could with the final fifth wave impulse coming intra-day. Traders are definitely going to have to be nimble on this one…
It’s very weak but I have the feeling we might take out 2077.52 – if so then most probably we are in Minuette (iv) with Minuette (v), then Minute (iv) & (v) still to go.
Below 2066 it’s probably over but I’m concerned that these current pops higher look like 3’s – we need a small degree 5 to finish this wave (albeit sometimes 5’s show up as 3’s on 1min / 5 min chart).
I think we might just be about to see W3 of a final small degree 5 wave up, which (if right) would probably take out 2077.52
If we see a kiss of 2077.52 then a reversal (without going over it), it would be EW poetry in motion 🙂
Ending diagonal from 2066.21???
That might explain all the 3’s….
Small impulse down from around 2075…funny…. SPX bounced back past the high SPY did not….actually neither did SPX on a different data feed….weird!
One more leg up…nice long upper wick on 5 min….
3,3,5 correction off Friday’s lows just about done I think…
My UVXY position back in the green 🙂 Long may it last!!!
It should head back to around 18.50 so be sure to sweep the loot off the table… 🙂
Brush already in hand 🙂
EDIT: Yep that was a 3 as suspected
Added to DIA 177 puts and lowered cost basis to 0.67 per contract; open sell to close @ 1.10…
Anyone playing a minute (iv) retrace is getting close to some good risk reward right now. We might even get a ‘(iv) sniffin (i)’ setup, though she’s lookin weak.
Just added another 10% UVXY – now watch us blast right through 2077.52 😉
Below 2066.09, current (very small degree) pop higher likely over
Yep. Gaps in ETF’s and UVXY from this morning will probably be filled this session…picked up a few IBB puts on a stink bid that got filled on the pop this morning…should give a quick double…
UVXY sold off from base around 16.50 so that should be taken out before too long as they cover intra-day
Yeah – things are playing out pretty much as expected atm, which is a bit of a concern but I’ll (tentatively) enjoy it while it lasts.
Just switched over to 1min chart – think we need just one more very small pop higher – 2066.89 is W1 of this small pop, so below there it might be over.
Couldn’t see those waves at all on the 5min – think I’ll stay on 1min 🙂
That might be it!! 2073.73 & 2066.09 (very) short term lines in the sand atm.
That final pop higher from 2066.09 looks suspiciously like a 3 wave structure to me on 1 min, so I’ve got my eye on this current downward move being a c wave of an exp flat or perhaps something more complex (if this current move down is also a 3)
Looking like a brick wall around 2070…. 🙂
UVXY heading South as expected; should reverse sharply intra-day….
This is looking like yet another fourth wave triangle. Look for head fake spike to the upside followed by swift reversal.
Filled on 177 puts at 0.73…will sell to close at 1.10
Keeping an eye on DIA 177 puts expiring this week. With a delta of -0.46, they should be good for at least a 50% pop on the final wave down….stink bid at 0.75…
Looking too shallow and tepid for a second wave. I think this is a fourth and it is facing stiff resistance in the 2070 area. Looking at 5 min chart for bearish engulfing candle….
I think this is very likely a 4th wave at either minute or minuette degree. Will be very difficult to know which degree unless we go above 2078 (though best look would be for it to be minuette (iv) with minute (iv) still to go – that’s what I am playing atm).
I think we just need one more pop higher to finish this leg.
Div on 5 min RSI – could resolve but this move is looking mature now. Still hoping it gets above 2078 to provide a little clarity.
Just (re) bought 10% UVXY – gonna scale in/out of some scalps between 2085 and 2039 (in theory! 🙂 ), buying as price gets nearer 2085 and selling as price nears 2039.
That’s the plan – now watch Mr Market mess it all up 🙂
Currently watching 2085, 2077 and 2039. Still keeping overall position fairly small.
This pattern of the banksters furiously buying up futures is starting to become familiar. We will either see a reversal intra-day or futures hugely in the red overnight for either a fifth or third wave down tomorrow. I will be looking for a favourable entry point, preferably toward the close of action today…
Interestingly enough, FTSE now even lower than futures…
Gold looks to be ready for a reversal in spike up this morning….
I was curious why DAX and CAC were both down in futures well over 2%, FTSE almost 1%, but the US markets hardly budging to the downside. Now that the European markets have all opened in the green, we are clearly seeing another massive co-ordinated bankster injection into the equities market, I suspect the European bourses are getting some assistance from the FED in this regard. Nikkei still down quite a bit so apparently BOJ is serious about no more stimulus for the time being. The massive cash infusion probably means we are in another deep second wave correction and it will bear close watching to see how it develops. I am hoping UVXY reverses ahead of the market to signal its completion. I will be looking for a massive bearish candle on the 15 minute chart, hopefully before the close…
The manic run in the metals continues. The angle of advance is imo unsustainable….I still think we area very close to at least a short term pullback after what may be a strong commodity fifth wave…
Unless European banks massively buy up futures the the way the US did last Thursday, it is looking like we get another impulse down tomorrow, either minute five down, or minuette three. Both should be good for at least 20 SPX handles I think…lock and load! 🙂
It greatly concerns me (near term) that Daneric has the same count as Lara. I kept an eye on his counts for years and he was always a (generally incorrect, very biased) proxy of EWI.
This is maybe why I am so keen for price to show its hand with a move below 2039. There are alot of people on his site that will be trading this the same as us here, and it is fairly popular public domain site so perhaps the count is now very common knowledge.
I guess it is possible that he stumbled across one of Lara’s free updates.
Daneric posted this count just after Lara posted it to the public. Has EWI used the expanded or running flat count as well?
That’s not cool.
Anyone happen to know what his count was prior to Lara’s public posting?
Wave 1,2 at two degrees
Nah. That’s fine.
I don’t own the count. It is what it is.
I have had some correspondence with Eric and have no issue with him at all. I used to have his site linked to on mine, but I removed it more recently. Only because there is no moderation in his comments and it looks like its devolved into a nasty free for all of name calling and general horridness.
boy howdy,, I concur,, foul mouthed blathering. The only cussin on this site is Lara,when she says dammit,, and once, no twice Rodney said balls.. hee hee
I hope it is not a 3 strike rule here. Otherwise it is just a matter of time before I am given the boot!
its 4 balls then you walk
He is showing an intermediate two top so it’s not quite the same. I have scouted far and wide and so far as I have been able to determine, Lara is the only analyst who has designated the recent top at primary degree. The difference between an intermediate top and a primary one is early retirement! 🙂
But seriously, the folk on this forum are the only ones I know who have even broached the subject of a possible P3 wave down.
Has anyone heard differently from any of the analysts they’ve read?
If so, I would surely like to hear who else has called it for I have not found a single one. This would be an amazing coup for a primary degree second wave- that nobody (‘cept Lara of course!) spotted it!
A lot of folk are very confident that 1800 is a hard floor in SPX.
I envision an initial bounce at that level when everybody and his grandma jumps on the long side, then overnight we are down 200 SPX handles to announce the true nature of the beast….
😉
I do not know of any other EW analyst who has the same count as Lara. As far as Danerick, we do not know how he came to this count. We just do not know. But note, his top is not a price point, as is Lara’s. His top is a box indicating possible prices and possible time frames. Lara has a price point specific.
Regarding the popularity or widespread knowledge of Lara’s count, there are not enough EW technicians/investors in the whole world combined to cause or prevent the market from doing what it is going to do. EW technicians & investors are so small compared to what makes up the market. They are a grain of sand in the sandbox. EW technicians and investors cannot control or move the market. The Federal Reserve has been the only one (for a time) to control the equity markets. So, I have no concern about how many people may be thinking like me as far as EW goes. If the whole world is bearish, however, that is a whole other matter. But we know the sentiment indicators are telling us the masses are bullish.
Finally, if EW theory is correct and it truly takes into account the psychology of the masses, it includes EW technicians and investors alike.
Vern,
Have you checked out Sid Norris’s Elliot Wave Counts? He is predicting the same with big drop into late July. Latest is that we will complete wave 5 today/tomorrow and then 3 week up cycle followed by the drop.
I went to the website but was unable to make an assessment as he does not make any of his work available for those just taking a look-see…
He charges only 17.00 for his screen shots so I may take a look. I saw his promotional video about his methodology and the Hurst Cycle analysis sounds interesting. It seems to resemble some the analysis that Tom Demark does.
Vern,
Don’t worry, I will post shortly some for our review and considerations as I have them.
Thanks Ris for the charts. I hope Norris is off on his timing of the big drop this year concluding at the end of July. I have a two week expedition in north central Washington scheduled for the first two weeks of July. I know one thing from this past week, I am not going to the mountains with open trades. I cannot relax my mind.
So here is what I need from all EWSM members, at the end of June you all make a big cash dump to short the market. The collective power of this membership should drop the market about 25%. Then I will get out of my shorts and go on my expedition with ease of mind. Thanks.
Awesome! Thanks…
Ris, are these charts posted behind a paywall?
In other words, is this paid content from Sid?
If it is I’ll have to remove it. It would be protected by his copyright.
Here is the S&P 1st chart
Chart 2
Chart 3
Chart 4
I assume that is wave five of minor one down?
A minor two of three week duration, if that is correct, would be quite long but I suspect it is possible. The corrective waves have certainly been long and drawn out, confounding bulls and bears alike….
Vern,
Volume on UVXY and TVIX were double the regular average daily volumes. I suspect it will get insane as the market heads down. Additionally, noticed monthly, weekly, and daily charts for S&P showing interesting symmetries. Weekly showing the expectations for 14 weeks of down trend as we just had 10 weeks of uptrend twice from November and then again from Feb., 2016. Both tops on S&P were 24 weeks or so apart, let’s see how this plays out over the next month and bit.
Oh yes! You can see several basing levels in UVXY from which massive amounts of shares were sold short. It always makes me smile when they all pile on board sending the animal to several new 52 week lows over a a one or two week period, confident all time highs are just around the corner.
If this is indeed P3 developing we are going to see the mother of all capitulation spikes. I am fervently hoping it does not diverge again from VIX so I don’t miss the sweet spot as I did last August. The strange thing is that this being a possible primary 2 top and presumably the acme of bullishness of the ending bull run, it is likely that a lot of folk are going to refuse to cover during the initial carnage. There’s gonna be a lot of bloodied, bruised and broken corpses strewn all over Wall Street of folk who were too late in coming to a realization of what was about to descend upon the markets….if they are leveraged long they are toast! Absolutely crispy critters! 🙂
I’m not sure if we will get much of a move until the US open on Monday as it’s bank holiday for us in the Uk and I assume London market will be closed, sounds like it could be tough to enter this short by some of the comments I see! Very nerving for noob traders like me. I will be happy if we get a bounce up for the first couple of trading days of May then a reversal. If I miss the opportunity I assume after how ever big the first 5 down is if not finished already we should still have a 3 wave counter trend reguardless to then enter short if I’m following this correctly.
Yes, you are following correctly.
This market isn’t easy for new traders. It’s highly volatile. It can move fast.
The single most important aspect of trading that most newbies get wrong, and is their downfall, is risk management. So here’s some tips:
– don’t risk more than 3-5% of equity on any one trade.
– always use a stop loss on every position.
– don’t add to your position until prior positions are profitable and have a stop moved on them to at least break even.
– know exit strategy / conditions in advance. A target, or a trend line breach should see the trade closed.
– exit a trade as soon as you recognise it has gone wrong.
– don’t meet margin calls.
Some of these ideas are from Kaufman “Trading Systems and Methods”. It has a good chapter on risk control.
Thanks Lara 🙂
If someone had pointed out what Lara’s tips when I started trading I would have probably save alot of money (I say probably because it is one thing being told and another having enough command of your emotions to act on that advice – I suspect many new traders will have to learn the hard (expensive) way just like most of us here).
So FWIW – Can I add (for new traders of course – others have developed methods which are profitable for them).
– trade shares rather than options. This gives you the benefit of time if the wave count temporarily morphs into something more time consuming
– don’t use margin (same reason as above)
– be very careful of price decay on 2x, 3x ETFs (again same reason as above). Bail on these as soon as you know you are wrong (unless there is a high probability count which might let you get out very soon at a better price) – otherwise don’t even think about it just take the loss
– Place trades as close to invalidation points as possible (but based on Laras preferred EW count). The risk is greatly reduced
– Listen to Lara’s advice – it is not always right (there are no crystal balls here) but it is totally unbiased so has a high probability of being correct. Case in point, I personally didn’t think gold had turned around and so waited until price invalidated the bear count (so got in later than I should have). Lara was right, I was wrong – because I was biased (I wanted to buy in at sub $1000).
Personally I like to take profits as close to an important price confirmation point as possible, and re-buy the position just after price confirms. You are making the market either prove itself or taking your profits off the table.
The loss due to commission / price difference is more than made up by the huge number of times that the market has come close to confirmation then jetted off in the opposite direction and made new price extremes.
“Personally I like to take profits as close to an important price confirmation point as possible, and re-buy the position just after price confirms. You are making the market either prove itself or taking your profits off the table.”
What a fabulous idea.
Thanks for sharing that one Olga!
And to add, it is fear and greed which dominates markets. These are the two emotions we must be aware of in ourselves and work to ensure our decisions aren’t based on them.
I agree it is a good strategy to consider. I have been thinking about this strategy since you mentioned it last. But you have mentioned it before as well. For those who are nimble and available all day, it can reduce risk tremendously. So it has great merit. In addition, I think the fear of gaps going too far so as to not let us get back in position, those fears are way overdone. It happens but it is not the norm.
Lara, that was one super call of what now looks like the top of the primary wave 2–within just a few points out of >2,000! That’s some really fine work!
Thanks Thomas.
Yes, a career defining call if I’ve got it right.
But we won’t know for sure until we have a new low below 1,810
Bloomberg reporting that BOJ is a 10% or larger stakeholder in over 90% of ETFs in the Nikkei Index. Here’s the dirty little secret- I do not think they are the only central bank that has been doing this under the table…
That may be Verne, but I recently saw some figures that can account for all of the last run up in prices from 2008 just from company stock buybacks alone. The net from all other sources was negative over the same period. Aaannnd…almost all of them are going way into debt to do it. How does this end well?
Makes sense to me. The insiders have all been selling, financed by the buybacks, the baby boomers are retiring by the millions and will be withdrawing funds steadily, the credit ratings of many companies are deteriorating, which is in turn crimping their ability to fund buybacks – Johnson and Johnson and Microsoft are the only two now left with triple A after Exxon Mobil just bit the dust- and we are still trading near all-time highs people! Just for the fun of it, I want to own at least 1 SPY 210 put and one 180 DIA put (leaps of course) just for posterity’s sake! 🙂
You can pass those puts down to your posterity and make them millionaires!
I am holding a few UVXY leaps for just that purpose! 🙂
(Although I would not be surprised to see trading on that beast halted before this is all over)
Greatly intrigued by your alluding to a possible cycle three wave.
Lara I do not think it is in the remotest absurd.
As I ponder the kinds of remarkable extremes we have been seeing in the markets, and which I have frankly had a hard time getting my mind around to fathom what could be producing these kinds of distortions, that possibility is VERY thought-provoking, and would actually explain a lot.
I think we are going to see some serious extension in the current impulse down, and suspect we just completed only minuette one down…interesting times ahead…!
When I look at how far it’s moved from the ATH on the monthly chart, cycle wave I doesn’t look complete yet.
But as I said in the analysis, that depends on how far this impulse down goes…. if that is indeed what happens, an impulse unfolds to new lows.
Dear Lara,
Again, thanks for all your excellent analysis and commentary.
I have a concern regarding the weekly bearish engulfing pattern. We may have discussed this previously. But I need to do so again.
According to Nison, page 43 of 2nd edition, criteria for an engulfing pattern,
“2. Two candles comprise the engulfing pattern. The second real body must engulf the prior real body (it need not engulf the shadows).”
The top of the real body of the 1st candle of our pattern is 2091.58.
The top of he real body of the 2nd candle of our pattern is 2089.37
Thus, last week’s weekly candle does not ‘engulf’ the previous week’s real body. If I am understanding this correctly, it is not an engulfing pattern.
However, just as important to us is the implication of the last two weekly candles. I think our pattern, though not an engulfing pattern, implies the same market internals and dynamics. The bulls have lost control and bear have gained control. A trend reversal is at hand.
That too has been my own understanding of how the engulfing pattern is defined- i.e. the entire real body of the first candle must be engulfed by the entire real body of the second candle.
Looking at that lower wick of Friiday’s hammer suggests that we completed minuette one down and will see a sharp minuette two up on Monday that will do a masterful job of trapping a few more bulls before the hammer falls.
I expect to see a very sharp pullback in UVXY at the open that will just as sharply be reversed with the day ending with a fat green candle.
I have a few 50 mm cannons trained… 🙂
The fact that the bullish hammer has occurred near the top and is not preceded by a relatively long drop in the market reduces its probability and power / potential of the hammer. I agree though that we may see a correction up to 2100 which would pull in those bulls come lately, the retail investor afraid of missing the next 200 point advance. Yesterday, I heard a talking head say this correction we are seeing is marking the midway point for the bull market. He expects it to resolve to the upside and produce another 300 point up move to 2400+. I feel very sorry for those who follow him.
On the other hand, the potential to the downside is so strong that the market may not give any immediate opportunities for a good bear entry point. It would be a way of rewarding those who have entered early and stuck to it.
Some days ago, I pointed out the symmetry of the drops and rallies starting last August. We need to watch the upcoming drop as it nears its symmetrical conclusion, below 1810 and about 6-8 weeks from now. If the SPX stalls there, it will be time for serious caution. If the SPX can blast through 1810 and get into the mid 1700’s, then the symmetrical pattern will be broken.
Have a great weekend Vern and all.
The perma-bulls are either really malicious or incredibly slip-shod. I can’t believe people take these folk seriously. You have a great week-end too Rodney. See ya in the trenches…. 🙂
I can see why people take them seriously. They have been far more right than wrong for about 15 years now. Add to that the fact that no one wants to be left behind when the bull leaves the gate.
kinda late to this post but thought it may be helpful re candles
Fallling Three Methods
Pattern: continuation
Reliability: high
Identification
A long black day in a downtrend is followed by three (in this case 4) relatively small candles that move opposite the overall trend but stay within the range of the first day. The fifth(sixth)day is a long black day that closes below the close of the first day and continues the downtrend.
The Psychology
In a downtrend, a long black day is followed by a brief bounce (preferably on lightish volume). The fifth(sixth)day simply continues the trend. The brief bounce is nothing more than a few days off for the bears-see link for more details-
http://www.leavittbrothers.com/education/candlestick_patterns/bear/falling_three_methods_bearish.cfm
Thanks John. Your input is not late by any stretch. It is through such input that I learn. So thanks again.
Another interesting point on this is to keep in mind is that the banksters are not to going to cease and desist in their attempts to fight the trend, ergo those long lower wicks. I was amazed to see how much the stock buy-backs ramped up during the most powerful portion of the decline during the credit crisis. Rumor has it that this is where several unaccounted for trillions the FED burned actually went. No wonder they are terrified of an audit.
I’m hoping it will do a masterful job of letting me buy back in UVXY at a great price 🙂
Agreed though – I might need to be quick!
One way or another I’ll be 0% by 2039 and 100% as close to 2038 as possible (yep – I risk getting gapped, but there is enough reward to stomach it and still reduce my risk of the alternate to better than break even).
I don’t trust a W2 will allow be to get short so won’t be trading that.
You will have to be quick…!
Pre-market it often trades at a discount when the market is heading higher short term. Doesn’t always work though.
I’m already in profit (albeit small) – is just a scalp so no major worry if it doesn’t turn out as expected. My main concern would be a *huge* gap and go, but I think at these levels there is still enough belief in the bull to keep a cap on that (I think at these levels a gap would still be panic bought).
When we get to the middle of P3 I expect to see some seriously huge panic selling gaps that don’t get filled for a very long time, but everyone here should be positioned well before then.
You are right to take that risk, Olga. There will be plenty of downside to ride!
Yeah – trading never seems to turn out exactly how you plan it, but that’s all part of the fun! 🙂
I scalped that first impulse down and have 90% of short term ammo ready for reload on any bounce Monday…rinse and repeat…will move all the fire power to UVXY calls as soon as it clears 20….
The banksters are going to screw up a lot of novice traders. The impulses down the past several months are completing intra-day so you have to either be positioned the night before or execute your trades at the open to make a decent profit. Of course position traders who understand what is unfolding can sit tight on their positions and wait for the waves down to complete, but many inexperienced traders are going get killed by the violent whipsaw of the deep retracements as the banksters go all in. I am expecting we are going to see thousand point swings in DJI and 100 point swings in SPX.
I think there are going to be some opportunities for some really awesome trades for the prepared…. 😉
We have a very good chance of Lara’s count giving us a heads up as to when to expect the gap n’ go….
I bought back my covered calls at the last UVXY low for pennies and boy I am glad I did. I don’t think we will be revisiting the sub 15 region anytime in the immediate future so I have entered my trailing stop order to sell using a trailing stop of 5 points. After it clears 20 stop will be increased to 7.5 and after 25 to 10. If we go below 2039.74 and the stop is not triggered, it will be cancelled and replaced with a contingency order to sell after a 5% CLOSING decline. Needless to say, I will carefully watching the action in the event mid-stream adjustments are warranted! This beast is very tricksy….! 🙂
I have considered that problem too.
However, the most important aspect of this two candle reversal is the lower close of the second candle, it must be below the open of the first.
The other two bearish candle reversal patterns are dark cloud cover and piercing pattern. Both are weaker reversal patterns because both have the second candle closing within the body of the first candle.
So I think of it this way. The first week the bulls were in control and closed up for the week. However, that first weekly candle also has a long upper wick. The bulls pushed price higher for the week but they weren’t strong enough to keep price near the highs, the bears pushed it back down to close reasonably below the highs.
Then the next week opens with a small gap down. That’s actually bearish.
The second week the bears dominated. They dominated so much so that they pushed price not only to below the open of the prior week, but well below that open. The body of the second candle closes comfortably below the open of the first body.
There isn’t actually a candlestick pattern in Nison’s book which covers this scenario perfectly. But my reading of Nison and his description of bulls and bears and how they form the patterns leads me to believe that this particular pattern we have here is very bearish indeed.
As I stated above, the implications are the the same. We have a very bearish reversal pattern.
I was reading Nison’s introductory chapter again. Therein, he states that he found quite a bit of variance among the written and oral descriptions of candlestick patterns. He had to make some choices when writing his book. He always chose the more stringent guideline / rules / definitions etc of the pattern. Therefore, his definition of an ‘engulfing’ pattern is the more stringent. This leaves open the ability to identify patterns and individual candles outside the more stringent guidelines.
In other words, Nison leaves open the analysis by candlestick chartist to intrepret freely. Thus I will now agree emphatically, this past week the SPX put in a weekly bearish engulfing pattern.
🙂 It’s a great book isn’t it!
Lara, the alternate weekly is invalidated in the DOW. LD in SPX and impulse in DOW should be essentially impossible.
True.
I did know that… but didn’t think through the implications well enough.
I think I should stop publishing that alternate.
Does that mean the DOW and the SPX have the same wave count?