
Another small range day for another doji, now four in a row.
The squeeze on price should be over very shortly.
Summary: The possibility of new highs will remain while price remains above 2,039.74. A breach of the support line at the daily chart level would indicate a trend change from bull to bear and that a third wave down would then be most likely. A new high above 2,111.05 would indicate a little more upwards movement for a few days to end above 2,116.48 but not above 2,134.72. Price is squeezed between the bear market trend line and the lower support line. These lines converge in about three to four hours, so a large movement may occur when price breaks out. A downwards breakout looks more likely.
To see last published monthly charts click here.
To see how each of the bull and bear wave counts fit within a larger time frame see the Grand Supercycle Analysis.
To see detail of the bull market from 2009 to the all time high on weekly charts, click here.
New updates to this analysis are in bold.
BEAR ELLIOTT WAVE COUNT
WEEKLY CHART
Click chart to enlarge.
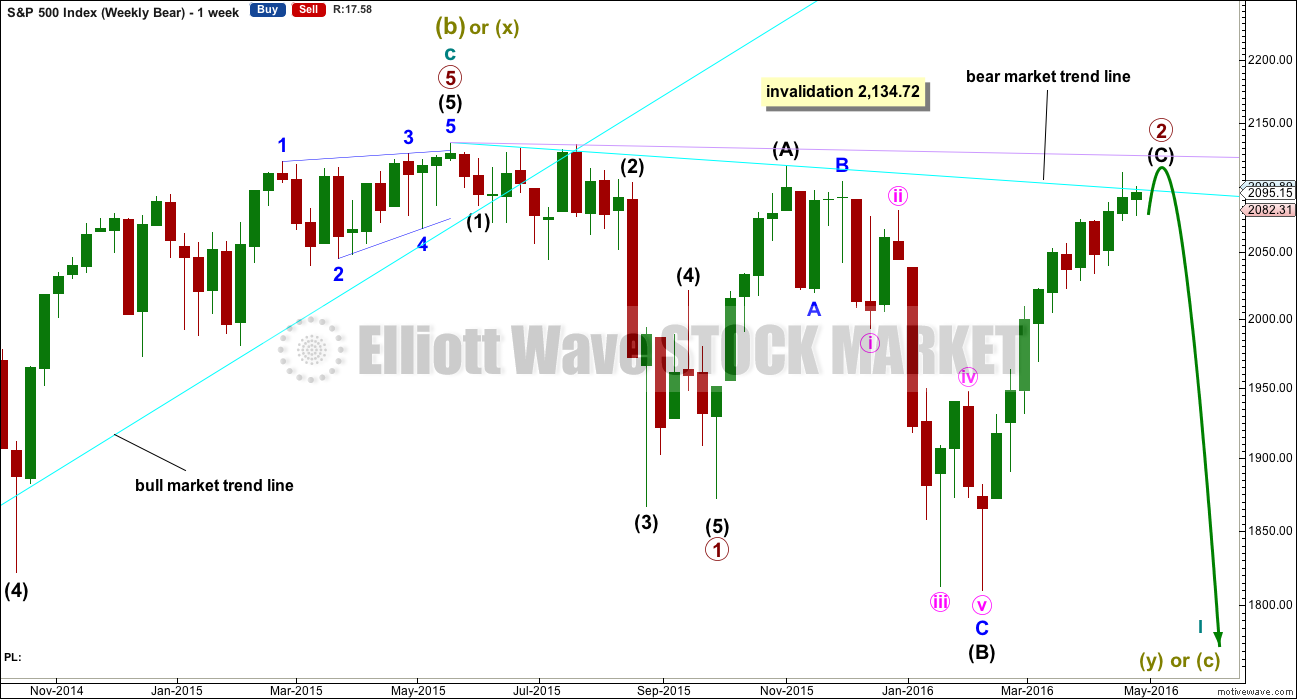
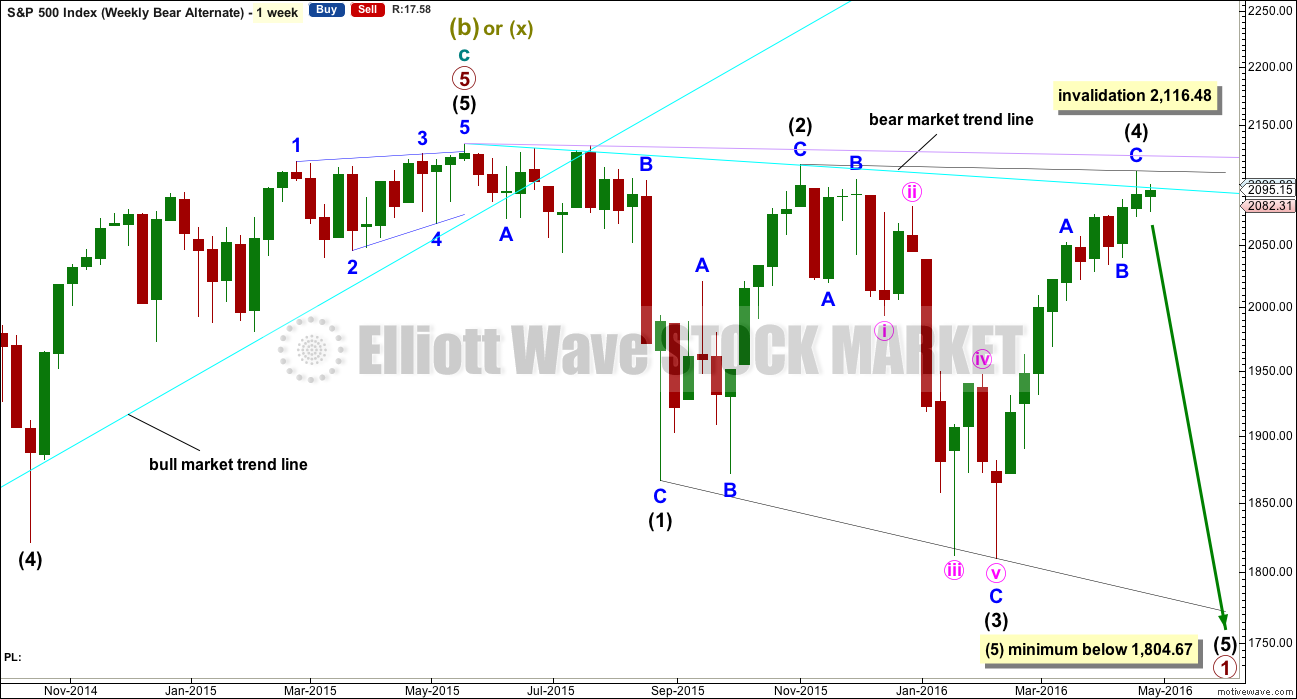
This bear wave count fits better than the bull with the even larger picture, super cycle analysis found here. It is also well supported by regular technical analysis at the monthly chart level.
Importantly, there is no lower invalidation point for this wave count. That means there is no lower limit to this bear market.
Primary wave 1 is complete and lasted 19 weeks. Primary wave 2 is either over lasting 28 weeks, or it may continue for another one or two weeks.
The long upper shadow on last week’s green weekly candlestick is bearish.
Primary wave 2 may be unfolding as an expanded or running flat. Within primary wave 2, intermediate wave (A) was a deep zigzag (which will also subdivide as a double zigzag). Intermediate wave (B) fits perfectly as a zigzag and is a 1.21 length of intermediate wave (A). This is within the normal range for a B wave of a flat of 1 to 1.38.
Intermediate wave (C) is likely to make at least a slight new high above the end of intermediate wave (A) at 2,116.48 to avoid a truncation and a very rare running flat. However, price may find very strong resistance at the final bear market trend line. This line may hold price down and it may not be able to avoid a truncation. A rare running flat may occur before a very strong third wave down. That looks possible today. The whole structure is now complete down to the five minute chart level. The hourly alternate looks at this possibility that intermediate (C) is over today and truncated by 5.43 points. The truncation is small and acceptable.
If price moves above 2,116.48, then the alternate bear wave count would be invalidated. At that stage, if there is no new alternate for the bear, then this would be the only bear wave count.
Primary wave 2 may not move beyond the start of primary wave 1 above 2,134.72.
DAILY CHART
Click chart to enlarge.
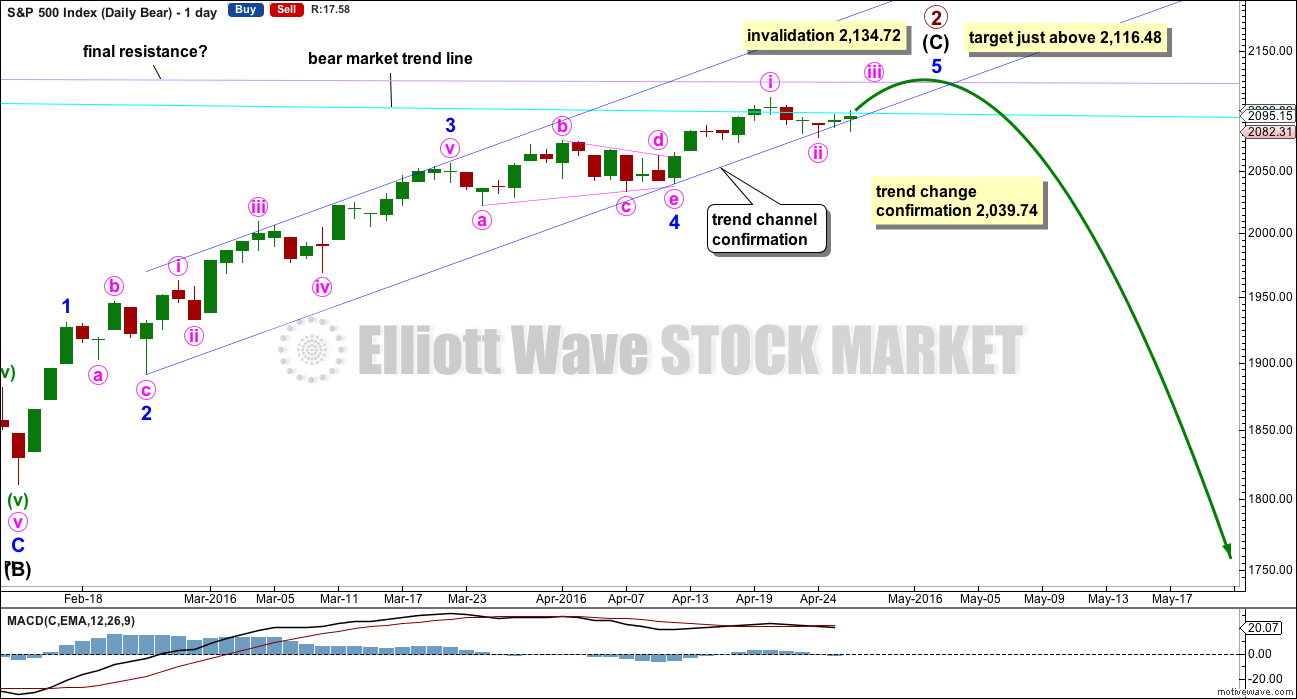
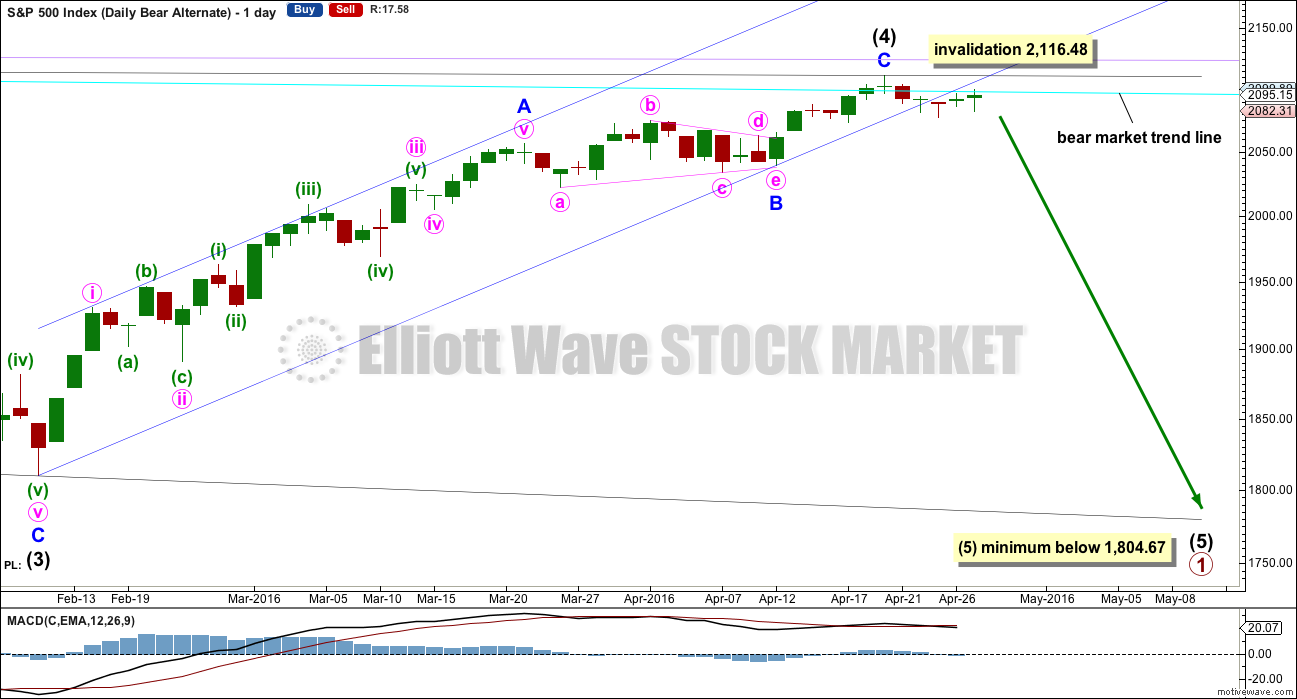
Intermediate wave (A) fits as a single or double zigzag.
Intermediate wave (B) fits perfectly as a zigzag. There is no Fibonacci ratio between minor waves A and C.
Intermediate wave (C) must subdivide as a five wave structure. It is unfolding as an impulse.
Intermediate wave (C) does not have to move above the end of intermediate wave (A) at 2,116.48, but it is likely to do so to avoid a truncation. If intermediate wave (C) is over, then the truncation is small at only 5.43 points. This may occur right before a very strong third wave pulls the end of intermediate wave (C) downwards. However, it is unconfirmed today although this is possible. Confirmation is required.
The next wave down for this wave count would be a strong third wave at primary wave degree.
The target is for intermediate wave (C) to end just above the end of intermediate wave (A) at 2,116.48, so that a truncation is avoided.
Redraw the channel about the impulse of intermediate wave (C) using Elliott’s second technique: draw the first trend line from the ends of the second to fourth waves at minor degree, then place a parallel copy on the end of minor wave 3. Minor wave 5 may end midway within the channel. When this channel is breached by downwards movement, that will be the earliest indication of a possible end to primary wave 2. If upwards movement is over, then the channel should be breached this week.
Price today is still squeezed between the cyan bear market trend line and the lower edge of the blue channel, which is the same as the support line. These lines converge almost now. When price can break out of this squeeze, then it may begin to accelerate.
Because expanded flats do not fit nicely within trend channels, a channel about their C waves may be used to indicate when the expanded flat is over. After a breach of the lower edge of the channel, if price then exhibits a typical throwback to the trend line, then it may offer a perfect opportunity to join primary wave 3 down. This does not always happen, so if it does in this case take the opportunity.
Within minor wave 5, no second wave correction may move beyond the start of its first wave below 2,039.74. A new low below 2,039.74 could not be a second wave correction within minor wave 5, so at that stage minor wave 5 would have to be over. This would confirm a trend change.
Primary wave 1 lasted 98 days (not a Fibonacci number). So far primary wave 2 has lasted 145 days. Up to two either side of 144 would be close enough for a Fibonacci relationship in terms of duration.
Price may find final resistance and end upwards movement when it comes to touch the lilac trend line.
HOURLY CHART
Click chart to enlarge.
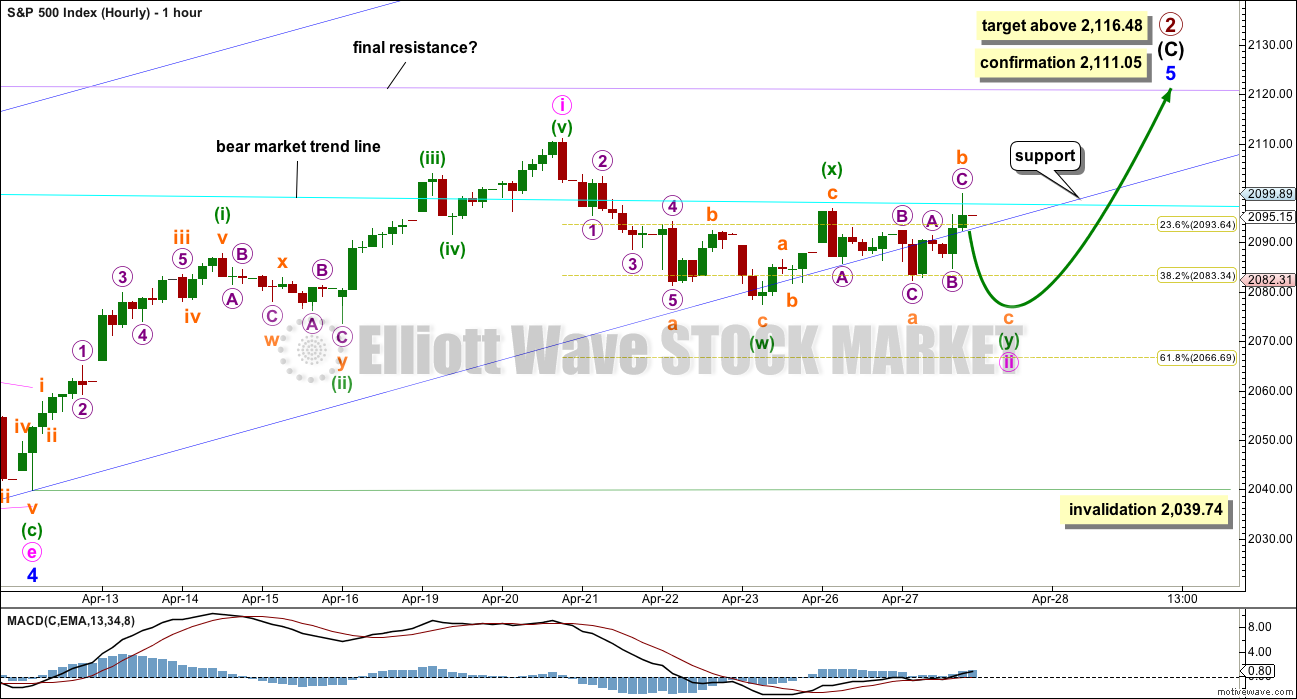
Within minor wave 5, minute wave i may be a complete impulse.
Minute wave ii today continued further sideways. It looks like it may be unfolding as a combination. The first structure in a double combination may be a completed zigzag labelled minuette wave (w). The double is joined by a three, a zigzag in the opposite direction labelled minuette wave (x). The second structure in the double looks like an expanded flat labelled minuette wave (y).
Minuette wave (y) should be expected to end about the same level as minuette wave (w) at 2,077.52, so that the whole structure moves sideways. This would see the blue channel breached on the hourly chart and overshot on the daily chart. It is a breach on the daily chart which is needed to indicate a trend change.
Within minuette wave (y), the subwave of subminuette wave b is a 1.2 length of subminuette wave a indicating an expanded flat. At 2,076 subminuette wave c would reach 1.618 the length of subminuette wave a, and minuette wave (y) would end close to minuette wave (w).
If minute wave ii continues any lower, it may not move beyond the start of minute wave i below 2,039.74.
ALTERNATE HOURLY CHART
Click chart to enlarge.
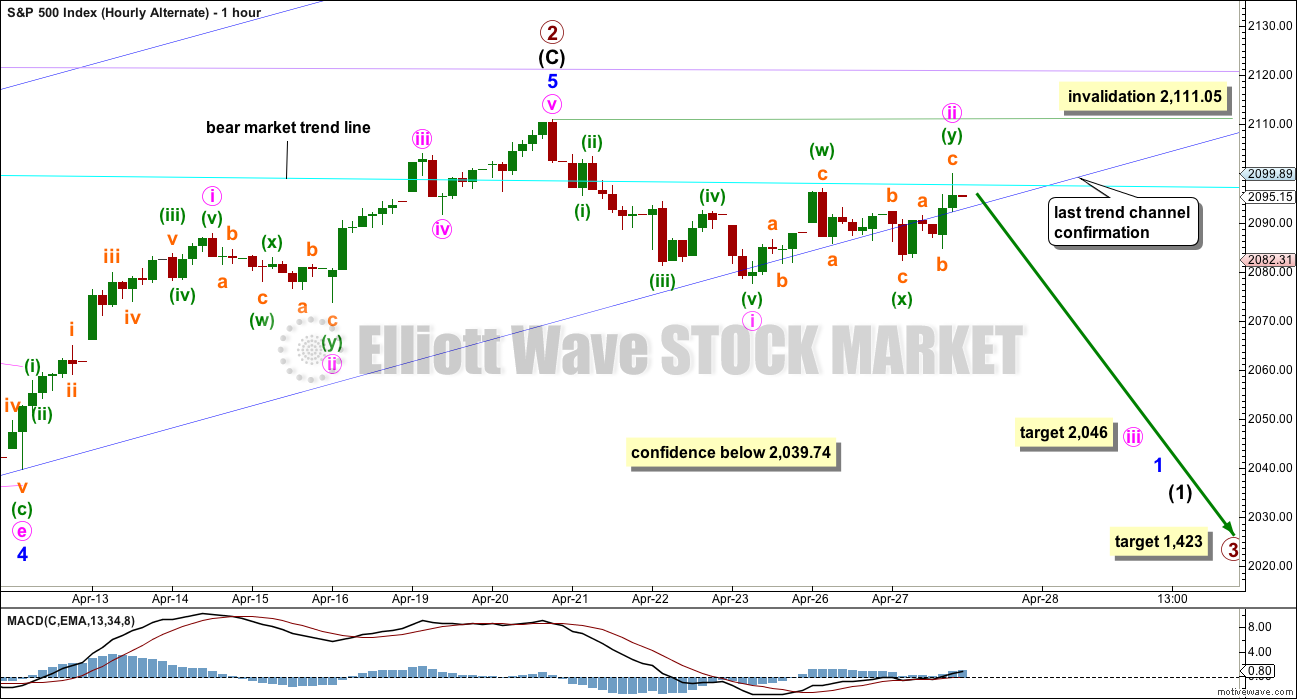
The entire structure of primary wave 2 may now be complete. This alternate wave count absolutely requires some confirmation before any confidence may be had in it.
Ratios within intermediate wave (C) would be: minor wave 3 has no Fibonacci ratio to minor wave 1, and minor wave 5 (if it is over) would be 3.21 points short of 0.618 the length of minor wave 1.
Ratios within minor wave 5 would be: minute wave iii would be just 0.67 points longer than 0.618 the length of minute wave i, and minute wave v would be just 0.59 points longer than 0.618 the length of minute wave iii and just 1 point longer than 0.382 the length of minute wave i.
Minute wave i may have ended at the lower edge of the blue channel.
Minute wave ii today moved higher, continuing as a double zigzag. It should find very strong resistance at the bear market trend line.
At 2,046 minute wave iii would now reach 1.618 the length of minute wave i.
A clear and strong breach of the dark blue channel would provide further confidence in a trend change. That has not happened yet. If that happens, then reasonable confidence may be had in this wave count, enough to use the lower edge of the blue channel as an entry point. If price throws back to find resistance at the blue channel after breaching it, that would be a low risk high reward opportunity to enter short. The risk would be at 2,111.05 or for the more adventurous trader at 2,134.72.
Finally, a new low below 2,039.74 would provide reasonable confidence in a trend change. The only question at that stage would be of what degree?
At 2,046 minute wave iii would reach 1.618 the length of minute wave i. This target may be met next week, depending on how time consuming the second and fourth wave corrections within the impulse of minute wave iii may be.
If primary wave 2 is over, then the target for primary wave 3 would be 2.618 the length of primary wave 1 at 1,423. That is the appropriate Fibonacci ratio to use when the second wave correction is so very deep, and here primary wave 2 would be 0.91 the length of primary wave 1.
Primary wave 1 lasted 98 days (not a Fibonacci number). Primary wave 2 may have lasted 140 days (four short of a Fibonacci 144). Primary wave 3 may be quick, but it still would have two sizeable corrections for intermediate waves (2) and (4) within it. An initial expectation may be for it to total a Fibonacci 144 or 233 days.
ALTERNATE WEEKLY CHART
Click chart to enlarge.
Primary wave 1 may subdivide as one of two possible structures. The main bear count sees it as a complete impulse. This alternate sees it as an incomplete leading diagonal.
The diagonal must be expanding because intermediate wave (3) is longer than intermediate wave (1). Leading expanding diagonals are not common structures, so that reduces the probability of this wave count to an alternate.
Intermediate wave (4) may continue higher now and may find resistance at the bear market trend line.
ALTERNATE DAILY CHART
Click chart to enlarge.
Within a leading diagonal, subwaves 2 and 4 must subdivide as zigzags. Subwaves 1, 3 and 5 are most commonly zigzags but may also sometimes appear to be impulses.
Intermediate wave (3) down fits best as a zigzag.
In a diagonal the fourth wave must overlap first wave price territory. The rule for the end of a fourth wave is it may not move beyond the end of the second wave.
Within diagonals the second and fourth waves are commonly between 0.66 to 0.81 the prior wave. Here, intermediate wave (2) is 0.93 of intermediate wave (1) and intermediate wave (4) is 0.98 of intermediate wave (3). This is possible, but the probability of this wave count is further reduced due to the depth of these waves.
Expanding diagonals are not very common. Leading expanding diagonals are less common.
Intermediate wave (5) must be longer than intermediate wave (3), so it must end below 1,804.67. Confirmation of the end of the upwards trend for intermediate wave (4) would still be required before confidence may be had in a trend change, in the same way as that for the main bear wave count.
BULL ELLIOTT WAVE COUNT
WEEKLY CHART
Click chart to enlarge.
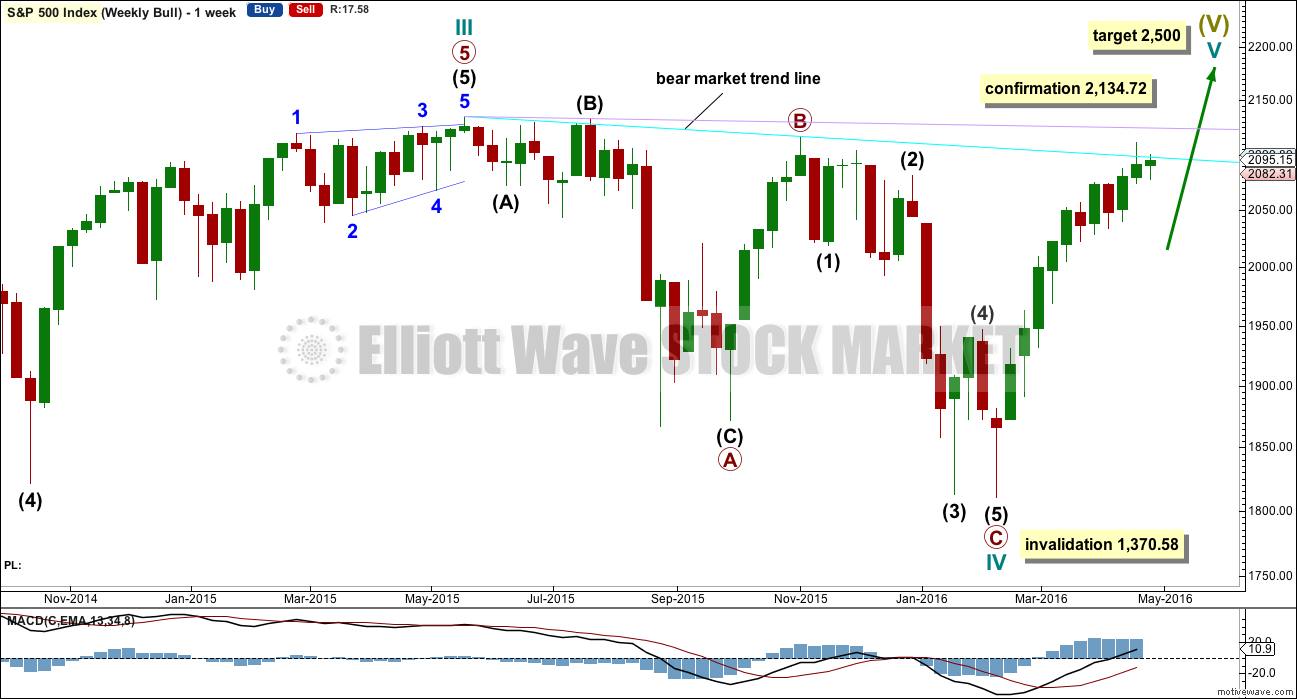
Cycle wave II was a shallow 0.41 zigzag lasting three months. Cycle wave IV may be a complete shallow 0.19 regular flat correction, exhibiting some alternation with cycle wave II.
At 2,500 cycle wave V would reach equality in length with cycle wave I.
Price remains below the final bear market trend line. This line is drawn from the all time high at 2,134.72 to the swing high labelled primary wave B at 2,116.48 on November 2015. This line is drawn using the approach outlined by Magee in the classic “Technical Analysis of Stock Trends”. To use it correctly we should assume that a bear market remains intact until this line is breached by a close of 3% or more of market value. In practice, that price point would be a new all time high which would invalidate any bear wave count.
This wave count requires price confirmation with a new all time high above 2,134.72.
While price has not made a new high, while it remains below the final bear market trend line and while technical indicators point to weakness in upwards movement, this very bullish wave count comes with a strong caveat. I still do not have confidence in it.
DAILY CHART
Click chart to enlarge.
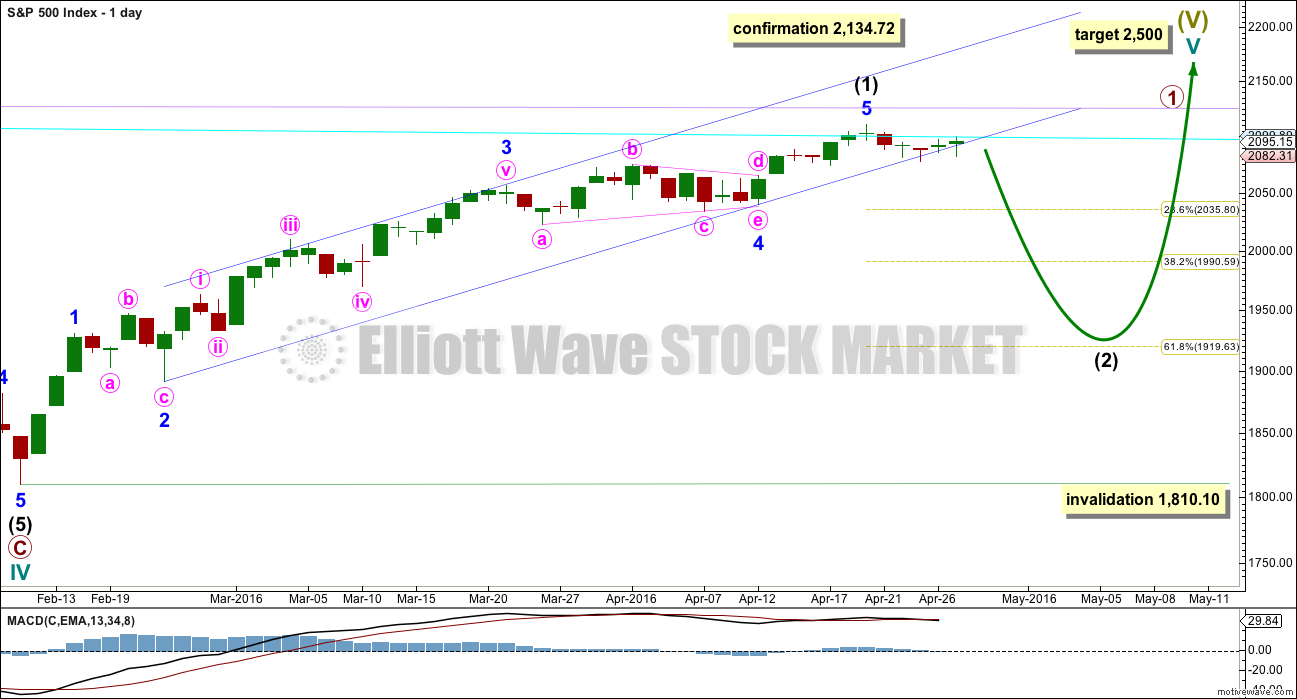
Intermediate wave (2) is seen as an atypical double zigzag. It is atypical in that it moves sideways. Double zigzags should have a clear slope against the prior trend to have the right look. Within a double zigzag, the second zigzag exists to deepen the correction when the first zigzag does not move price deep enough. Not only does this second zigzag not deepen the correction, it fails to move at all beyond the end of the first zigzag. This structure technically meets rules, but it looks completely wrong. This gives the wave count a low probability.
If the bull market has resumed, it must begin with a five wave structure upwards at the daily and weekly chart level. That may today be complete. The possible trend change at intermediate degree still requires confirmation in the same way as the alternate hourly bear wave count outlines before any confidence may be had in it.
If intermediate wave (2) begins here, then a reasonable target for it to end would be the 0.618 Fibonacci ratio of intermediate wave (1) about 1,920. Intermediate wave (2) must subdivide as a corrective structure. It may not move beyond the start of intermediate wave (1) below 1,810.10.
In the long term, this wave count absolutely requires a new high above 2,134.72 for confirmation. This would be the only wave count in the unlikely event of a new all time high. All bear wave counts would be fully and finally invalidated.
TECHNICAL ANALYSIS
DAILY CHART
Click chart to enlarge. Chart courtesy of StockCharts.com.
Volume data on StockCharts is different to that given from NYSE, the home of this index. Comments on volume will be based on NYSE volume data when it differs from StockCharts.
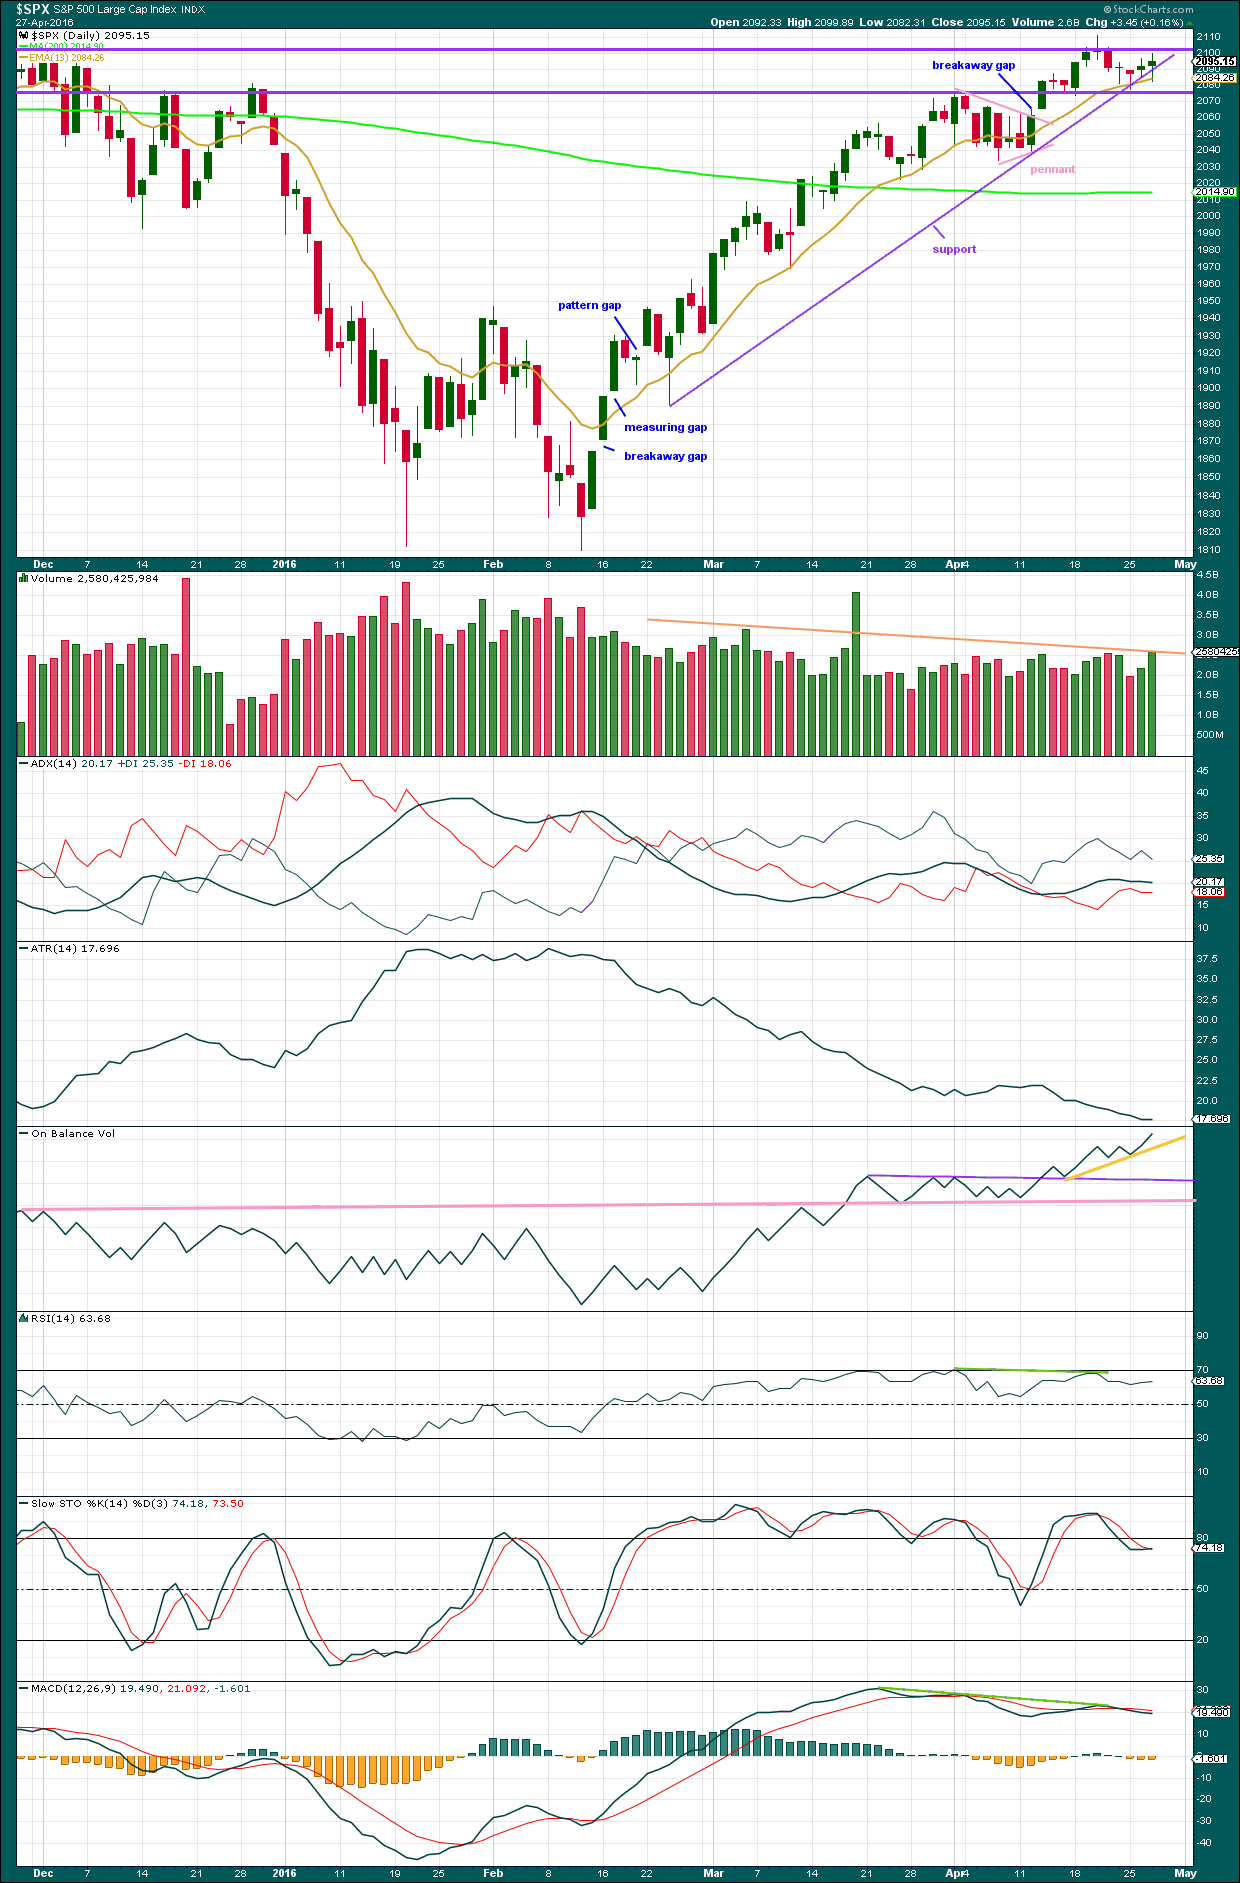
The line in the sand for a trend change is the upwards sloping purple support line. This is the same as the lower edge of the blue channel on the main daily Elliott wave count. A breach of this bull market trend line would indicate the trend (at least short to mid term) has changed from bull to bear. While price remains above that support line it should be expected that price may find support there. A breach is a full daily candlestick below the line and not touching it. So far the line is overshot twice. This may be a warning that support is weakening, but the line is not yet breached. Price is finding strong resistance about the round number of 2,100.
An Evening Doji Star candlestick pattern is completed at the last high. This is a reversal pattern and offers some support for expecting a high is in place. The fact that this pattern has occurred at the round number of 2,100 is more significant. There is light volume on the first candle in the pattern and heavier volume on the third candle in the pattern. This increases the probability of a reversal.
How price behaves at this line will indicate which hourly Elliott wave count is correct and if price is beginning either new wave down or if it will continue to make new highs. For clues as to whether the line may be breached sooner or later we can look to volume, momentum, breadth, strength and sentiment.
Volume: Overall, now volume declines as price has been rising for over 40 days. Volume indicates the upwards movement is unsupported and unsustainable. A relatively large correction at least would be expected. In the short term, there are now two upwards days with increasing volume. The rise in price is supported by volume short term. This gives some small cause for concern for a bearish outlook, but it is small only as price has not managed to make substantial new highs and both days are very small range days completing doji candlesticks.
On Balance Volume: To date this indicator has been providing bullish signals along with rising price. OBV will remain bullish while OBV finds support at all the trend lines drawn here. The yellow line as it was drawn yesterday did not provide resistance. It is redrawn today. There is no bearish signal from OBV; it was negated. A break below the purple lines would be reasonable bearish indication. A break below the pink line would be a strong bearish signal. In this instance, unfortunately, OBV may not lead price for us.
Momentum: MACD shows divergence with price (green line) back to 22nd March. With reasonably long held divergence, this indicates momentum is weak.
Breadth: As given in charts below, the AD Line and Bullish Percent both indicate breadth to this upwards movement, but there is hidden bearish divergence. The increase in breadth is not translating to a corresponding increase in price; price is weak.
Strength: RSI has some slight divergence with price (green line). RSI has failed to make corresponding highs as price has made new highs. This indicates weakness in price.
Sentiment: As given in COT charts below, up to 18th April, commercials are more strongly short than long and non commercials more strongly long than short. This is bearish.
Conclusion: The bearish case at least short / mid term is supported by volume analysis, but not today by On Balance Volume. The divergence in momentum, breadth and strength indicators supports a bearish outlook over a bullish outlook. Sentiment of commercials is also bearish. Overall, the balance of this picture is predominantly bearish. The support line should be expected to most likely be breached. If it is breached, then look for a potential throwback to find resistance. If price behaves like that, then take the opportunity to enter short there.
INVERTED VIX DAILY CHART
Click chart to enlarge. Chart courtesy of StockCharts.com.
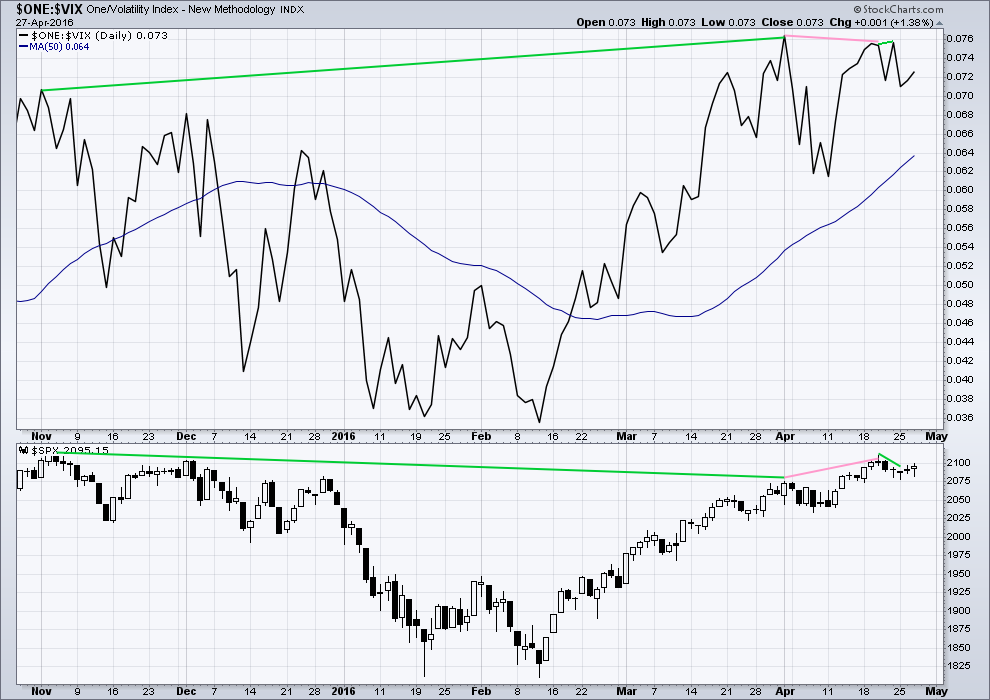
Volatility declines as inverted VIX climbs. This is normal for an upwards trend.
What is not normal here is the divergence over a reasonable time period between price and inverted VIX (green lines). The decline in volatility is not translating to a corresponding increase in price. Price is weak. This divergence is bearish.
Price made a new short term high, but VIX has failed to make a corresponding high (pink lines). This is regular bearish divergence. It indicates further weakness in the trend.
22nd April’s small green doji candlestick overall saw sideways movement in price, closing very slightly up for the day. Yet inverted VIX has made new highs above the prior high of 20th of April. Volatility declined for 22nd April, but this was not translated into a corresponding rise in price. Again, further indication of weakness in price is indicated. This is further hidden bearish divergence.
BULLISH PERCENT DAILY CHART
Click chart to enlarge. Chart courtesy of StockCharts.com.
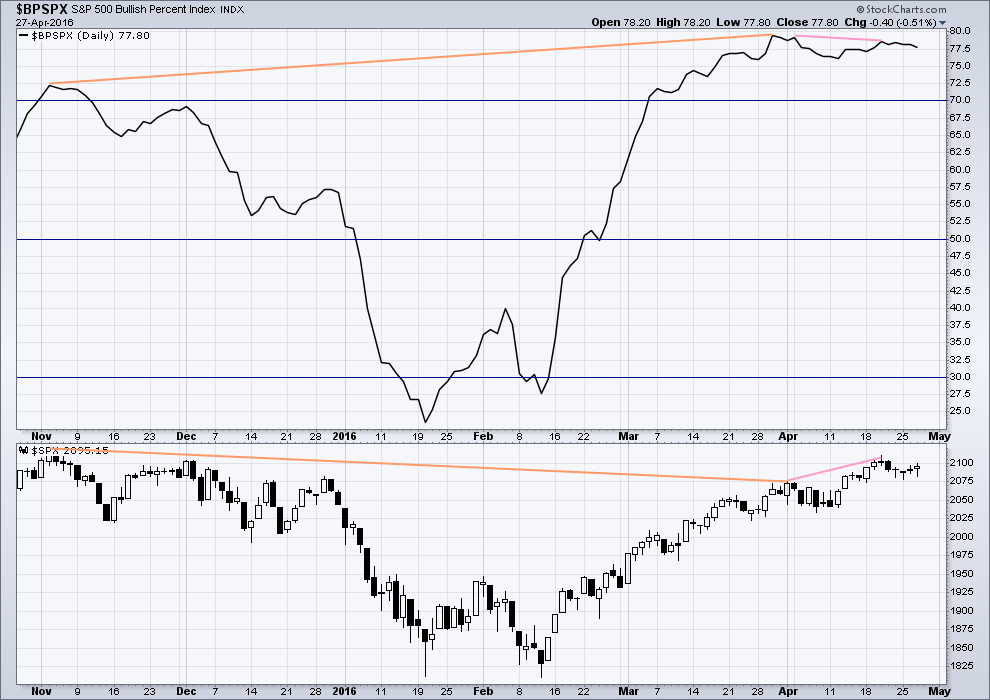
With this indicator measuring the percentage of bullish equities within the index, it is a measurement of breadth and not sentiment as the name suggests.
There is strong hidden bearish divergence between price and the Bullish Percent Index (orange lines). The increase in the percentage of bullish equities is more substantial than the last high in price. As bullish percent increases, it is not translating to a corresponding rise in price. Price is weak.
As price made a new short term high on 20th April, BP did not (pink lines). This is regular bearish divergence. It indicates underlying weakness to the upwards trend.
ADVANCE DECLINE LINE
Click chart to enlarge. Chart courtesy of StockCharts.com.
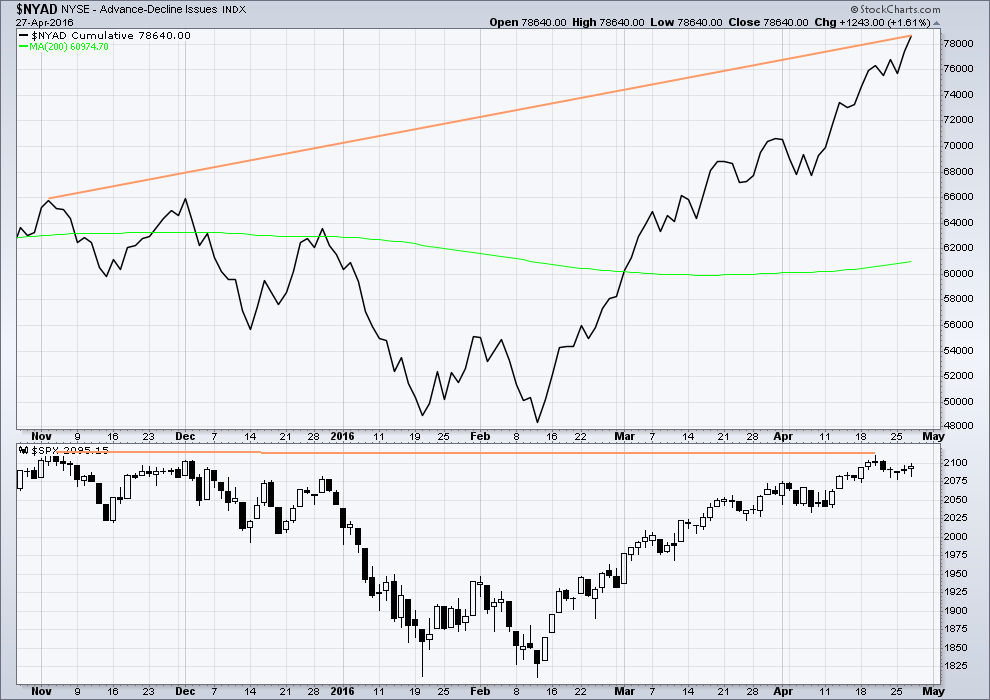
With the AD line increasing, this indicates the number of advancing stocks exceeds the number of declining stocks. This indicates that there is breadth to this upwards movement.
From November 2015 to now, the AD line is making new highs while price has so far failed to make a corresponding new high. This indicates weakness in price; the increase in market breadth is unable to be translated to increase in price.
It remains to be seen if price can make new highs beyond the prior highs of 3rd November, 2015. If price can manage to do that, then this hidden bearish divergence will no longer be correct, but the fact that it is so strong at this stage is significant. The AD line will be watched daily to see if this bearish divergence continues or disappears.
The AD line today has made a new high beyond the last swing high six days ago, but again this has failed to translate into a new high for price. This indicates further weakness in price.
The 200 day moving average for the AD line is now increasing. This alone is not enough to indicate a new bull market. During November 2015 the 200 day MA for the AD line turned upwards and yet price still made subsequent new lows.
COMMITMENT OF TRADERS (COT)
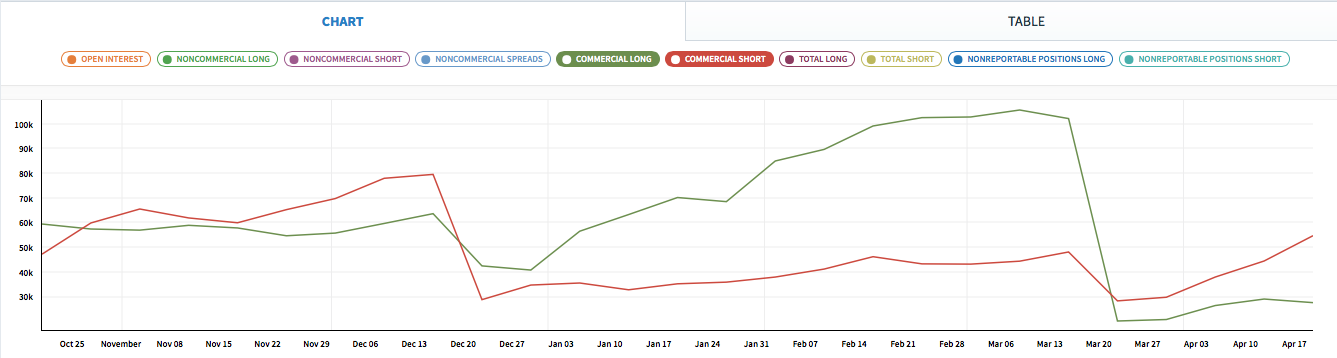
Click chart to enlarge. Chart courtesy of Qandl.
This first COT chart shows commercials. Commercial traders are more often on the right side of the market. Currently, more commercials are short the S&P than long. This supports a bearish Elliott wave count, but it may also support the bullish Elliott wave count which would be expecting a big second wave correction to come soon. Either way points to a likely end to this upwards trend sooner rather than later. Unfortunately, it does not tell exactly when upwards movement must end.
*Note: these COT figures are for futures only markets. This is not the same as the cash market I am analysing, but it is closely related enough to be highly relevant.
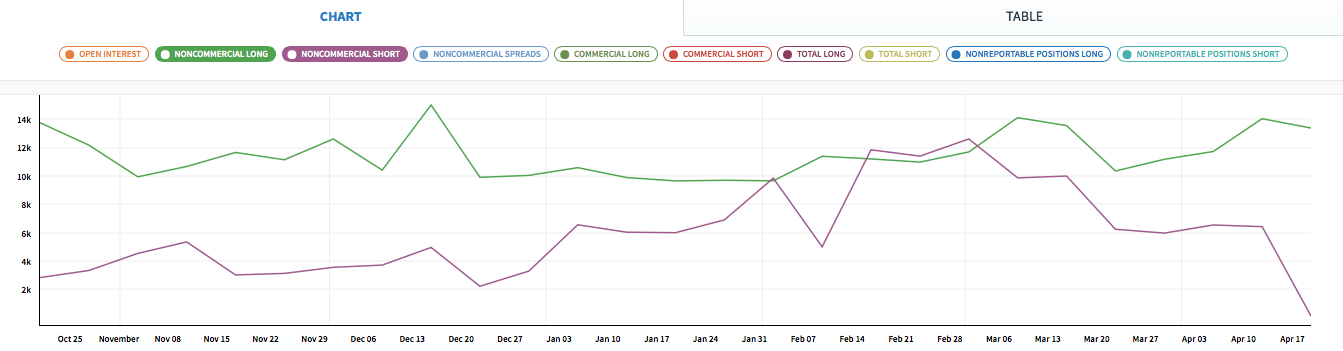
Click chart to enlarge. Chart courtesy of Qandl.
Non commercials are more often on the wrong side of the market than the right side of the market. Currently, non commercials are predominantly long, and increasing. This supports the expectation of a trend change soon.
DOW THEORY
I am choosing to use the S&P500, Dow Industrials, Dow Transportation, Nasdaq and the Russell 2000 index. Major swing lows are noted below. So far the Industrials, Transportation and Russell 2000 have made new major swing lows. None of these indices have made new highs.
I am aware that this approach is extremely conservative. Original Dow Theory has already confirmed a major trend change as both the industrials and transportation indexes have made new major lows.
At this stage, if the S&P500 and Nasdaq also make new major swing lows, then my modified Dow Theory would confirm a major new bear market. At that stage, my only wave count would be the bear wave count.
The lows below are from October 2014. These lows were the last secondary correction within the primary trend which was the bull market from 2009.
These lows must be breached by a daily close below each point.
S&P500: 1,821.61
Nasdaq: 4,117.84
DJIA: 15,855.12 – close below on 25th August 2015.
DJT: 7,700.49 – close below on 24th August 2015.
Russell 2000: 1,343.51 – close below on 25th August 2015.
To the upside, DJIA has made a new major swing high above its prior major high of 3rd November, 2015, at 17,977.85. But DJT has so far failed to confirm because it has not yet made a new major swing high above its prior swing high of 20th November, 2015, at 8,358.20. Dow Theory has therefore not yet confirmed a new bull market. Neither the S&P500, Russell 2000 nor Nasdaq have made new major swing highs.
This analysis is published @ 12:54 a.m. EST on 28th April, 2016.
Both SQQQ and UVXY are sporting 8 week long downward sloping wedges. I like to view it at the hourly level. SQQQ broke out upwards a few days ago. The breakout occured with a gap on the hourly level that has never been filled. Breakaway gap? in addition, there was no throwback to the upper trendline. This indicates strength in the direction of the original breakout which in this case is upwards.
Today’s spike in UVXY brought price up against the upper wedge line. Look for upward breakout. Will a throwback occur. SQQQ as evidence suggests there will not be a throwback especially tomorrow opens with a gap up and go as Verne has suggested as a possibility.
Positioning of trades at a breakout and throwback is a very good strategy. It should be employed often as it is a very low risk trade. However, the inherent weakness is that the throwback doesn’t always occur. This is often the case when you are dealing with third motive waves and third in third etc.
I averaged all my trade layered positions based upon where the SPX was at the time I opened the positions. It averages out to SPX 2077.75. Eight positions with the first being taken on April 4th and the last yesterday. So with the SPX close today at 2076, I am in the money. Well, not quite so fast. My trading vehicle for this trade is TVIX which is nothing more than a highly, highly leveraged derivative or note. It is a no thing. It is based upon volatility as measured by VIX which is not perfect at measuring because it can be distorted in price. I digress.
I may be 1 SPX point ahead but my average entry is 3.95 and today TVIX closed at 3.62 or 33 cents and 8.4% down. TVIX does not perfectly mirror VIX for the same reasons as above and it can be distorted as happened this past week starting Monday. All this is to say that using these highly leveraged volatility instruments has inherent and great risk of moving significantly and faster against a person than is experienced using other instruments.
I do not use TVIX all the time. I use other instruments like UPRO, SPXU, SQQQ and many others like them. A person can even find sector specific notes. But these are also leveraged and have inherent risk. One can trade SPY and others to reduce risk even further. Many people, big deal people, institutions and others make great use of hedging in a variety of very sophisticated ways all to reduce risk. But it is all still risk.
There are other ways to increase leverage like using margin, futures contracts, options, options on futures, options on options etc.
Each person must seriously examine their stomach and reality before taking on risk. Risk reward must also be measured etc. Anyone who utilizes this forum must always be prepared to own up to their acceptance or rejection of the risk level they chose for these markets.
But it all boils down to Kenny Rodgers:
You’ve got to know when to hold em
Know when to fold em
Know when to walk away
Know when to run
I hope these trades work out for you Rodney. Personally I don’t like UVXY or TVIX for anything but the shortest trades because the decay is so substantial. When you buy options on them on top of it, as some people are doing, the premium only adds to the headwinds against you.
I don’t even trade SPY or the leveraged ETFs much–just once in a while when a particularly good opportunity comes along. I find it works better to use Lara’s work to understand where the market spirits are going and then trade the individual equities and targeted ETFs that are moving in that direction faster than most. I also trade against the market, but only in those sectors that are moving in the opposite direction. Some of my trading is with options, so I do get premium decay, but I’m careful with my entry and exit plans and keep them for a minimum of time.
As far as Kenny Rogers–right on!!
Here is what we may have witnessed today with the failed second attempt to conquer another triple top.
Hmm interesting thanks, makes you wonder if they will make another run up on this second attempt to beat the first attempt as they did slightly in the 2000 chart. I see why it’s important to wait for confirmation as some of these moves you could get caught up in a bad way.
Here are few more charts to keep the big picture in mind. The resolution of the pivot battles takes the index closer to a repeat of the price action we saw at the 2000 top.
Just sold UVXY position back down to 40% @ 16. If we take out 2066 tomorrow with conviction then I’ll buy back in with a view to selling out as close to 2039 as possible.
I think we still have the 4th and 5th wave to go in this impulse down.
There’s a very good chance we get a gap and go tomorrow. The kind of buying they did out of overnight futures last night is now looking very much like the last call at closing time…the pop off the new 52 week low today also looking quite bullish. If we see a jump to the upper BB tomorrow I suspect it will stay pinned there for a bit.
Boy I hope so… it seems the last 4 years all the gap & go’s were to the upside.
There are many, many GAP’s below us that need to be filled… all the way down to 1050.
QQQ volume on daily still looks light …
If that is the NASDAQ 100 … Volume will be higher than yesterday.
This bounce is over….!
Volume update… Will be higher than yesterday!
2072.03
Woo hoo!
Looking good. My small first positions on S&P and FTSE nicely positive now.
Happy days.
I have to go out today so will do the analysis early, then update TA later on when I get back.
Working on S&P analysis now… published hopefully just after market close.
Folks, you gotta understand what this market just did in terms of that huge middle finger to the banksters. They spent billions overnight, and it all just went up in smoke. Get ready for they may not be quite done trying. In fact I hope they go back to bidding it up again so some folk can get an even better entry…
Let have 2039 get taken out down to 2014 and then get the bounce back to the underside of 2039.
They are trying to fool them again with this last 5 min bounce.
fourth wave
Lara – you said we were within hours from a break with bias down – Awesome call!!
Realize it’s not convenient for timezone but you chiming in periodically during day is extremely helpful.
Four letters of amazement … UVXY. Of course with stops!
Thanks Lara!
Still need to go Sub 2039
Be really careful with UVXY – it is seriously bad for your wealth.
Most of us here sold it near 60 only a couple of months ago. Needless to say it went below 14 today!
Apologies for stating the obvious if you are a UVXY expert 🙂
I wouldn’t touch UVXY with a barge pole.
I’ll leave it to the experts like Verne.
Way too risky for my liking.
I think Verne likes to live dangerously 🙂
I trade it and have made a ton of money from it, but you have to be incredibly nimble.
If you hesitate for one second about executing stops then it’s not a good beast to mess around with. It’ll take back all your winnings in a heartbeat – and then some!
Nice. Good on ya.
No worries.
I suffer periodically from insomnia so may turn up here at odd hours from time to time…
But now that NZ has ended daylight savings and the US has started, I can be here in my morning / NY afternoon each day.
My summer it’s much harder / earlier for me.
61.8 fib and y = w (main count) @ about 2066.
If this is the ALT bear playing out then we should slice right through that and keep going.
If it hesitates too much around 2066 or looks like it’s impulsing upwards I’ll be seriously lightening my short position and awaiting 2039 price confirmation.
Now that’s what I’m talking ’bout…I hope they keep trying to buy the dip…(dummies!) 🙂
Just took out the overnight Equivalent Low ~2076 (ES 2070.25)…. now 2072.99 for SPX
ES Low now 2066.25
Looks like an impulse wave on 5 min chart
A break of SPX 2075 will satisfy this pivot PIA (pain in the you-know-where!) to my satisfaction. Now, for all those geniuses short UVXY…. 🙂
I am so glad you chose all upper case letters for PIA!!!!!!!
Abdomen? gotta love those red candlesticks
If anybody is interested in the QQQ, we have a confirmed H&S breakdown on the hourly chart.
I picked up some QID calls yesterday after that island reversal and break of support shelf in NDX. Showing a nice pop today so will probably take some off the table…I like to be getting out when most folk are getting in.. 🙂
Nice spot. Notice the breakdown gap at the neckline with the classic return to the neckline now being followed by the plunge. I hope.
New Low for today! Lets see if it accelerates.
Overnight equivalent Low:
ES LOW 2070.25 or the spx equivalent ~ 2076 before 9:30AM
I just looked at TVIX and UVXY. I was not going to even log on to my trading account today to avoid the carnage. But now, maybe I will. It looks like this might be it. I don’t want to get too worked up about it or start my gloating. But if this is the start, I know you and I will be really happy. Yes!
I just looked again at 1 & 5 minutes SPX charts. Even I said, “Oh my word.” Was it ever it doubt.
Sub 2039 and then sub 2014… 2000 & accelerating lower is a must.
Vern,
Your 2086 point is taken out. Now to 2077 then 2070 and Olga should be be happy.
Me, I want 2039 and 2000 to be left behind like carcass on the wagon trail!
2070 is certainly a good start – I’d be much happier with 2039 though 🙂
Sneaky ol market – as usual was trying to throw me off the scent earlier.
No doubt it dislodged a few cubbies..! 🙂
I have a sneaking suspicion that they both will…. 🙂
I am still shaking my head in disbelief at that display yesterday…
QID calls ripping higher, selling half for 40% pop…
Oh yeah! If this is what I think it is we’re just warming up…
Five doji in a row? That’s pretty horrible really. This is painful. A resolution, either way, and then we could get on with trading this market. But this painful small range sideways mess…
When markets do this they invariably break out with a large move.
It’s like the winding up of a spring with potential energy. When the energy is released it can be explosive.
My expectation is down, but there is still an up potential while price is above 2,039.74
Good day Lara,
It is really helpful that you can from time to time give us charts during the day. I do not know if it is possible, but it would be nice to be able to click on them for a larger view. Even so, they are helpful and I can zoom my screen.
The three daily doji in a row are clear representation that there is indecision by and fighting among the bulls and bear.s. Small candles and small daily change demonstrate this. I would expect this after a candle reversal pattern. The bulls lost that fight and cannot recover, a strong sign of weakness on their part. The bears are unsure of how hard they want to push this. A good long dark candlestick today and we will know the bears have taken over control.
Now we can get our full candlestick underneath and not touching the trendline. This is the prelude to tomorrow’s daily candlestick doing the same. First on the hourly then on the daily.
Tops generally roll over. The current top is a classic example.
To fool the most, this top has been dragging on for over a year. In 2001 and 2008 it was more sudden. So to fool, frustrate, and hurt the most, this top has to alternate. The end result will be the same.
I use a Mac so I don’t know how it works for Windows.
I control + click to get a menu, maybe right click on Windows?
Choose “Open Image In New Tab”
No problem and certainly no complaint. I hit control + and the whole screen enlarges.
Just trying our patience, and separating the cubbies from the grizzlies… 🙂
And here’s an update for the alternate hourly.
The current hourly candlestick is the second below the lower edge of the dark blue channel / support line. I think I’ll just call it the support line.
The squeeze should be done now. The support line and the bear market trend line cross over next hour.
No price confirmation yet.
*edit: the yellow line is a copy of the lower edge of the channel from the bear daily alternate.
As soon as you posted this chart, market started trending down. We’re almost at the low’s of the session… Great timing 🙂
LOL
Yeah, I planned it that way 🙂
(and if you believe that, I have a bridge in Auckland to sell you….)
Whatever you’re selling, I’m buying!! 🙂 🙂
Speaking of which, I heard NZ is a favorite destination of all the well-heeled high rollers trying to avoid armageddon.
We try to make it a bit more difficult for ’em in the BVI by hitting ’em with a 10% so-called “Non-Belonger” surcharge on their real estate purchases!
Interesting.
Part of the fuel for our property market bubble here in NZ is foreign money.
There’s a big debate currently in NZ about taxing non resident purchases of property. Apparently we can’t ban it, because TPPA.
I wish I wish we could slap a 10% tax on it. I fear that after the crash much more of our land will be sold to non residents. Particularly our productive farm land, after the dairy commodity boom and bust many of our farmers are facing bankruptcy.
It’s a horrible mess. And I hope it doesn’t end in massive foreign ownership of our land.
But then, even if it does that doesn’t mean it has to stay that way. Plenty of historical examples where that was change. But it wasn’t pretty.
FWIW – when this dam breaks, there will be a lot of very surprised bulls out there.
So if this is the type of data used as a signal for traders, most should be buying the index. Not selling.
To be fair, it is in an up trend and has been since 11th February.
It’s just that it seems to be slowly breaking down…
But not everyone is going to be viewing it that way.
Good morning all.
While I can easily see a small first wave down and another second wave up for the hourly alternate count, I’m struggling to see what could be happening for the main hourly this morning.
So far all I have is a first wave down and a second wave up to start a five wave impulse down for subminuette c.
Charts are better aren’t they, than a bunch of words. Here’s an update for the main hourly.
“Always assume the trend remains the same until proven otherwise”.
Is the dam finally breaking? You’ve gotta hand it to these banksters who are not going gently into that good night. If they are burning this kind of capital go go absolutely nowhere, what rabbits are they going to pull out of their dilapidated hats when this P3 finally bites them in the gluteus maximus?
SPX 2075 today means I can take my eyes of these snakes… for a minute…no more…! 🙂
Kimble’s chart for a potential triple top is neater than the one I posted yesterday but same idea….
Three candles on the 15 minute chart hit exactly 2099.90 and stalled yesterday. So far today we have hit 2099.30 and stalled….
It is starting to look like we completed sub-min C of minuette Y of minute two this morning. We really should now see a strong move up for minute three if that is indeed the case…
That would mean Y was seriously truncated – possible but less probable than other counts atm imho. It should have reached 2077, or at least gone below yesterdays 2082 swing low.
I think its more probable that Y hasn’t yet started if that count is correct. We haven’t yet took out 2100 so yesterdays near term ALT bear is still valid – if it goes above 2100 I reckon we will still see a drop to below or very near 2077 in the near future.
BTW – I’m basing that view on structure and RSI (5 min).
Lower trendline of todays move has been taken out – now got my eye on 2095.29 and then 2091.28.
Retrace today is very deep and suspicious imho – that’s got me concerned for the immediate count. If we take out 2095.29 now then I’ll relax a bit more.
Lara indicated the convergence of support & resistance line in hour three of today. She said maybe the resolution break will come at that time. Let’s see. Right now, I am thinking the wave 2 correction from 2077 is not completed. the other day I proposed 2102 or there about for he end.
Could it be a diagonal of some sort?
Need to leave for a few hours or more. Catch you all later.
That means we could be looking at a very rare triple zig-zag…
Major RSI divergence on 5min chart from the (approx) 2096.82 high on 26th.
Given that and this whole structure from 2077 looking very corrective, we should dive lower than 2077 sometime soon imho, even if we go above 2100 (or even 2111!!) beforehand.
That is unless this move from 2077 can be counted as a motive wave as Verne pointed out EWI see it – but I can’t see it.
I know, I simply can’t see it either! I have no idea how they managed that one.
We need to take out this morning’s lows at 2086.09 and do it fairly soon for the bearish count to maintain viability imo…
Yet another new week low for UVXY…
I have the lows at:
SPX 2086.09 after 9:30AM
ES 2070.25 or the spx equivalent ~ 2076 before 9:30AM
Oh… I see you corrected it.
Yep. For some reason I get different readings from my investing.com data feed 1 min chart and usually end up having to correct the number when I check other data streams…
Interesting g how the “weekly” charts still look very good from a stochastic metric.
The battle around the pivots continue. This is an indication that upward movement could continue in the short term. A third wave impulse down will decisively take out these pivots and the fact that this has not happened is a cause for caution with regard to the short term direction of the market. The longer the uncertainty around the pivots remains, the greater the likelihood that we are seeing consolidation with a subsequent move to the upside.
Yep – I agree 100%
Hasn’t been taken out to the upside either….
It’s sitting right on a narrow fence.
Really weird thought …. Most hedge funds and traders can see what is happening here . It looks very obvious to everyone . A lot of technical analysis is point to topping . The most obvious answer is usually the wrong answer . I think a lot of any money that can get out , has gotten out .
So …. Nothing but buyers left for a bit .
When all convinced mkt will not correct . People pile back in for some kind of melt up probably to Lara ‘ s 2116 – 2134 level .
I think most all mutual funds have to stay invested . The most cash they can go is say 5 % – so they have to go from sector to sector . They continue to have to buy / rotate sectors .
MF’s will stay invested… until retail investors start to redeem their shares…. but that is never at a top… usually near the bottom or an intermediate bottom.
The commercials are short, yes.
But non commercials are long. And there is plenty of talk of the bull market being back and plenty of analysis which expects new highs out there.
There are also plenty of hedge funds and traders who don’t use technical analysis, they deride it, and focus only on fundamental analysis. Yeah, weird, but true.
Approx 2099.94 and 2091.28 lines in the sand for the short term Bear ALT atm
Maybe one more small pop higher for a zig zag from this mornings low and the end of W2?? If so then price should stay above 2094.43 prior to one more push higher.
That might be it – 76.4 fib – zig zag. Awaiting a break of the trendline from todays low to initially confirm. Price confirmation at about 2091.28, invalidation at yesterdays high.
@2097 c = 0.618*a – higher than that starts to get suspicious. 2min RSI not buying it atm
Sorry about the duplicate post…an edit gone awry… 🙁
The banksters and bullocks are aggressively buying the market. We can expect a continuation of these deep second waves as the perma-bulls and market manipulators attempt to keep the party revved up with a frenetic buy the dip schema. This will no doubt continue until downside momentum takes hold…gap down from this morning already filled…amazing!
So it’s not a gap & go. It’s better that the gaps are filled as we will not revisit this area again.
Yep! This kind of mania very typical of major tops…
This ‘mania’ is doing my head in!
My patience (or lack thereof) isn’t cut out for this kind of aggressive buying on every tiny dip.
Let’s do one already!! 🙂
Considering where futures were last night, there is a phenomenal amount of capital being dumped into the market…the churn has been going on for some time so I suspect we must be awfully close so some kind of resolution….
exactly, this does not look like a third of a third wave, but then we have weird forces trying to buck the market.
I don’t know if we are going up in a third or down in a third.
No Way up in a 3rd… It’s good that people believe that though.
The house of cards world wide is tumbling down from the core. It will become apparent soon. Atm participants are blind!
I agree. We may have some more upside potential. NDX violated its lower BB yesterday so we may need a bit of a relief rally there before downside momentum picks up…
The banksters and bullocks are aggressively buying the markets in a desperate attempt to keep the party revved up. We will in all likelihood continue to see sharp impulses down completing intra-day followed by frantic knee-jerk buying of the dip by the perma-bulls and market manipulators. We’ll just have to get used to it as deep drawn-out second wave corrections will continue until downward momentum kicks in….gap down from this morning quickly filled….
It could continue until the middle of P3.
IF my wave count is correct that is.
The middle of a third wave is when the balance shifts from one side to the other.
Lots of talking heads opining about the BOJ decision and wondering if it they stood pat because they wanted to, or because they are out of bullets.
All the talking heads agree they are taking a “wait and see” attitude but that they are not out of bullets. Well, let’s just examine that shall we?
What happened the last time they attempted to devalue their currency with an announcement of more stimulus and negative rates?
Contrary to all expectations, the yen took off like a bat out of hell.
What happened when they decided NOT to announce any more negative rates or additional stimulus?
Yep…you got it- the yen took off like a bat out of hell.
They are royally S_ _ _wed!!
The market turns somewhat sharply lower and VIX is down over 1%. But UVXY and TVIX are up 1.5%. This market top is one for the ages to be studied. Again, I attribute it all to the Market Makers / Floor Traders manipulating these instruments short term so they can get positioned for a change in trend from up to down.
The VIX is up +.24 to 14.01
Some genius or geniuses ( it is an open secret that market makers often collude to ambush retail investors, ganging up to shake them out of easy to determine stops) sold short several hundred thousand shares of UVXY yesterday. I just barely missed getting filled on my 16 strike stink bids of 0.50 as they came down to 0.53 on the spike down and “mysteriously” got stuck there… 🙂
I can’t believe how much UVXY eroded. Glad I decided to stay out… but if we get P3 I may regret it. I just have too much at risk atm playing for P3.
So far, from yesterday’s high of 2100 we have dropped 18 points. This is the largest drop since the high at 2111. This is significant and supports the idea this is a third wave within a larger pattern.
The largest correction in this bear market rally from 1810 to 2111 was around 54 SPX points in a three day swing (Feb 22-24). What I’d like to see is a move of more than 54 SPX points in less time. If we see that, it is often a clue the market has turned.
+0.50 1st QTR. GDP and no adjustment to 4th QTR. GDP
No way to spin that as Okay or Good without spewing complete LIE’s!
BTW: A very mild winter in the USA so you can’t use that excuse! In fact construction pulled into Feb & March due to the mild winter. SO it should have been negative and that will NOT add a bump to Q2 as it usually does because it was pulled forward.
That 0.5 number is a complete fabrication. The economy is likely already in recession. Those lagging indicators are useless, especially coming out of an administration led my a master of mendacity…
I agree… but that’s what used atm. I was just pointing out how they can’t explain away the .50 with BS anymore. The BS has clearly been exposed.
Would much rather see a spike high and then drop hard. Although won’t complain if it breaks through 2039 today …
there’s no one here to talk about the crashing markets
A crash is 10%, 15% or more in one day. Less than 1% is no way near a crash.
Just want to make sure it’s real and that it accelerates down in the cash market.
When sub 2039 only then will it get my attention. Otherwise its just a tease.
looks like an impulsive start down in any case – no doubt we’ll go back up though!
No.1 🙂
Great. How did the marathon go? I hope you enjoyed it.