
The short term target on yesterday’s hourly chart was 2,103. This target was met.
The high for the session was 2,104.05, just 1.05 points above the target.
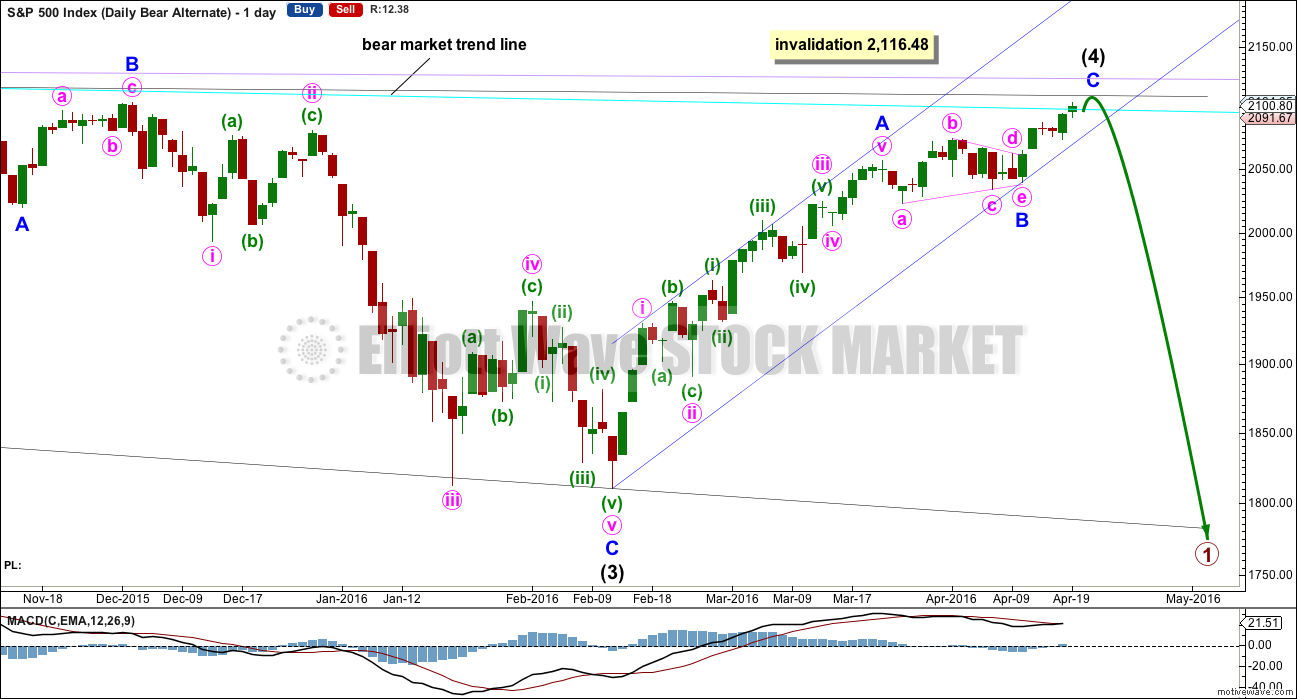
Summary: This is still a bear market rally until proven otherwise. A final fifth wave up is underway with a target just above 2,116.48. It may end this Thursday. The upwards trend is very weak. In the short term, tomorrow may see a fourth wave complete sideways and Thursday may be followed by the final upwards wave for the fifth wave.
To see last published monthly charts click here.
To see how each of the bull and bear wave counts fit within a larger time frame see the Grand Supercycle Analysis.
To see detail of the bull market from 2009 to the all time high on weekly charts, click here.
New updates to this analysis are in bold.
BEAR ELLIOTT WAVE COUNT
WEEKLY CHART
Click chart to enlarge.
This bear wave count fits better than the bull with the even larger picture, super cycle analysis found here. It is also well supported by regular technical analysis at the monthly chart level.
Importantly, there is no lower invalidation point for this wave count. That means there is no lower limit to this bear market.
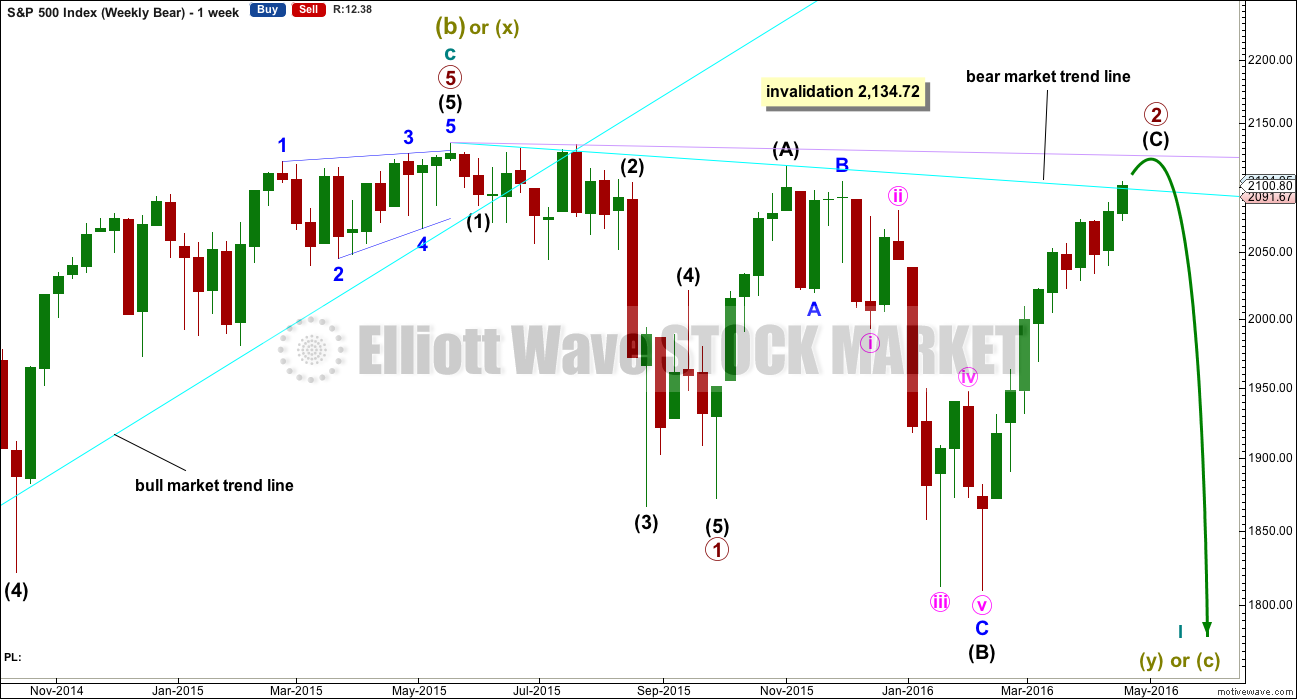
Primary wave 1 may be complete and may have lasted 19 weeks, two short of a Fibonacci 21. So far primary wave 2 has begun its 28th week. It looks unlikely to continue for another 6 weeks to total a Fibonacci 34, so it may end either this week or possibly early next week. This would still give reasonable proportion between primary waves 1 and 2. Corrections (particularly more time consuming flat corrections) do have a tendency to be longer lasting than impulses.
Primary wave 2 may be unfolding as an expanded or running flat. Within primary wave 2, intermediate wave (A) was a deep zigzag (which will also subdivide as a double zigzag). Intermediate wave (B) fits perfectly as a zigzag and is a 1.21 length of intermediate wave (A). This is within the normal range for a B wave of a flat of 1 to 1.38.
Intermediate wave (C) is likely to make at least a slight new high above the end of intermediate wave (A) at 2,116.48 to avoid a truncation and a very rare running flat. However, price may find very strong resistance at the final bear market trend line. This line may hold price down and it may not be able to avoid a truncation. A rare running flat may occur before a very strong third wave down.
If price moves above 2,116.48, then the new alternate bear wave count would be invalidated. At that stage, if there is no new alternate for the bear, then this would be the only bear wave count.
Primary wave 2 may not move beyond the start of primary wave 1 above 2,134.72.
DAILY CHART
Click chart to enlarge.
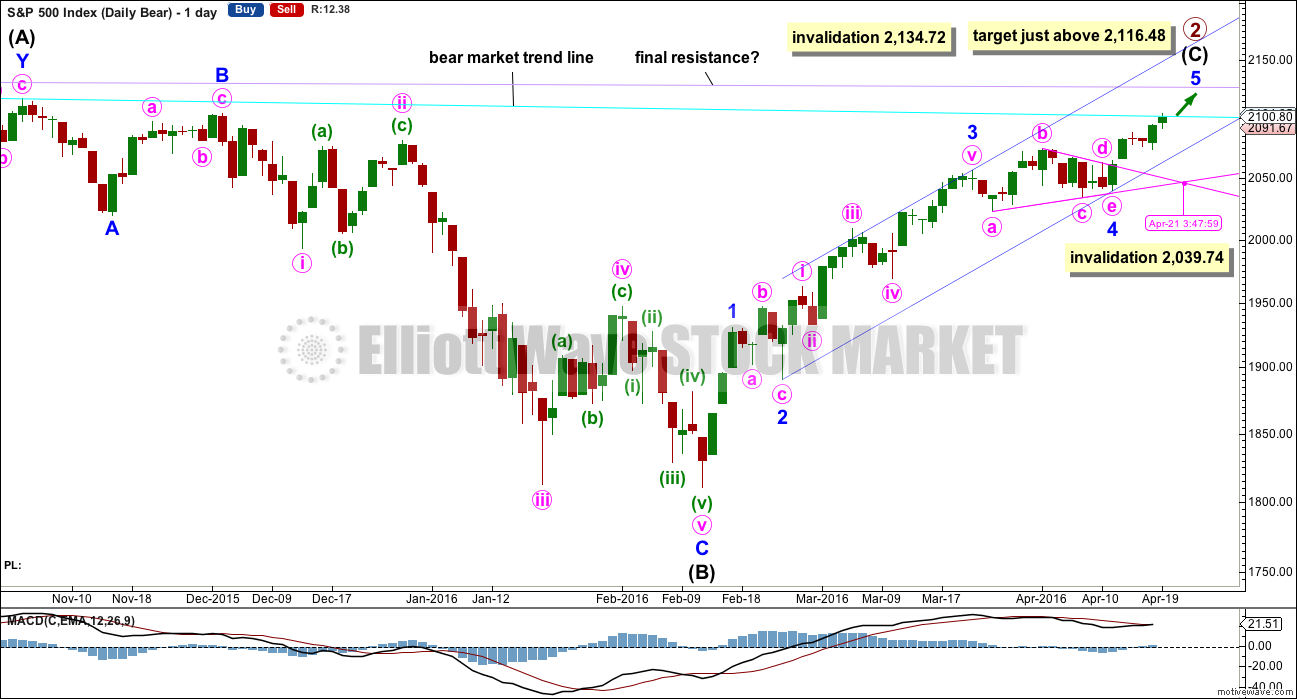
Intermediate wave (A) fits as a single or double zigzag.
Intermediate wave (B) fits perfectly as a zigzag. There is no Fibonacci ratio between minor waves A and C.
Intermediate wave (C) must subdivide as a five wave structure. It is unfolding as an impulse.
Intermediate wave (C) does not have to move above the end of intermediate wave (A) at 2,116.48, but it is likely to do so to avoid a truncation. Price today is reasonably close to 2,116.48; if intermediate wave (C) ends here, it would be truncated by 12.43 points. A truncation of this size is still large, but not too large to be considered. The probability is still lower than the probability of price continuing higher.
The next wave down for this wave count would be a strong third wave at primary wave degree.
Minor wave 4 is a running contracting triangle. Extend the triangle trend lines out. The point in time at which they cross over sometimes sees a trend change; sometimes this is where the fifth wave to follow a fourth wave triangle ends. The point in time at which the triangle trend lines cross over is 21st April, this Thursday. This may be when primary wave 2 ends. This does not always work, but it works often enough to look out for it.
The target is for intermediate wave (C) to end just above the end of intermediate wave (A) at 2,116.48, so that a truncation is avoided.
Redraw the channel about the impulse of intermediate wave (C) using Elliott’s second technique: draw the first trend line from the ends of the second to fourth waves at minor degree, then place a parallel copy on the end of minor wave 3. Minor wave 5 may end midway within the channel. When this channel is breached by downwards movement, that will be the earliest indication of a possible end to primary wave 2.
Because expanded flats do not fit nicely within trend channels, a channel about their C waves may be used to indicate when the expanded flat is over. After a breach of the lower edge of the channel, if price then exhibits a typical throwback to the trend line, then it may offer a perfect opportunity to join primary wave 3 down. This does not always happen, so if it does in this case take the opportunity.
Within minor wave 5 no second wave correction may move beyond the start of its first wave below 2,039.74.
So far the structure of minor wave 5 still does not look like a completed five. More upwards movement is expected until it looks more typical on the hourly or daily chart. Along the way up, price is finding some resistance about the cyan bear market trend line. This looks like where minute wave iv will unfold. Tomorrow may produce a small doji or red candlestick, so that minute iv shows on the daily chart. Because the corresponding correction of minute ii shows on the daily chart, that would give minor wave 5 a clear five wave look to it.
Price may find final resistance and end upwards movement when it comes to touch the lilac trend line.
HOURLY CHART
Click chart to enlarge.
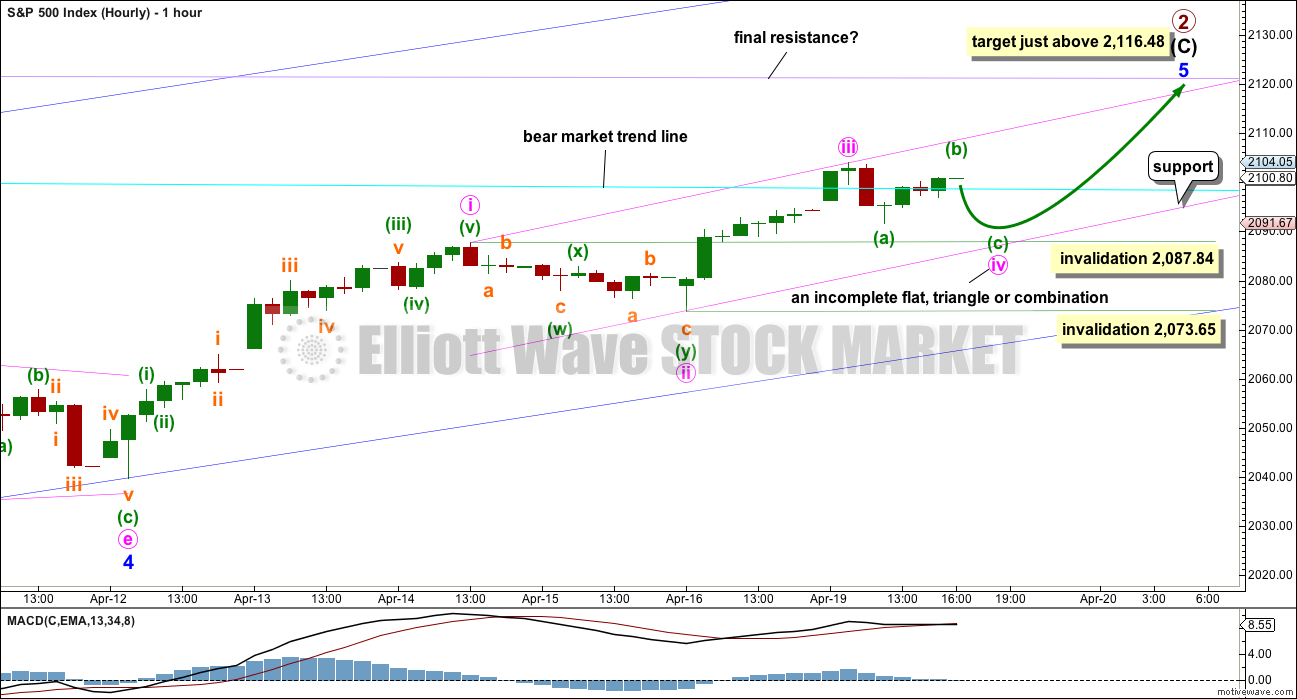
The structure of minor wave 5 is still incomplete. So far it looks like a three, with the fourth and fifth waves yet to complete.
Minute wave ii lasted 12 hours and was a shallow 0.30 double zigzag. Minute wave iv may exhibit alternation as a flat, combination or triangle. It may be more shallow than minute wave ii. Minute wave iv may not move into minute wave i price territory below 2,087.84.
If minute wave iv is a flat correction, then within it minuette wave (b) must move higher so that it reaches a minimum 0.9 length of minuette wave (a) at 2,101.93. The normal length for a B wave within a flat is 1 to 1.38 the length of the A wave. This gives a normal range for minuette wave (b) between 2,104.05 to 2,107.87. A new high does not mean minute wave iv is over and would more likely to be a continuation of minute wave iv.
If minute wave iv is a triangle, then there is no minimum nor maximum requirement for minuette wave (b) within it. Minuette wave (b) may make a new high above the start of minuette wave (a) at 2,104.05 as in a running triangle. Minuette wave (b) of a triangle must be a corrective structure, most likely a zigzag.
If minute wave iv is a combination, then the first structure in the double combination may be a complete zigzag labelled minuette wave (w) which may be over at the low labelled minuette wave (a). The double would be joined by a three in the opposite direction labelled minuette wave (x). X waves within combinations have no minimum nor maximum length and may move beyond the start of the first structure in the double. The second structure may be either a flat or triangle for minuette wave (y) to move sideways and end about the same level as minuette wave (w) at 2,091.67.
Flats, triangles and combinations are all sideways structures. All three options expect overall sideways movement for several more hours. This would see minute wave iv in better proportion to minute wave ii, and it expects to see alternation in structure.
If price moves below 2,087.84, then it may not be minute wave iv as it would be back in first wave price territory. If this happens tomorrow, then the most likely scenario would be that minute wave iii is incomplete. The degree of labelling within minute wave iii would be moved down one degree, so only minuette wave (i) upwards would be complete. A second wave correction would then be expected to be unfolding which may not move beyond the start of the fist wave below 2,073.65.
Only a new low below 2,073.65 tomorrow would indicate a possible end to primary wave 2 at this stage.
Draw a channel about this upwards movement using Elliott’s technique: draw the first trend line from the ends of minute waves i to iii, then place a parallel copy on the end of minute wave ii. If sideways movement continues tomorrow as expected, then look for minute wave iv to find support at the lower edge of this pink channel.
When the end of minute wave iv is known, then a final limit for minute wave v can be calculated. Minute wave iii is shorter than minute wave i; it is just 0.67 points longer than 0.618 the length of minute wave i. Because a third wave may not be the shortest actionary wave, this will place a limit on minute wave v of no longer than equality with minute wave iii. This limit is likely to be about 2,122.
ALTERNATE WEEKLY CHART
Click chart to enlarge.
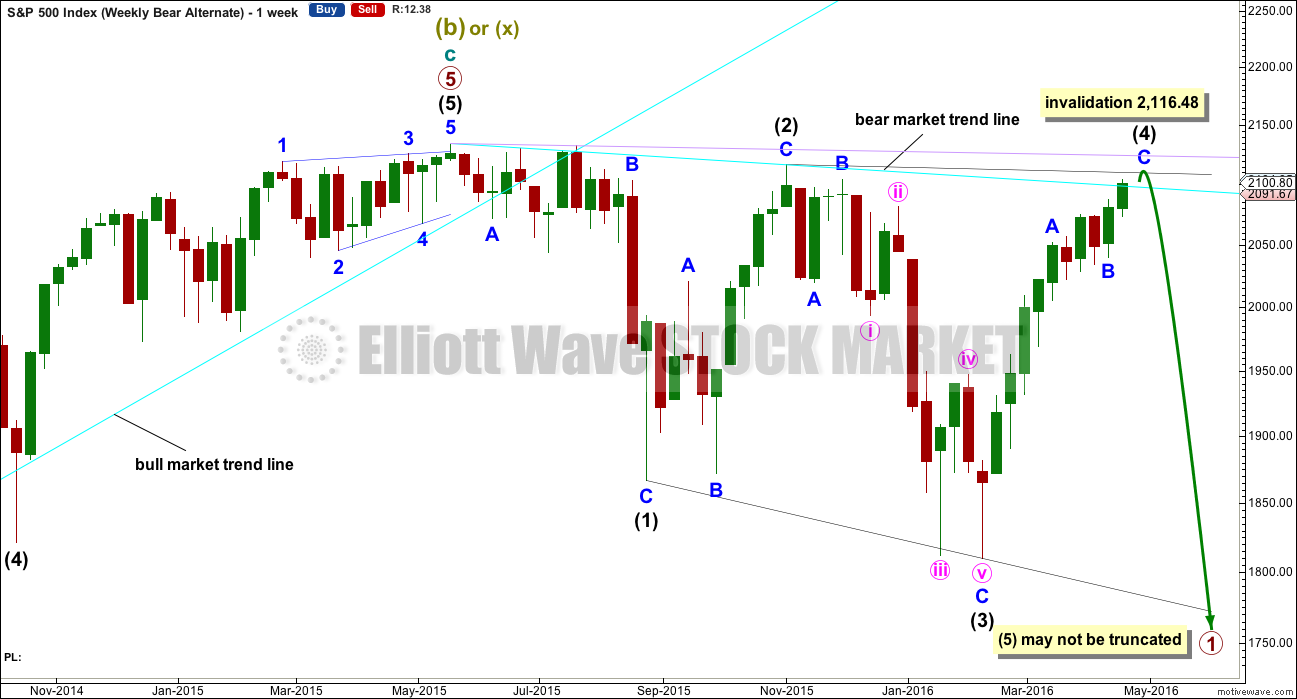
Primary wave 1 may subdivide as one of two possible structures. The main bear count sees it as a complete impulse. This alternate sees it as an incomplete leading diagonal.
The diagonal must be expanding because intermediate wave (3) is longer than intermediate wave (1). Leading expanding diagonals are not common structures, so that reduces the probability of this wave count to an alternate.
Intermediate wave (4) may continue higher now and may find resistance at the bear market trend line.
ALTERNATE DAILY CHART
Click chart to enlarge.
Within a leading diagonal, subwaves 2 and 4 must subdivide as zigzags. Subwaves 1, 3 and 5 are most commonly zigzags but may also sometimes appear to be impulses.
Intermediate wave (3) down fits best as a zigzag.
In a diagonal the fourth wave must overlap first wave price territory. The rule for the end of a fourth wave is it may not move beyond the end of the second wave.
Expanding diagonals are not very common. Leading expanding diagonals are less common.
Intermediate wave (4) must be longer than intermediate wave (2), so it must end above 2,059.57. This minimum has been met. The trend lines diverge.
The triangle is seen as minor wave B. Intermediate wave (4) now has a clearer three wave look to it.
The target at 2,098 has been passed and the structure of minor wave C is still incomplete. It must subdivide as a five wave structure. In the short term, the structure on the hourly chart for this upwards movement is the same for both bear wave counts: a fourth and final fifth wave are required to complete the impulse.
Leading diagonals may not have truncated fifth waves. Intermediate wave (5) would most likely be a zigzag, must end below 1,810.10, and must be longer in length than intermediate wave (3) which was 306.38 points.
BULL ELLIOTT WAVE COUNT
WEEKLY CHART
Click chart to enlarge.
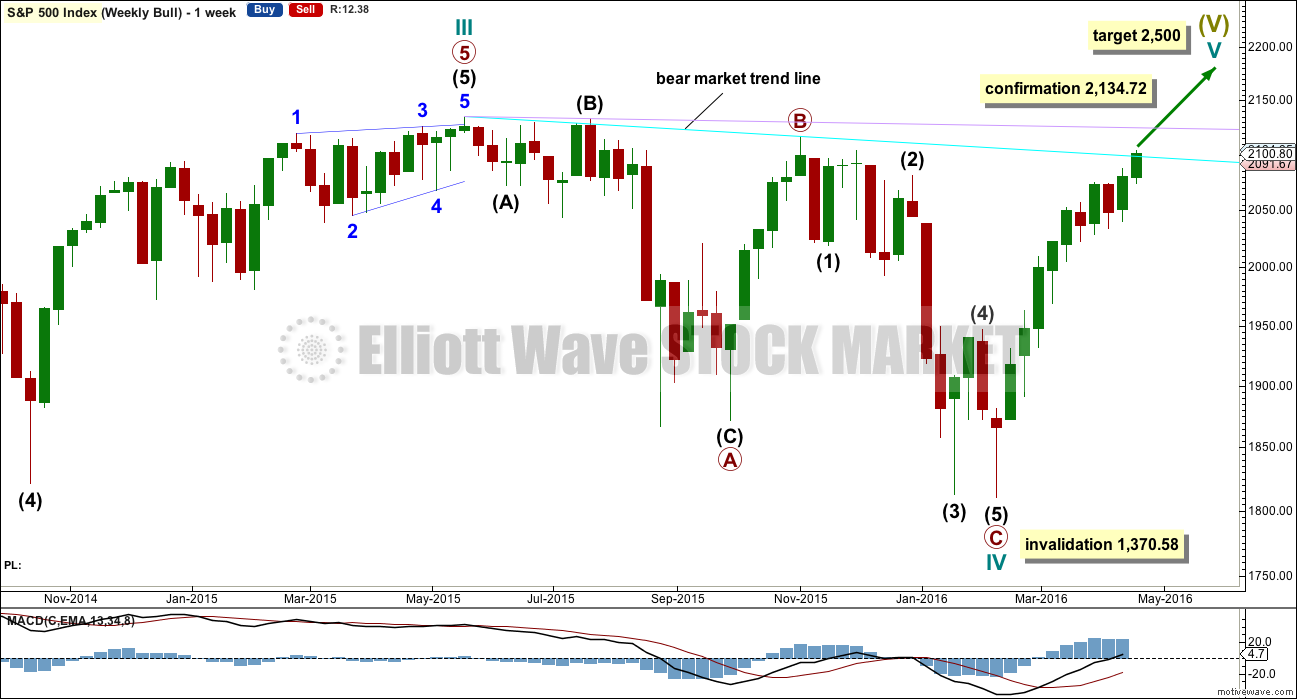
Cycle wave II was a shallow 0.41 zigzag lasting three months. Cycle wave IV may be a complete shallow 0.19 regular flat correction, exhibiting some alternation with cycle wave II.
At 2,500 cycle wave V would reach equality in length with cycle wave I.
Price remains below the final bear market trend line. This line is drawn from the all time high at 2,134.72 to the swing high labelled primary wave B at 2,116.48 on November 2015. This line is drawn using the approach outlined by Magee in the classic “Technical Analysis of Stock Trends”. To use it correctly we should assume that a bear market remains intact until this line is breached by a close of 3% or more of market value. In practice, that price point would be a new all time high which would invalidate any bear wave count.
This wave count requires price confirmation with a new all time high above 2,134.72.
While price has not made a new high, while it remains below the final bear market trend line and while technical indicators point to weakness in upwards movement, this very bullish wave count comes with a strong caveat. I still do not have confidence in it. There is also some bearish divergence today between price and MACD at the daily chart level, indicating further weakness in this trend.
DAILY CHART
Click chart to enlarge.
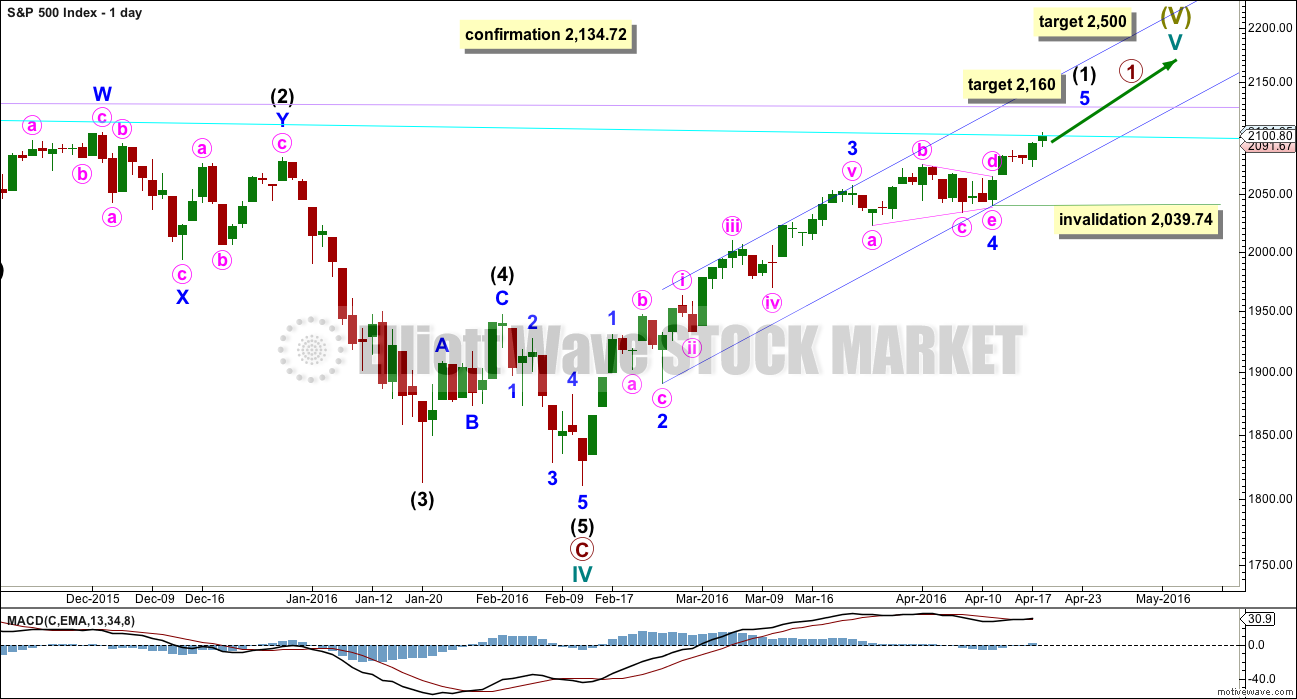
Intermediate wave (2) is seen as an atypical double zigzag. It is atypical in that it moves sideways. Double zigzags should have a clear slope against the prior trend to have the right look. Within a double zigzag, the second zigzag exists to deepen the correction when the first zigzag does not move price deep enough. Not only does this second zigzag not deepen the correction, it fails to move at all beyond the end of the first zigzag. This structure technically meets rules, but it looks completely wrong. This gives the wave count a low probability.
If the bull market has resumed, it must begin with a five wave structure upwards at the daily and weekly chart level. So far that is incomplete.
At 2,160 minor wave 5 would reach equality in length with minor wave 1.
Within minor wave 5, no second wave correction may move beyond the start of its first wave below 2,039.74.
When minor wave 5 is complete, then the entire structure for intermediate wave (1) would be complete. A second wave correction for intermediate wave (2) would then be expected to move price substantially lower; second waves are most often deep, particularly the first second wave of a new trend as this one would be.
And so both bull and bear wave counts see an impulse almost complete upwards, which should be followed by some downwards movement. If the bear wave count is wrong and this bull wave count is right, then any shorts entered would have an opportunity to exit at break even or maybe even a small profit on intermediate wave (2) down.
This wave count absolutely requires a new high above 2,134.72 for confirmation. This would be the only wave count in the unlikely event of a new all time high. All bear wave counts would be fully and finally invalidated.
TECHNICAL ANALYSIS
DAILY CHART
Click chart to enlarge. Chart courtesy of StockCharts.com.
Volume data on StockCharts is different to that given from NYSE, the home of this index. Comments on volume will be based on NYSE volume data when it differs from StockCharts.
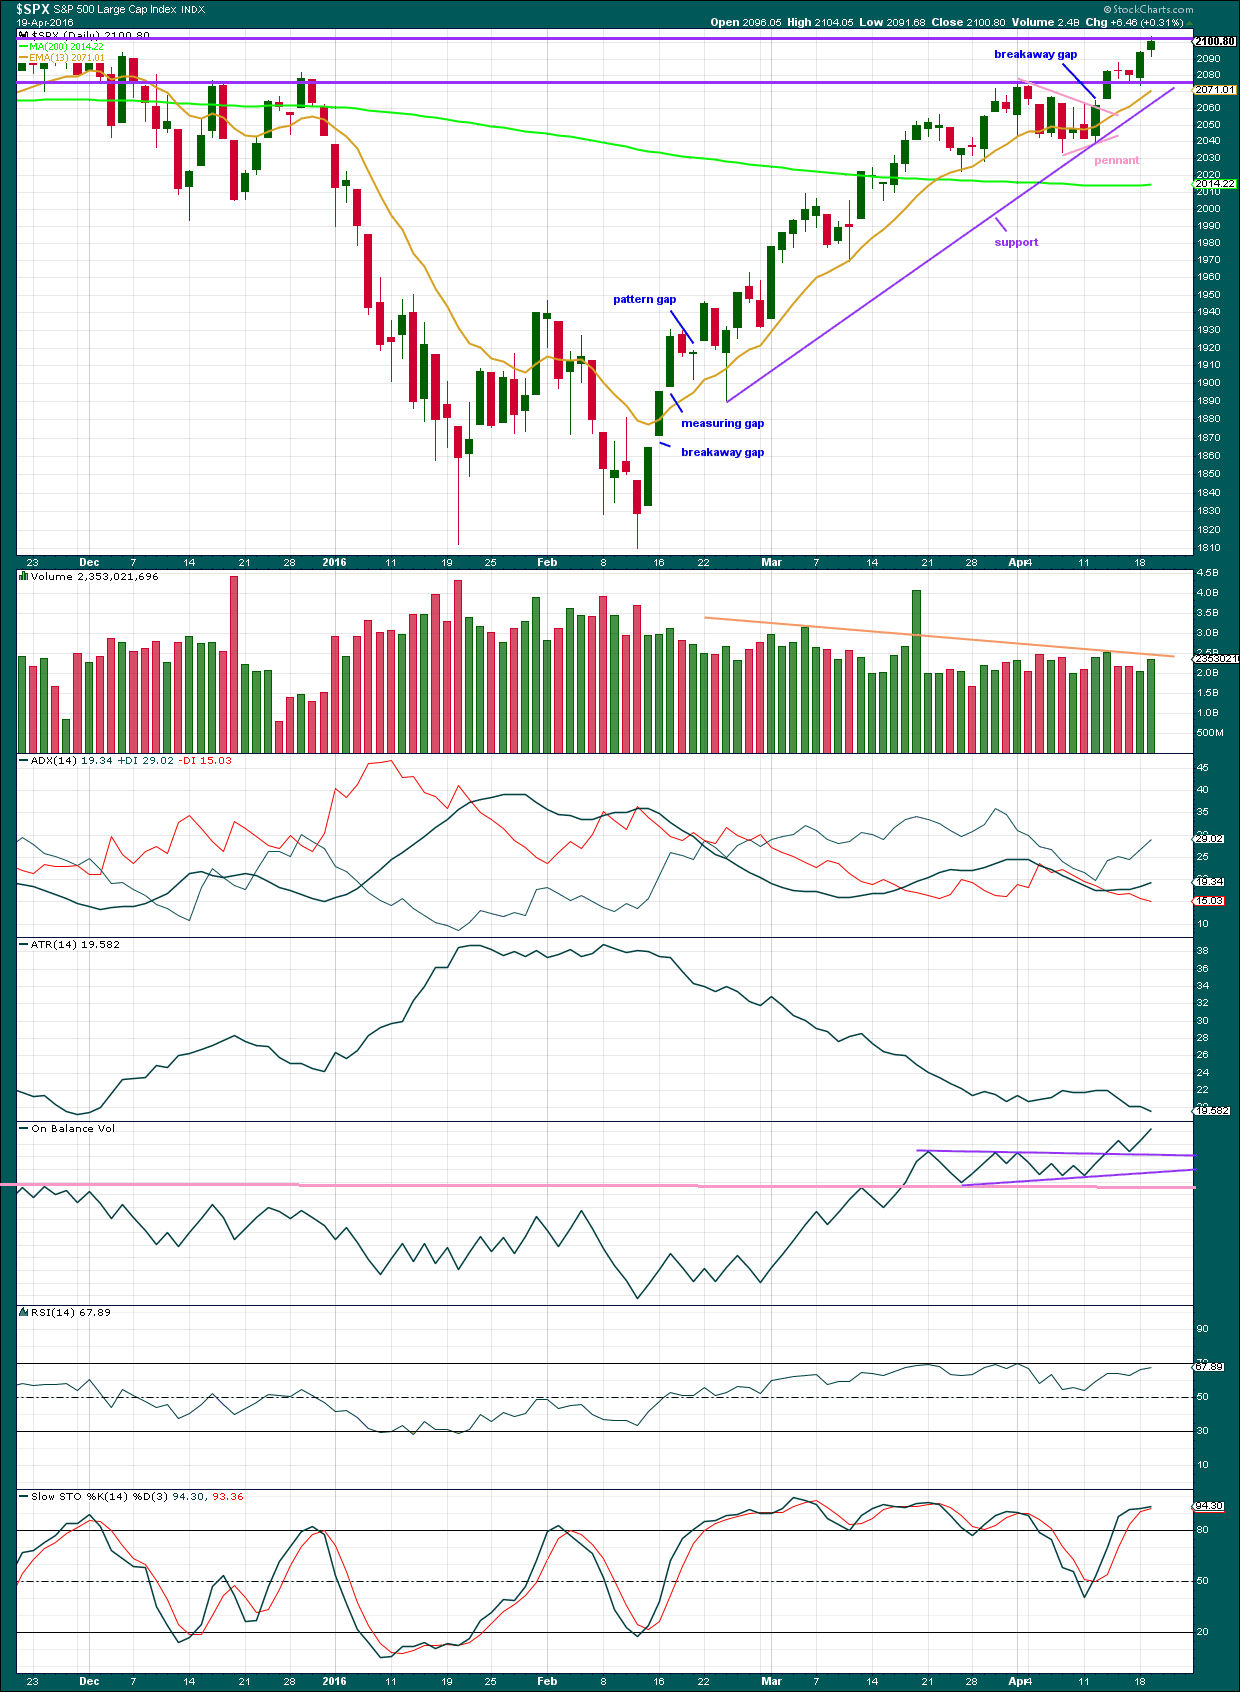
Price has been trending upwards for 46 days. The 13 day moving average is mostly showing where downwards corrections are finding support. It looks like a small pennant pattern has completed and is followed by an upwards breakout with a gap and an increase in volume. The trend has resumed after a few days of consolidation.
The gap has not been closed within a few days, so now it looks like a breakaway gap from the small pennant pattern.
Price found resistance and then support at the horizontal trend line about 2,080 and has bounced up from there. Price today is finding some resistance about the round number of 2,100, to close almost right at this point.
Volume for Tuesday shows some increase; there was support for upwards movement of Tuesday. This supports the Elliott wave counts which see this upwards day as the end of a third wave. Third waves should show some increase in volume and / or momentum. Also, they should show some strength.
As price moves upwards, it comes still overall with declining volume. The trend is weak. It is not supported by volume, so is unsustainable.
ADX is rising indicating the upwards trend has returned. ATR no longer supports ADX. ATR is declining.
ATR declined for most of this upwards trend. This is not normal for a trend and it indicates weakness.
On Balance Volume is giving a clear bullish signal, albeit a rather weak one. The clear break above the upper purple trend line supports the Elliott wave count short term in expecting more upwards movement. The signal is weak because the line is short held and only tested twice. However, it is close to horizontal, so it has some technical significance. OBV turned lower to test the upper purple line and has moved away, so the strength of that line is now reinforced.
OBV needs to break below the pink line for OBV to give a strong bearish signal, but before that happens breaks below the purple lines would provide weak bearish signals.
RSI has not managed to reach overbought during this trend. Price made a new high today within this current trend yet RSI has still not made a corresponding new high. There is now divergence between price and RSI indicating weakness in price.
Stochastics also shows divergence with price. This also is indicating price is weak.
INVERTED VIX DAILY CHART
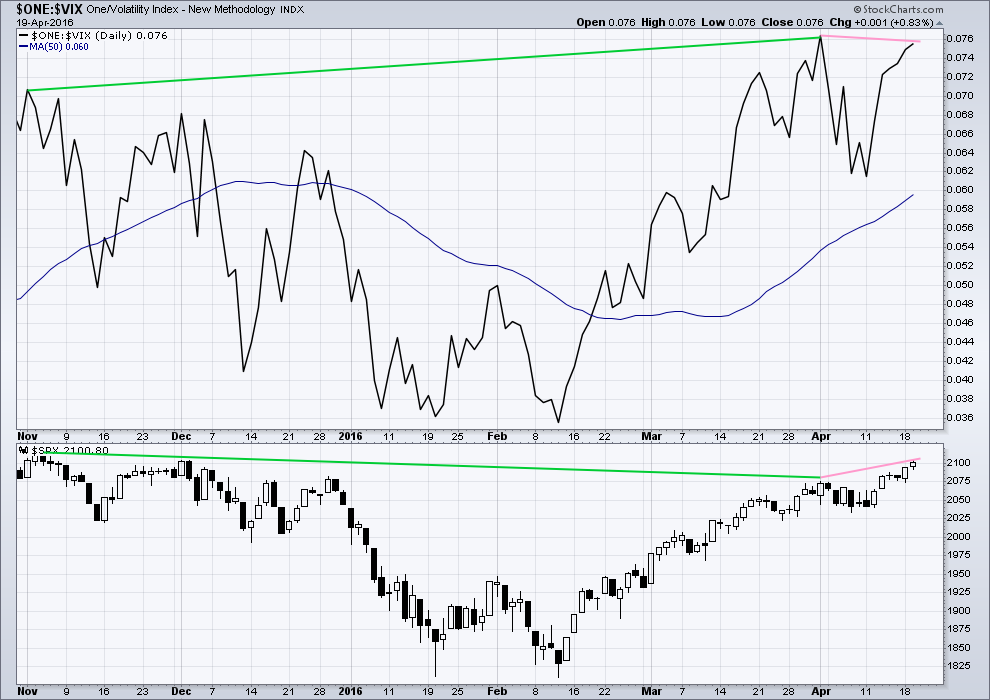
Click chart to enlarge. Chart courtesy of StockCharts.com.
Volatility declines as inverted VIX climbs. This is normal for an upwards trend.
What is not normal here is the divergence over a reasonable time period between price and inverted VIX (green lines). The decline in volatility is not translating to a corresponding increase in price. Price is weak. This divergence is bearish.
Price made a new short term high, but VIX has failed to make a corresponding high (pink lines). This is regular bearish divergence. It indicates further weakness in the trend.
BULLISH PERCENT DAILY CHART
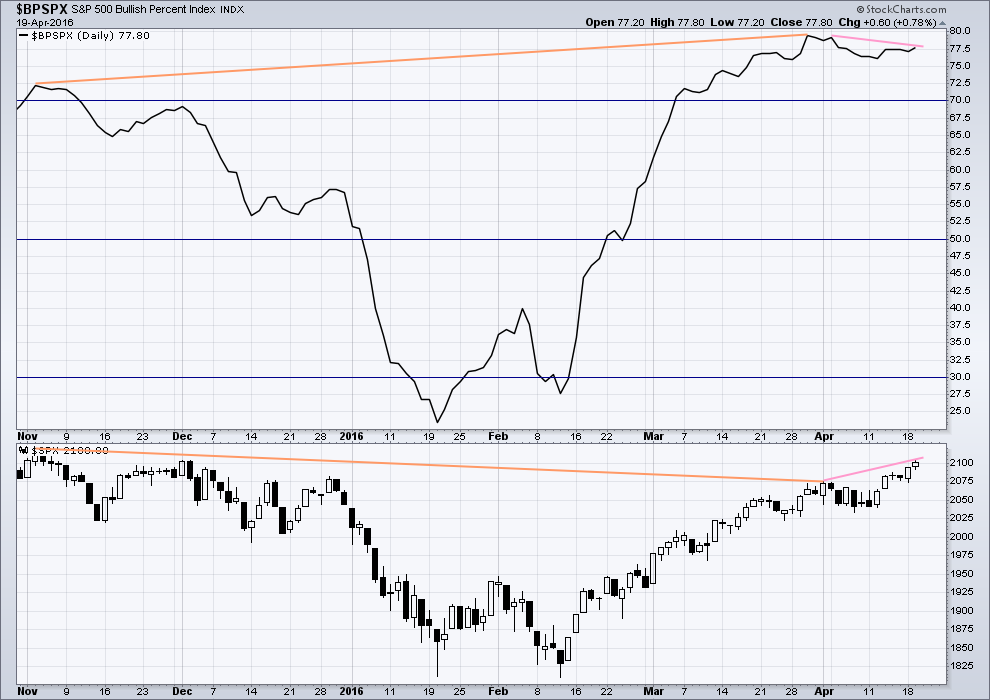
Click chart to enlarge. Chart courtesy of StockCharts.com.
With this indicator measuring the percentage of bullish equities within the index, it is a measurement of breadth and not sentiment as the name suggests.
There is strong hidden bearish divergence between price and the Bullish Percent Index (orange lines). The increase in the percentage of bullish equities is more substantial than the last high in price. As bullish percent increases, it is not translating to a corresponding rise in price. Price is weak.
As price made a new short term high today, BP did not (pink lines). This is regular bearish divergence. It indicates underlying weakness to the upwards trend.
ADVANCE DECLINE LINE
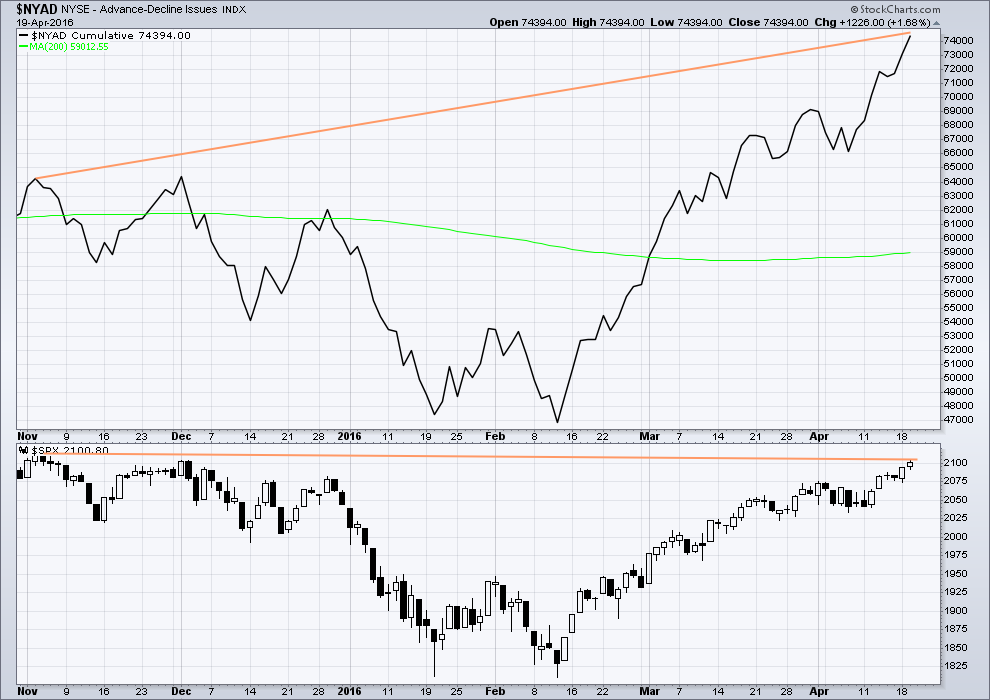
Click chart to enlarge. Chart courtesy of StockCharts.com.
With the AD line increasing, this indicates the number of advancing stocks exceeds the number of declining stocks. This indicates that there is breadth to this upwards movement.
From November 2015 to now, the AD line is making new highs while price has so far failed to make a corresponding new high. This indicates weakness in price; the increase in market breadth is unable to be translated to increase in price.
It remains to be seen if price can make new highs beyond the prior highs of 3rd November, 2015. If price can manage to do that, then this hidden bearish divergence will no longer be correct, but the fact that it is so strong at this stage is significant. The AD line will be watched daily to see if this bearish divergence continues or disappears.
The 200 day moving average for the AD line is now increasing. This alone is not enough to indicate a new bull market. During November 2015 the 200 day MA for the AD line turned upwards and yet price still made subsequent new lows.
COMMITMENT OF TRADERS (COT)
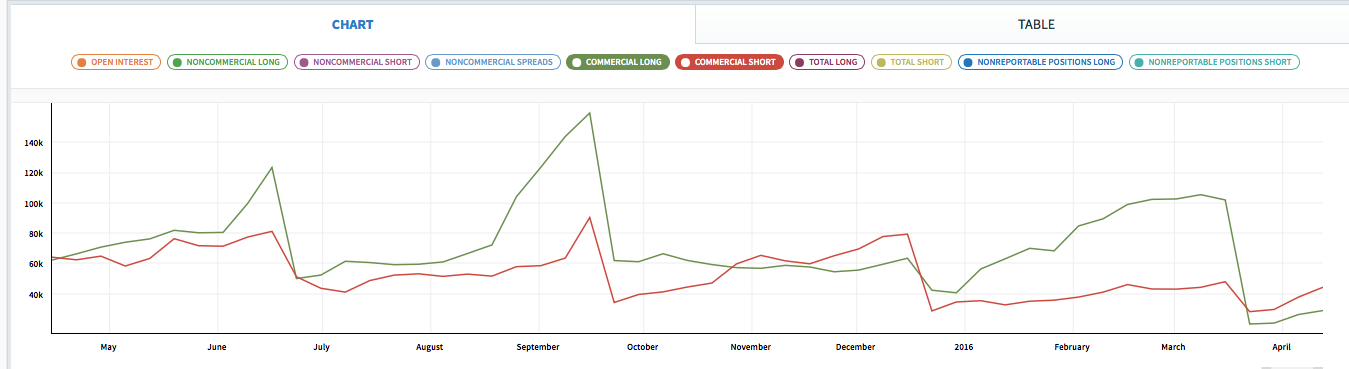
Click chart to enlarge. Chart courtesy of Qandl.
This first COT chart shows commercials. Commercial traders are more often on the right side of the market. Currently, more commercials are short the S&P than long. This supports a bearish Elliott wave count, but it may also support the bullish Elliott wave count which would be expecting a big second wave correction to come soon. Either way points to a likely end to this upwards trend sooner rather than later. Unfortunately, it does not tell exactly when upwards movement must end.
*Note: these COT figures are for futures only markets. This is not the same as the cash market I am analysing, but it is closely related enough to be highly relevant.
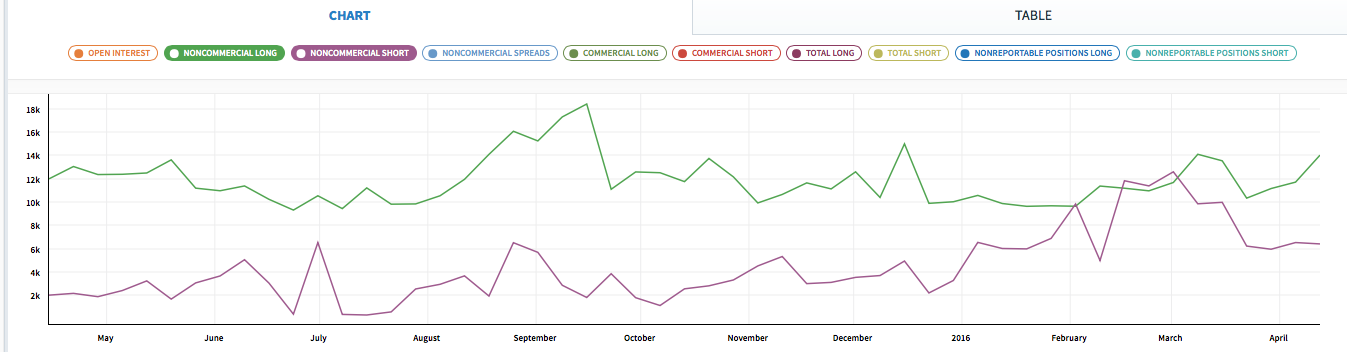
Click chart to enlarge. Chart courtesy of Qandl.
Non commercials are more often on the wrong side of the market than the right side of the market. Currently, non commercials are predominantly long, and increasing. This supports the expectation of a trend change soon.
DOW THEORY
I am choosing to use the S&P500, Dow Industrials, Dow Transportation, Nasdaq and the Russell 2000 index. Major swing lows are noted below. So far the Industrials, Transportation and Russell 2000 have made new major swing lows. None of these indices have made new highs.
I am aware that this approach is extremely conservative. Original Dow Theory has already confirmed a major trend change as both the industrials and transportation indexes have made new major lows.
At this stage, if the S&P500 and Nasdaq also make new major swing lows, then my modified Dow Theory would confirm a major new bear market. At that stage, my only wave count would be the bear wave count.
The lows below are from October 2014. These lows were the last secondary correction within the primary trend which was the bull market from 2009.
These lows must be breached by a daily close below each point.
S&P500: 1,821.61
Nasdaq: 4,117.84
DJIA: 15,855.12 – close below on 25th August 2015.
DJT: 7,700.49 – close below on 24th August 2015.
Russell 2000: 1,343.51 – close below on 25th August 2015.
This analysis is published @ 12:05 p.m. EST on 20th April, 2016.
Another interesting observation on UVXY. An awful lot of traders who are also expecting some sort of correction are absolutely convinced that the worse of the damage will be a triple bottom in SPX around 1800.00, at which point the banksters are going to step in and put a floor under the decline. People who buy this scenario and have sold short UVXY are probably going to confidently refuse to cover during the initial phase of the decline, expecting it make a lower high. For this reason it may be a bit slow to get going during the initial phases of the wave down but here me now and believe me later…if it is P3, they going to ALL cover. Not only are they going to cover, there are going to be a lots of Johnny-come-latelys jumping on the bandwagon on the long side as intermediate three down completes, amplifying the spike of shorts’ covering. I realise this is just a “what if”, as Lara would say; I mention it only for the purpose of recognizing what may be a temptation to leave too much money on the table- this is what happened to me last August and I will be employing a bit different strategy to make sure that does not happen again. What fun! 🙂
I wonder if intermediate 1 of primary 3 will take us to 1800, with intermediate 2 correcting right there to bring us all the way back to set up a massive intermediate 3…
But just not to overlook things, we can still start intermediate 5 of Lara’s alternate count. And even intermediate 2 correction of the bull wave count will still probably take us into the low 1800’s most likely…
The stage is set for a correction in all the scenarios. Let’s see if we can avoid passing 2134.62
My thinking is similar to yours. No matter what the count we are due a big correction. There is absolutely no reason it can’t make it to at least 1800 without any major (50+ points) corrections. A move to 1800 is now 300 points or 14% down. This is no small move coming up thanks to the prolonged rally.
I am thinking that may be exactly where intermediate 1 down takes us. The waves have been getting longer and that would set us up for a deep, protracted wave two retracement and a royal plunge in the fall in intermediate three of primary three down.
Makes a lot of sense Verne. We absolutely will pause at 1800, and it may be about right for the intermediate 2 correction. I think when we do finally break that level it will be the so-called “point of recognition” for a lot of players. That’s when the force of a wave 3 starts to look like a tidal wave, and no one can any longer deny what’s happening.
I don’t think we need to worry about Fed intervention at that point either. The well connected Jim Rickards opines, out of his conversations with Fed officials, that they won’t start to plan intervention unless/until we get down to about the 1500 level. That is something that we do need to keep in mind as the avalanche proceeds. The Fed CAN engineer some nasty snapback rallys.
No one know where the bottom is, but here are the Fibonacci extensions from the Great Depression.
Man… shorting UVXY from here to 1800 would hurt. It’s a wily old bird but was nearly 60 previously (maybe it got slightly above that, but that’s where I bailed)
If most people are not expecting a decline at primary degree that is exactly what most of them are going to attempt; after all, it worked reasonably well in the past…what happened last September 01 was a classic example of a lot of em holding on throughout intermediate on three down, then panicking in the middle of the fourth wave on the way to a truncated fifth. I do not think that is going to happen on this leg down as they will be feeling the heat from the ferocity of the initial decline. Only the most fool-hardly will refuse to capitulate during minor three of intermediate one down.
Verne, any thought if we’ll see sub 15 again tomorrow? Or even close to 15 will be ok with me 😉
I sure hope we have one last swift leg up (not over 2134 though). Would love to load up on more UVXY calls sub 15 range. I bought some today, but only 15% of my position. Then I felt like it got away from me during the last 90 mins of trading, and didn’t look back… I’m backing up my civic tomorrow and filling up the trunk 🙂
A few chartists think we will have one more push higher so it is a possibility. It may be that even with one more upward push UVXY may not look back…if it does, you know what to do…!! 🙂
ari,
You know what you are doing and I have appreciated your participation in this forum. So thanks. Your comment reminded me about myself. I have no idea if you are feeling this way or not. But since I am reminded, I want to share something of my trading experience with the general readership.
I often struggle with jumping or impulsively putting it all on the line so to speak. I’ve made a lot of decisions I later regretted because of this impulsive risk taker in me. This is true in all walks of my life but includes my trading life. With trading, I do / did it because of my fear of missing the best opportunity and fear of missing the most profit. But one day I realized this is just greed in me. I always need to keep greed and fear out of my decision making in trading. I do not know about anyone else, but for me, it has cost me lots of $$$.
As you have read my positioning during this last month or so, you have an idea of my strategy. I use it to help curb my impulses. I’ve been a gun slinger in my past and still am at times, thus I need to curb my tendencies and my greed. That is one reason I use the layering of positions. I am not all in yet and I am going to resist my impulse to put my full position in place now. If what I think may happen, happens, then a few dozen or fifty SPX points now will not make a huge difference in the end. I will still make an outstanding profit.
I began my layering well before the top is confirmed but just by a week or two. As the market kept advancing I was glad to only have partial positioning. And If my last fill or two is at 2039, I will be happy. My averaging by layering will make my overall entry price that much better. Along the way, I have reduced risk as well as greed and fear.
I know one cannot always use this approach especially with day trading. In fact, it could be a disaster. But as I have previously written, I don’t want to be required to be in front of my computer or phone for the market’s open hours.
Just some of my thoughts. As always, for what it is worth. My price of admission during to these markets has been quite high.
Rodney,
Yes I have been noting your moves as you fill your wagons. I definitely have been over zealous with my entry points in the past… and I’m becoming more shrewd and patient.
ThanQ for your thoughts and strategies…
Looking forward to the next couple of days to see how this cookie crumbles. And this time Lara will be with us live!!! Can’t wait 🙂
Rodney, imho since Xmas (maybe before), you’ve upped your game incredibly. Your posts / trades / methology are very well thought out, based on fact and sound technical information. There is an exit plan, and so risk limitation.
I’m not saying that was not the case previously, but to me you have become a world class trader these past few months right before our eyes.
Everything noted in this post supports that view – writing something that the world (ok us) will see is very cleansing 🙂
I’m certainly a fan 🙂
You are just so kind. Thank you for your affirmations. I do have to laugh when you use the words ‘world class’ in the same sentence with me. That is a good one. But thanks. However, I recognize I am learning and am grateful for those who have been teaching.
Now lets go settle some old scores with Ms. & Mr. Market!
It kinda sneaks up on yer imho.
I’m still not sure exactly at what point I started to ‘get it’ – I guess it must have been when I started making money instead of losing it 🙂 🙂
The interesting thing about ‘getting it’ is that you look back and cannot for the life of you understand why you didn’t get it before!!
Very true.
Ditto on all of the above. I like to think of Rodney as the “man with a plan”.
For what it’s worth, I solved my gunslinger tendencies by limiting myself (no more than five contracts) on those types of trades so as not to self-inflict too much damage when I’m wrong. I too have made some really bone-headed trades because of impulsiveness. I think many traders outgrow those tendencies as they mature (or loose their capital!). Another think that I learned was to trade what I know. Too many folk don’t take the time to get really familiar with one good reliable method or instrument to develop at least one or two “bread-and butter” trades. You really need only a couple of home run trades per year to make it worth your while. You cannot make home-run trades unless you have mastered a few instruments or consistently reliable strategies.
Lara has taught so well over the years I have been here. I begin to understand EW and how to apply it tactically. Your comment about trading what you know is part of the reason I gave up my gold subscription some time ago. I needed to concentrate on one thing. After this SPX primary 3 is through, I will think about adding to my repertoire.
Verne, how you can keep straight all your trades, straddles, hedges etc is amazing to me.
Rodney,
I’ve read your post 3 times now…
Thanks again… you do have a way with words…
my son has a civic, roomy trunk.
Similar to Dumbo then… 🙂 😉
Or maybe not – trunkation and all that..
good one Olga…
Yeah the civic does have a nice big trunk, specially relative to its size. Maybe I’ll call it Dumbo, since its grey also 🙂
And so I expect that tomorrow may be the big day. Which means for the turn to come on 21st April one final high (maybe to avoid a truncation?) may happen.
Now, this does not have to happen like this. But so far everything is lining up to look like it MIGHT happen like this.
Price could keep going up right up to 2,134.72. We have zero confirmation of a trend change. I want to stress that for new members, there is no confirmation. Wait for confirmation, at least a little confidence, before jumping in short if you are inexperienced.
Looks like I may be staying up for the NY session. Will have to get in a wee afternoon nap… NY opens 1am my time here in New Zealand. Better get a good surf in today so I’m ready to go!
I’ll be hanging out with you all here next session 🙂
Well that is kind of you and very considerate to let us know as well. Thanks.
I am acutely aware you are not saying upside movement is over. I have been for the last 200 SPX points or so. You have held firm in your approach and analysis. Steady hands are not always easy to find. So we wait for more confidence points, confirmations and invalidations etc. I suspect if you call this on the penny you will not be ‘crowing’ too much though you deserve such acclaim and applause. But you don’t strike me as a person who is comfortable with too much praise. On the other hand, if it helps you perform, how shall we praise? (he-he)
Well, as I mentioned earlier today, I loaded another wagon as I had to be away for the last hour of trading. My break-even is not very far away at all. I hope you are enjoying the fruit of your trading and have closed your long.
And by the way, I close with my comment to self when I saw the last hour of the ticker / charts. I said, “Dang it! I knew I shoulda filled two of those there wagons.” That is my best imitation of a North American cowboy on the wagon train. I am sure doc can have some fun with that.
Look forward to the update.
I heard ya,, yee haw, kiddy up round em up rawhide..I missed the show today,, Wed. is golf day, unusually warm here in western Wash. records last 3 days
No so far away from you doc, geographically speaking.
where you at? Wyoming still has wagons don’t they? Montana? or maybe Oregon, remnants of the Oregon trail
NE Oregon. Small town. Out of town on the big river. The Pacific Northwest banana belt. Highland desert and mountains next door. Not a lot of people or the issues of the big cities. We call it God’s Country.
I left Montana about 12 years ago. It was getting too crowded! But I have trekked all over the wildernesses of Wyoming and Washington as well as Oregon, Idaho and Montana.
love the high desert,, Bend area, many fine golf courses
All I can say is wow!!
It will be no surprise to any of us longer term members but for everyone else… how many services are as accurate, care as much, and stick by their members at critical junctures? How many (amazing) analysts would work through the night (literally)??
We are incredibly lucky around here imho (us longer term members already know it, but I’m not sure everyone else would quite appreciate it – not straight away).
Yer in pretty good hands here 🙂 (imho)
well said Olga,,we are fortunate,and she puts up with knuckleheads like me,, just don’t use all caps.. hee
Yeah – I’m also not a fan of caps – too aggressive and unnecessary imho.
You always brighten my day Doc – far too easy to take life too seriously 🙂
well thank you Olga!
I can see a five up complete on the five minute chart.
This downwards movement is getting pretty close to where I would put minuette (i) within minute v. So it is getting close to not being able to be a fourth wave, which would mean it’s all over (possibly).
But it is also possible that this minute v is an incomplete impulse. There is more than one way to label this on the hourly chart and five minute chart.
Bottom line: a new low now below 2,091.67 could not be a second wave correction within minute v so minute v would have to be over. The probability of a big trend change would increase.
A new low below 2,039.74 would confirm it.
Thanks Lara. Your target calls are absolutely incredible! Wow!
Can’t wait for downside targets…
Thanks Verne… but not so fast. We don’t have a turn yet, so I can’t crow about getting this target right… yet.
And also, I’ll label minute iv over at the low of 2,091.67 of 19th April. A quick zigzag.
I tried to see if it could fit as a triangle, but nope.
Hey Olga–my UVXY calls are in the green today!
Good man 🙂 … my UVXY shares aren’t (yet!)
Don’t you worry…they will…! 🙂
UVXY issued an official (Verne’s i.e. 😀 )buy signal with a second close in the green after a new 52 week low. What is quite unusual is that one of those green closes was made on the same day of the new 52 week low. Have a great evening everyone! 🙂
Thanks Verne. I also bought some more at the close.
Anyone got Silver / PMs?
PSLV has been on fire these last few days. Got it for long term wealth preservation rather than trading but nice to see it cooking on gas.
Gold / Silver ratio dropped a fair bit this week. Hoping for a bit of a drop in price so I can load up some more.
We are due for a correction…the next week or two is going to be an terrific time to accumulate the miners as well as the metal itself…will adding substantially to my GORO position.. 🙂
Yeah – I’m thinking the same, albeit silver is trying it’s best to lead me astray.
You might want to check out the silver miners as well. The silver/gold ratio is starting to turn up. It always moves up in a gold bull.
Problem is that alot of them can turn out to be complete dogs – do you know of any good ones (silver miners)?
I’m mainly in physical metal but intend to put about 10% of my PM allocation into some miners and GDX to add a bit of juice.
The key is to find the ones that are debt free, and have not hedged too much of their proven reserves…there are indeed a few… 🙂
One you might consider is Pan American Silver (PAAS). Another analyst I follow knows some of the management and recommends them highly.
Thanks for that jbarnett11 – very much appreciated.
I mentioned it before and got zero love but …if spx and gold move down at the same time DUST will be smoking!
Thanks Andrew 🙂
MASSIVE cash dump!
Dave
What are you seeing i.e., massive cash dump?
Huge block bot on the upcandle…
Currently at a 6 point trunctation….end this already, let’s head down.
5.43
Wasn’t the end of intermediate 1 truncated 4.9 points?
Exactly
Olga,
Is the upper limit of minuette b about 2015?
Sorry Rodney only just seen your comment.
Yeah – I make it 2116.47
Poss minuette (a) is 12.42 in length – 2×12.42 = 24.84
Poss minuette (b) started at 2091.63 = 2116.63
Not really a limit – probability just drops quite alot after 2x I think.
Got it and thanks so much.
Seeing as I need to leave for the rest of the day, i am going to load up one more wagon before I move on. This gives me 5 out of 8 wagons of a full position.
Oops. I overfilled that wagon a bit. I hope the axles hold. Wagon Ho!
For what it is worth, (again, it is worth as much a you paid for it) my break even point as of right now is just above the high on Monday (UVXY-TVIX).
I’m averaging 16.48 atm with UVXY, albeit I’m only 40% full so I’m hoping to bring that down dramatically with a 60% dump.
I’m looking for sub 14 but that might prove to be very wishful thinking.
Olga–thanks for that projection. I recall several weeks back when most were targeting UVXY for 18-20 you mentioned the possibility of UVXY 15. Well done.
Just throw on a few more braces matey…she’ll hold! 🙂
Difficult to see five up from this morning’s lows without a third shortest wave…
You’re using the wrong chart scale.
One of the fundamental principles of EW analysis Joseph is that the wave relationships apply in all time frames…it may be that you are not aware of that fact. It is probably not so much a matter of a wrong chart scale, as it is an incomplete wave… 🙂
So close to an end of all this… I have to hold myself back from transferring more money into my account to add to my position.
Soooooooooo Closeeeeeeeeeeeeeeeeeeeee
“What’s guh-guh-guh-guh—…what’s happening?”
“Th-Th-Th-Th-Th-… That’s all, folks.”
“Th-th-th-that’s all folks!”
“And Dat’s De End!”
Another 52 week low in UVXY on deck….
Very interesting gaps up on one minute chart!
I’m not sure about that. As price is reaching today’s high right this second, VIX and UVXY are failing to make a new low… I’m adding to my purchase previously posted… Still have plenty of dry powder though if it does make a new 52wk low. In fact i’m hoping for it, but I doubt it unless its a swift move up…
Son-of-a gun!
You called it…right down to the door-step but no cigar! Amazing! 🙂
Of course the day is not done yet but if not now…when?
Since you all know I am not an EW counter my comments regard wave count should not be counted as very much value but rather quite heavily discounted. How is that for a mouth full.
Lara has repeatedly stated the count is not yet complete and needs more upside. From my view, that analysis remains true at this time of the day. The upside has more to go, imo.
I continue to notice the unusual action in UVXY and such instruments. As I stated yesterday, the floor traders are running the show on UVXY. They pushed it down earlier this week and are still accumulating all they can buy at this low fire sale price just before the start of a big down wave, at least a return to the mean.
I have not filled any more positions just yet. The wagons are at the loading ramp. But I have not come to an agreed price for the cargo. I want a price just below yesterday’s low. No one is offering so far.
While I am writing, welcome to all the new members. Like Olga has pointed out, we look forward to hearing from you. But always understand the unwritten disclaimer from your fellow members, “We share openly. Use at your own risk.” As far as me and my commentary, it is absolutely worth everything you have paid me for it!
I am looking forward to having fun and making money in the very near term future and in the days beyond those.
OK folk, if we have topped, get ready for the plunge…!
Canaries perking up so up we go…. 🙂
Two critical items now in play.
1. Surrender of the round number pivots…DJI will probably lead the way.
2. SPX violation of 2073.65.
Either of these would be strongly suggestive imo, of the end of the road…. 🙂
I had deja vu of you talking about surrendering the round pivot numbers of 1800 and 1900 not long ago
Yep. I have learned to pay very close attention to what happens around those round numbers. It is usually a big mistake to short the market when they are held. The same applies to the current situation…
I think the last time I commented at length was DJI 17000 and SPX 1900…
Maybe not…! Canaries are croaking…. 🙂
Bids should be shooting higher for a third wave up….watching VIX and UVXY closely…
OK that was just a second wave pullback. Wave three up underway…
We could be looking at a sneaky fifth wave truncation….
Some canaries in the coal mine popped back to their bids at the end of minuette one up then traded lower on the bid; they should be going higher at the onset of a third wave up…
Filled on UVXY calls @ 0.88… a bit of short term dry powder just in case of a new 52 week low…
I posted this some time ago, but for anyone new: if any members are posting counts as they unfold intraday (as I and some other members do from time to time) it is very likely we are using at most a 5 min timeframe.
I do not recommend anyone who is not very familiar with EW to take any notice of my intraday counts / comments – they are meant for members here whom have experience with EW so can see what I am seeing and make a fair judgement as to whether my ideas are accurate.
Certainly anyone that cannot immediately glean the timeframe I am using from the wave labels in my comment should never use my intra-day comments / counts for placing trades – just ignore me and await Lara’s fantastic analysis – that’s what we’re all here for 🙂
Very wise advice, particularly for new members. Those of us posting are merely giving our very personal view of what is going on with the price action and folk should certainly not be basing trading decisions on our comments apart from personal due diligence. Lara is the expert and her analysis should ultimately be one’s guide.
Personally I really enjoy the on-going commentary, especially since most folk posting are quite cogent in giving their rationale…and generally quite gracious in answering queries… 🙂
Just bought my first batch of UVXY 18 calls, June expiration for 2.45. That’s the low for today so far…
VIX is down 4.23% while UVXY down 2.52% at 12:01 eastern… waiting to buy more as it goes lower, and minute 5 takes shape
UVXY May 6 18.50 calls back down to bid/ask of 0.87/0.94; trying to get filled at 0.90…will probably happen on last wave up…
I don’t know how you trade options so short term Verne. But I do know you’re great at it. I wish you luck, but I know luck is just a small part of it.
You are doing the right thing with the longer expiration dates; I expect to be proven wrong on my near term date in a day or two at most. With a delta of 0.33 I will take around a 25% haircut on calls with at new 52 week low but I am expecting that is a real possibility with a final wave up….
Probably just completed minuette one of minute five…
ON what chart scale? Hourly? 5 Min., 1 min. ?
It doesn’t matter – ‘minuette one of minute five’ is ‘minuette one of minute five’on any timeframe.
The higher the timeframe the less likely lower degree waves will show up, but they are still there and still labelled the same.
Indeed! 🙂
Sorry, I don’t buy that argument… 1 min is great for day trading but to fit into the analysis we are following to me is not logical.
Lara’s analysis is on Hourly as the shortest… I can see making a case for 15 min and 30 min. as forming the hourly. But not the one min. no way.
Joseph, please just ignore my posts and I will reciprocate 🙂
My posts are only meant for members that can follow EW intraday.
Please keep ’em coming Olga; they help to keep me alert…thank you!! 🙂
Elliott wave is fractal.
My hourly charts will subdivide the same on lower time frames. The lower the time frame the more subdivisions you can see.
Olga is using the one minute time frame (I assume) to time her entry point as precisely as she can, and to get a feel for all the subdivisions as they unfold.
I’m publishing only hourly because in my experience the lower time frames change too much (the EW labelling will change too much as it unfolds). And you’ll notice I will often not label the last few hours of a new movement until the next day… when what happens next makes it clearer. And then I see how it all fits together… and so what should happen next.
I hope that makes sense?
I think Olga’s approach is logical, but its a helluva lot of work and subject to constant revision. More suited for scalping, and for those who hold longer positions someone who has huge attention to detail and wants to get the feel of the market as it all unfolds.
That makes sense thank you.
I just can’t work with a one min. I mostly view 5 min, 15 min, hourly & daily.
One minute…
Yes, agree with you
If you follow Lara’s Bear Hourly Count… 2096.32 this morning was the end of IV circle and we are now 5 circle up in 5 up as it just past the III circle high 2104.05.
We can now end at any point between here and the target 2116.48
PLUS… this is valid:
Price today is reasonably close to 2,116.48; if intermediate wave (C) ends here, it would be truncated by 12.43 points. A truncation of this size is still large, but not too large to be considered. The probability is still lower than the probability of price continuing higher.
So if I am wrong in continuing the hourly bear chart above like described here… please explain why I am wrong in detail.
If I understand what you are seeing, you would have a truncated c wave (minuette c of minute 4). Also that wave looks like a 3 – c waves should be a 5 (other than triangles etc).
B waves can make new highs (expanded flat) – we could still be in (b) of minute (iv).
If we move higher (by convention (b) should not really be longer than 2 x (a) – otherwise it starts getting suspicious) then you could be right – but right now I would say it is higher probability that minute (iv) is not done yet.
Correction: minute 5 can end anywhere from here until 2134.72. That’s the invalidation point… 2116.48 is a target, but price can go above that.
CNBC commentators have continuously stated that there is RECORD SHORT POSITIONS at present. They never back their statements with data or the source of it. Can anyone substantiate their claims?
Thanks,
D
Those numbers include short positions on inverse ETF’s (which are substantial due to natural erosion in price). Being short an inverse ETF is in effect being long the indexes with the added natural erosion in price which is why short inverse ETF’s is a trade that is so popular with professionals investing large sums of money.
If anyone thinks I am wrong on this… please explain why in detail.
That seems logical. Do you have a website or other information to substantiate that I can monitor?
Thanks,
D
The very best gauge of market sentiment is the VIX. The rankest novice can look at the VIX at 12.77 and conclude that any commentator on CNBC, or anywhere else that gets on the air talking about record short positions is either a complete imbecile, or is confident that those in his/her audience must be…no need to go to a website…
I know the short ETF story from pros that I have discussed this with. All the inverse ETF’s are reverse split to oblivion (especially the 3X & 2X)… if you have the LT direction right, big money makes a fortune.
The best free short data I can find is here… Maybe you can also try and get it from the exchanges.
http://www.barrons.com/public/page/short-interest-nyse.html
I recently saw a presentation on how badly UVXY erodes – under the right conditions it loses value at an astonishing rate.
Makes me wonder about buying puts on SVXY instead of calls on UVXY…
Definitely not an instrument for typical buy and hold investing….the way you deal with the erosion is by selling covered calls against your long position if held for more than a week or two…you can actually make a nice profit by using the proceeds to hedge with short term puts…. 🙂
They are financial sociopaths at best, subversives at worst… 🙂
Minute (iv) looks like it might be tracing out a triangle atm. If I rush the count I could see us just finishing (d) but I think it’s more likely that we are still in (c) (maybe just finishing wave b of triangle (c)).
Could morph into something else of course, but a triangle for minute (iv) after the triangle from Minor 4 would be very nice.
Invalidated 🙂 – still in (b) then??
Is it possible we have completed minute iv and are in minuette iii of minute v?
I can’t make minuette i for that idea divide as a 5 (sub min i & iv overlap).
If it continues higher then maybe I’m missing something – minuette one a leading diagonal maybe?
More structure will soon reveal Mr Markets hand
UVXY doesn’t seem to be playing along with this new higher high (went lower yesterday).
The move up from this mornings lows looks quite impulsive but it still might be a c wave.
2087 line in the sand 🙂
Olga, You are counting on a one min. chart right… not an hourly?
I suggest you specify that every time you post… especially with new members here.
Noted – albeit I have specified numerous times that I only use a 1 min / 5 min chart for intraday analysis. I’m not willing to waste my time stating that every time – I would just rather not post.
I cannot identify intraday moves as they happen using a 1 hour chart.
Trump Hints He Would Replace Janet Yellen
The clean up from the mess the USA is currently in will initially make things worse before they get better.
Say Goodbye to the Fed put!
There must be a cleansing before the rebirth and a return to true price discovery… not the price fixing the central banks and governments world wide have practiced for 15 years or more.
Good morning all. I just posted the following on Lara’s NASDAQ count / analysis from last evening. I am wondering if any of you have thoughts on this.
—————————————————————————————————————————
Thanks Lara. I have some concerns as I read this analysis. It presents a picture where the NASDAQ will be heading much higher for a while. This would indicate that the SPX will make a new all time high. If the NASDAQ moves to 5177 that is an almost 5% move which correlates to a 100 point move in the SPX.
————————————————————————————————————————–
Any comments?
Rodney,
I am hard pressed to see move higher on NASDAQ see my comment on NASDAQ analysis. Additionally, volume on QQQs is anemic
I share your sentiments. But nevertheless, the count is for a 5% up move.
Some alternate count will come to light if and when the SPX & DJIA confirm down wave has started. I have seen this many times over the last few years with EW.
Remember mass confusion / on board with bullish view is what is expected with this corrective wave up from 2-11 low. You question everything.
Sounds reasonable. Thanks.
I like the addition of COT to your analysis Lara!
me second 🙂
Hi Sunny,, we have a bunch of new names showing up,, welcome,sunny boy or sunny girl?oops that’s inappropriate isn’t it,,,since the world is gender neutral now
gender fluid?
Gender flummoxed… 🙂
woo hoo,, I did it,, what timing,,