
FTSE has been moving higher as this Elliott wave count expected.
The questions today: Is upwards movement over? How will we know when there has been a trend change?
Summary: This upwards movement for FTSE for the last 44 days is a bear market rally until proven otherwise. It may end about either 6,453 or 6,518. Thereafter, a break of the channel on the daily chart would indicate the rally is over and a strong downwards wave to new lows has begun. A new low below 6,061.85 would provide price confirmation of a trend change. Look out for surprises to the downside: a big third wave is approaching and is almost here.
MONTHLY ELLIOTT WAVE COUNT
Click chart to enlarge.
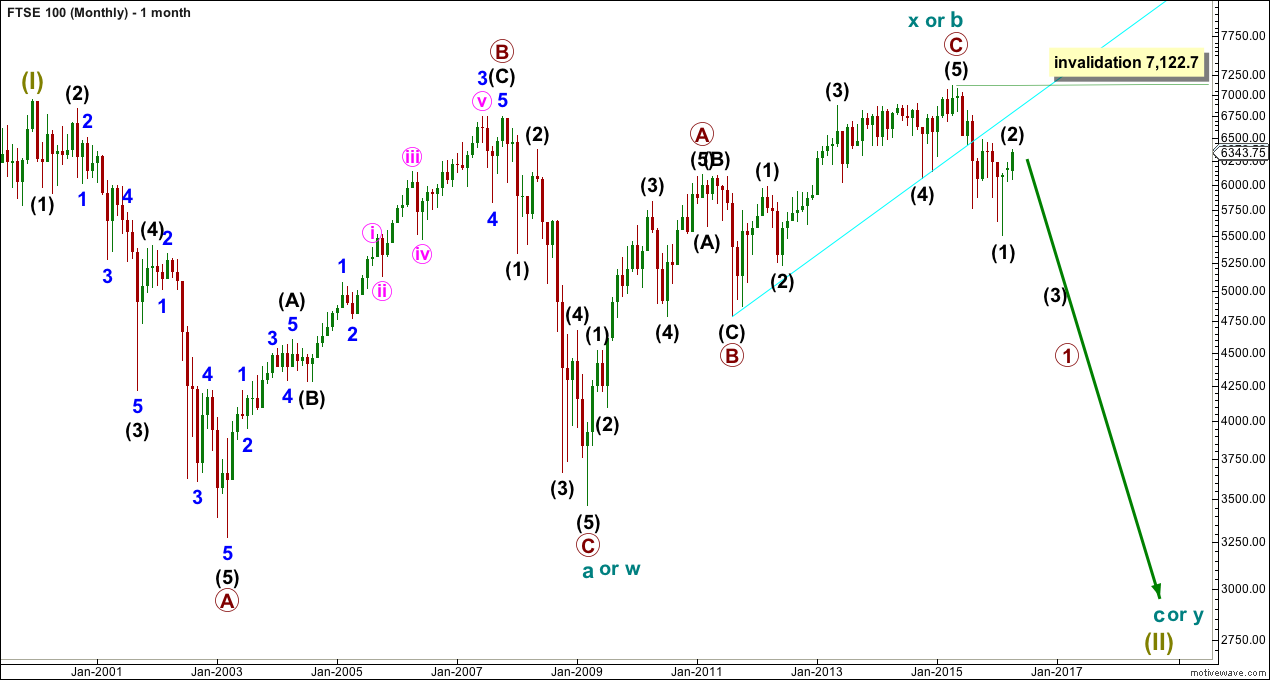
At the monthly chart level, FTSE is the clearest bear market.
The cyan trend line is drawn across the two major swing lows in the bull market which began on March 2009. This bull market trend line has been breached by a close well over 3% of market value, indicating a trend change from bull to bear.
The 200 day moving average is now declining (shown on the technical analysis daily chart at the end of analysis). Price has made a series of lower lows and lower highs. FTSE is in a bear market until proven otherwise.
From an Elliott Wave perspective, the downwards movement labelled intermediate wave (1) to the low in February 2016 has well overlapped back into the high labelled primary wave A of February 2011. This downwards movement may not be a fourth wave correction within an impulse unfolding upwards. So the prior wave up labelled cycle wave X or b must be over and it must be a three wave structure.
The cyan bull market trend line is now providing resistance. Copy this line over to weekly and daily charts. It may be useful.
Super Cycle wave (II) is seen as either a large flat correction, a double flat or a double combination.
If Super Cycle wave (II) is a large flat, then within it cycle wave a was a regular flat and cycle wave b was a zigzag and 1.05 the length of cycle wave a. The length of cycle wave b indicates the most common type of flat, an expanded flat, may be unfolding. Cycle wave c downwards must subdivide as a five wave structure. Cycle wave c would be expected to end substantially below the end of cycle wave a at 3,460. At 1,477 cycle wave c would reach 1.618 the length of cycle wave a.
If Super Cycle wave (II) is a double flat, then the first flat in the double was a regular flat labelled cycle wave w. The double is joined by a three in the opposite direction, a zigzag labelled cycle wave x. Now a second flat correction should unfold sideways for cycle wave y. Cycle wave y would look similar to cycle wave w, with two large market crashes within it. It should end about the same level as cycle wave w at 3,460, so that the whole movement is a sideways structure.
If Super Cycle wave (II) is a double combination, then the second structure in the double for cycle wave y may be either a zigzag or a triangle. Either of these should reach down only to about the same level as cycle wave w at 3,460, so that the whole structure has a sideways look to it.
Of all these three options the simple expanded flat labelled cycle waves a-b-c is the most likely because expanded flats are very common structures.
WEEKLY ELLIOTT WAVE COUNT
Click chart to enlarge.
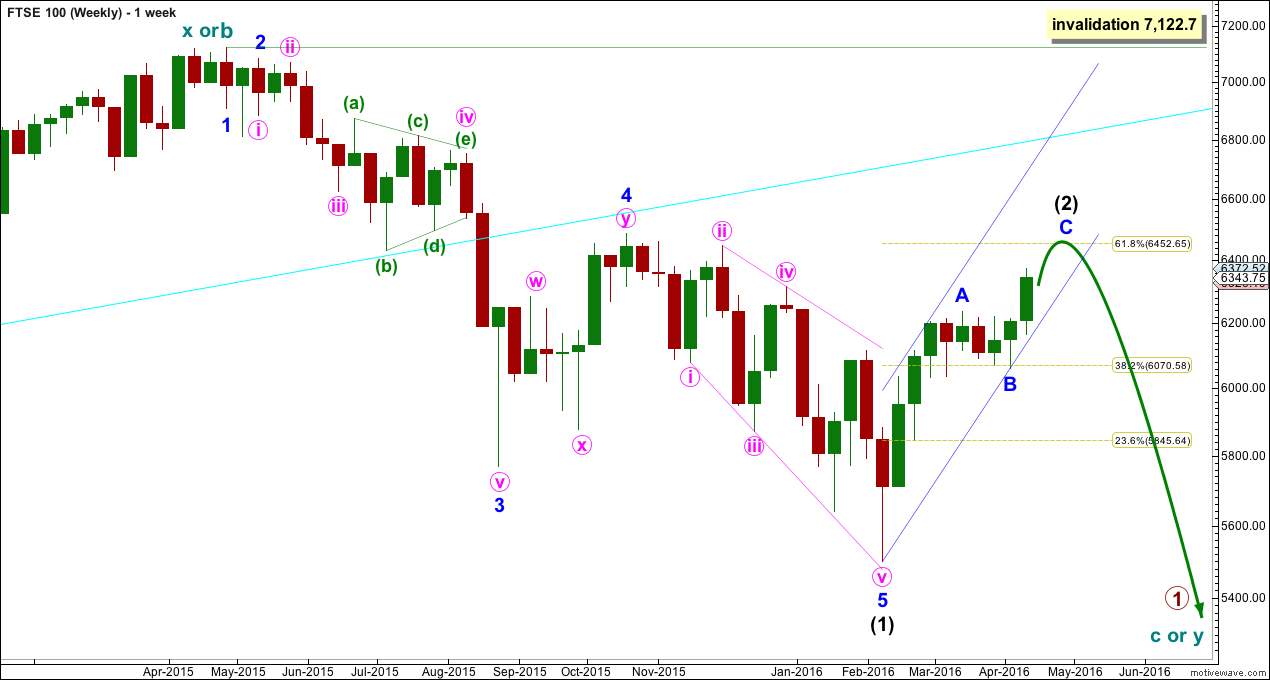
After the cyan trend line was breached, a typical throwback followed for the correction labelled minor wave 4. If price continues higher for FTSE, then the cyan trend line should provide very strong resistance. If price does that, it would offer an excellent opportunity to join the downwards trend. However, it looks like price may not get very close to that trend line again.
Intermediate wave (1) subdivides as an impulse. Intermediate wave (2) is subdividing as a zigzag. Only when the small blue channel about this zigzag is breached to the downside may confidence be had that it is over. Expect that intermediate wave (2) is likely to continue to move higher while price remains within the channel.
Intermediate wave (2) may not move beyond the start of intermediate wave (1) above 7,122.7.
DAILY ELLIOTT WAVE COUNT
Click chart to enlarge.
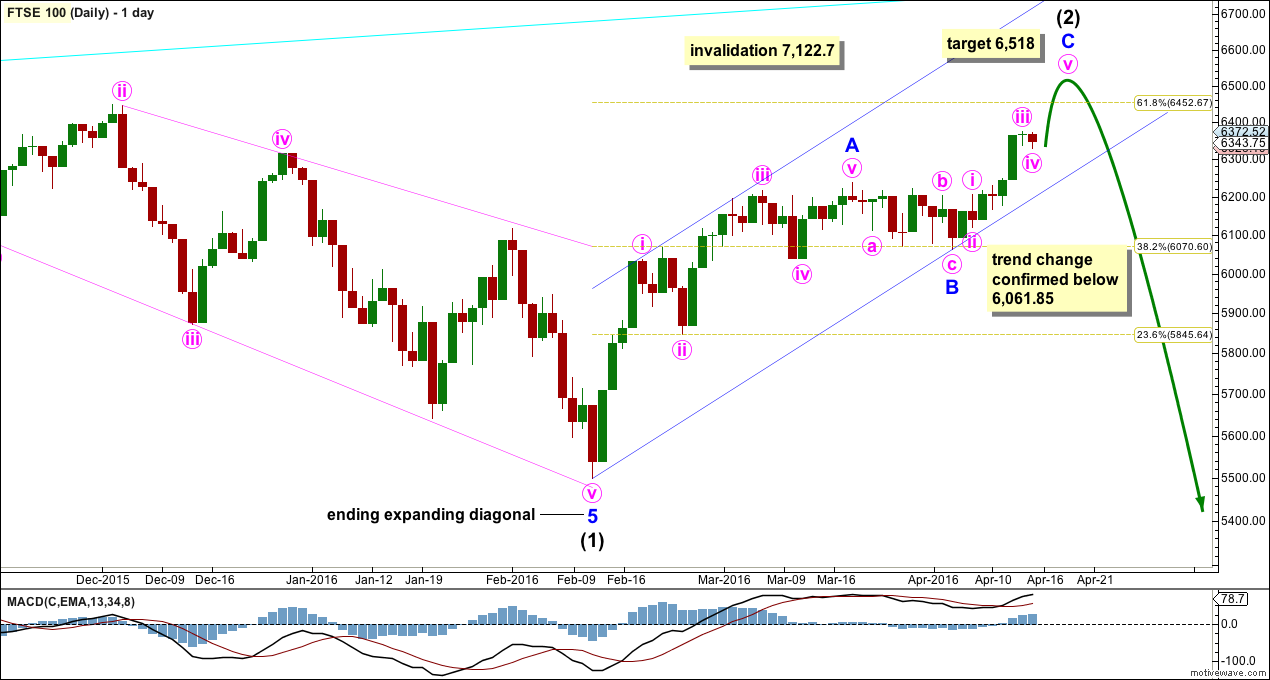
Intermediate wave (2) may end about either the 0.618 Fibonacci ratio at 6,423 or it may end at the target. At 6,518 minor wave C would reach 0.618 the length of minor wave A.
Within minor wave C, it looks like the structure may be incomplete. A final fifth wave up may be required.
6,061.85 is the start of minor wave C. A new low below 6,061.85 could not be a second wave correction within minor wave C, so at that stage minor wave C would have to be over. A new low below 6,061.85 would provide strong confirmation that the bear market rally of intermediate wave (2) is complete.
The next wave for FTSE is expected to be a strong third wave down. When the end of intermediate wave (2) is known, then a target for intermediate wave (3) downwards may be calculated. That cannot be done yet.
Intermediate wave (3) must make a new low below the end of intermediate wave (1) at 5,499.51.
TECHNICAL ANALYSIS
Click chart to enlarge. Chart courtesy of StockCharts.com.
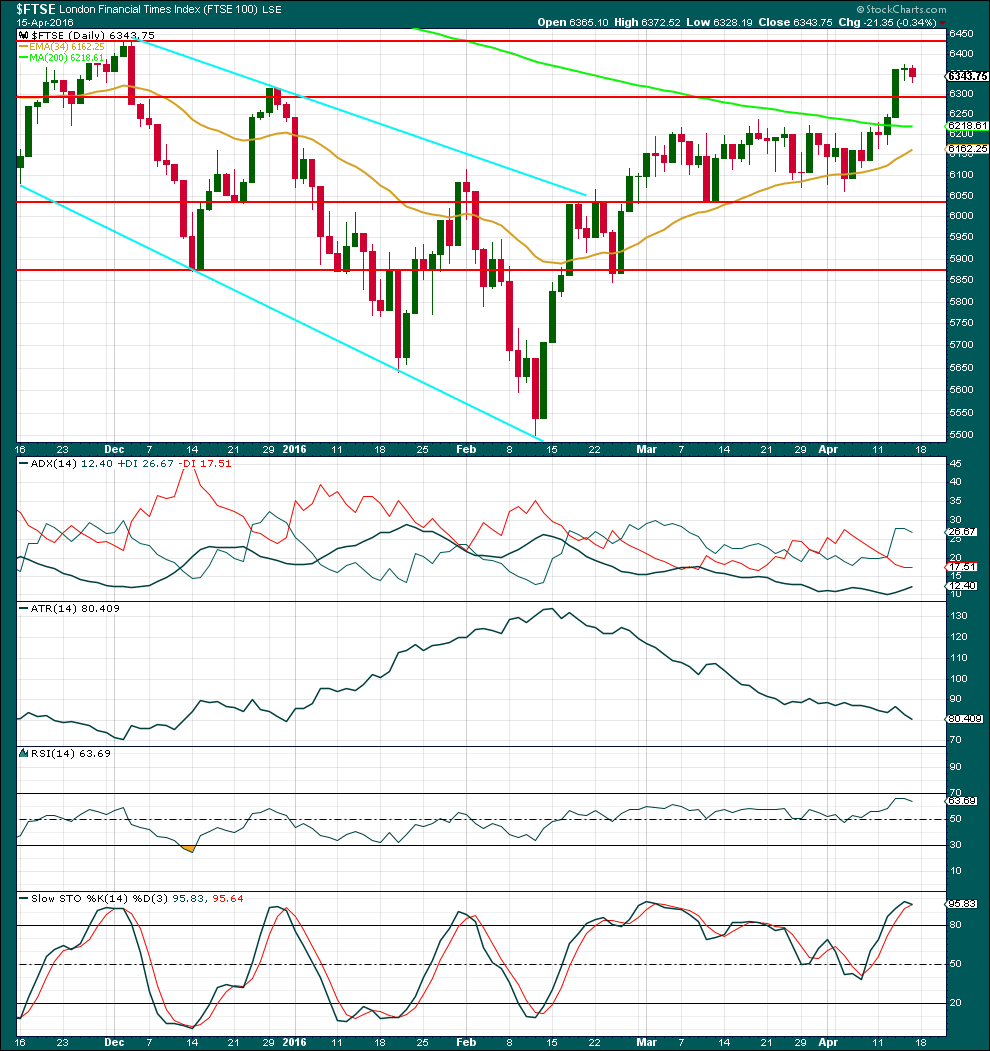
Neither Google / Yahoo data feed nor StockCharts provide volume data for FTSE. Comments on volume are taken from Yahoo Finance data.
Volume may be slightly declining as price moves higher, but this is not very clear. It is clearly not increasing. The rise in price is not well supported by volume.
During the last sideways movement, from about 4th March to the breakout on 12th April, it was two downwards days, 10th and 18th of March, which had the strongest volume. This indicated a downwards breakout would be more likely than upwards, but this is not what happened. Price has broken out of a range to the upside. Volume for the breakout days of 12th and 13th of March remains lighter than volume for the downwards days of 10th and 18th of March. This suggests that the upwards breakout may be short lived.
Price has broken above previous resistance at 6,300. In the short term, this may now provide some support. A break back below this line would see price most likely continue lower until the next line of support is found at 6,035.
ADX is increasing but it is below 15. It does not yet indicate a trend.
While price has been moving overall upwards for 44 days, now ATR has been clearly declining. Normally, ATR should increase during a trend. With ATR declining, it indicates that this upwards trend is weak.
RSI has not yet reached overbought. There is still room for price to move higher.
Stochastics is reaching overbought. But if a trend is again beginning, this indicator may remain extreme for reasonable periods of time. With ATR currently indicating no clear trend though, Stochastics is indicating an end to this upwards swing should come soon.
This analysis is published @ 05:41 a.m. EST.
Hi Lara,
Just curious what your perspective is now that the FTSE has reached the 6430 area and has went on to drop 100 points from that level
Wondering if you view this as the next leg down being underway or do you expect more upside to reach the higher targets in the 6500 area?
I see you are looking for the blue channel to be breached for indication of a top but can you guide me as to what price level would provide confirmation for you that the short term uptrend is over and the downtrend has resumed?
TIA
Fantastic – thank you Lara
This remains my number 1 short and this is really appreciated.
As a new trader, how would you recommend I play this? Await confirmation or add shorts at the two price targets?
Kind regards
Ali
My advice would be to always wait for confirmation.
I like to trade FTSE as well. When I expect it has turned I’ll publish it.
Trying to pick highs and lows does not often end well.
Although the next wave down may be very swift and fast, I expect corrections will be brief and more likely shallow than deep. Jumping in should become profitable quickly.
perfect thank you!
Lara,
Any chance you could update the NASDAQ analysis as well?
There is a chance.
There is no surf today, it’s an onshore mess. The chance of NASDAQ being published is increasing 🙂