
A little downwards movement was expected.
Summary: This is still a bear market rally until proven otherwise. A final fifth wave up is underway with a target just above 2,116.48. It may end next week. The upwards trend is very weak.
To see last published monthly charts click here.
To see how each of the bull and bear wave counts fit within a larger time frame see the Grand Supercycle Analysis.
To see detail of the bull market from 2009 to the all time high on weekly charts, click here.
New updates to this analysis are in bold.
BEAR ELLIOTT WAVE COUNT
WEEKLY CHART
Click chart to enlarge.
This bear wave count fits better than the bull with the even larger picture, super cycle analysis found here. It is also well supported by regular technical analysis at the monthly chart level.
Importantly, there is no lower invalidation point for this wave count. That means there is no lower limit to this bear market.
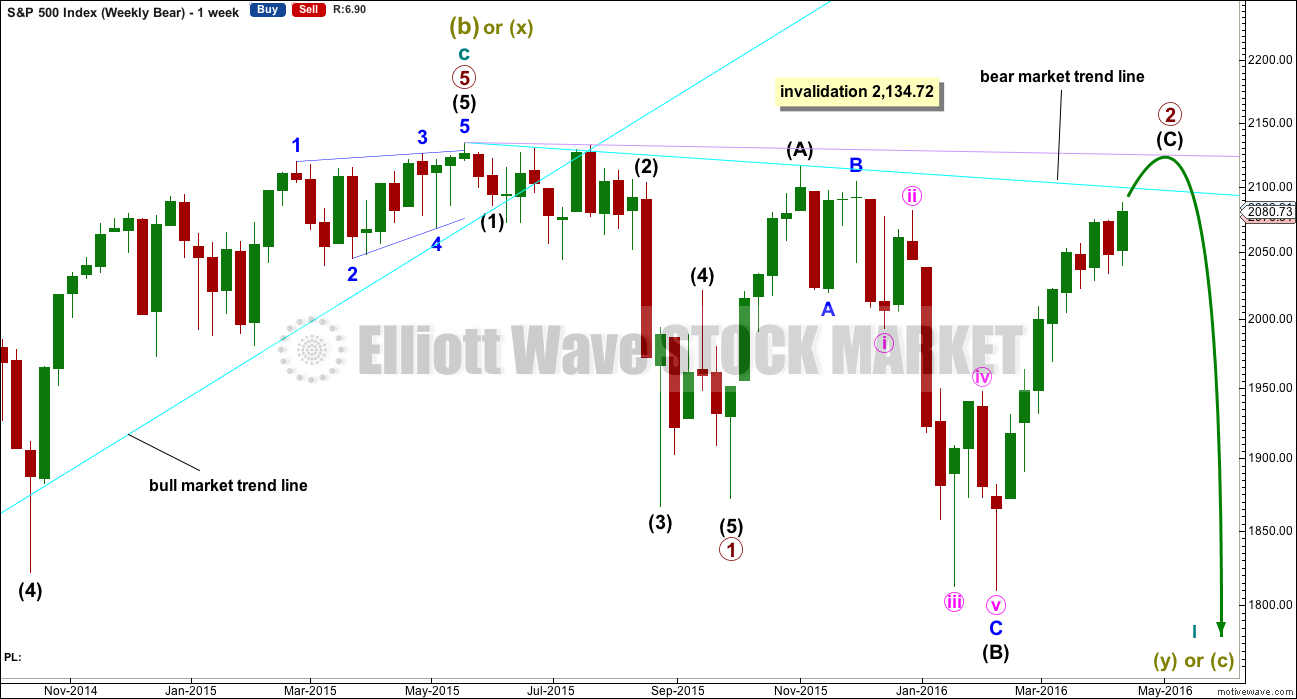
Primary wave 1 may be complete and may have lasted 19 weeks, two short of a Fibonacci 21. So far primary wave 2 has ended its 27th week. It looks unlikely to continue for another 7 weeks to total a Fibonacci 34, so it may end in about one to two weeks time. This would still give reasonable proportion between primary waves 1 and 2. Corrections (particularly more time consuming flat corrections) do have a tendency to be longer lasting than impulses.
Primary wave 2 may be unfolding as an expanded or running flat. Within primary wave 2, intermediate wave (A) was a deep zigzag (which will also subdivide as a double zigzag). Intermediate wave (B) fits perfectly as a zigzag and is a 1.21 length of intermediate wave (A). This is within the normal range for a B wave of a flat of 1 to 1.38.
Intermediate wave (C) is likely to make at least a slight new high above the end of intermediate wave (A) at 2,116.48 to avoid a truncation and a very rare running flat. However, price may find very strong resistance at the final bear market trend line. This line may hold price down and it may not be able to avoid a truncation. A rare running flat may occur before a very strong third wave down.
If price moves above 2,116.48, then the new alternate bear wave count would be invalidated. At that stage, if there is no new alternate for the bear, then this would be the only bear wave count.
Primary wave 2 may not move beyond the start of primary wave 1 above 2,134.72.
DAILY CHART
Click chart to enlarge.
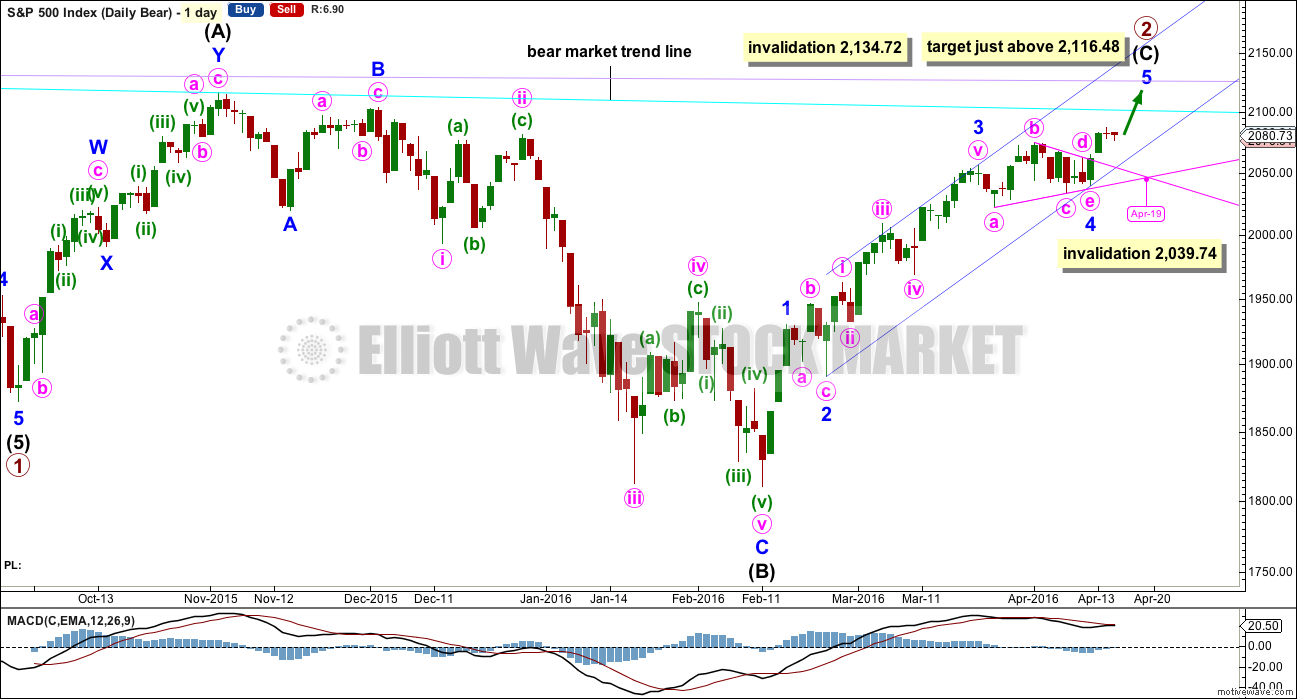
Intermediate wave (A) fits as a single or double zigzag.
Intermediate wave (B) fits perfectly as a zigzag. There is no Fibonacci ratio between minor waves A and C.
Intermediate wave (C) must subdivide as a five wave structure. It is unfolding as an impulse.
Intermediate wave (C) does not have to move above the end of intermediate wave (A) at 2,116.48, but it is likely to do so to avoid a truncation. If it is truncated and primary wave 2 is a rare running flat, then the truncation is not likely to be very large. As soon as price is very close to 2,116.48 this wave count looks at the possibility of a trend change.
The next wave down for this wave count would be a strong third wave at primary wave degree.
Minor wave 4 is now over as a running contracting triangle. Extend the triangle trend lines out. The point in time at which they cross over sometimes sees a trend change; sometimes this is where the fifth wave to follow a fourth wave triangle ends. This point in time is now the 19th of April which would see overall upwards movement continue for a further two sessions, so minor wave 5 would total a Fibonacci five sessions. At this stage, with minute waves iii, iv and v still yet to complete, this does not look right anymore. It may take a little longer.
The target is for intermediate wave (C) to end just above the end of intermediate wave (A) at 2,116.48, so that a truncation is avoided.
Redraw the channel about the impulse of intermediate wave (C) using Elliott’s second technique: draw the first trend line from the ends of the second to fourth waves at minor degree, then place a parallel copy on the end of minor wave 3. Minor wave 5 may end midway within the channel. When this channel is breached by downwards movement, that will be the earliest indication of a possible end to primary wave 2.
Because expanded flats do not fit nicely within trend channels, a channel about their C waves may be used to indicate when the expanded flat is over. After a breach of the lower edge of the channel, if price then exhibits a typical throwback to the trend line, then it may offer a perfect opportunity to join primary wave 3 down. This does not always happen, so if it does in this case take the opportunity.
Within minor wave 5 no second wave correction may move beyond the start of its first wave below 2,039.74.
It is possible that minor wave 5 was over at for this week. But this would mean intermediate wave (C) would be truncated by 28.64 points. Such a truncation is possible, but still highly unusual because it is quite large and so this idea has a very low probability. It is still more likely that intermediate wave (C) will continue higher. If the invalidation point at 2,039.74 is breached by downwards movement only then I would label primary wave 2 over.
HOURLY CHART
Click chart to enlarge.
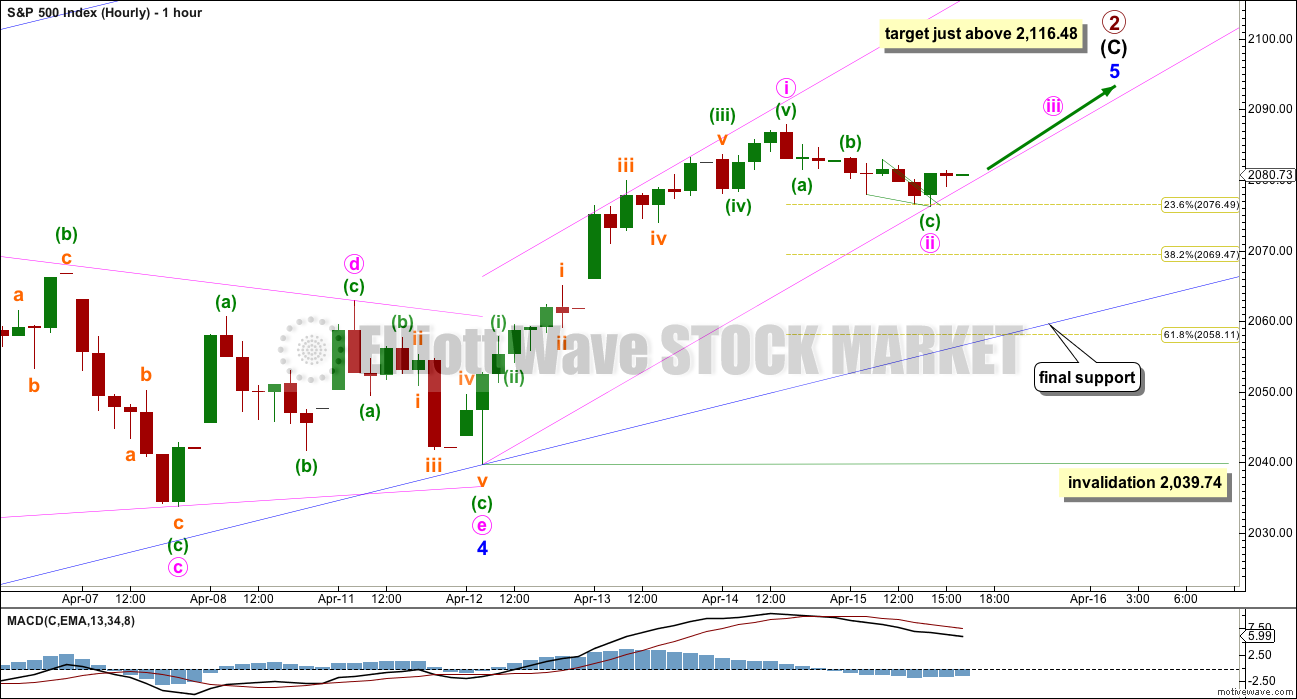
Minute wave i is a complete impulse. Minute wave ii is a complete zigzag. The subdivisions fit on the five minute chart; minuette wave (c) there subdivides neatly as an ending contracting diagonal with a tiny overshoot of the 1-3 trend line.
If minute wave ii is over here, then it is a very shallow second wave correction ending only at the 0.236 Fibonacci ratio. I am considering it most likely over only because of its duration.
If minute wave ii is over as labelled, then along the way up for minute wave iii corrections should find support at the lower edge of the pink base channel. If minute wave ii moves lower, then redraw the base channel.
If minute wave ii continues lower, then the most likely targets for it to end would be the 0.382 Fibonacci ratio at 2,069 or the 0.618 Fibonacci ratio at 2,058. Because the lower target would mean the lower edge of the blue channel is breached, this is most unlikely. While minor wave 5 continues, the lower edge of that channel should provide very strong support and should not be breached.
A breach of the dark blue channel to the downside would be an early indication of a possible trend change and the end of primary wave 2.
The target remains just above 2,116.48 for intermediate wave (C) to avoid a truncation. When minute waves iii and iv are complete, then the target may be calculated at minute degree. At that stage, it may change or widen to a small zone.
Minute wave ii may not move beyond the start of minute wave i below 2,039.74.
ALTERNATE WEEKLY CHART
Click chart to enlarge.
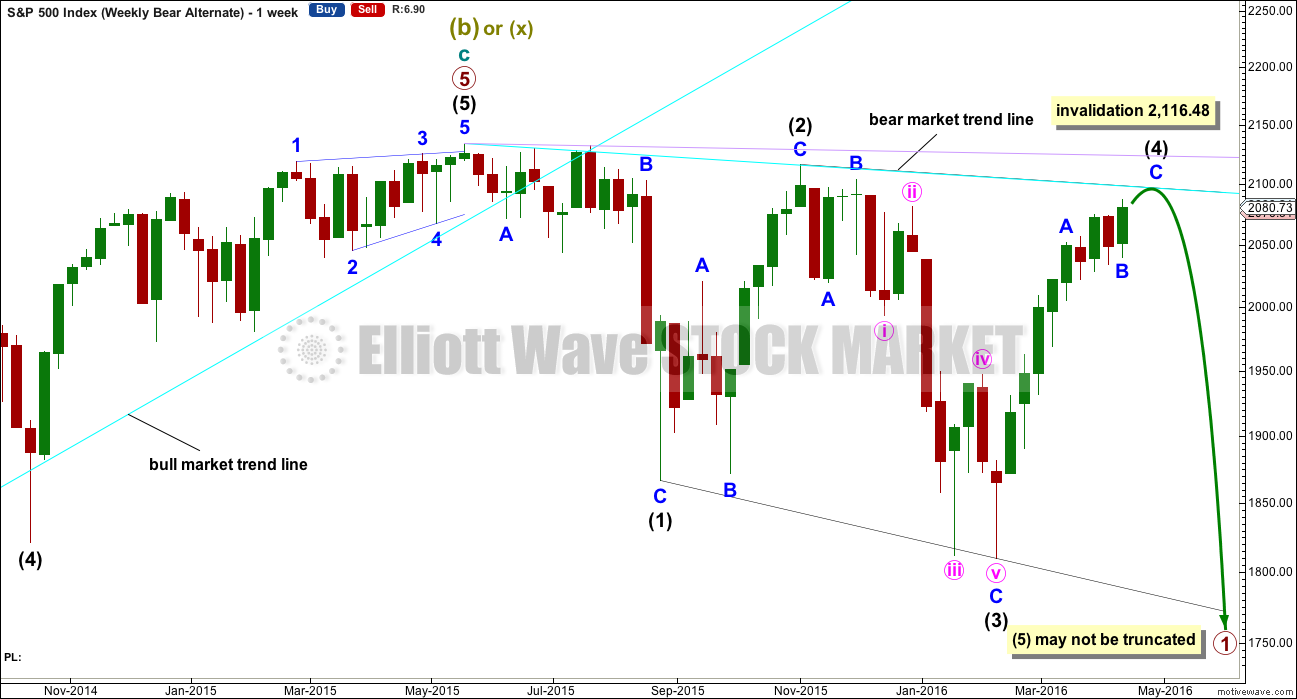
Primary wave 1 may subdivide as one of two possible structures. The main bear count sees it as a complete impulse. This alternate sees it as an incomplete leading diagonal.
The diagonal must be expanding because intermediate wave (3) is longer than intermediate wave (1). Leading expanding diagonals are not common structures, so that reduces the probability of this wave count to an alternate.
Intermediate wave (4) may continue higher now and may find resistance at the bear market trend line.
ALTERNATE DAILY CHART
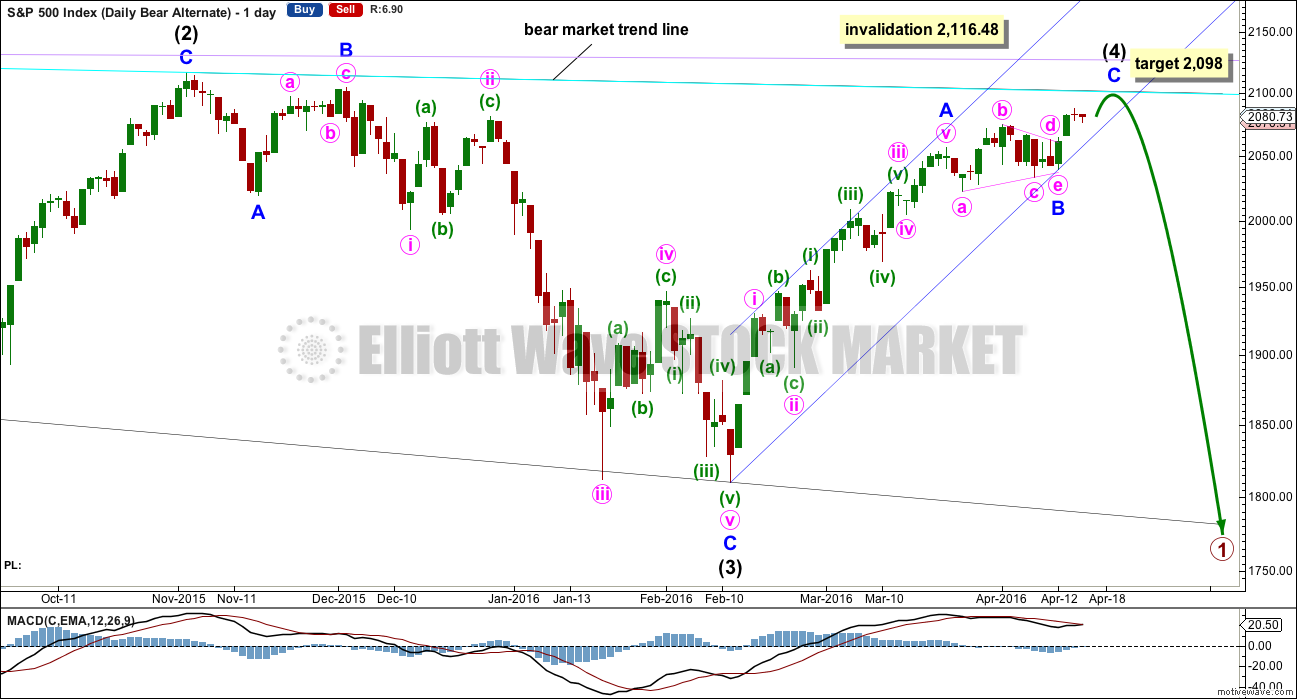
Click chart to enlarge.
Within a leading diagonal, subwaves 2 and 4 must subdivide as zigzags. Subwaves 1, 3 and 5 are most commonly zigzags but may also sometimes appear to be impulses.
Intermediate wave (3) down fits best as a zigzag.
In a diagonal the fourth wave must overlap first wave price territory. The rule for the end of a fourth wave is it may not move beyond the end of the second wave.
Expanding diagonals are not very common. Leading expanding diagonals are less common.
Intermediate wave (4) must be longer than intermediate wave (2), so it must end above 2,059.57. This minimum has been met. The trend lines diverge.
The triangle is seen as minor wave B. Intermediate wave (4) now has a clearer three wave look to it.
At 2,098 minor wave C would reach 0.236 the length of minor wave A. Intermediate wave (4) would find resistance at the bear market trend line, and price would stop very close to the round number of 2,100. This would have the right look for this wave count.
Leading diagonals may not have truncated fifth waves. Intermediate wave (5) would most likely be a zigzag, must end below 1,810.10, and must be longer in length than intermediate wave (3) which was 306.38 points.
BULL ELLIOTT WAVE COUNT
WEEKLY CHART
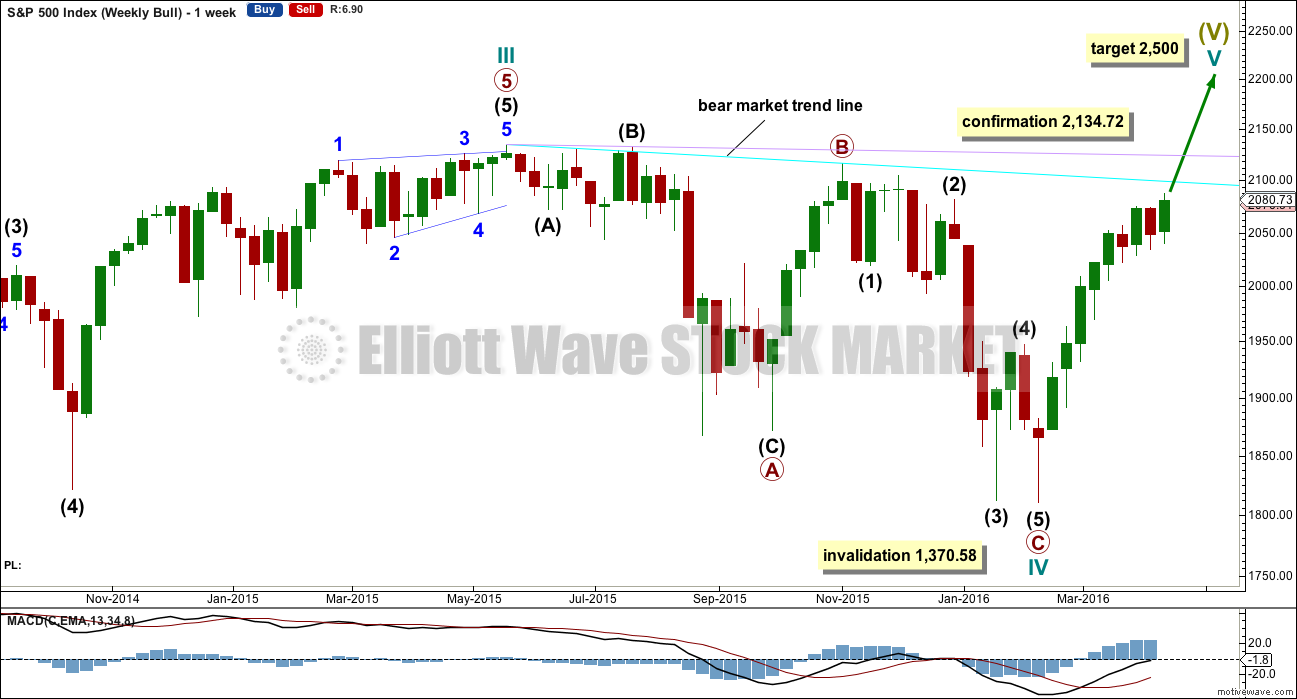
Click chart to enlarge.
Cycle wave II was a shallow 0.41 zigzag lasting three months. Cycle wave IV may be a complete shallow 0.19 regular flat correction, exhibiting some alternation with cycle wave II.
At 2,500 cycle wave V would reach equality in length with cycle wave I.
Price remains below the final bear market trend line. This line is drawn from the all time high at 2,134.72 to the swing high labelled primary wave B at 2,116.48 on November 2015. This line is drawn using the approach outlined by Magee in the classic “Technical Analysis of Stock Trends”. To use it correctly we should assume that a bear market remains intact until this line is breached by a close of 3% or more of market value. In practice, that price point would be a new all time high which would invalidate any bear wave count.
This wave count requires price confirmation with a new all time high above 2,134.72.
While price has not made a new high, while it remains below the final bear market trend line and while technical indicators point to weakness in upwards movement, this very bullish wave count comes with a strong caveat. I do not have confidence in it.
DAILY CHART

Click chart to enlarge.
Intermediate wave (2) is seen as an atypical double zigzag. It is atypical in that it moves sideways. Double zigzags should have a clear slope against the prior trend to have the right look. Within a double zigzag, the second zigzag exists to deepen the correction when the first zigzag does not move price deep enough. Not only does this second zigzag not deepen the correction, it fails to move at all beyond the end of the first zigzag. This structure technically meets rules, but it looks completely wrong. This gives the wave count a low probability.
If the bull market has resumed, it must begin with a five wave structure upwards at the daily and weekly chart level. So far that is incomplete.
At 2,160 minor wave 5 would reach equality in length with minor wave 1.
Within minor wave 5, no second wave correction may move beyond the start of its first wave below 2,039.74.
TECHNICAL ANALYSIS
DAILY CHART
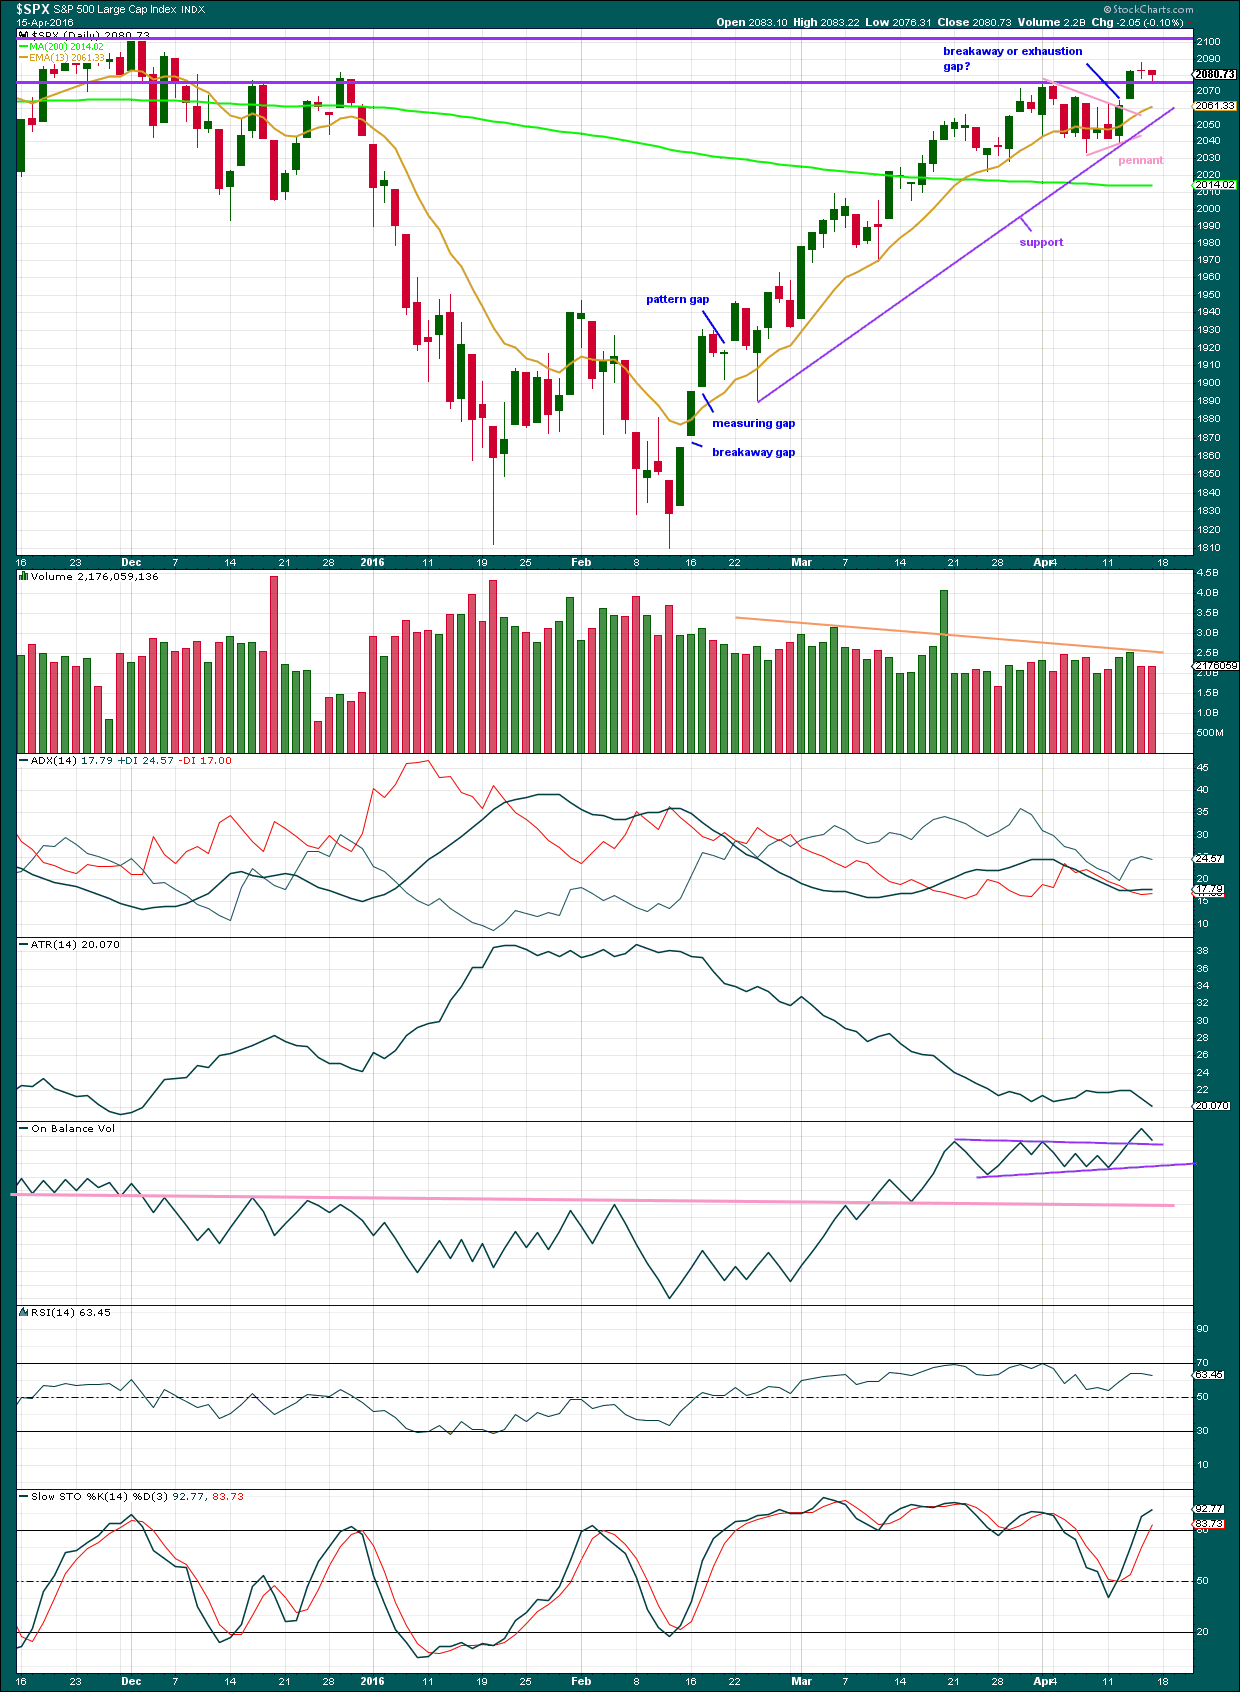
Click chart to enlarge. Chart courtesy of StockCharts.com.
Volume data on StockCharts is different to that given from NYSE, the home of this index. Comments on volume will be based on NYSE volume data when it differs from StockCharts.
Price has been trending upwards for 44 days. The 13 day moving average is mostly showing where downwards corrections are finding support. It looks like a small pennant pattern has completed and is followed by an upwards breakout with a gap and an increase in volume. The trend has resumed after a few days of consolidation.
If the gap is closed within a very few days, then it may be an exhaustion gap. If it is not closed within a few days, it may be a breakaway gap from the pennant pattern. At this stage, because the gap appears after a small pattern and on a day with higher volume, it should provide support short term. Any short term buy positions may have their stops moved up to just below the lower edge of the gap.
Price found resistance at the red horizontal line about 2,080 and is now finding support there. This line may serve to hold up the small correction of the last two days.
As price moves upwards, it comes overall with declining volume. The trend is weak. It is not supported by volume, so is unsustainable. The last two red daily candlesticks come with lighter volume than the prior upwards days. The small fall in price is not supported by volume, so this movement is most likely a small countertrend movement.
ADX is today slightly rising indicating the upwards trend has most likely returned. ATR no longer supports ADX. ATR is declining.
ATR declined for most of this upwards trend. This is not normal for a trend and it indicates weakness.
On Balance Volume is giving a clear bullish signal, albeit a rather weak one. The clear break above the upper purple trend line supports the Elliott wave count short term in expecting more upwards movement. The signal is weak because the line is short held and only tested twice. However, it is close to horizontal, so it has some technical significance. OBV is coming down close to the purple line. There is little room left for OBV to move lower; this trend line may serve to hold the small downwards movement from price for Thursday and Friday to about here.
OBV needs to break below the pink line for OBV to give a strong bearish signal, but before that happens breaks below the purple lines would provide weak bearish signals.
RSI has not managed to reach overbought during this trend. Price made a new high today within this current trend yet RSI has not made a corresponding new high. There is now divergence between price and RSI indicating weakness in price.
Stochastics also shows strong divergence with price. This also is indicating price is weak.
INVERTED VIX DAILY CHART
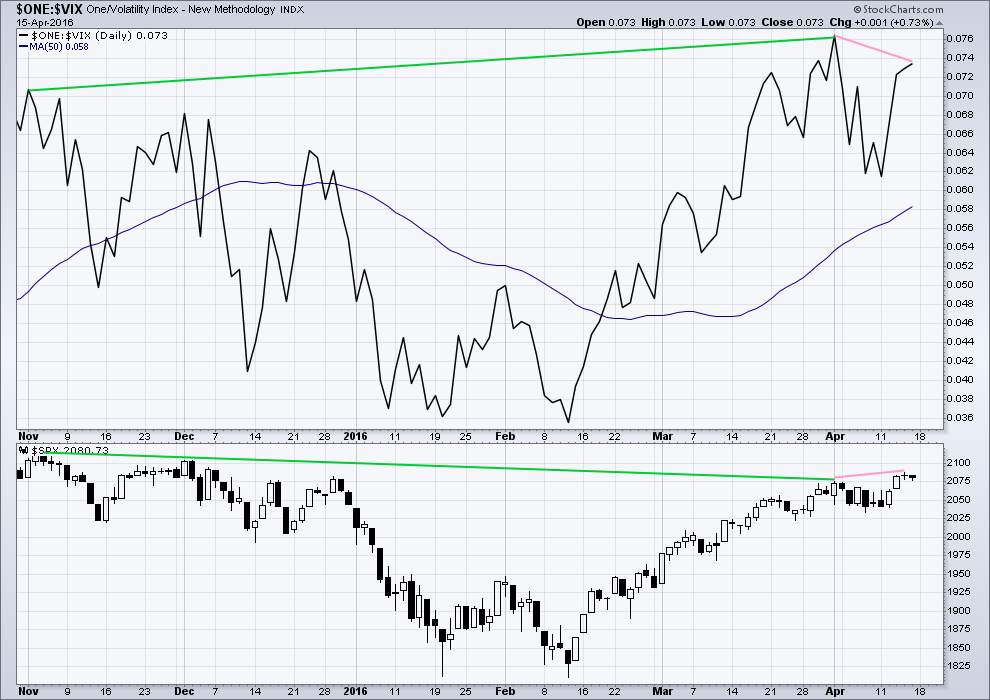
Click chart to enlarge. Chart courtesy of StockCharts.com.
Volatility declines as inverted VIX climbs. This is normal for an upwards trend.
What is not normal here is the divergence over a reasonable time period between price and inverted VIX (green lines). The decline in volatility is not translating to a corresponding increase in price. Price is weak. This divergence is bearish.
Price made a new short term high, but VIX has failed to make a corresponding high (pink lines). This is regular bearish divergence. It indicates further weakness in the trend.
For Friday’s session price made slight new lows and overall moved lower for the session completing a small red candlestick. But inverted VIX moved higher for the session, which is further hidden bearish divergence. The decline in volatility for the session was not able to be translated into a rise for price; price is weak.
BULLISH PERCENT DAILY CHART
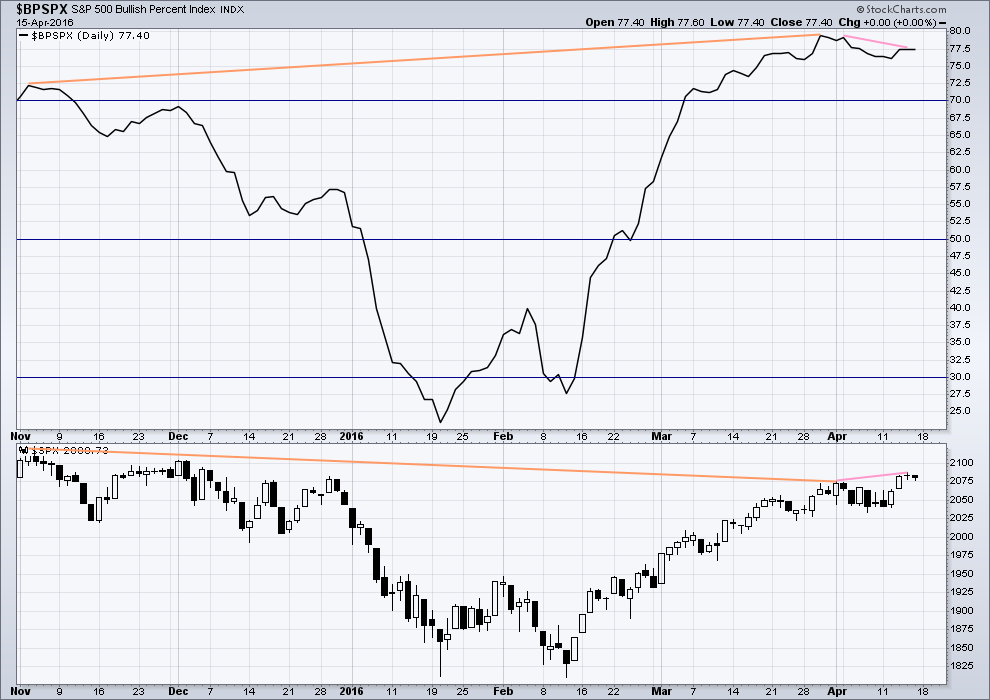
Click chart to enlarge. Chart courtesy of StockCharts.com.
There is strong hidden bearish divergence between price and the Bullish Percent Index (orange lines). The increase in the percentage of bullish traders is more substantial than the last high in price. As bullish percent increases, it is not translating to a corresponding rise in price. Price is weak.
This looks like an overabundance of optimism which is not supported by price.
As price made a new short term high today, BP did not (pink lines). This is regular bearish divergence. It indicates weakness to the upwards trend.
ADVANCE DECLINE LINE
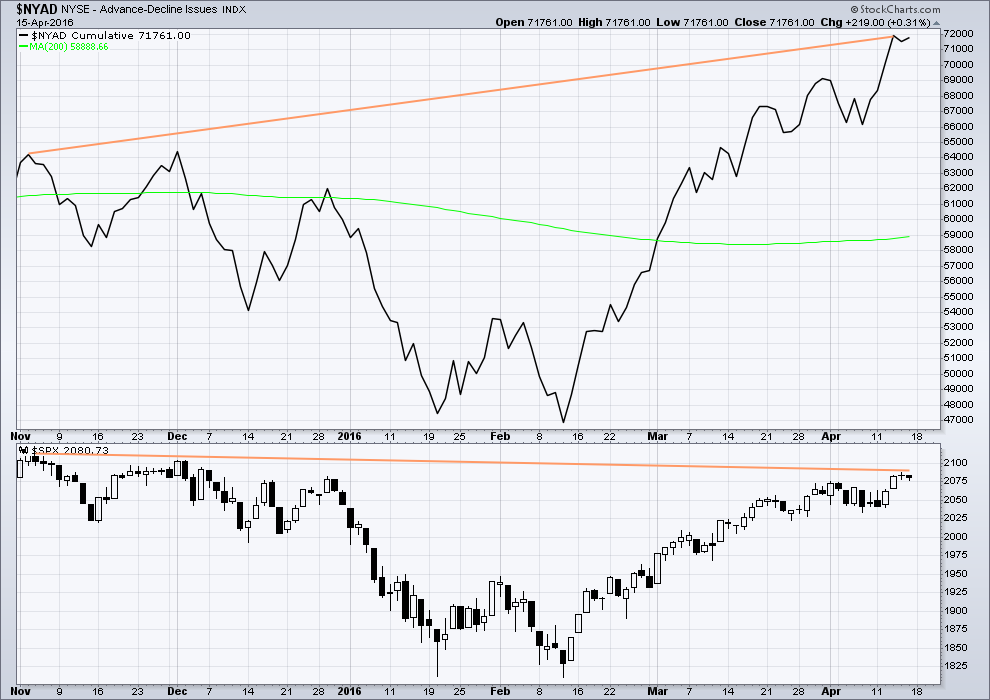
Click chart to enlarge. Chart courtesy of StockCharts.com.
With the AD line increasing, this indicates the number of advancing stocks exceeds the number of declining stocks. This indicates that there is breadth to this upwards movement.
From November 2015 to now, the AD line is making new highs while price has so far failed to make a corresponding new high. This indicates weakness in price; the increase in market breadth is unable to be translated to increase in price.
It remains to be seen if price can make new highs beyond the prior highs of 3rd November, 2015. If price can manage to do that, then this hidden bearish divergence will no longer be correct, but the fact that it is so strong at this stage is significant. The AD line will be watched daily to see if this bearish divergence continues or disappears.
For Friday’s session the AD line advanced indicating more stocks were advancing than declining. However, this breadth was unable to be translated into a rise in price. Overall, price moved lower for a very small range day which made a slight new low. This indicates further short term weakness in price.
The 200 day moving average for the AD line is now increasing. This alone is not enough to indicate a new bull market. During November 2015 the 200 day MA for the AD line turned upwards and yet price still made subsequent new lows.
DOW THEORY
I am choosing to use the S&P500, Dow Industrials, Dow Transportation, Nasdaq and the Russell 2000 index. Major swing lows are noted below. So far the Industrials, Transportation and Russell 2000 have made new major swing lows. None of these indices have made new highs.
I am aware that this approach is extremely conservative. Original Dow Theory has already confirmed a major trend change as both the industrials and transportation indexes have made new major lows.
At this stage, if the S&P500 and Nasdaq also make new major swing lows, then my modified Dow Theory would confirm a major new bear market. At that stage, my only wave count would be the bear wave count.
The lows below are from October 2014. These lows were the last secondary correction within the primary trend which was the bull market from 2009.
These lows must be breached by a daily close below each point.
S&P500: 1,821.61
Nasdaq: 4,117.84
DJIA: 15,855.12 – close below on 25th August 2015.
DJT: 7,700.49 – close below on 24th August 2015.
Russell 2000: 1,343.51 – close below on 25th August 2015.
This analysis is published @ 10:09 p.m. EST on 16th April, 2016.
[Note: Analysis is public today for promotional purposes. Member comments and discussion will remain private.]
Will do FTSE analysis later today (Sunday EST, Monday my time, I’m livin’ in the future!)
But first…. it’s 3-4 ft and ripping offshore, gotta go catch some waves! (only if I can find a good rip to get my 9’6″ longboard out in that big swell though)
Surfed 3 hours yesterday, I have my zen back 🙂
No 3-4 ft though, that was too messy. I found a super glassy clean 1.5 ft peeling all the way to the beach. Quality waves over size.
Kind of like trading. A quality trade; good set up, low risk, high probability, over a potential huge win.
No agreement on oil production freeze and yen heading higher. This usually portends a market decline but nothing on futures yet…we should know shortly…
OK! One more week or so for the bulls and then us bears get our shot!
Apologies to members for the downtime on our websites today. We are having some problems, but our fabulous hosting service are onto it. All should be normal by tomorrow.
Thank you for your patience.
S&P is public this end of week, and I’ll be doing FTSE analysis for members only tomorrow.
So who is first? Does Lara count? I think she should count because she gives us such good EW counts! So, I gladly take an honorary second place today.
Great analysis today, Lara. You have been guiding us ever so expertly through this current second wave. I am excited to finally see it ending.
Come on channel break!
Oh yeah, I didn’t mean to be first actually.
But I didn’t think anyone else would be able to access comments so I wanted to jump in with the message about the sites having problems.
We think it should be all fixed now. So if anyone is still having problems with accessing your content please let me know.