
Upwards movement was again expected.
Summary: This is still a bear market rally until proven otherwise. A final fifth wave up is underway with a target just above 2,116.48. It may end in just three more sessions on 19th April, 2016. The upwards trend is very weak.
To see last published monthly charts click here.
To see how each of the bull and bear wave counts fit within a larger time frame see the Grand Supercycle Analysis.
To see detail of the bull market from 2009 to the all time high on weekly charts, click here.
New updates to this analysis are in bold.
BEAR ELLIOTT WAVE COUNT
WEEKLY CHART
Click chart to enlarge.
This bear wave count fits better than the bull with the even larger picture, super cycle analysis found here. It is also well supported by regular technical analysis at the monthly chart level.
Importantly, there is no lower invalidation point for this wave count. That means there is no lower limit to this bear market.
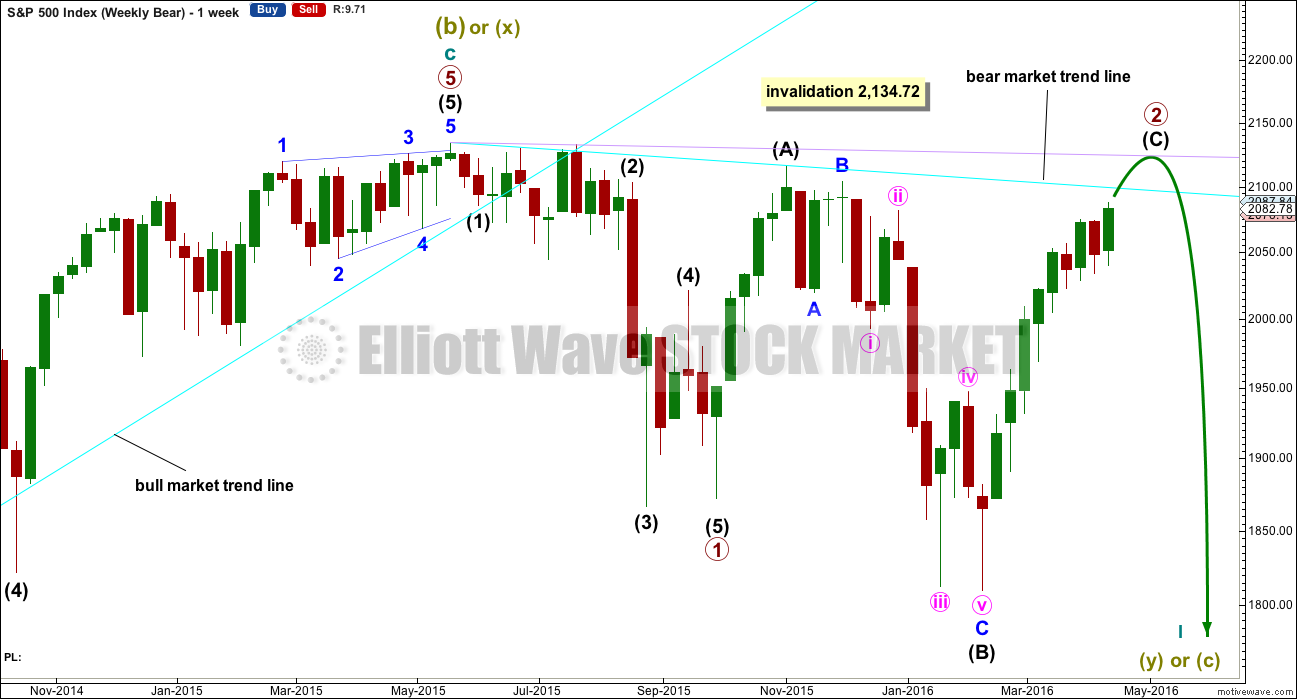
Primary wave 1 may be complete and may have lasted 19 weeks, two short of a Fibonacci 21. So far primary wave 2 is in its 27th week. It looks unlikely to continue for another 7 weeks to total a Fibonacci 34, so it may end in about one to two weeks time. This would still give reasonable proportion between primary waves 1 and 2. Corrections (particularly more time consuming flat corrections) do have a tendency to be longer lasting than impulses.
Primary wave 2 may be unfolding as an expanded or running flat. Within primary wave 2, intermediate wave (A) was a deep zigzag (which will also subdivide as a double zigzag). Intermediate wave (B) fits perfectly as a zigzag and is a 1.21 length of intermediate wave (A). This is within the normal range for a B wave of a flat of 1 to 1.38.
Intermediate wave (C) is likely to make at least a slight new high above the end of intermediate wave (A) at 2,116.48 to avoid a truncation and a very rare running flat. However, price may find very strong resistance at the final bear market trend line. This line may hold price down and it may not be able to avoid a truncation. A rare running flat may occur before a very strong third wave down.
If price moves above 2,116.48, then the new alternate bear wave count would be invalidated. At that stage, if there is no new alternate for the bear, then this would be the only bear wave count.
Primary wave 2 may not move beyond the start of primary wave 1 above 2,134.72.
DAILY CHART
Click chart to enlarge.
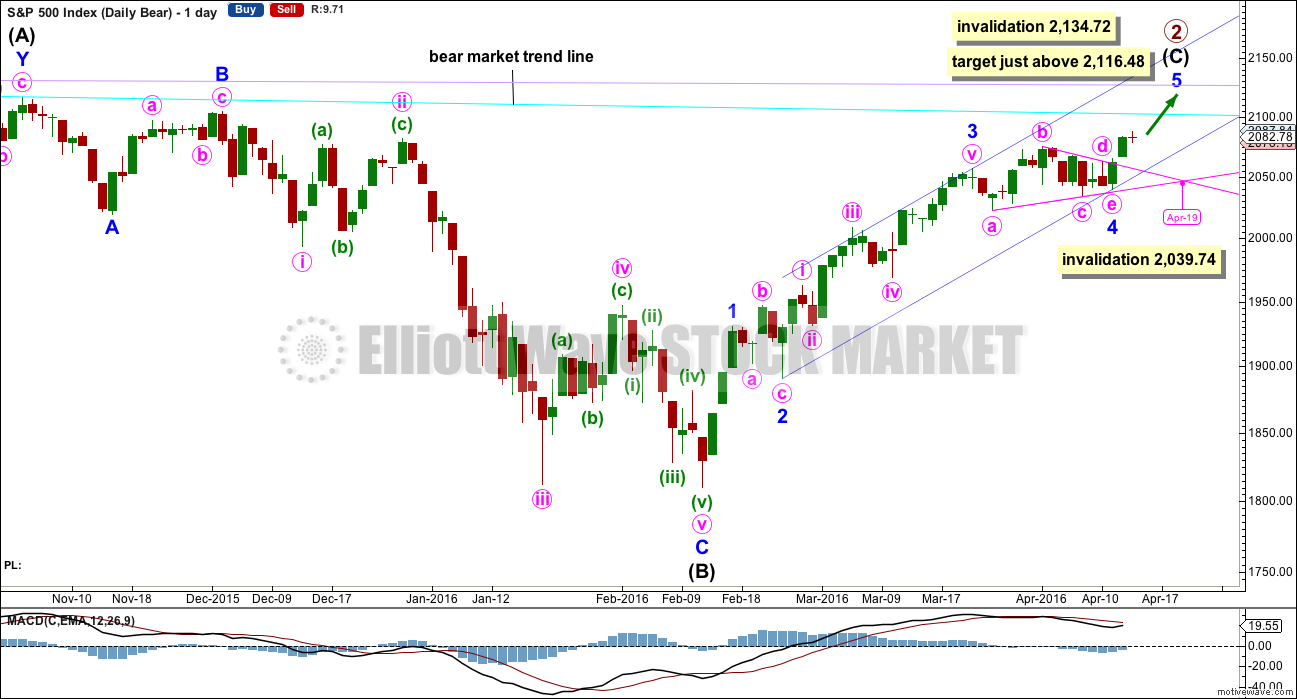
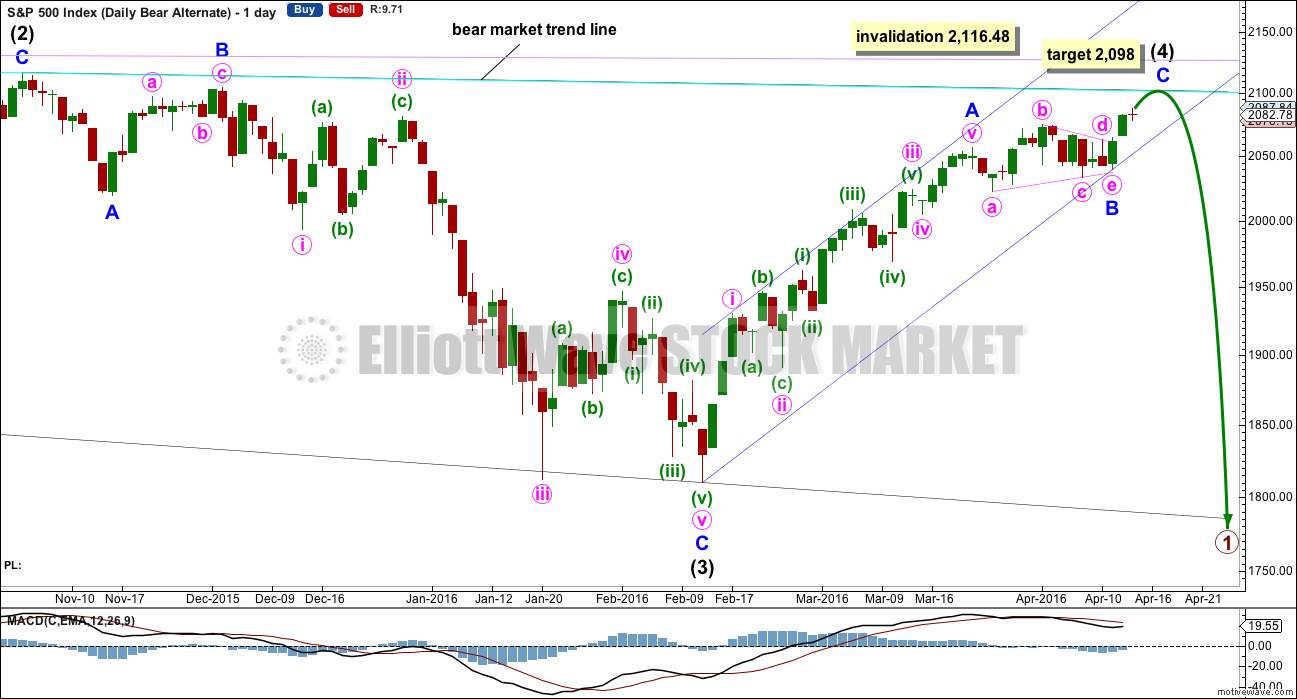
Intermediate wave (A) fits as a single or double zigzag.
Intermediate wave (B) fits perfectly as a zigzag. There is no Fibonacci ratio between minor waves A and C.
Intermediate wave (C) must subdivide as a five wave structure. It is unfolding as an impulse.
Intermediate wave (C) does not have to move above the end of intermediate wave (A) at 2,116.48, but it is likely to do so to avoid a truncation. If it is truncated and primary wave 2 is a rare running flat, then the truncation is not likely to be very large. As soon as price is very close to 2,116.48 this wave count looks at the possibility of a trend change.
The next wave down for this wave count would be a strong third wave at primary wave degree.
Minor wave 4 is now over as a running contracting triangle. Extend the triangle trend lines out. The point in time at which they cross over sometimes sees a trend change; sometimes this is where the fifth wave to follow a fourth wave triangle ends. This point in time is now the 19th of April which would see overall upwards movement continue for a further three sessions, so minor wave 5 would total a Fibonacci five sessions. This looks about right.
The target is for intermediate wave (C) to end just above the end of intermediate wave (A) at 2,116.48, so that a truncation is avoided.
Redraw the channel about the impulse of intermediate wave (C) using Elliott’s second technique: draw the first trend line from the ends of the second to fourth waves at minor degree, then place a parallel copy on the end of minor wave 3. Minor wave 5 may end midway within the channel. When this channel is breached by downwards movement, that will be the earliest indication of a possible end to primary wave 2.
Because expanded flats do not fit nicely within trend channels, a channel about their C waves may be used to indicate when the expanded flat is over. After a breach of the lower edge of the channel, if price then exhibits a typical throwback to the trend line, then it may offer a perfect opportunity to join primary wave 3 down. This does not always happen, so if it does in this case take the opportunity.
Within minor wave 5 no second wave correction may move beyond the start of its first wave below 2,039.74.
HOURLY CHART
Click chart to enlarge.
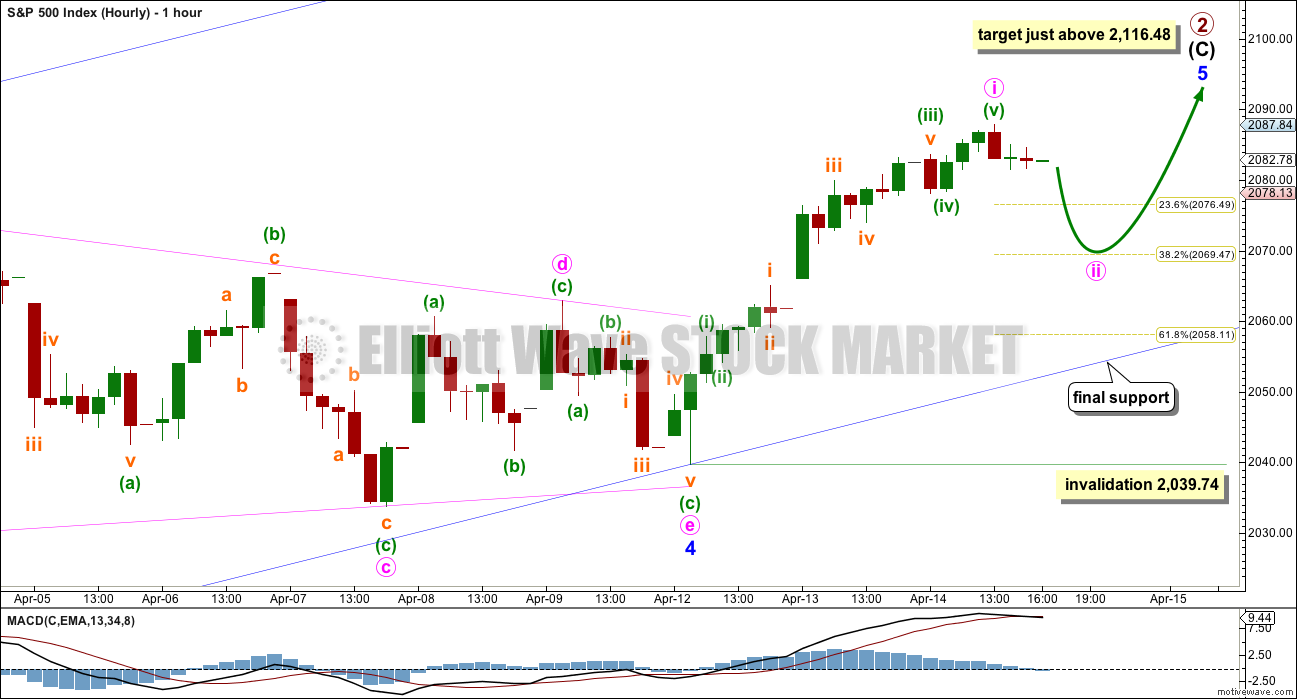
Minor wave 5 is expected to be shorter in length than minor wave 1 but longer in duration. Minor wave 1 lasted only three days. Minor wave 5 is expected to last a Fibonacci five days in total. So far it has lasted two.
After spending some time today on the five minute chart, it looks like minute wave i was over at today’s high. The subdivisions fit perfectly at the five minute chart level and at that time frame it has the right look. At the hourly chart level, it looks reasonable but not perfect. That’s okay. I’ll go with the time frame which has the best look.
Minute wave ii may unfold lower tomorrow, but if minor wave 5 is to end in just three more sessions, then minute wave ii should be over quickly. It may produce a long lower shadow for green daily candlestick.
Minute wave ii may be over already. If tomorrow begins with a new high, that would be the expectation. At that stage, minute wave iii upwards may be underway most likely and upwards momentum should show some increase.
If minute wave ii continues lower tomorrow, then it may end about either the 0.382 or 0.618 Fibonacci ratios of minute wave i. It may not move below the start of minute wave i at 2,039.74.
If the upwards gap from the triangle breakout is a breakaway gap, then it should not be quickly filled. This area may provide support for downwards movement while the upwards trend is intact. If this gap is filled, it may be the earliest warning of a trend change.
When minute waves iii and iv within minor wave 5 are complete, then the target will be recalculated at minute degree. At that stage, the target of just above 2,116.48 may change or widen to a small zone.
ALTERNATE WEEKLY CHART
Click chart to enlarge.
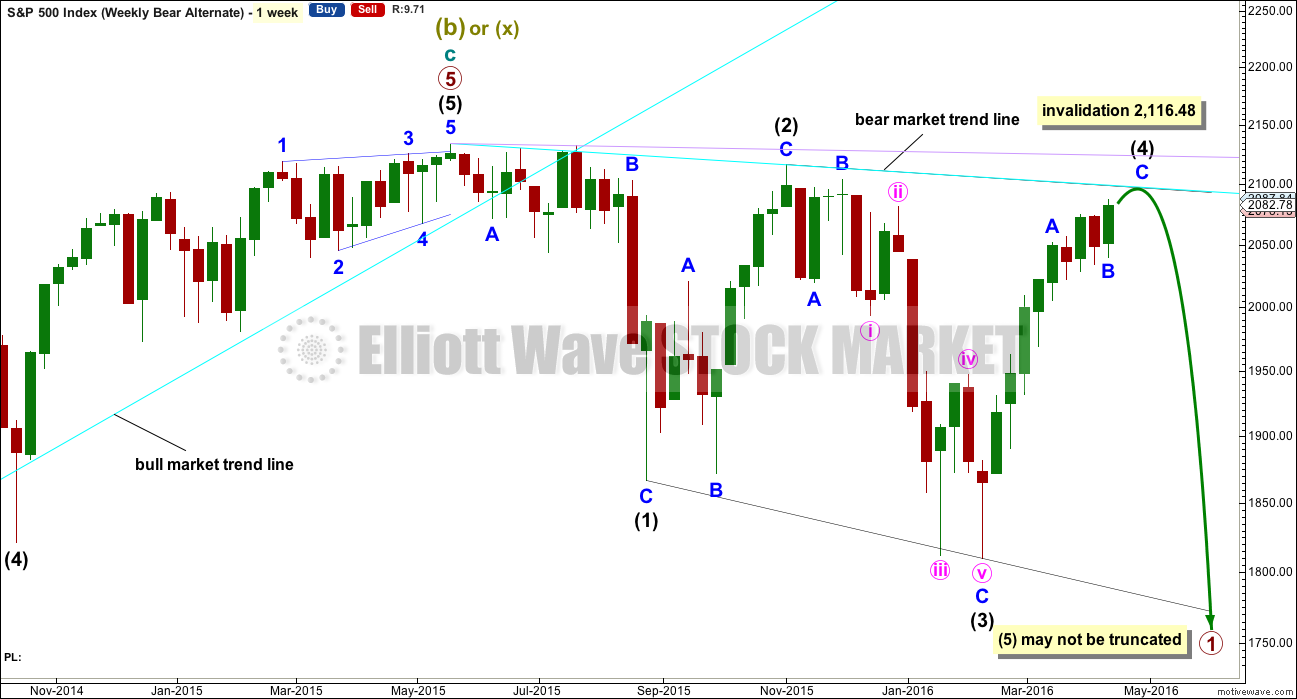
Primary wave 1 may subdivide as one of two possible structures. The main bear count sees it as a complete impulse. This alternate sees it as an incomplete leading diagonal.
The diagonal must be expanding because intermediate wave (3) is longer than intermediate wave (1). Leading expanding diagonals are not common structures, so that reduces the probability of this wave count to an alternate.
Intermediate wave (4) may continue higher now and may find resistance at the bear market trend line.
ALTERNATE DAILY CHART
Click chart to enlarge.
Within a leading diagonal, subwaves 2 and 4 must subdivide as zigzags. Subwaves 1, 3 and 5 are most commonly zigzags but may also sometimes appear to be impulses.
Intermediate wave (3) down fits best as a zigzag.
In a diagonal the fourth wave must overlap first wave price territory. The rule for the end of a fourth wave is it may not move beyond the end of the second wave.
Expanding diagonals are not very common. Leading expanding diagonals are less common.
Intermediate wave (4) must be longer than intermediate wave (2), so it must end above 2,059.57. This minimum has been met. The trend lines diverge.
The triangle is seen as minor wave B. Intermediate wave (4) now has a clearer three wave look to it.
At 2,098 minor wave C would reach 0.236 the length of minor wave A. Intermediate wave (4) would find resistance at the bear market trend line, and price would stop very close to the round number of 2,100. This would have the right look for this wave count.
Leading diagonals may not have truncated fifth waves. Intermediate wave (5) would most likely be a zigzag, must end below 1,810.10, and must be longer in length than intermediate wave (3) which was 306.38 points.
BULL ELLIOTT WAVE COUNT
WEEKLY CHART
Click chart to enlarge.
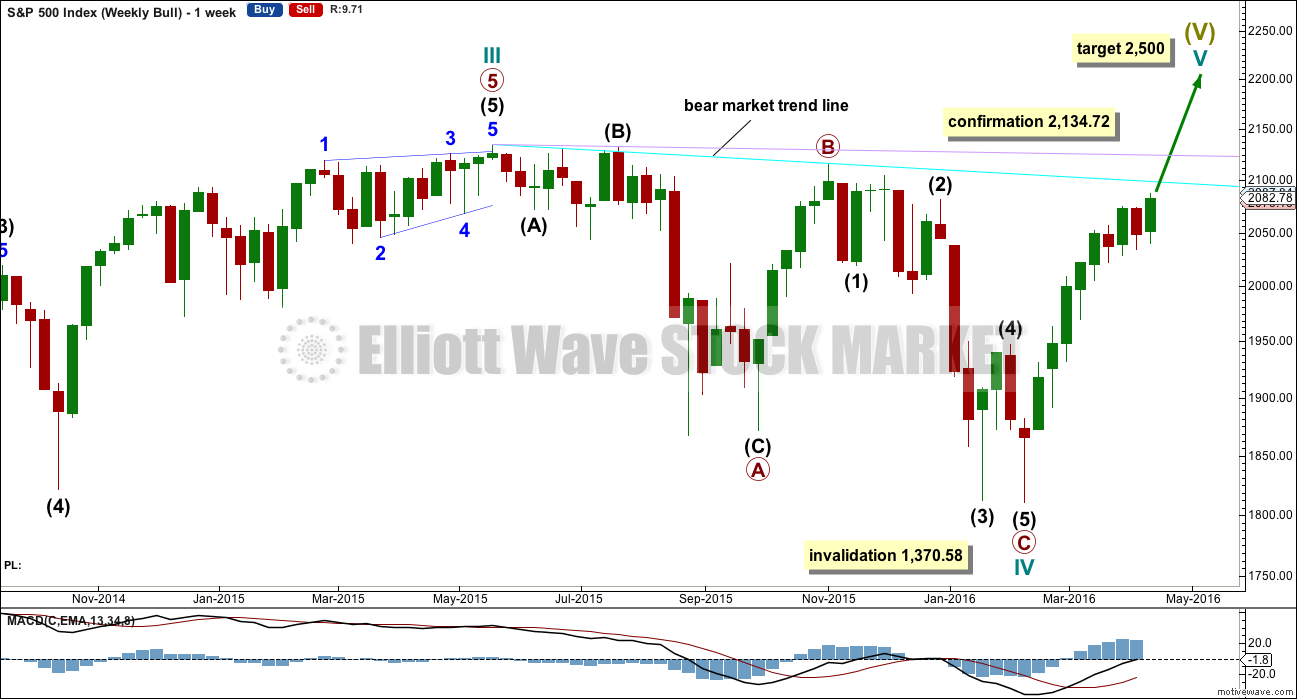
Cycle wave II was a shallow 0.41 zigzag lasting three months. Cycle wave IV may be a complete shallow 0.19 regular flat correction, exhibiting some alternation with cycle wave II.
At 2,500 cycle wave V would reach equality in length with cycle wave I.
Price remains below the final bear market trend line. This line is drawn from the all time high at 2,134.72 to the swing high labelled primary wave B at 2,116.48 on November 2015. This line is drawn using the approach outlined by Magee in the classic “Technical Analysis of Stock Trends”. To use it correctly we should assume that a bear market remains intact until this line is breached by a close of 3% or more of market value. In practice, that price point would be a new all time high which would invalidate any bear wave count.
This wave count requires price confirmation with a new all time high above 2,134.72.
While price has not made a new high, while it remains below the final bear market trend line and while technical indicators point to weakness in upwards movement, this very bullish wave count comes with a strong caveat. I do not have confidence in it.
DAILY CHART
Click chart to enlarge.
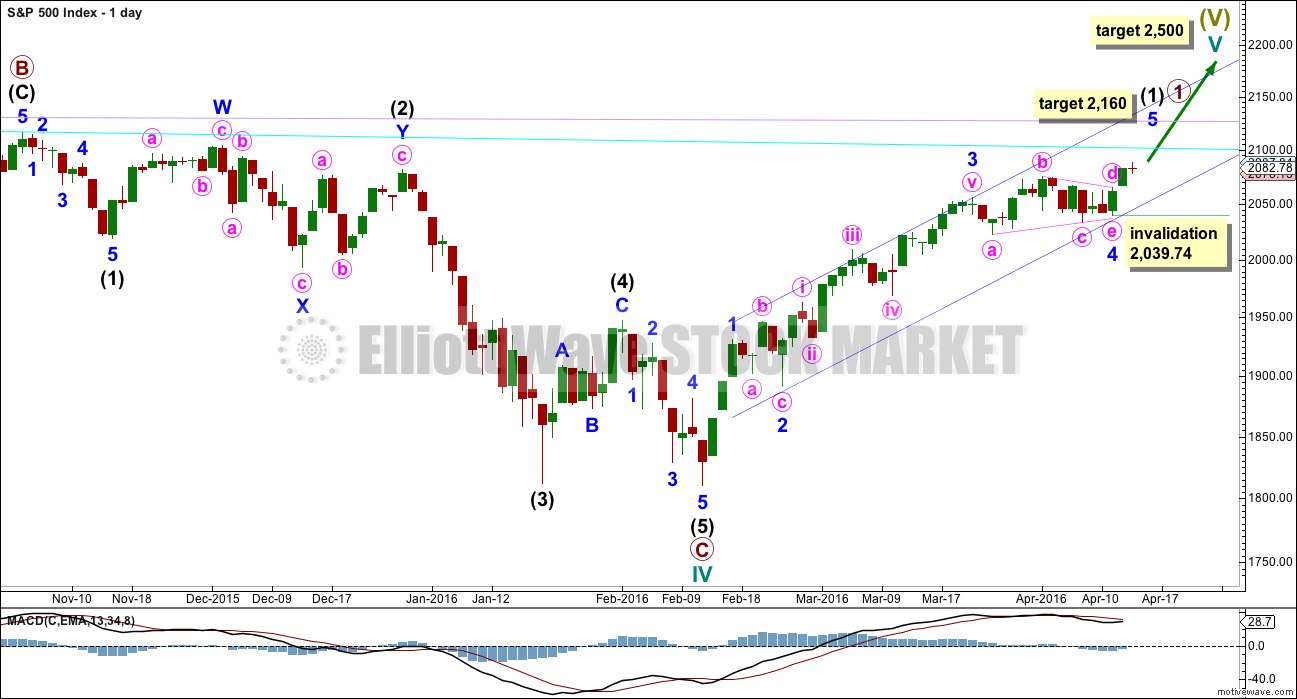
Intermediate wave (2) is seen as an atypical double zigzag. It is atypical in that it moves sideways. Double zigzags should have a clear slope against the prior trend to have the right look. Within a double zigzag, the second zigzag exists to deepen the correction when the first zigzag does not move price deep enough. Not only does this second zigzag not deepen the correction, it fails to move at all beyond the end of the first zigzag. This structure technically meets rules, but it looks completely wrong. This gives the wave count a low probability.
If the bull market has resumed, it must begin with a five wave structure upwards at the daily and weekly chart level. So far that is incomplete.
At 2,160 minor wave 5 would reach equality in length with minor wave 1.
Within minor wave 5, no second wave correction may move beyond the start of its first wave below 2,039.74.
TECHNICAL ANALYSIS
DAILY CHART
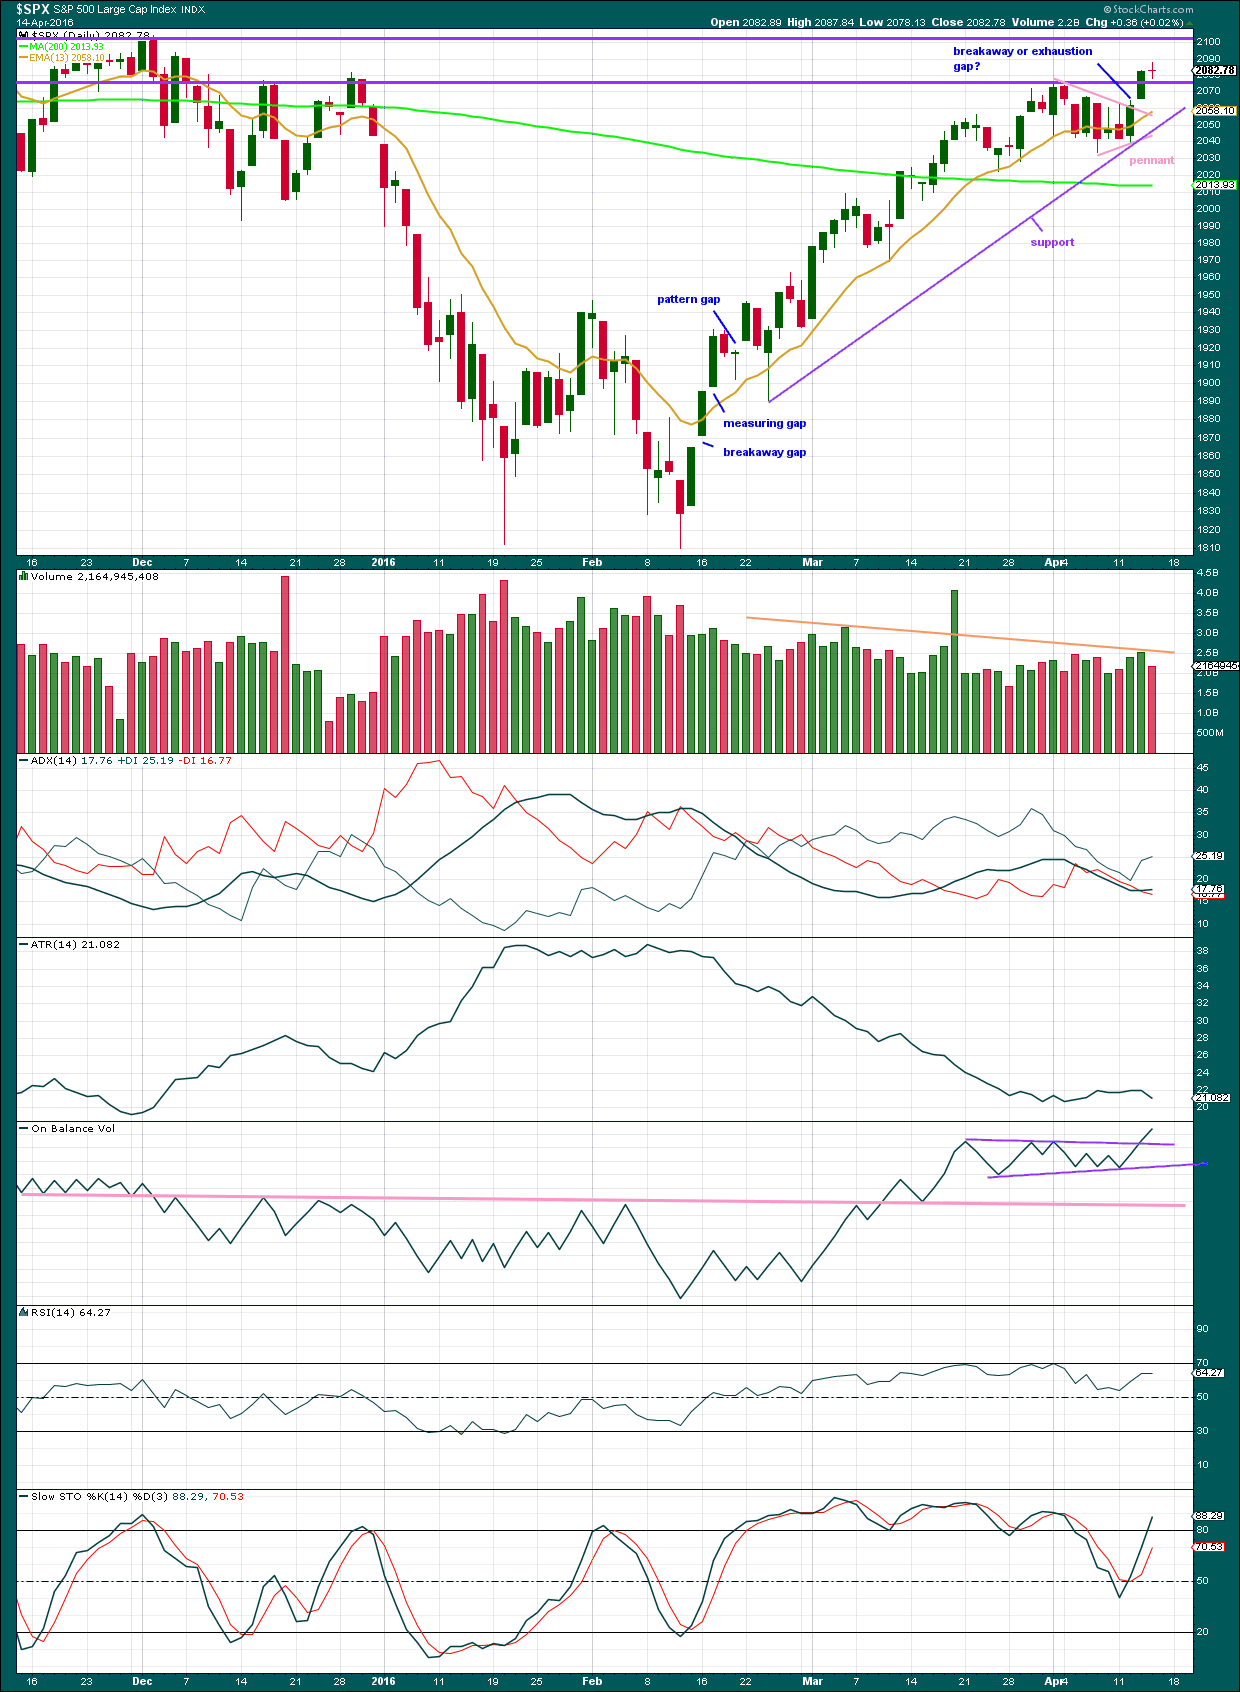
Click chart to enlarge. Chart courtesy of StockCharts.com.
Volume data on StockCharts is different to that given from NYSE, the home of this index. Comments on volume will be based on NYSE volume data when it differs from StockCharts.
Price has been trending upwards for 43 days. The 13 day moving average is mostly showing where downwards corrections are finding support. It looks like a small pennant pattern has completed and is followed by an upwards breakout with a gap and an increase in volume. The trend has resumed after a few days of consolidation.
If the gap is closed within a very few days, then it may be an exhaustion gap. If it is not closed within a few days, it may be a breakaway gap from the pennant pattern. At this stage, because the gap appears after a small pattern and on a day with higher volume, it should provide support short term. Any short term buy positions may have their stops moved up to just below the lower edge of the gap.
As price moves upwards, it comes overall with declining volume. The trend is weak. It is not supported by volume, so is unsustainable. The small red doji candlestick today comes with lighter volume than the prior two upwards days. This supports the Elliott wave count short term; it looks like a trend is intact, with a downwards day showing no support for the decline in price while upwards days are showing support from volume.
ADX is today slightly rising indicating the upwards trend has most likely returned. ATR today no longer supports ADX. ATR is declining.
ATR declined for most of this upwards trend. This is not normal for a trend and it indicates weakness.
On Balance Volume is today giving a clear bullish signal, albeit a rather weak one. The clear break above the upper purple trend line supports the Elliott wave count short term in expecting more upwards movement. The signal is weak because the line is short held and only tested twice. However, it is close to horizontal, so it has some technical significance.
OBV needs to break below the pink line for OBV to give a strong bearish signal, but before that happens breaks below the purple lines would provide weak bearish signals.
RSI has not managed to reach overbought during this trend. Price made a new high today within this current trend yet RSI has not made a corresponding new high. There is now divergence between price and RSI indicating weakness in price.
Stochastics also shows strong divergence with price. This also is indicating price is weak.
INVERTED VIX DAILY CHART
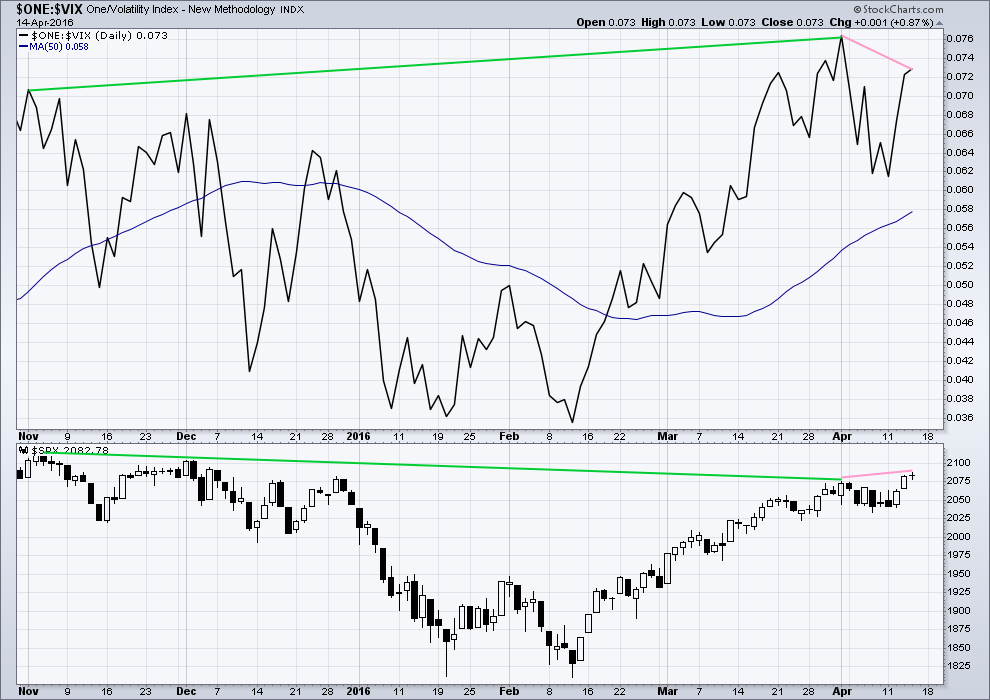
Click chart to enlarge. Chart courtesy of StockCharts.com.
Volatility declines as inverted VIX climbs. This is normal for an upwards trend.
What is not normal here is the divergence over a reasonable time period between price and inverted VIX (green lines). The decline in volatility is not translating to a corresponding increase in price. Price is weak. This divergence is bearish.
Price made a new short term high today, but VIX has failed to make a corresponding high (pink lines). This is regular bearish divergence. It indicates further weakness in the trend.
BULLISH PERCENT DAILY CHART
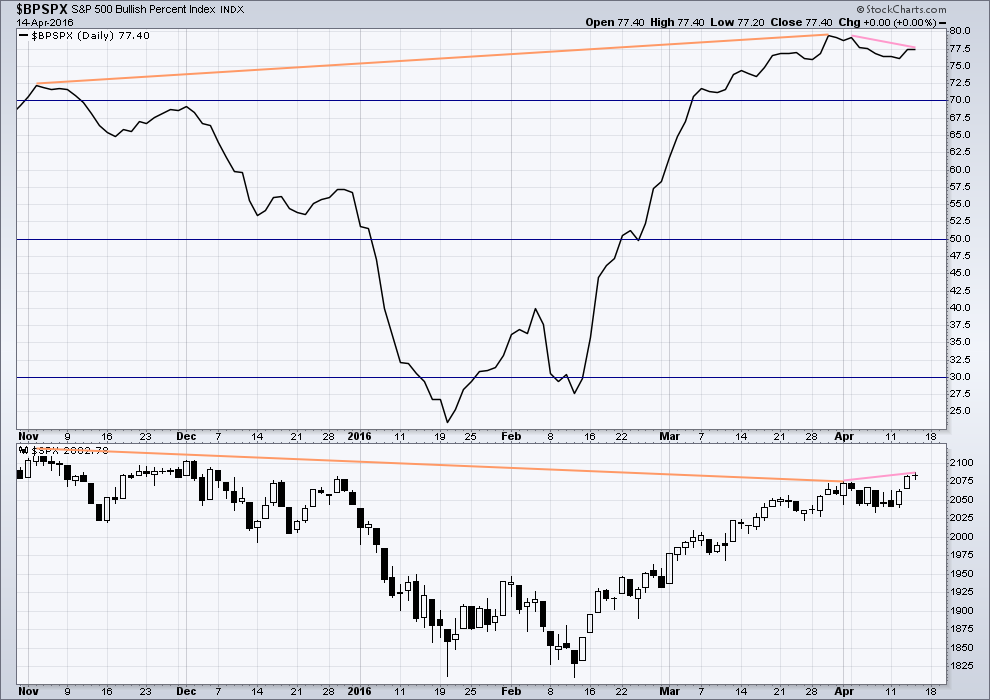
Click chart to enlarge. Chart courtesy of StockCharts.com.
There is strong hidden bearish divergence between price and the Bullish Percent Index (orange lines). The increase in the percentage of bullish traders is more substantial than the last high in price. As bullish percent increases, it is not translating to a corresponding rise in price. Price is weak.
This looks like an overabundance of optimism which is not supported by price.
As price made a new short term high today, BP did not (pink lines). This is regular bearish divergence. It indicates weakness to the upwards trend.
ADVANCE DECLINE LINE
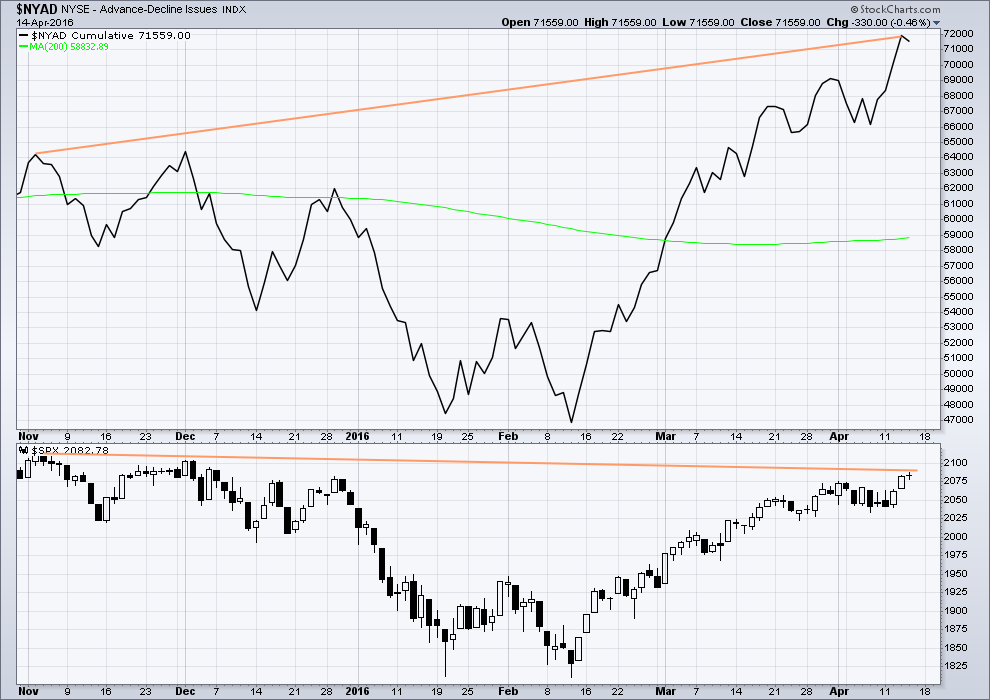
Click chart to enlarge. Chart courtesy of StockCharts.com.
With the AD line increasing, this indicates the number of advancing stocks exceeds the number of declining stocks. This indicates that there is breadth to this upwards movement.
From November 2015 to now, the AD line is making new highs while price has so far failed to make a corresponding new high. This indicates weakness in price; the increase in market breadth is unable to be translated to increase in price.
It remains to be seen if price can make new highs beyond the prior highs of 3rd November, 2015. If price can manage to do that, then this hidden bearish divergence will no longer be correct, but the fact that it is so strong at this stage is significant. The AD line will be watched daily to see if this bearish divergence continues or disappears.
The 200 day moving average for the AD line is now increasing. This alone is not enough to indicate a new bull market. During November 2015 the 200 day MA for the AD line turned upwards and yet price still made subsequent new lows.
DOW THEORY
I am choosing to use the S&P500, Dow Industrials, Dow Transportation, Nasdaq and the Russell 2000 index. Major swing lows are noted below. So far the Industrials, Transportation and Russell 2000 have made new major swing lows. None of these indices have made new highs.
I am aware that this approach is extremely conservative. Original Dow Theory has already confirmed a major trend change as both the industrials and transportation indexes have made new major lows.
At this stage, if the S&P500 and Nasdaq also make new major swing lows, then my modified Dow Theory would confirm a major new bear market. At that stage, my only wave count would be the bear wave count.
The lows below are from October 2014. These lows were the last secondary correction within the primary trend which was the bull market from 2009.
These lows must be breached by a daily close below each point.
S&P500: 1,821.61
Nasdaq: 4,117.84
DJIA: 15,855.12 – close below on 25th August 2015.
DJT: 7,700.49 – close below on 24th August 2015.
Russell 2000: 1,343.51 – close below on 25th August 2015.
This analysis is published @ 09:16 p.m. EST.
How far could the UVXY reach when the SPX reach 1840.
The last time SPX was at 1840 was mid February.
UVXY had a peak of 60 in mid February.
Another very dull day here then.
It looks like this may not be able to end on 19th April. Maybe that will be when minute iii or iv ends. A smaller trend change.
At this stage I’ll expect an end to it next week.
The targets remain the same.
Another interesting chart on buybacks. Look at how the buybacks continued higher after net income peaked in 2007. Note the decline again in net income that started in 2014 with buybacks continuing apace. Some folk never learn…!
Bought a few more SPY 208 calls expiring next week for last move up. Pretty much insurance premium….filled at 1.14
MMs very stubborn on those May 13 UVXY 25 strike calls. They are absolutely refusing to sell me anymore for under 1.00. I guess I will have to try again on Monday so will leave order GTC. Have a great week-end all!!
Vern,
I hear you as had a bid sitting the entire day but might move to 24-23 if there is a drop in the price of UVXY on Monday
Sometimes you have to be patient. I suspect we are going to see yet another 52 week low early next week in the final wave up and we should get filled at an attractive price. We may even get filled, as you said, at a lower strike for the same money so I will definitely be keeping an eye on the price action come Monday…hang in there…! 🙂
Finally a central banker saying it in clear….
http://www.marketwatch.com/story/in-interview-indias-rajan-says-monetary-policy-has-run-its-course-2016-04-15
Verne,
Any reason why VIX itself is up today about 1.5% and UVXY down over 2%?
This is why I don’t understand this instrument…
Short sellers…if we have another wave up, it will go even lower while savvy folk buy puts and so result in even more divergence from VIX. All those shorts are going to have to cover…
I believe UVXY is based on a combination of the vix futures prices for the nearest two months. So that could explain short term deviations between the vix and UVXY, as the futures curve flattens out. Here’s some info that will help to explain: http://sixfigureinvesting.com/2015/03/how-does-uvxy-work/
Yep. VIX reflects level of fear for only thirty days out, UVXY more than thirty; bottom line most folk think the market will be higher in the mid term…still a lot of short selling of the ETF makes it a lot more volatile….
I still we have at least one more pop to the upside to either complete minor five in a minute fifth up, or to start minute three up…
Was that it for minute 2 down…2076.60 a few pennies shy of the 23.6 Fib retrace….or headed lower?
Apple Tanking on production cut backs. Could this be a clue of what is to come?
Very slow low volume day thus far. Hoping for a rip to the upside to unload my remaining calls.
Vern–You are guru of UVXY, is there a reason to focus on UVXY options? VXX has much more volume and depth of options, obviously more VXX options required at lower price to compare with UVXY option. Is there any significant cost (investment) to benefit (return) difference in UVXY vs VXX options?
Same song, different beat. UVXY is a lot more volatile. Which one chooses to trade is really a matter of (risk) preference imo…
When traded precisely, returns for UVXY are more explosive, but it is a very unpredictable animal and definitely not for everyone…
Here’s a little secret, whenever you see VXX and UVXY trading for the same price it means there is a fire sale on the latter….just take a look at their trading ranges and that becomes clear… 🙂
While I am up for the moment… Do all these UVXY options work the same?
I noticed the regular and weekly. Can all these be exercised daily/anytime?
May need to exercise & sell shares simultaneously to get full value in a big pop.
Great observation!
That is one very important way in which they differ from VIX options which are European style and can only exercised at expiration.
For that reason you will often see VIX options trading for less than intrinsic value.
If you are holding calls with several weeks to expiration, they are likely to be worth a lot more a few weeks from now than they are today, even though already in the money…
If your fingers get real itchy, sell half when you have a double… 🙂
Interesting divergence with UVXY going South with the market…who are the geniuses who think selling short this animal is a great idea at this point??!! 🙂
Another 52 week low for UVXY. Partial fill on 25 strike calls. Not much of a break with the new low…I may have to pay market price if it turns higher today…yesterday’s calls going nowhere fast… 🙂
BTO May 13 UVXY 25 strike calls at limit order of 0.99, current bid/ask 0.99/1.13.
If filled today on lower prices, will add to position to lower cost basis for additional 0.25 UVXY decline for 1/2 full position. Remaining half will be via buy stop order when bid exceeds 1.00
I can’t watch this anymore… wake me up when it’s over.
How do you prefer to aroused from your slumber. With a gentle touch and soft voice or with a shout and shaking?
Shout and shaking!
You got it Joseph. That probably will not happen though until Tuesday, April 19th!
Rodney,
I suggest that we just ring the alarm bell to annouce the arrival of P3 wave..
I’m getting out the surfboard duuuuudes! 🙂
Vern,
Expecting a big P3 wave coming soon..;)
I think we are in a second wave correction. It would be great to see one more frenetic blow off top to cap this rally. That may or may not happen though. That upper BB penetration the last two days may have been the tale of the tape…
But seriously folk, have any of you heard ANYBODY talking about a possible P3 down??! I have been scouring the web for any hint or whisper of the possibility and I simply cannot find any…not even the slightest intimation…wassup wid dat??!! 🙂
Also, for options expiration, things unusually quiet today it seems…where’s everybody?!
Hang in there Joseph. I think there’s a change coming, and soon.
Someone else noted the upper BB penetration Wednesday and said something else I had not thought of; he (Jeff Clark) said it indicated “panic buying”. It is remarkable that the market did not move much higher which means there was some major distribution going on. Jeff Clark also indicated the several times recently that the lower BB has been violated which also marked the end of the then current trend. He also interestingly noted there had not been an upper BB violation in over two years. This is one of those incredible situations in which we see why VIX is not always a good gauge of actual market risk, it is rather a gauge of perceived market risk, and those two things could not be more different, especially right now.
Lara,
I am wondering if yesterday was actually the end of pink iii, rather than pink i. It just seems like there may not be enough room left to rise if we have only seen i of blue 5. Perhaps what is labeled as green i and ii was actually at pink degree. I suppose it doesn’t really matter. The low risk trade seems to be to short as we approach 2116 with a stop at the all-time high.
Thanks,
Peter
By the end of the day, it was starting to “feel” like a fourth wave correction instead of a second….just my two and a half pennies….
With this sideways movement breaching a channel which could be drawn about minute i, I don’t think so. It would be way too far out of proportion.
There’s plenty of room. Price doesn’t have to stop at the target just above 2,116.48. It can go all the way up to 2,134.72.
It can’t go above if the bear count is correct.
Note the secondary divergence of the transports average since march.the Dow theory experts would see this as a classic warning sign. It’s still also way down since it’s highs. On a time cycle basis, the seasonal cycle bottom is due around July for the djia. If the may all time highs are taken out before then and the transports start repairing their damage to me it looks like the alternative bull 5th wave up is in progress.the odds are clearly stacked against it, but we have seen this happen a several times over the last 3 years and central banks seem to get their timing for intervention pretty spot on.They only need to muster about another 500 points on the Dow for most to decide to get back on the long side for another 6 month or so rally.
Yes, that divergence is noted.
DJT also well below its bear market trend line. Further than all the other indices.
So far its been a leader.
Considering the lack of energy in this move, do you think we have another 35-40 point upmove from today’s closing price to 2116.34 level before or on Tuesday? Not saying that Tuesday HAS to be the day for the move to end but if Tuesday is the day the target is reached, i don’t think there would be much time for retracements to occur before achieving that target. Thoughts?
Yes, that is what I’m expecting.
The first upwards day had a range over 20 points as did the second upwards day.
Today was pretty small, that’s okay. Trends are often interspersed with quiet days.
I see no reason why the S&P can’t move up 35 points in three days.
What’s up Doc?
woo hoo