
Upwards movement was expected.
Classic technical analysis changes the Elliott wave count at the hourly chart level.
Summary: This is still a bear market rally until proven otherwise. A final fifth wave up is required to complete the structure. A new high reasonably above 2,075.07 would confirm a fifth wave is underway, with a target just above 2,116.48. It may end on 22nd April, 2016.
To see last published monthly charts click here.
To see how each of the bull and bear wave counts fit within a larger time frame see the Grand Supercycle Analysis.
To see detail of the bull market from 2009 to the all time high on weekly charts, click here.
New updates to this analysis are in bold.
BEAR ELLIOTT WAVE COUNT
WEEKLY CHART
Click chart to enlarge.
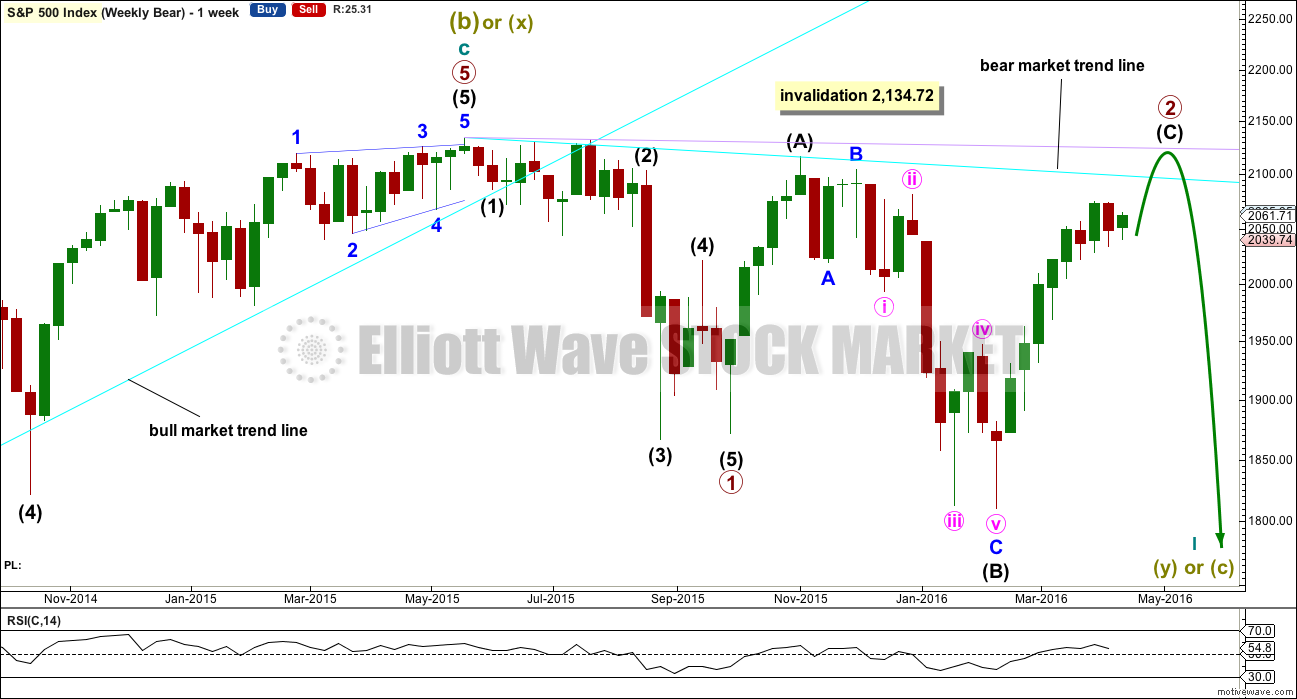
This bear wave count fits better than the bull with the even larger picture, super cycle analysis found here. It is also well supported by regular technical analysis at the monthly chart level.
Importantly, there is no lower invalidation point for this wave count. That means there is no lower limit to this bear market.
Primary wave 1 may be complete and may have lasted 19 weeks, two short of a Fibonacci 21. So far primary wave 2 is in its 27th week. It looks unlikely to continue for another 7 weeks to total a Fibonacci 34, so it may end in about one to two weeks time. This would still give reasonable proportion between primary waves 1 and 2. Corrections (particularly more time consuming flat corrections) do have a tendency to be longer lasting than impulses.
Primary wave 2 may be unfolding as an expanded or running flat. Within primary wave 2, intermediate wave (A) was a deep zigzag (which will also subdivide as a double zigzag). Intermediate wave (B) fits perfectly as a zigzag and is a 1.21 length of intermediate wave (A). This is within the normal range for a B wave of a flat of 1 to 1.38.
Intermediate wave (C) is likely to make at least a slight new high above the end of intermediate wave (A) at 2,116.48 to avoid a truncation and a very rare running flat. However, price may find very strong resistance at the final bear market trend line. This line may hold price down and it may not be able to avoid a truncation. A rare running flat may occur before a very strong third wave down.
If price moves above 2,116.48, then the new alternate bear wave count would be invalidated. At that stage, if there is no new alternate for the bear, then this would be the only bear wave count.
Primary wave 2 may not move beyond the start of primary wave 1 above 2,134.72.
DAILY CHART
Click chart to enlarge.
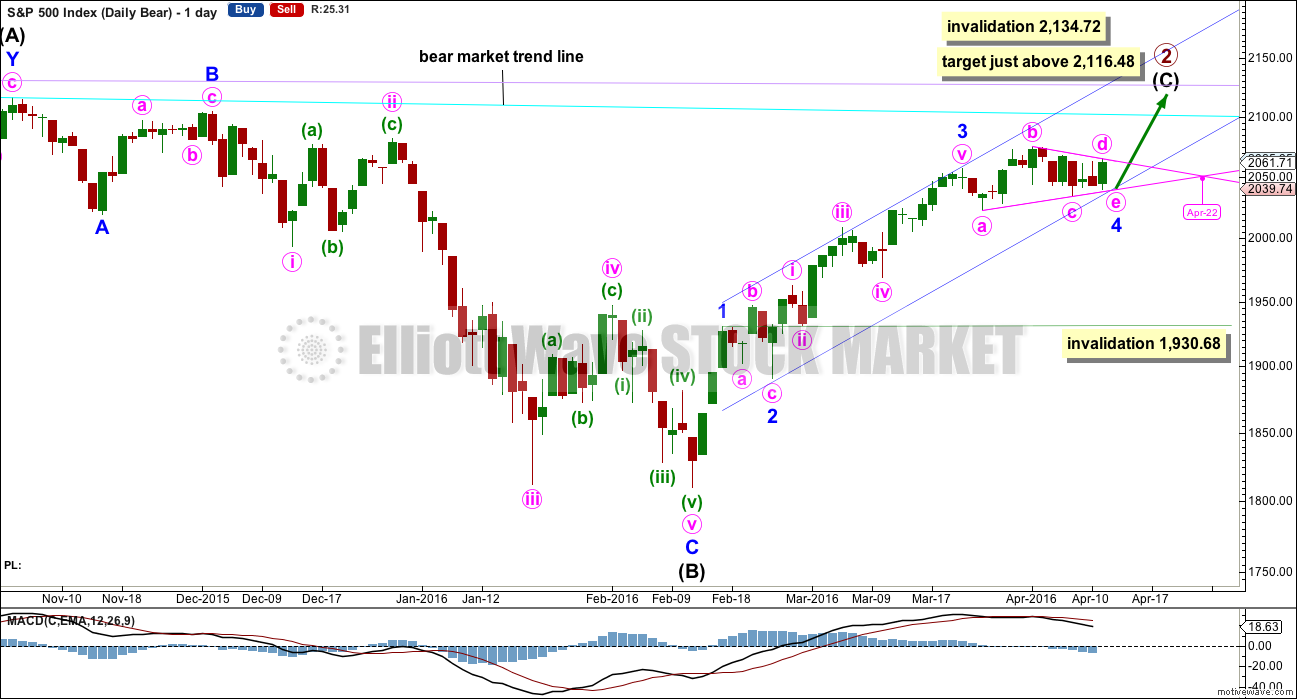
Intermediate wave (A) fits as a single or double zigzag.
Intermediate wave (B) fits perfectly as a zigzag. There is no Fibonacci ratio between minor waves A and C.
Intermediate wave (C) must subdivide as a five wave structure. It is unfolding as an impulse.
Intermediate wave (C) does not have to move above the end of intermediate wave (A) at 2,116.48, but it is likely to do so to avoid a truncation. If it is truncated and primary wave 2 is a rare running flat, then the truncation is not likely to be very large. As soon as price is very close to 2,116.48 this wave count looks at the possibility of a trend change.
The next wave down for this wave count would be a strong third wave at primary wave degree.
At this stage, it looks very much like a triangle is unfolding for minor wave 4. While technically this means the invalidation point at the daily chart level must be moved down to the end of minor wave 1 at 1,930.68, movement below 2,033.8 would substantially reduce the probability of more upwards movement well before final invalidation of minor wave 4.
Minor wave 4 may not move into minor wave 1 price territory below 1,930.68.
As minor wave 4 comes to an end, redraw the channel. Draw the first trend line from the ends of minor waves 2 to 4, then place a parallel copy on the end of minor wave 3. Minor wave 5 may end midway within the channel. A subsequent breach of the lower edge of the channel would be earliest indication of an end to primary wave 2. If it so happens that price exhibits a typical throwback to the lower line after breaching it, we may be offered a nice entry point to join primary wave 3.
The target is changed today because it is not known where minor wave 4 has ended. At this stage, it is expected that intermediate wave (C) is most likely to end at least slightly above the end of intermediate wave (A) at 2,116.48 to avoid a truncation. When the end of minor wave 4 is known, then the target will again be calculated. It probably won’t change much.
The point in time at which triangle trend lines cross over sometimes sees a trend change, and sometimes this is where a fifth wave ends. That point at this stage is on 22nd April. This may be when minor wave 5 ends. If the triangle continues further, this point may change.
HOURLY CHART
Click chart to enlarge.
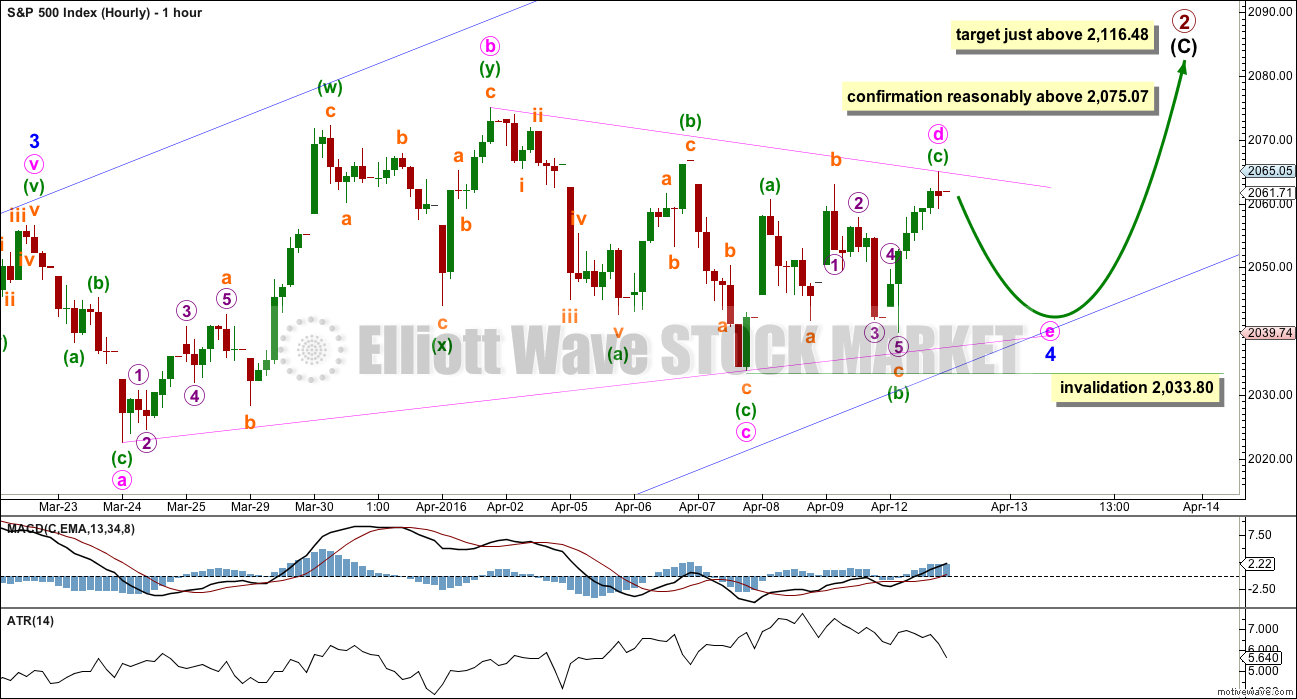
While yesterday’s hourly chart expected the triangle to be complete and price has moved upwards for Tuesday’s session, this upwards movement lacks conviction. It does not look like normal upwards movement out of a triangle.
So far within the triangle minute wave b is a 1.54 length of minute wave a, minute wave c is a 0.78 length of minute wave b, and minute wave d is a 0.76 length of minute wave c. If minute wave d continues a little higher to start tomorrow’s session, a likely point for it to end would be about 2,067 to 2,069. In my experience, a common length for triangle sub-waves is about 0.8 to 0.85 the prior sub-wave.
If minute wave d continues higher tomorrow, then it may not move reasonably above 2,075.07; this structure could be a barrier triangle as long as the b-d trend line remains essentially flat.
Minute wave e is most likely to fall short of the a-c trend line. It may not move beyond the end of minute wave c below 2,033.80.
Movements out of triangles usually begin swiftly with strong momentum. The upwards movement out of minor wave 4 should also show an increase in volume.
When the end point for minor wave 4 is clear, then a target will again be calculated for minor wave 5 to end.
ALTERNATE WEEKLY CHART
Click chart to enlarge.
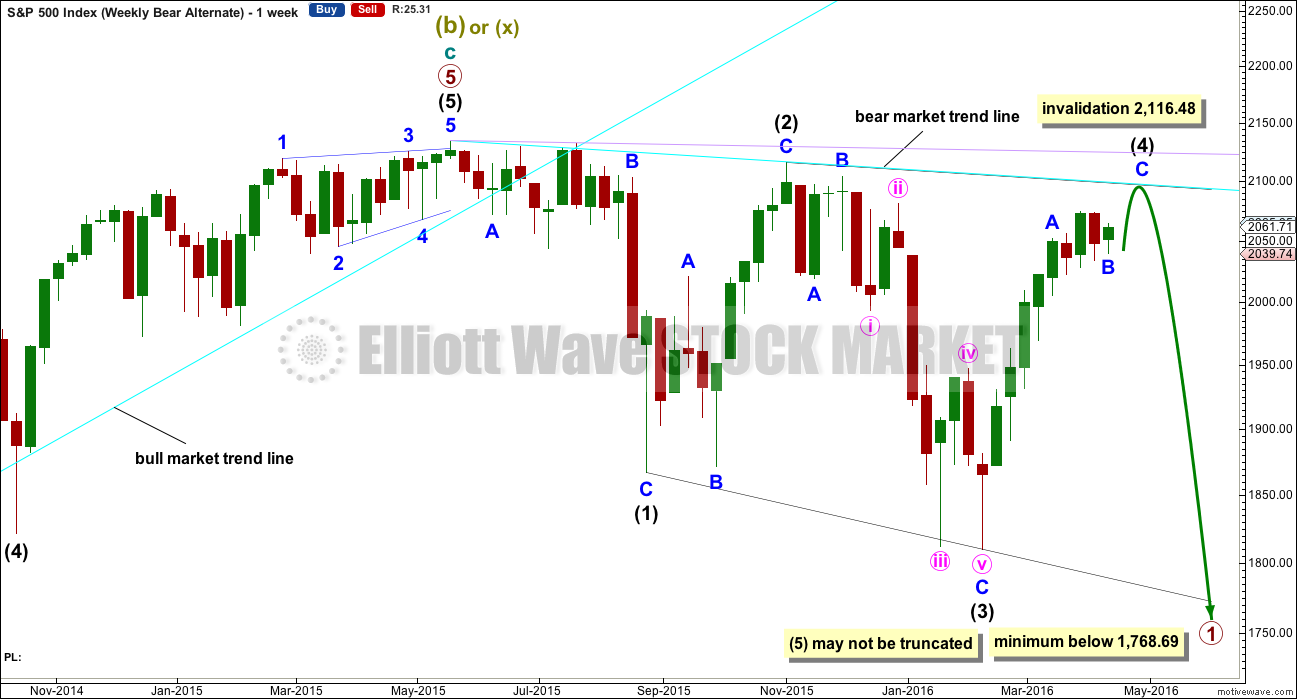
Primary wave 1 may subdivide as one of two possible structures. The main bear count sees it as a complete impulse. This alternate sees it as an incomplete leading diagonal.
The diagonal must be expanding because intermediate wave (3) is longer than intermediate wave (1). Leading expanding diagonals are not common structures, so that reduces the probability of this wave count to an alternate.
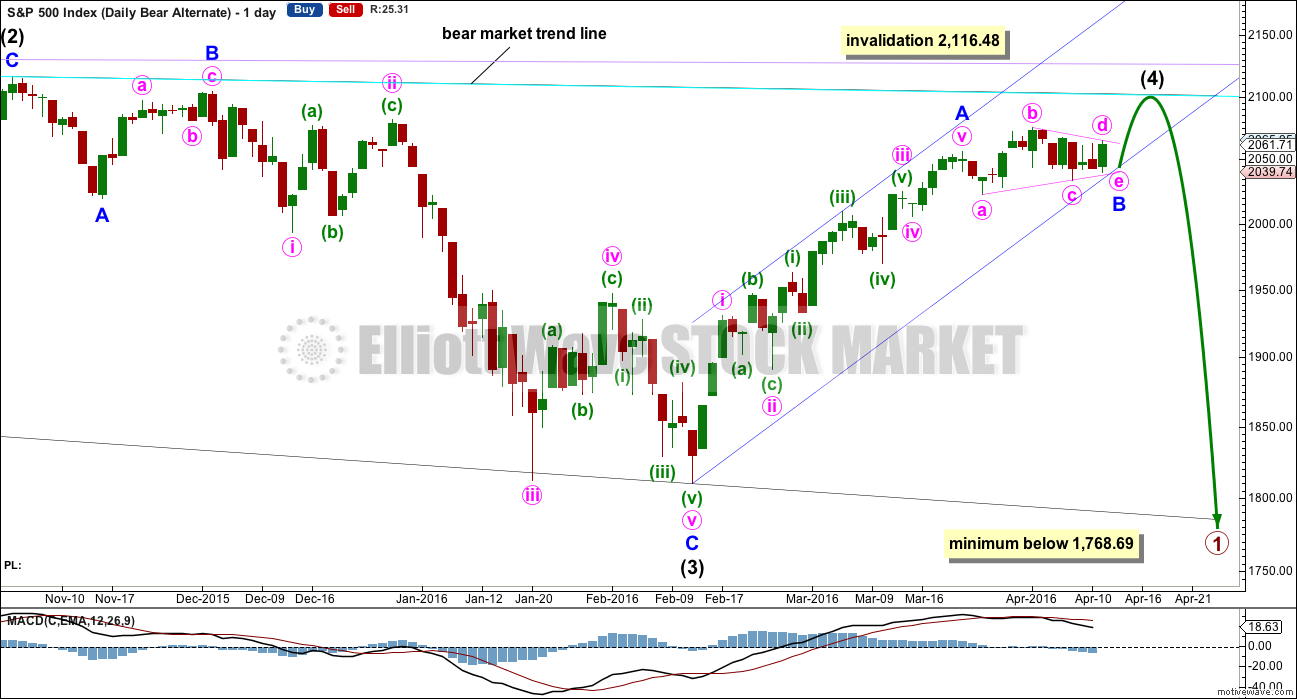
Intermediate wave (4) may continue higher now and may find resistance at the bear market trend line.
ALTERNATE DAILY CHART
Click chart to enlarge.
Within a leading diagonal, subwaves 2 and 4 must subdivide as zigzags. Subwaves 1, 3 and 5 are most commonly zigzags but may also sometimes appear to be impulses.
Intermediate wave (3) down fits best as a zigzag.
In a diagonal the fourth wave must overlap first wave price territory. The rule for the end of a fourth wave is it may not move beyond the end of the second wave.
Expanding diagonals are not very common. Leading expanding diagonals are less common.
Intermediate wave (4) must be longer than intermediate wave (2), so it must end above 2,059.57. This minimum has been met. The trend lines diverge.
The triangle is seen as minor wave B. Intermediate wave (4) now has a clearer three wave look to it.
For this alternate, the bear market trend line would be a better guide than the price target. If price comes up to that trend line, then for this alternate it should end there. If that is where price turns, this alternate would have a reasonable probability and would continue to be published alongside the main wave count.
Leading diagonals may not have truncated fifth waves. Intermediate wave (5) would most likely be a zigzag, must end below 1,810.10, and must be longer in length than intermediate wave (3) which was 306.38 points.
BULL ELLIOTT WAVE COUNT
WEEKLY CHART
Click chart to enlarge.
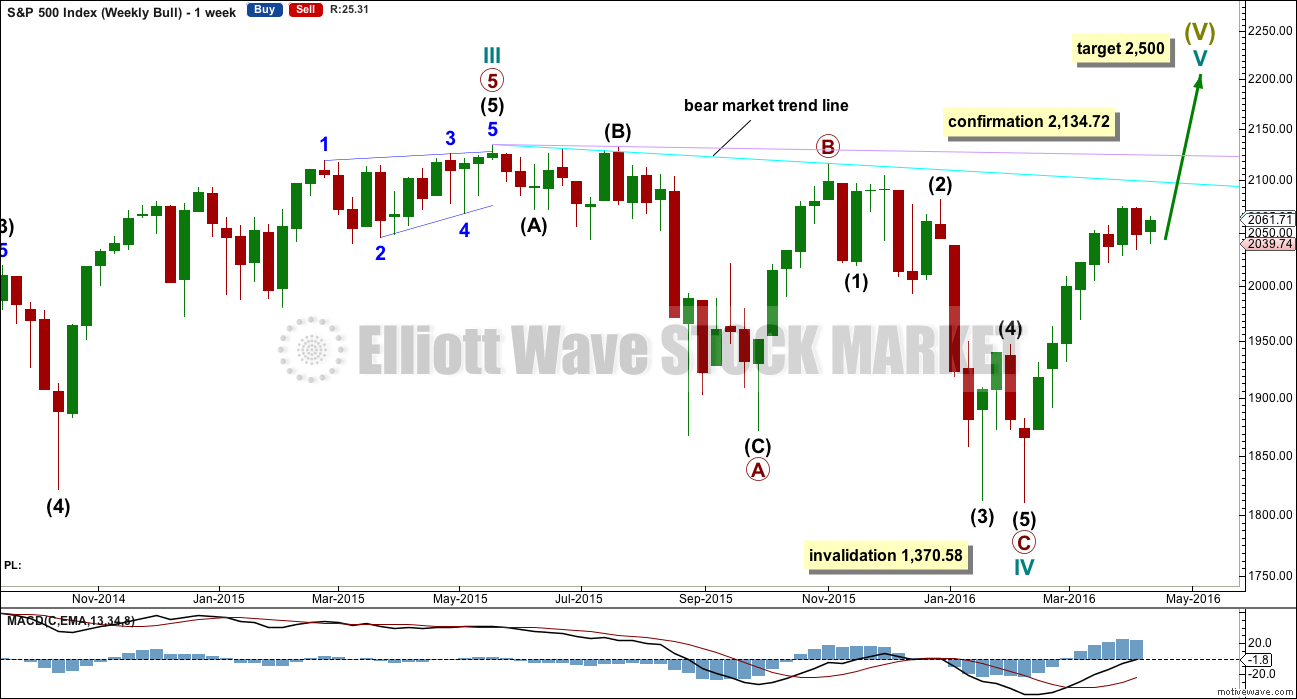
Cycle wave II was a shallow 0.41 zigzag lasting three months. Cycle wave IV may be a complete shallow 0.19 regular flat correction, exhibiting some alternation with cycle wave II.
At 2,500 cycle wave V would reach equality in length with cycle wave I.
Price remains below the final bear market trend line. This line is drawn from the all time high at 2,134.72 to the swing high labelled primary wave B at 2,116.48 on November 2015. This line is drawn using the approach outlined by Magee in the classic “Technical Analysis of Stock Trends”. To use it correctly we should assume that a bear market remains intact until this line is breached by a close of 3% or more of market value. In practice, that price point would be a new all time high which would invalidate any bear wave count.
This wave count requires price confirmation with a new all time high above 2,134.72.
While price has not made a new high, while it remains below the final bear market trend line and while technical indicators point to weakness in upwards movement, this very bullish wave count comes with a strong caveat. I do not have confidence in it.
DAILY CHART
Click chart to enlarge.
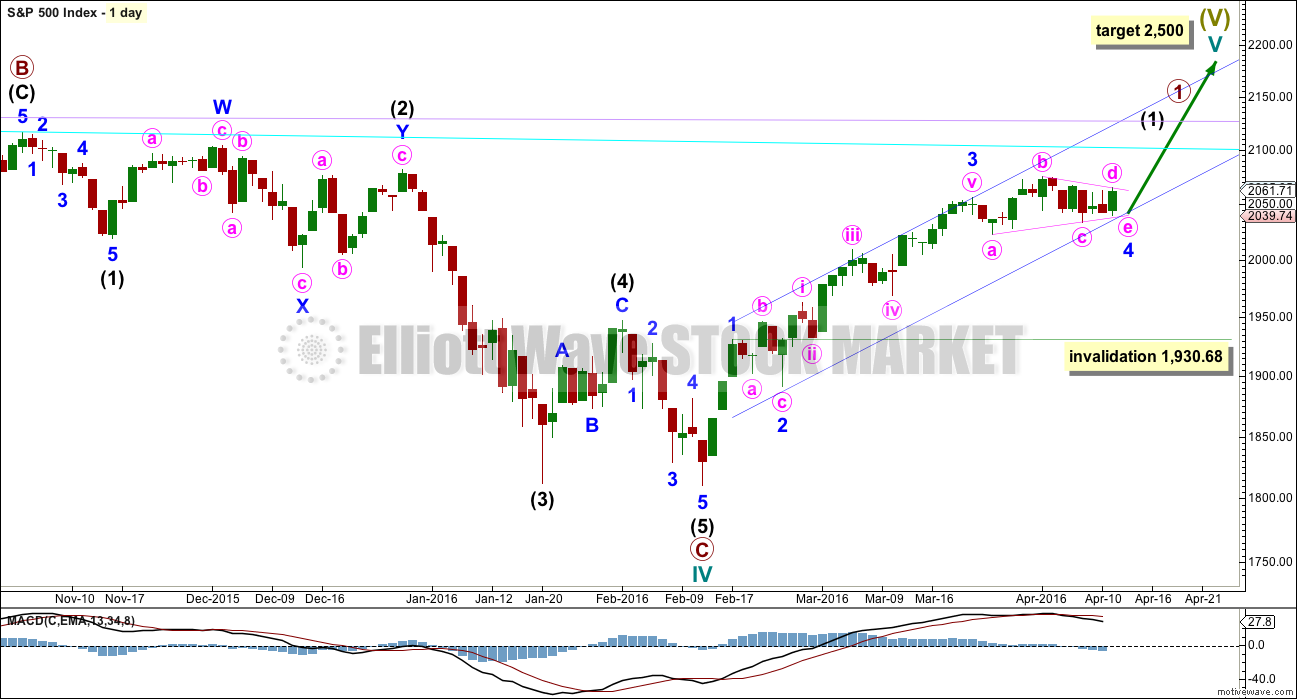
Intermediate wave (2) is seen as an atypical double zigzag. It is atypical in that it moves sideways. Double zigzags should have a clear slope against the prior trend to have the right look. Within a double zigzag, the second zigzag exists to deepen the correction when the first zigzag does not move price deep enough. Not only does this second zigzag not deepen the correction, it fails to move at all beyond the end of the first zigzag. This structure technically meets rules, but it looks completely wrong. This gives the wave count a low probability.
If the bull market has resumed, it must begin with a five wave structure upwards at the daily and weekly chart level. So far that is incomplete.
At 2,143 minor wave 5 would reach equality in length with minor wave 1.
Within minor wave 5, no second wave correction may move beyond the start of its first wave below 2,022.49.
TECHNICAL ANALYSIS
DAILY CHART
Click chart to enlarge. Chart courtesy of StockCharts.com.
Volume data on StockCharts is different to that given from NYSE, the home of this index. Comments on volume will be based on NYSE volume data when it differs from StockCharts.
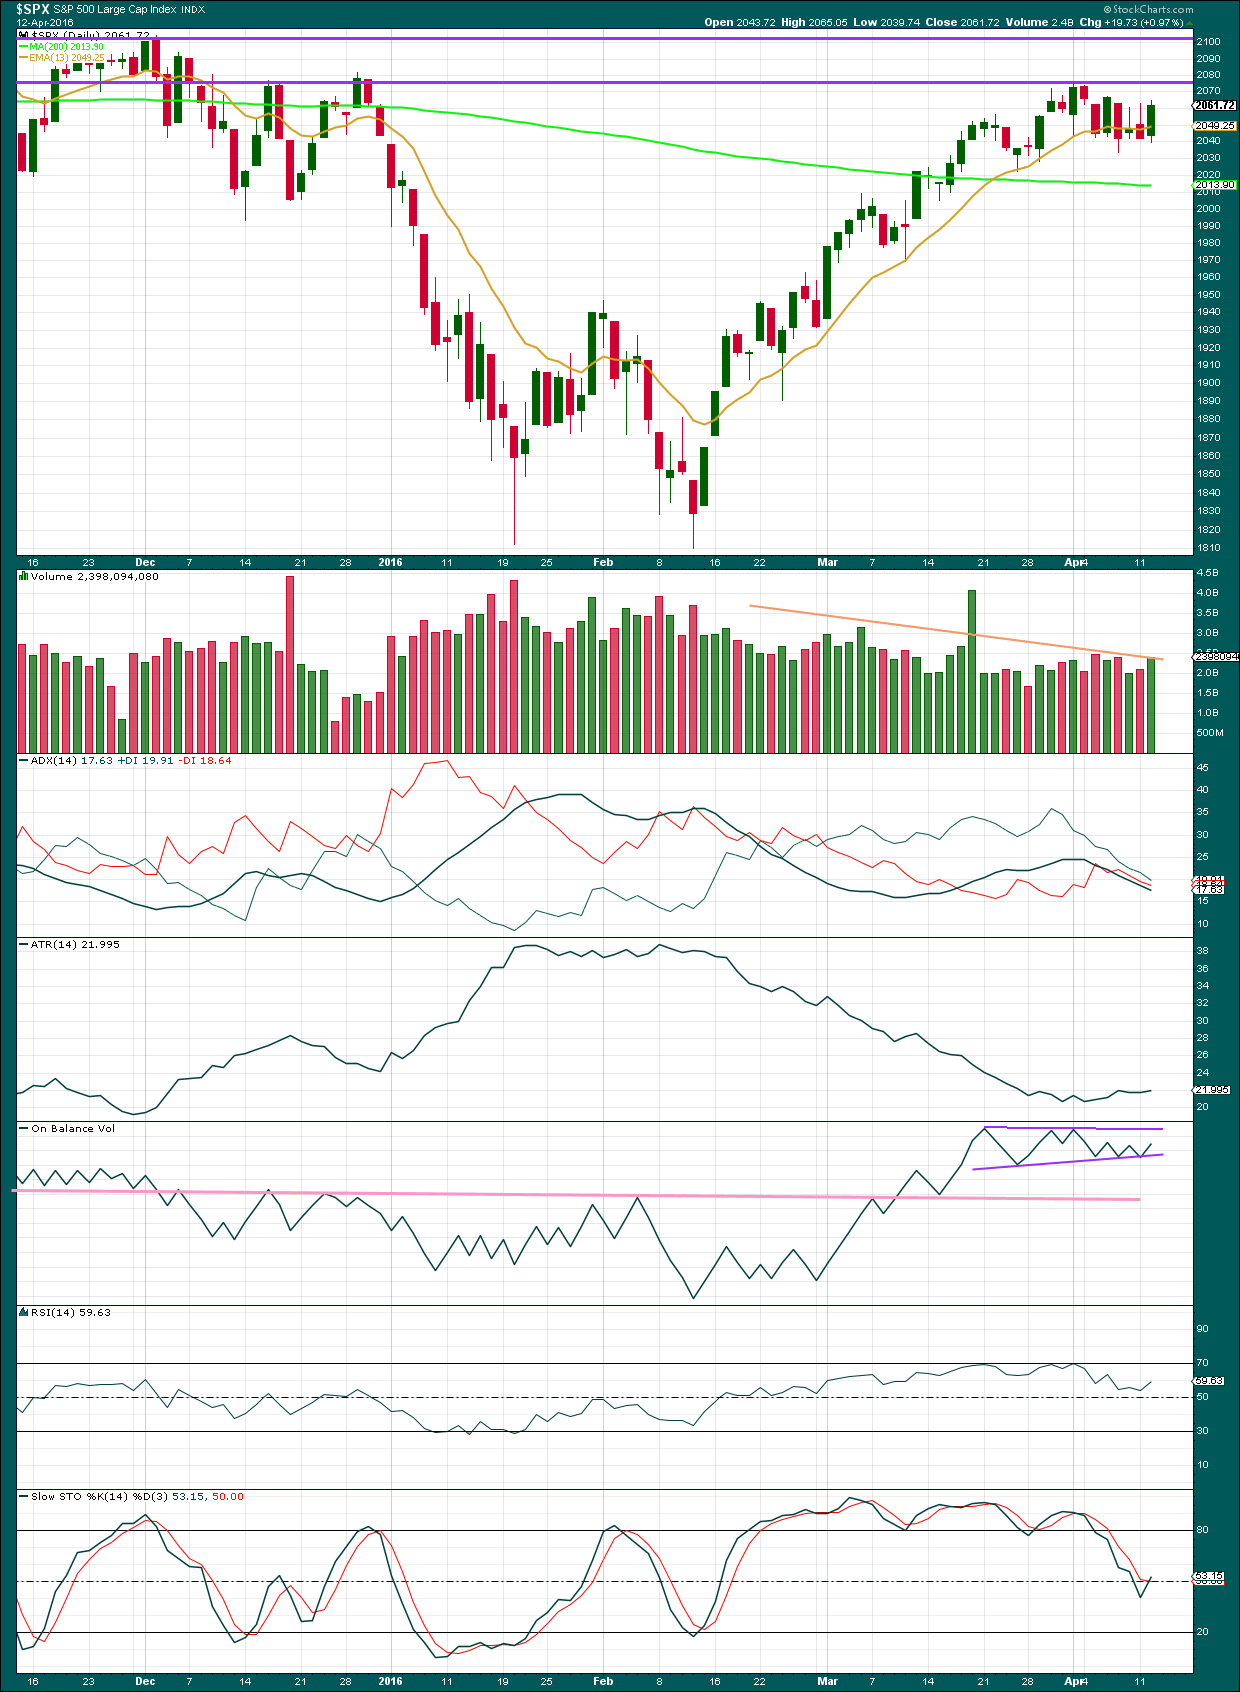
Price has been trending upwards for 41 days. The 13 day moving average is mostly showing where downwards corrections are finding support, but this support may be breaking down. Price is finding resistance at the horizontal trend line about 2,075.
Upwards movement in price for Tuesday has slightly higher volume. The rise in price was supported by volume, although most volume was in the last five minutes of the session for a last push higher.
As price moves upwards, it comes overall with declining volume. The trend is weak. It is not supported by volume, so is unsustainable.
ADX is now declining, indicating the market is no longer trending. This happens about the time of a trend change. The +DX line is still above the -DX line, but only just. A trend change has not been indicated yet.
ATR consistently declined while price moved higher. Normally, during a trending market ATR increases. This trend is abnormal. With declining ATR, the trend looks weak.
ATR is now flattening off. It should be expected that ATR will again start to increase. If it can’t do it when price is moving upwards, it may again do it when the next downwards wave arrives.
On Balance Volume is now contained within two purple short term lines. A break out of this small zone, above or below, may precede price direction. For OBV to give a clear bearish signal it needs to break below the pink line which has strong technical significance.
RSI has not managed to reach overbought during this trend. I would have expected upwards movement to only end when RSI reached overbought and then exhibited divergence with price at the final high. This may yet happen. If it does, I would have some confidence in calling a trend change.
Stochastics did reach overbought and did exhibit divergence with price. This indicates weakness in price at the end of upwards movement.
INVERTED VIX DAILY CHART
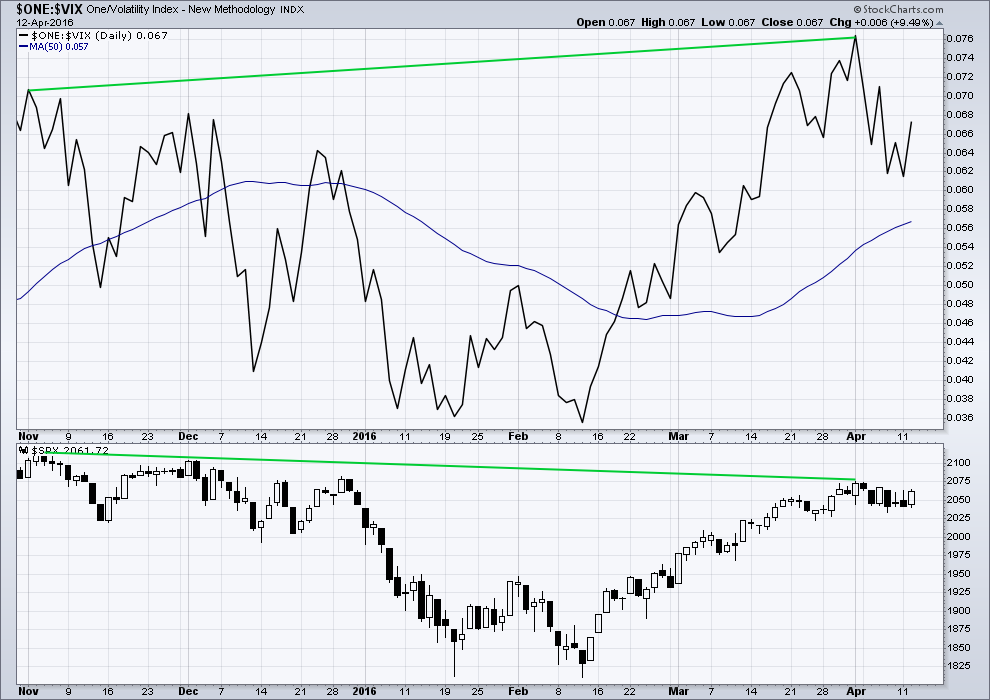
Click chart to enlarge. Chart courtesy of StockCharts.com.
Volatility declines as inverted VIX climbs. This is normal for an upwards trend.
What is not normal here is the divergence over a reasonable time period between price and inverted VIX. The decline in volatility is not translating to a corresponding increase in price. Price is weak. This divergence is bearish.
BULLISH PERCENT DAILY CHART
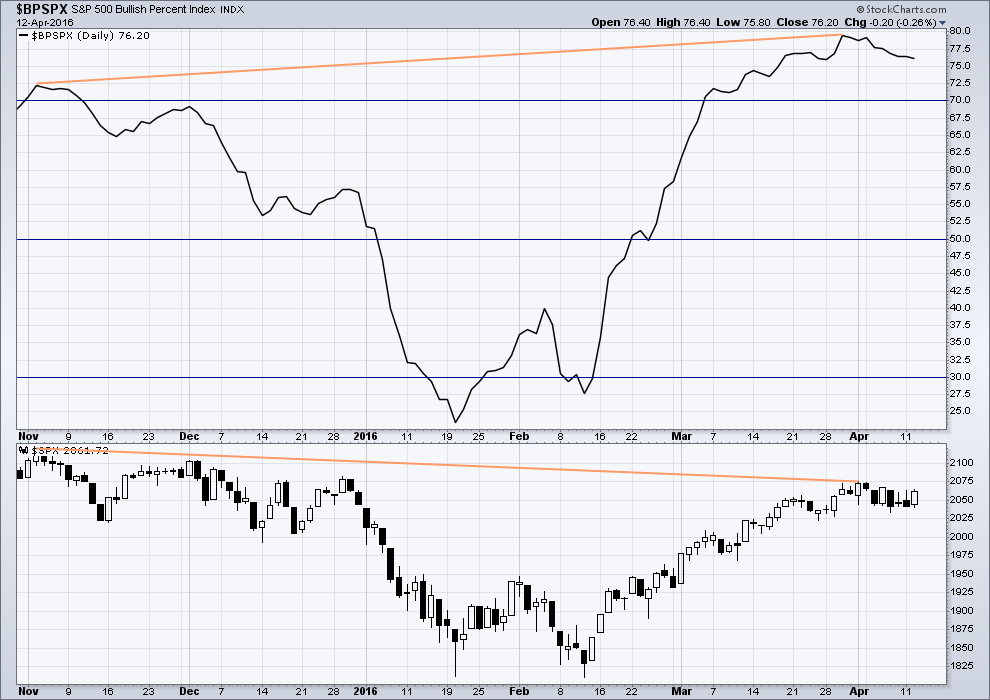
Click chart to enlarge. Chart courtesy of StockCharts.com.
There is strong hidden bearish divergence between price and the Bullish Percent Index. The increase in the percentage of bullish traders is more substantial than the last high in price. As bullish percent increases, it is not translating to a corresponding rise in price. Price is weak.
This looks like an overabundance of optimism which is not supported by price.
ADVANCE DECLINE LINE
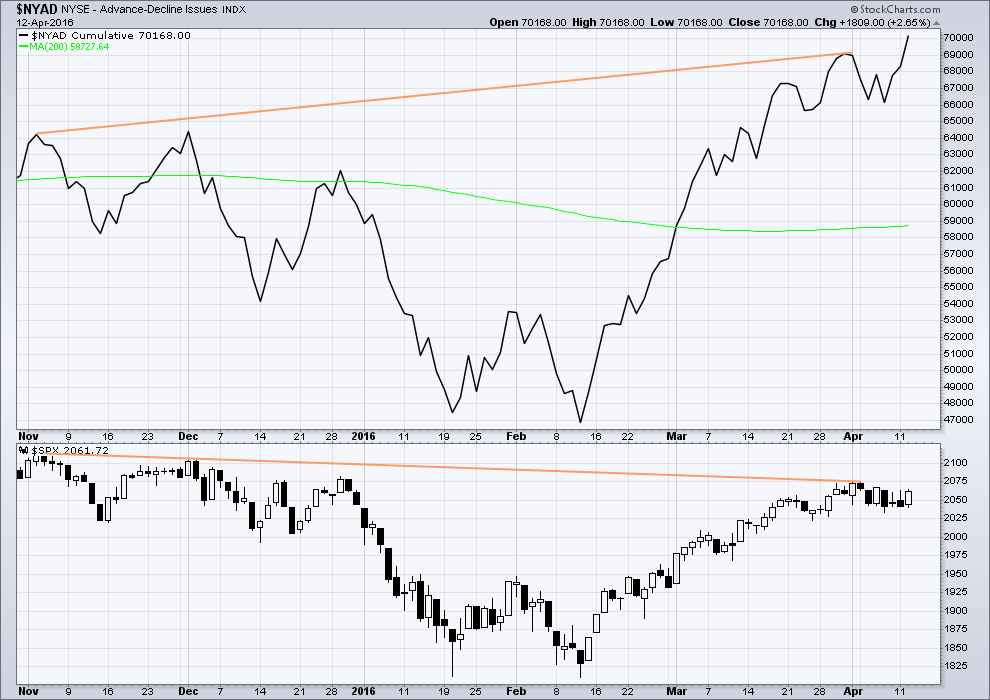
Click chart to enlarge. Chart courtesy of StockCharts.com.
With the AD line increasing, this indicates the number of advancing stocks exceeds the number of declining stocks. This indicates that there is breadth to this upwards movement.
From November 2015 to now, the AD line is making new highs while price has so far failed to make a corresponding new high. This indicates weakness in price; the increase in market breadth is unable to be translated to increase in price.
It remains to be seen if price can make new highs beyond the prior highs of 3rd November, 2015. If price can manage to do that, then this hidden bearish divergence will no longer be correct, but the fact that it is so strong at this stage is significant. The AD line will be watched daily to see if this bearish divergence continues or disappears.
The AD line today made a new high which again has failed to translate to a new high for price. While more stocks advanced than declined, this could not push price for the index up to new highs. This indicates further weakness in price.
The 200 day moving average for the AD line is now increasing. This alone is not enough to indicate a new bull market. During November 2015 the 200 day MA for the AD line turned upwards and yet price still made subsequent new lows.
DOW THEORY
I am choosing to use the S&P500, Dow Industrials, Dow Transportation, Nasdaq and the Russell 2000 index. Major swing lows are noted below. So far the Industrials, Transportation and Russell 2000 have made new major swing lows. None of these indices have made new highs.
I am aware that this approach is extremely conservative. Original Dow Theory has already confirmed a major trend change as both the industrials and transportation indexes have made new major lows.
At this stage, if the S&P500 and Nasdaq also make new major swing lows, then my modified Dow Theory would confirm a major new bear market. At that stage, my only wave count would be the bear wave count.
The lows below are from October 2014. These lows were the last secondary correction within the primary trend which was the bull market from 2009.
These lows must be breached by a daily close below each point.
S&P500: 1,821.61
Nasdaq: 4,117.84
DJIA: 15,855.12 – close below on 25th August 2015.
DJT: 7,700.49 – close below on 24th August 2015.
Russell 2000: 1,343.51 – close below on 25th August 2015.
This analysis is published @ 11:04 p.m. EST.
If this wave count is right then we are now beginning the very final wave up.
I expect that as price approaches 2,116.48 the bullishness of the mainstream will increase to extreme levels. If we see a new high even slightly above 2,116.48 I expect that bullishness will be all encompassing. Most technical analysts and Elliott wave analysts will be calling for a new all time high. The new bull market will be announced.
I think that if there is bearishness around at this stage it may be all but eliminated in a few days time if price does continue higher.
And then primary wave 2 will have done its job.
I am surprised that more are not noticing the incredible weakness in this upwards trend. ATR declining for most of it is really weird. Weak volume is a classic indicator of an unsustainable move from price and here we have it on the daily chart level for this last rise, and at the monthly chart level for the rise to the ATH.
I think it is interesting the gyrations some analysts seem to be doing to turn this picture bullish. I’m truly looking as objectively as I can, and I just can’t see bullishness in this.
Okay, On Balance Volume gave a bullish signal with a breach of a trend line on 16th March. That’s bullish.
I have been noticing that OBV seems to be an excellent early indicator of impending trend changes. I suspect it will give another signal of the current trend’s end ahead of the actual turn.
I am not too surprised at all the media talking heads yelling ” Bull!”
They are after all nothing but cheerleaders as opposed to a source of useful information.
The number of bullish analysts though is quite curious.
I am not sure if is the fact that we are still so close to all time highs and a failure to acknowledge all the numerous technical warning signs so evident to even the casual observer, or they are being slip-shod in their handling the data. This is an absolutely perfect primary two event.
I was reviewing some trades I made last April and shocked to see some SPY 208 calls among the them.
Here we are one year later and what trades did I close today? SPY 208 calls!
This is way too eerie…!
SPX less than 20 points from round number resistance and will attempt to run that gauntlet tomorrow. Either way, I expect May 6 SPY 201.5 puts to dip to around
0.50 intra-day and will begin deploying short term ammunition. I think we are close…
UVXY once again on sale…Bye! Bye!
ps That is one big ‘ole rising bearish wedge in SPX!
Looks like I should have left that triangle labelling alone.
Although it’s weak, this is an upwards breakout from the triangle.
Target just above 2,116.48 on 19th April.
Volume will be slightly higher than yesterday by 4:06PM.
It happens that way sometimes, doesn’t it? You were right on all along. That is why I did not open any more of short positions today. I am waiting for the expected 2110+ range to fill up a couple or three wagons. The stop will be a mere 25 SPX points or so away. We will know soon. I think the 19th of April is too long though. But you have nailed it so far (from all the way back in the low to mid 1900’s or so) , who I am to doubt. Keep up the outstanding work.
Luckily I held onto that small buy which is now nicely positive.
I’ve moved by stop up to breakeven. I’ll hold on for another couple of days to let the profit run as I still expect this is not done.
NUGT 80 strike puts up 45% with much more downside…more conservative trade is to wait for second close beneath upper BB…
Vern,
Already cashed some Nugt puts picked yesterday. Now waiting
Awesome! It was just begging to be shorted. I am holding half for a bit more downside. Sometimes it kicks back up to the upper BB before really tanking… 🙂
I got some dry powder for that but have been accumulating UVXY at these levels.
Less BAD is the new GOOD… Rally continues higher… The mantra of the Bulls they are parading out one by one by the talking heads!
Barf
Barf
Barf
They all fixed the earnings estimates lower in March and now they praise a slight beat. But remember the adjustments lower were not promoted and the market went up while these estimates were pushed lower March. What a scam!
Joseph,
They are going to suck some more investors as I see a ramp building into the close now.
Definitely a time for caution…
Wouldn’t an exhaustion gap come at the end of a clear trend? This one is at the end of 11 days of sideways chop. It looks more like a breakaway gap to me.
This whole thing is remarkably weak though. Anaemic.
Ergo the question mark. It would indeed be expected at the end of a trend and that is definitely not what I was expecting. The weakness of the move is striking and prompted that musing…this market is a bit scary (and tricksy!)….. 🙂
yes, a very tricky market indeed
gaps really aren’t my speciality. as Rodney says below, there seems to be some art to them
I don’t have an artistic bone in my body. even my stick figures look wrong 🙂
A very common pattern is to see a breakaway gap at the beginning of a move. This is followed by a midway gap somewhere in the middle of the total move. Finally and exhaustion gap arrives near the top. The gaps can be at many locations within the pattern. The question is what is it showing.
The NASDAQ had a couple of breakaway gaps on the daily chart to begin the current rally. Today it had an exhaustion gap. But there was no midway gap. The actual price top can come in a few days.
This gap pattern is just one piece of evidence. And I have found these patterns to be as much art as science. Another way of saying it, there are many false signals or the accuracy is definitely not 100%.
In case of US equity markets today, I give it significant weight as it comes with the non-confirmation at the daily MACD. I also find that gaps on the daily charts are more reliable than shorter periods.
Of course, all of the above is just my opinion and experience.
your experience which is worth one helluva lot actually
I am wondering if it did not manage to penetrate the upper BB during minor three up, should we reasonably expect it to during minor five? I would also have expected it to happen today if it were going to happen as the initial breakout usually has the most momentum.
It may be we are about to see final burst of bullishness (hence the gap up open) or we are indeed in the terminal hours of the correction…
Another interesting observation about PM stocks. Many of them are exhibiting the typical fifth wave momentum and traded outside the upper BB the last few days. Maybe SPX will also exhibit more momentum in this fifth up but so far it does not look at all like it…
A very cautionary note today. Both DJI and SPX hitting upper BB but not penetrating on what should have been a strong move out of the triangle. This looks like an exhaustion move, and while I was expecting the move out of a fourth wave triangle to have more upside momentum than we have seen so far, it would be wise to keep in mind where we are in this extended bull market. Exiting all long positions…market neutral short term…
Come on!!! SPX Go UP!!!!!
Lets get this final wave UP to complete the structure over with ASAP!!!!
Run Bulls… Run!!!! Yea… Baby!
Yes… Yes… Yes … I believe!
May 6 SPY 201.5 puts now trading under 1.00 Time to enter “stink bids” as this final move up could easily end with a blow-off top and some serious intra-day option mis-pricing. Opening BTO for first batch at 0.25 limit price per contract…
Yes. I need to be out of the office most of the day. I might put in a few bids. I’d prefer to actually see the progress as the day goes on. I can hold out only another hour.
We are right at the upper Bollinger Band on the daily SPX. It will be tough for the bulls to push much higher unless they can up the volume a lot. It would be nice to see SPX close above the upper BB today and close below it tomorrow. That would be a signal it is time to sell short the market.
Yep Rod. I did not notice your post about the upper BB and just posted the same observation. I was thinking the same thing about wanting to see a temporary penetration of the upper BB but then I went and did a bit of checking. Over the last twelve months while both DJI and SPX have on occasion penetrated to the downside, neither has ever penetrated the upper BB. While they could stay pinned there for a bit, I think it speaks to the waning strength of the price action…time to be cautious imo…
Thanks for the info from a bit of research Verne!
Welcome to the banksters’ last hurrah. Co-ordinated buying in Europe have bourses there up as much as 2% in some markets. The players on this side of the Atlantic will follow suit, supposedly cheered by better than expected results from the financial sector, never mind what happened to retail sales.
Selling SPY 208 calls on market strength for a nice triple. They will probably trade up to 0.75 today for the brave of heart. I will be quietly exiting remaining long positions today. Still holding UVXY 19 puts. When they decline by about half will signal a turning of the worm….
At 8:30 AM EST, the SPX futures are up 10+ points. This will take us over 2070 at the open. I think this means the triangle / correction is over and the fifth and final wave of Intermediate C of Primary 2 is underway. 2100+ is on the way.
It also means that VIX, UVXY, and TVIX are going lower. They may or may not make new swing lows. But the fact remains, they will be on sale at a price we may not see again. SPXU and SQQQ will be on sale as well.
I will be opening some more short positions soon (by the end of the week most likely). I have 3 out of 8 positions already open. I will probably open another 3 during this 5th and final up wave leaving the final 2 for the channel breach. Note: opening positions without reaching confirmation and confidence points carries more risk.
Have a great day all.
2076.02…… Good the final wave up is finally here to complete the structure, lets get a big POP today and lets get this completed once and for all ASAP!
SPX high so far today 2076.45… Let’s get this final big POP wave today and over with ASAP!
Did you see the bogus China import numbers…
imports from Hong Kong increased 130%… falsifying that import number. They traded with Hong Kong to move currency out of China and bring Gold or other hard value assets in.
It had nothing to do with goods to show economic growth… But Growth is what the headlines are claiming based on that headline number. How about putting a headline out explaining what that import number is made up of??? Silence on this fact!
The person in charge of the largest pension fund in the USA says China’s growth rate is negative… Yet the official estimates are at 6.50% and this is what Wall Street is selling the number at.
Think about that… it’s a HUGE difference in total dollar terms.
BTW: Oil is down 2% so far this morning.
JOseph,
So it makes sense what Janus Funds twitting yesterday from Bill Gross..waiting and waiting.
Wow… JPM earning miss by 7% overall rev. dropped but it is all good and stock is bid up in pre-market…good times are back 🙂
That’s because they took the estimates way down so that they could beat the estimates. But there is never a reaction to that estimate at the time its taken down… its a way to always sell the bullish case at earnings time… everything is always great.
The Fed with what they did last month rescued some banks trading. Remember the banks have ownership in the Fed.
Here is the overall NASDAQ
Few charts showing no volume behind the NASDAQ move for last 8 weeks…
looks like we’ve broken out of the triangle already and started the fifth.
Laura indicated D wave could go higher:
from text under the main hourly chart –
If minute wave d continues a little higher to start tomorrow’s session, a likely point for it to end would be about 2,067 to 2,069. In my experience, a common length for triangle sub-waves is about 0.8 to 0.85 the prior sub-wave.
If minute wave d continues higher tomorrow, then it may not move reasonably above 2,075.07; this structure could be a barrier triangle as long as the b-d trend line remains essentially flat.
First once again. It is an omen. Of what I am not sure since I do not believe in such things. But it is nice.
Thanks Lara for you great analysis and presentation.
These triangles and 2nd waves are so very difficult to trade. I am glad I’ve been out since 1940’s and your analysis has keep me out. We often forget how valuable it is to have analysis that keeps us out at the right time.
Hi Rodney
Got you by 2 minutes, doc.
Just pure luck and sometimes being lucky is better than being good!
I wanted to download the free Elliott Wave Resource on the right of the website, but when I put in my details it takes me to the gold page. Can anyone help at all?
Thanks a lot
Stuart,
When I selected the Free Resources by clicking on the first chart, it brought me to the correct page. I am not sure what else to say. Sorry I could not help and good luck.
No worries- I have them now. Thanks
You’re welcome!
I’m happy today with a nice wee profit on a short term buy on S&P.
Gold is going down, I think to end a big second wave correction in another week or so. Then I plan on entering a buy and holding it for weeks.
Oil is going down, also to complete a big second wave correction. Then I plan on holding a buy there for weeks too.
And the S&P… I shouldn’t be but I am excited. If my wave count is right and I enter short for primary 3… ooooh the profits 🙂
Lara, what datasource feed do you use for your MotiveWave platform? I’m trying to pick one in order to start playing with MotiveWave. Another question, what package do you recommend in MotiveWave if I intend on charting waves for various indices and stocks basically? Thanks !!