
Upwards movement was expected. This is not what happened.
Price remains above the invalidation point on the hourly chart. The Elliott wave count remains on track.
Summary: This is still a bear market rally until proven otherwise. A final fifth wave up is required to complete the structure. The target is 2,124. The invalidation point for this rally is 2,134.72. A short term target for a small third wave up is at 2,119, which may take a few days to get there.
To see last published monthly charts click here.
To see how each of the bull and bear wave counts fit within a larger time frame see the Grand Supercycle Analysis.
To see detail of the bull market from 2009 to the all time high on weekly charts, click here.
New updates to this analysis are in bold.
BEAR ELLIOTT WAVE COUNT
WEEKLY CHART
Click chart to enlarge.
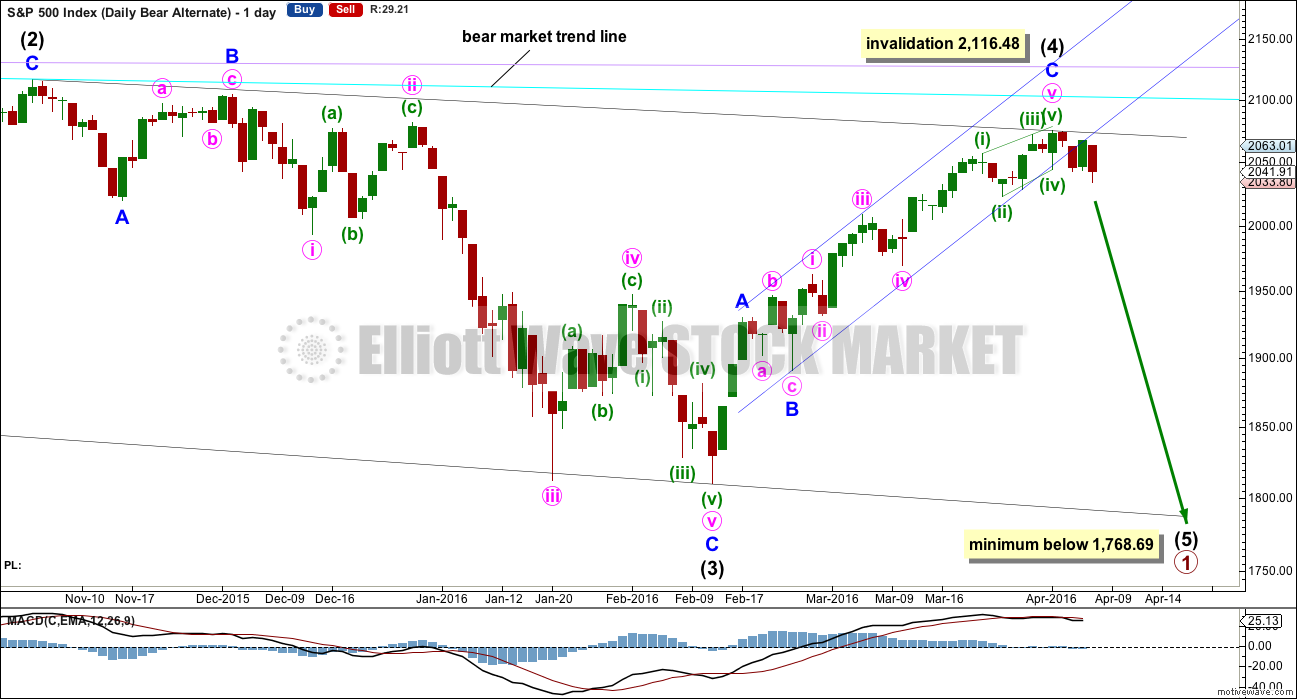
This bear wave count fits better than the bull with the even larger picture, super cycle analysis found here. It is also well supported by regular technical analysis at the monthly chart level.
Importantly, there is no lower invalidation point for this wave count. That means there is no lower limit to this bear market.
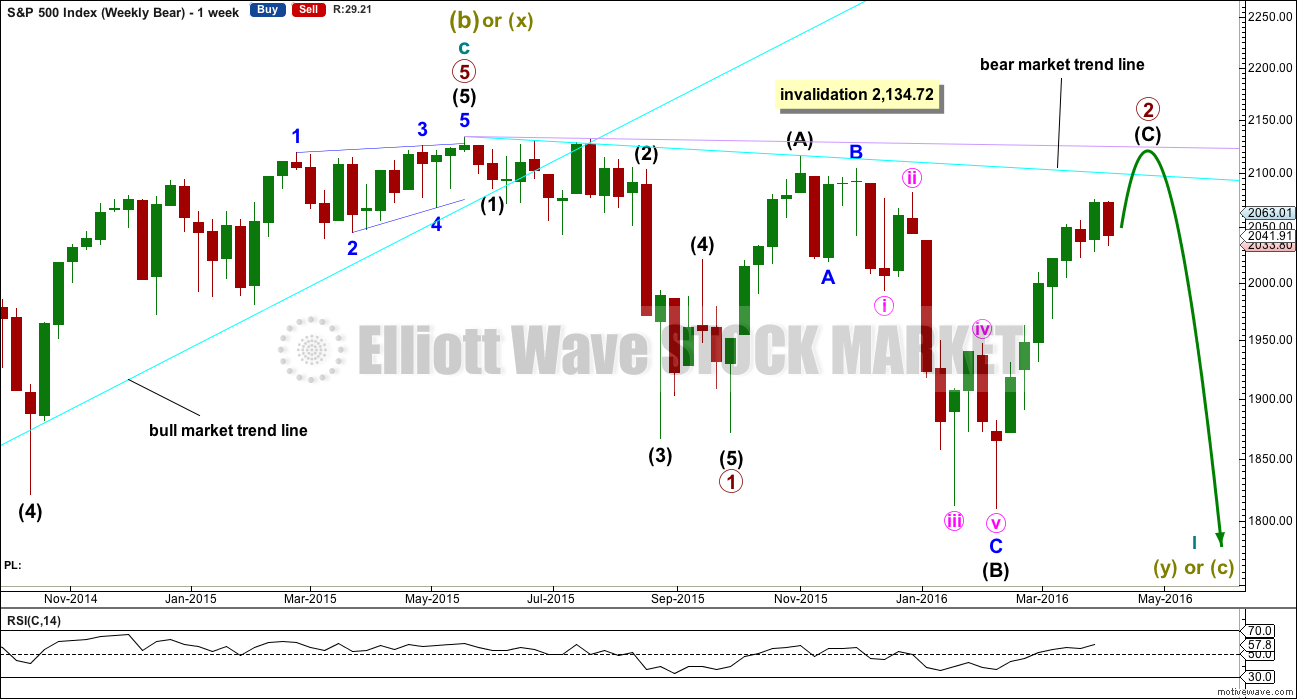
Primary wave 1 may be complete and may have lasted 19 weeks, two short of a Fibonacci 21. So far primary wave 2 is in its 26th week. It looks unlikely to continue for another 8 weeks to total a Fibonacci 34, so it may end in about two to three weeks time. This would still give reasonable proportion between primary waves 1 and 2. Corrections (particularly more time consuming flat corrections) do have a tendency to be longer lasting than impulses.
Primary wave 2 may be unfolding as an expanded or running flat. Within primary wave 2, intermediate wave (A) was a deep zigzag (which will also subdivide as a double zigzag). Intermediate wave (B) fits perfectly as a zigzag and is a 1.21 length of intermediate wave (A). This is within the normal range for a B wave of a flat of 1 to 1.38.
Intermediate wave (C) is likely to make at least a slight new high above the end of intermediate wave (A) at 2,116.48 to avoid a truncation and a very rare running flat. However, price may find very strong resistance at the final bear market trend line. This line may hold price down and it may not be able to avoid a truncation. A rare running flat may occur before a very strong third wave down.
If price moves above 2,116.48, then the new alternate bear wave count would be invalidated. At that stage, if there is no new alternate for the bear, then this would be the only bear wave count.
Primary wave 2 may not move beyond the start of primary wave 1 above 2,134.72.
DAILY CHART
Click chart to enlarge.
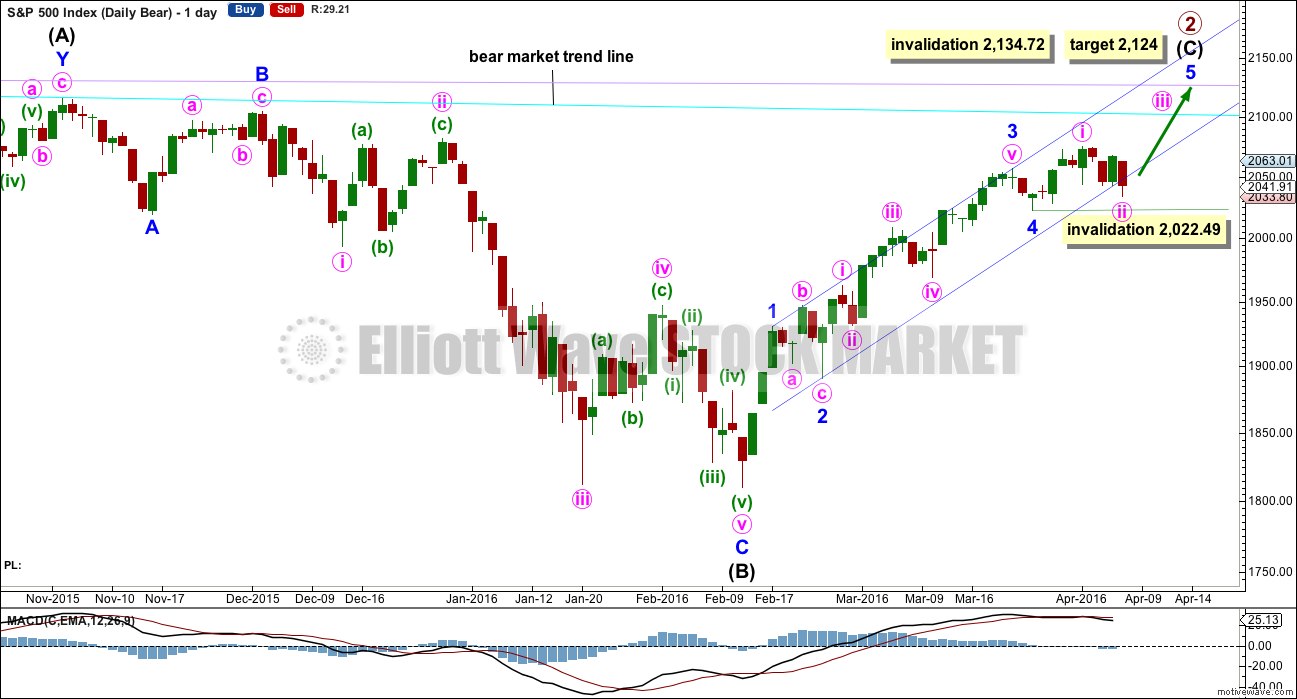
Intermediate wave (A) fits as a single or double zigzag.
Intermediate wave (B) fits perfectly as a zigzag. There is no Fibonacci ratio between minor waves A and C.
Intermediate wave (C) must subdivide as a five wave structure. It is unfolding as an impulse.
Intermediate wave (C) does not have to move above the end of intermediate wave (A) at 2,116.48, but it is likely to do so to avoid a truncation. If it is truncated and primary wave 2 is a rare running flat, then the truncation is not likely to be very large. As soon as price is very close to 2,116.48 this wave count looks at the possibility of a trend change.
The next wave down for this wave count would be a strong third wave at primary wave degree.
The blue channel is drawn about intermediate wave (C) using Elliott’s technique. Minute wave ii today overshot the channel and closed below the lower edge. This is only a small cause for concern for the wave count because the S&P does not always fit neatly within channels. Sometimes it breaches channels only to turn back and continue in the prior direction.
At 2,124 minor wave 5 would reach 0.618 the length of minor wave 3. Intermediate wave (C) would avoid a truncation and the wave count would remain valid. Primary wave 2 would fulfill its purpose of convincing everyone that a new bull market is underway, and it would do that right before primary wave 3 surprises everyone.
Within minor wave 5, no second wave correction may move beyond the start of its first wave below 2,022.49.
Within the impulse of intermediate wave (C), minor wave 2 is an expanded flat and minor wave 4 is a zigzag. These two corrections look to be nicely in proportion.
Although technically the structure for intermediate wave (C) could be seen as complete, it would probably be severely truncated by 41.41 points. This is not impossible, but the probability of it is too low to seriously consider.
HOURLY CHART
Click chart to enlarge.
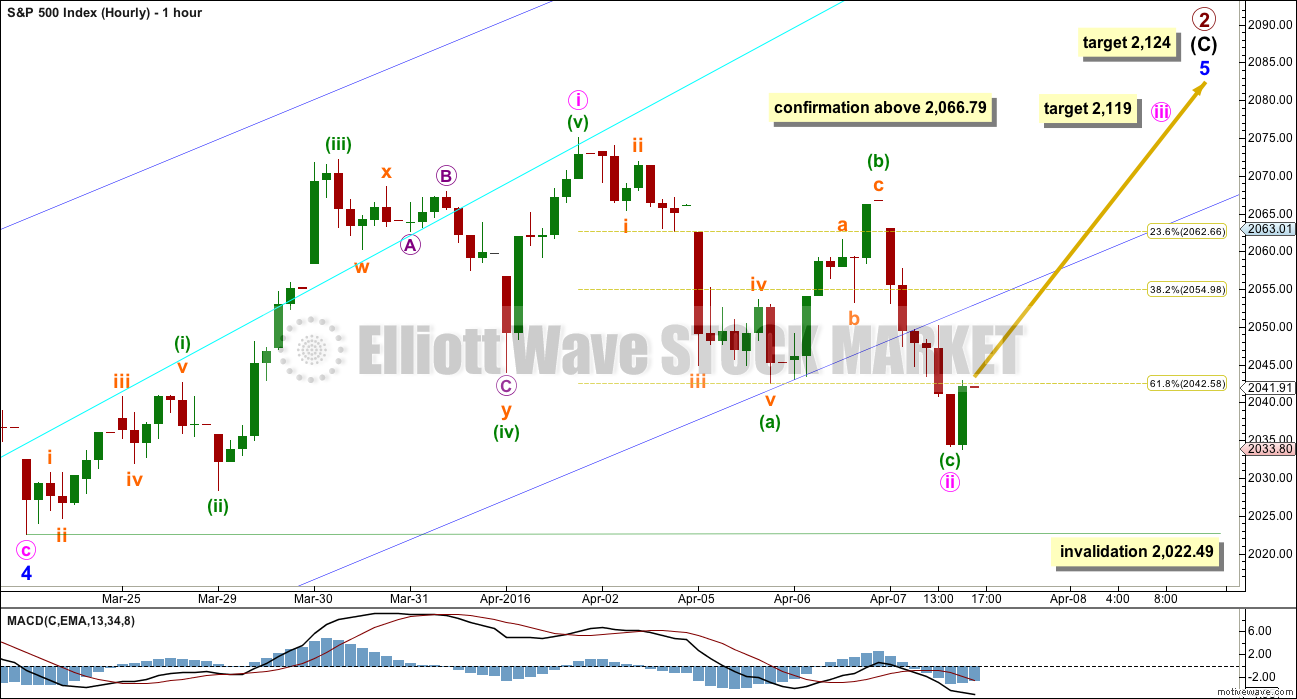
At this stage, there looks to be a five up followed by a three down on the hourly chart. The mid term picture looks clear in terms of structure; the trend should still be up.
Minute wave ii moved deeper. The suspiciously five wave look of minuette wave (a) was a five. Minute wave ii is a deep zigzag. Second wave corrections are often deep.
At 2,119 minute wave iii would reach 1.618 the length of minute wave i.
Along the way up, a new high above 2,066.79 would add confidence to this wave count. That is the high labelled minuette wave (b). A new high above the start of minuette wave (c) could not be a second wave correction within minuette wave (c), nor could it be a second wave correction within a new downwards trend. At that stage, the downwards wave labelled minute wave ii would be confirmed as complete and it would look strongly like a three wave movement.
If minute wave ii continues any further when markets open tomorrow, it may not move below the start of minute wave i at 2,022.49.
If this wave count is invalidated at the hourly chart level, then the alternate bear wave count would be more likely.
ALTERNATE WEEKLY CHART
Click chart to enlarge.
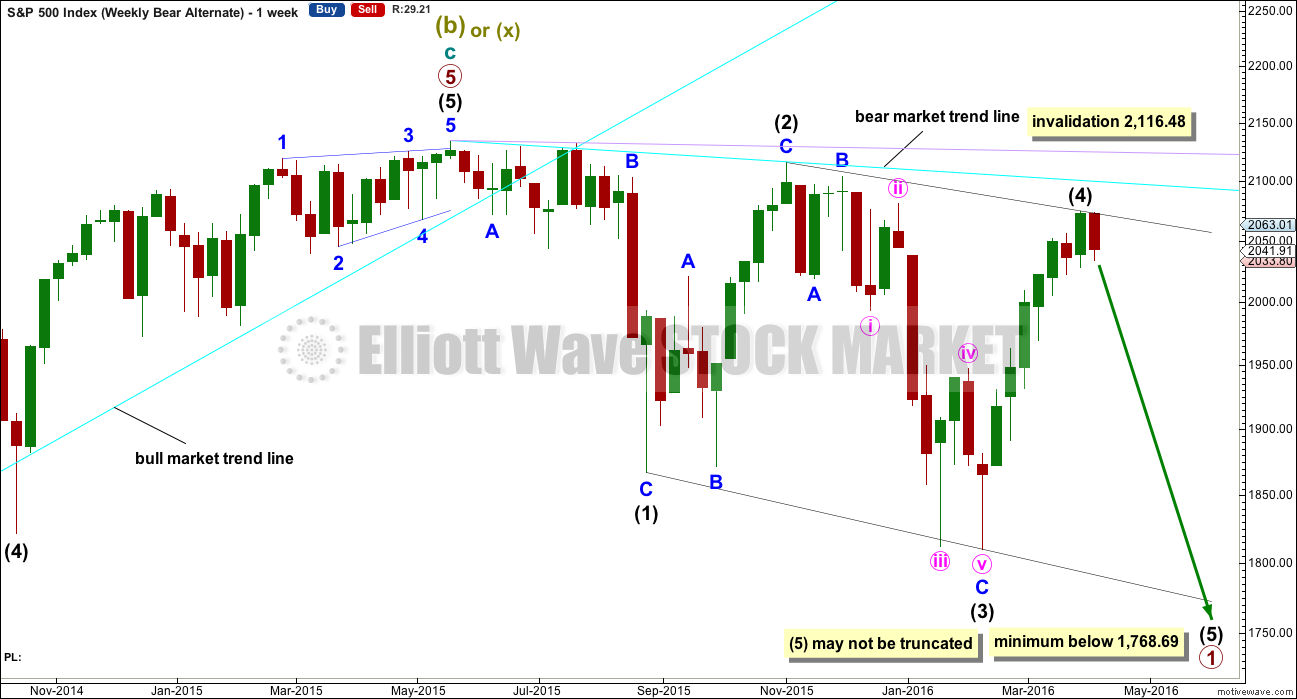
Primary wave 1 may subdivide as one of two possible structures. The main bear count sees it as a complete impulse. This alternate sees it as an incomplete leading diagonal.
The diagonal must be expanding because intermediate wave (3) is longer than intermediate wave (1). Leading expanding diagonals are not common structures, so that reduces the probability of this wave count to an alternate.
Intermediate wave (4) must continue higher and may find resistance at the cyan bear market trend line. Intermediate wave (4) may not move above the end of intermediate wave (2) at 2,116.48.
ALTERNATE DAILY CHART
Click chart to enlarge.
Within a leading diagonal, subwaves 2 and 4 must subdivide as zigzags. Subwaves 1, 3 and 5 are most commonly zigzags but may also sometimes appear to be impulses.
Intermediate wave (3) down fits best as a zigzag.
In a diagonal the fourth wave must overlap first wave price territory. The rule for the end of a fourth wave is it may not move beyond the end of the second wave.
Expanding diagonals are not very common. Leading expanding diagonals are less common.
Intermediate wave (4) must be longer than intermediate wave (2), so it must end above 2,059.57. This minimum has been met. The trend lines diverge.
Intermediate wave (4) may be over. If it is over here, then intermediate wave (5) must move below the end of intermediate wave (3), so it may not be truncated. Because the diagonal is expanding intermediate wave (5) must be longer than equality in length with intermediate wave (3). It must end below 1,768.69.
The final fifth wave of minute wave v is seen as an ending contracting diagonal. It does not have a very typical look though. The trend lines converge, but only just. The final fifth wave of the diagonal has not overshot the (i)-(iii) trend line and falls slightly short. This reduces the probability of this part of the wave count.
Leading diagonals may not have truncated fifth waves. Intermediate wave (5) would most likely be a zigzag, must end below 1,810.10, and must be longer in length than intermediate wave (3) which was 306.38 points.
BULL ELLIOTT WAVE COUNT
WEEKLY CHART
Click chart to enlarge.
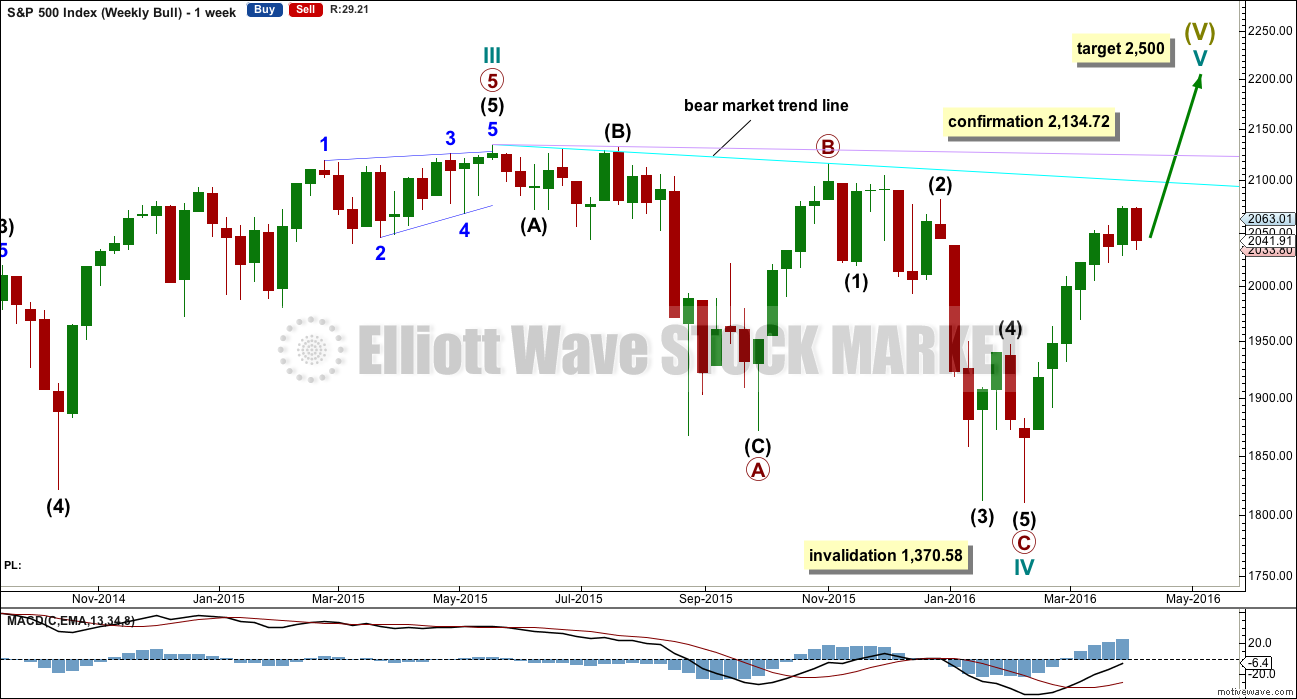
Cycle wave II was a shallow 0.41 zigzag lasting three months. Cycle wave IV may be a complete shallow 0.19 regular flat correction, exhibiting some alternation with cycle wave II.
At 2,500 cycle wave V would reach equality in length with cycle wave I.
Price remains below the final bear market trend line. This line is drawn from the all time high at 2,134.72 to the swing high labelled primary wave B at 2,116.48 on November 2015. This line is drawn using the approach outlined by Magee in the classic “Technical Analysis of Stock Trends”. To use it correctly we should assume that a bear market remains intact until this line is breached by a close of 3% or more of market value. In practice, that price point would be a new all time high which would invalidate any bear wave count.
This wave count requires price confirmation with a new all time high above 2,134.72.
While price has not made a new high, while it remains below the final bear market trend line and while technical indicators point to weakness in upwards movement, this very bullish wave count comes with a strong caveat. I do not have confidence in it.
DAILY CHART
Click chart to enlarge.
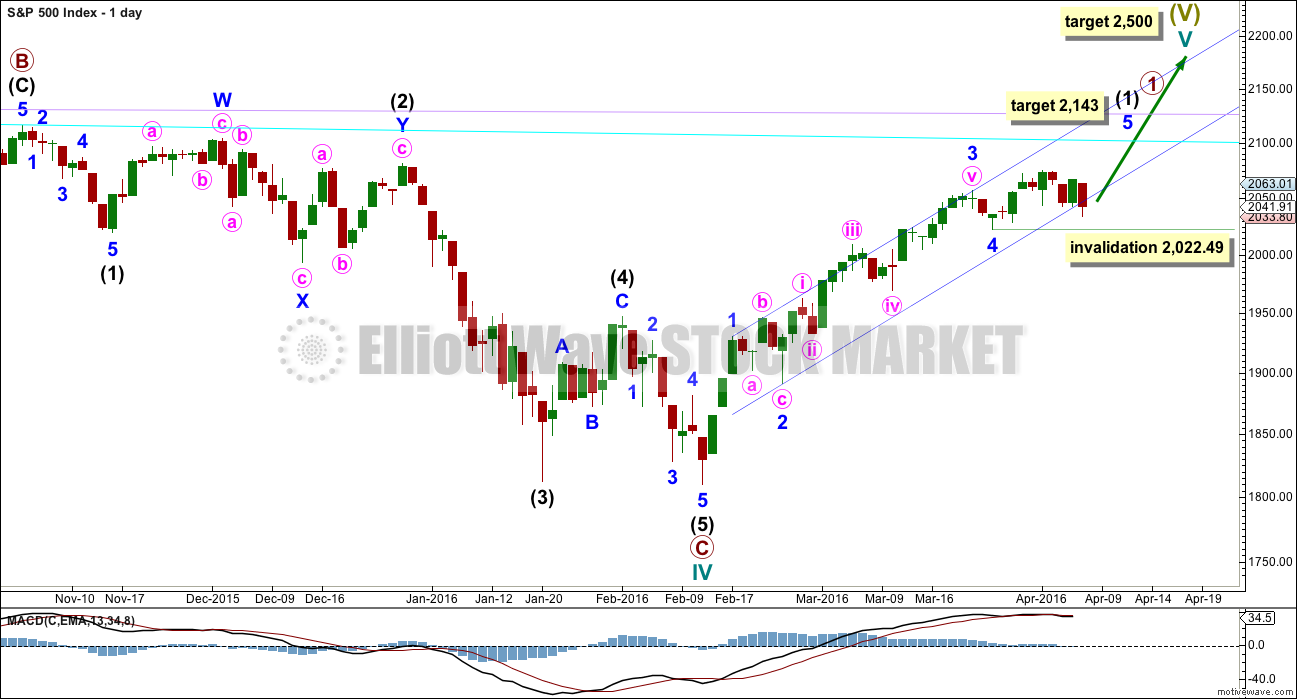
Intermediate wave (2) is seen as an atypical double zigzag. It is atypical in that it moves sideways. Double zigzags should have a clear slope against the prior trend to have the right look. Within a double zigzag, the second zigzag exists to deepen the correction when the first zigzag does not move price deep enough. Not only does this second zigzag not deepen the correction, it fails to move at all beyond the end of the first zigzag. This structure technically meets rules, but it looks completely wrong. This gives the wave count a low probability.
If the bull market has resumed, it must begin with a five wave structure upwards at the daily and weekly chart level. So far that is incomplete.
Downwards movement may not be a lower degree correction within minute wave v because it is in price territory of the first wave within minute wave v. This downwards movement must be minor wave 4. At 2,143 minor wave 5 would reach equality in length with minor wave 1.
Within minor wave 5, no second wave correction may move beyond the start of its first wave below 2,022.49.
TECHNICAL ANALYSIS
DAILY CHART
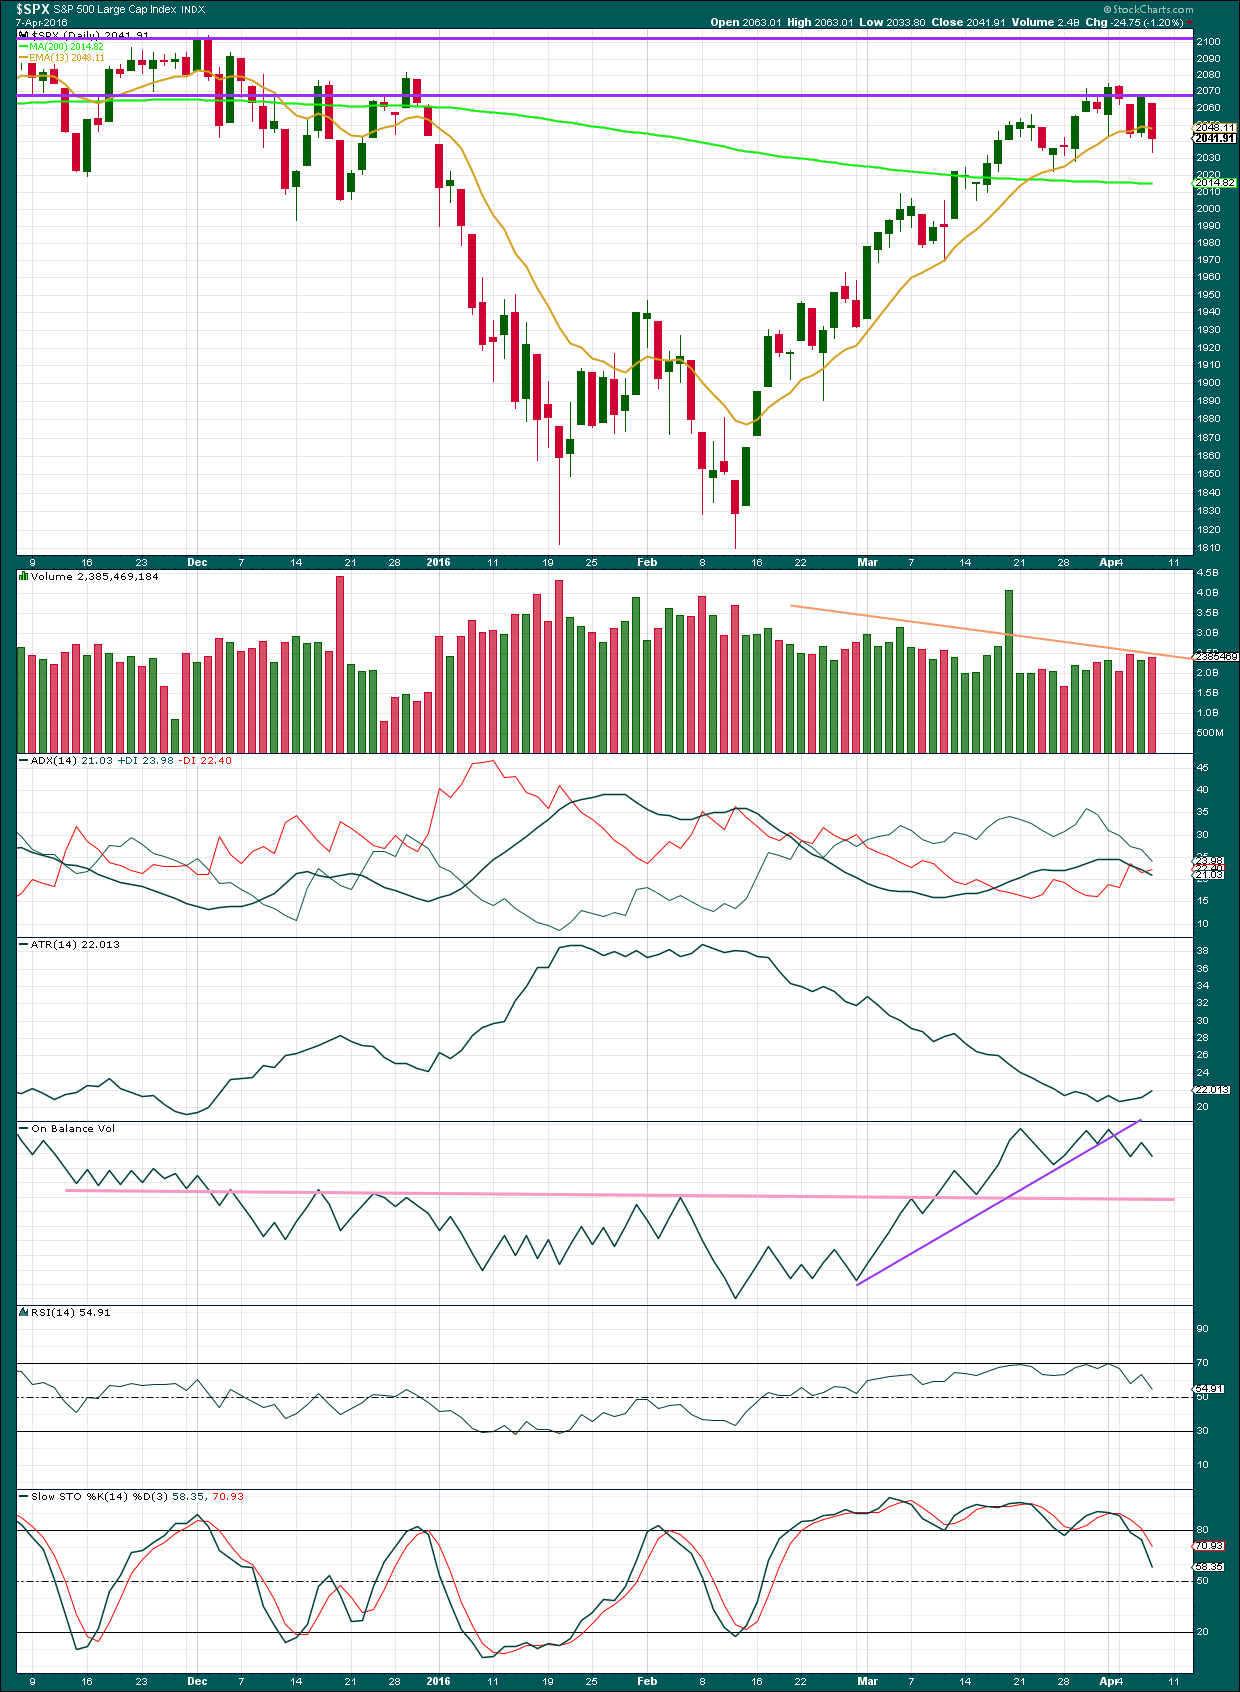
Click chart to enlarge. Chart courtesy of StockCharts.com.
Volume data on StockCharts is different to that given from NYSE, the home of this index. Comments on volume will be based on NYSE volume data when it differs from StockCharts.
Price has been trending upwards now for 38 days. The 13 day moving average did not show where price found support today, it is breached and this average is now pointing down. For this to be a clearer bearish signal price needs to move fully below the line with a full daily candlestick.
ADX is declining, indicating the market is not trending. This may be due to a small consolidation. However, this does indicate weakness. ADX is based on a 14 day average. For just three downwards days to have such an effect indicates that the trend is weak. Overall, ADX is not indicating a clear upwards trend anymore.
ATR declined as price moved higher. This is not normal for a trend. ATR is now flat to slightly increasing. If ATR begins to clearly increase while price turns down further, it may be due to the start of a stronger downwards trend developing. The Elliott wave count expects primary wave 3 is due.
This upwards movement is coming overall with declining volume. The rise in price is not sustainable and is not supported by volume. This is further weakness in this trend.
Volume slightly increased today above the prior upwards day, but volume for Thursday is lighter than the last downwards day. Price has fallen overall for four days now on short term increasing volume from the first downwards day. This does not support the Elliott wave count short term in expecting upwards movement. However, during this bear market rally there have been some downwards days with strong volume yet price turned back to make new highs. It is a sign of further weakness in the trend, not an indicator that price has turned. Overall, volume continues to decline as price moves higher (ignoring the options expiry date).
On Balance Volume is giving a weak bearish signal with a break below the purple line. This signal is weak because the line is steep, only tested twice and not long held. For OBV to give a clearer bearish signal it needs to break below the pink line which his strong technical significance.
RSI is not yet overbought, so there is still room for this upwards trend to continue.
Stochastics is showing double negative divergence with price. This does not indicate upwards movement must end here and it is just further warning that this trend is weak.
INVERTED VIX DAILY CHART
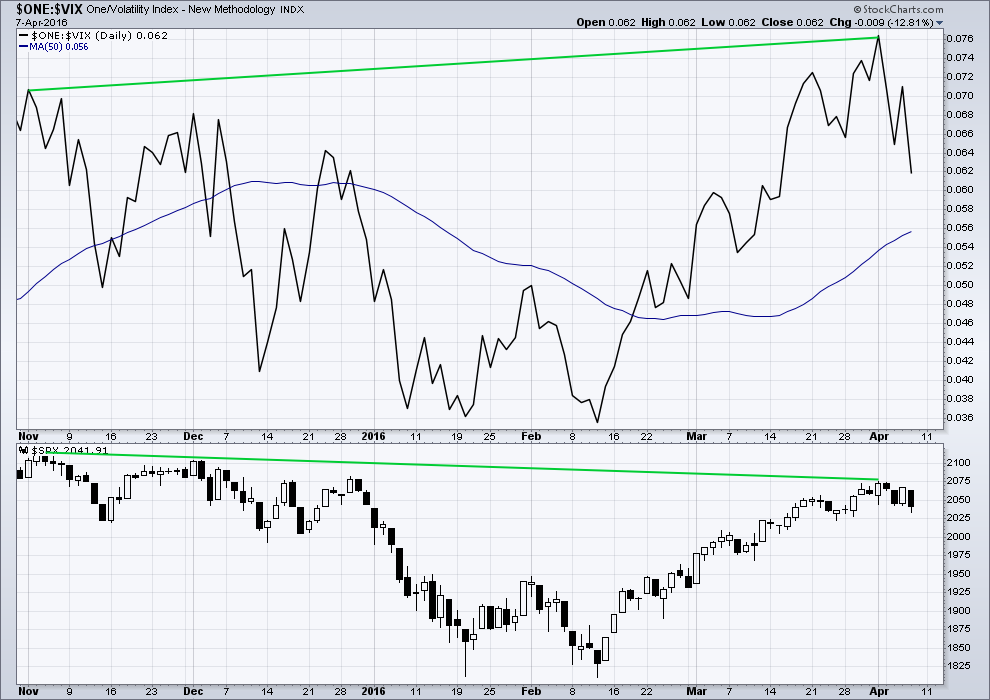
Click chart to enlarge. Chart courtesy of StockCharts.com.
Volatility declines as inverted VIX climbs. This is normal for an upwards trend.
What is not normal here is the divergence over a reasonable time period between price and inverted VIX. The decline in volatility is not translating to a corresponding increase in price. Price is weak. This divergence is bearish.
BULLISH PERCENT DAILY CHART
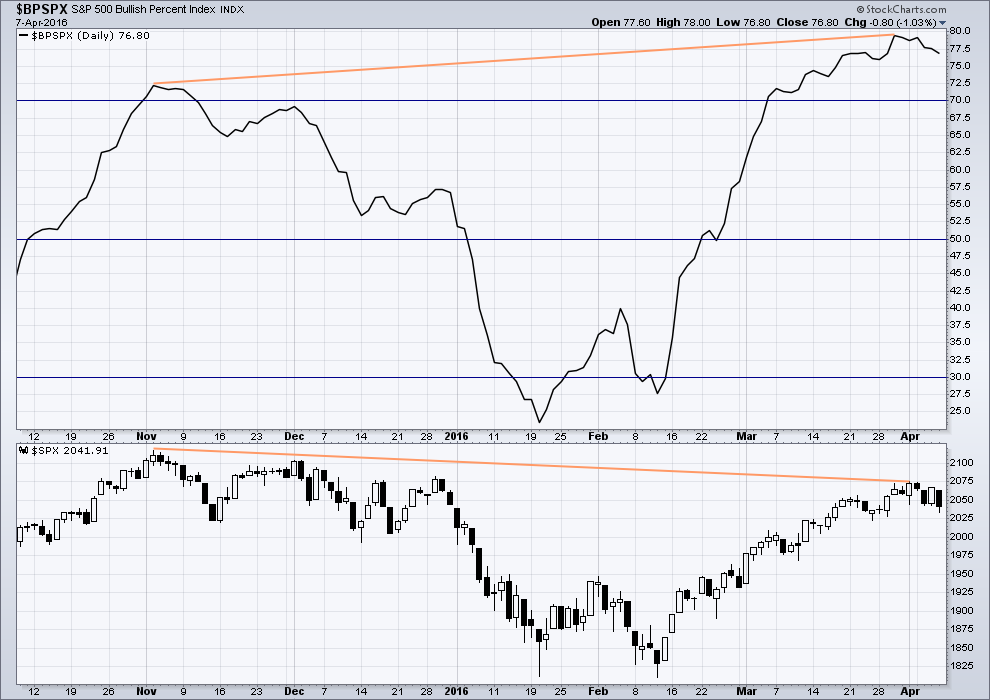
Click chart to enlarge. Chart courtesy of StockCharts.com.
There is strong hidden bearish divergence between price and the Bullish Percent Index. The increase in the percentage of bullish traders is more substantial than the last high in price. As bullish percent increases, it is not translating to a corresponding rise in price. Price is weak.
This looks like an overabundance of optimism which is not supported by price.
ADVANCE DECLINE LINE
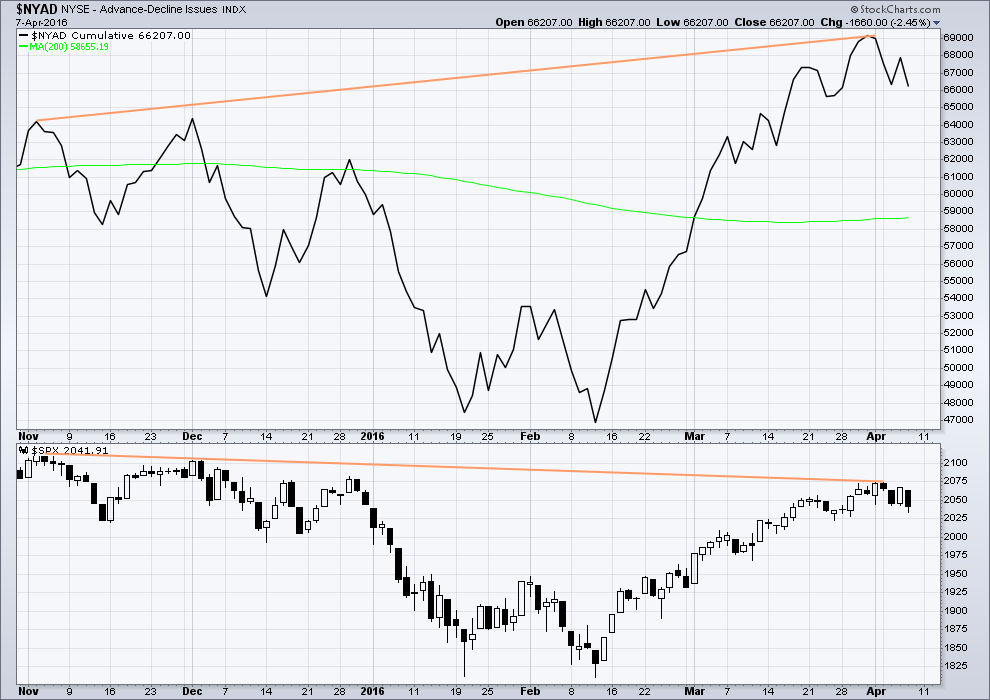
Click chart to enlarge. Chart courtesy of StockCharts.com.
With the AD line increasing, this indicates the number of advancing stocks exceeds the number of declining stocks. This indicates that there is breadth to this upwards movement.
From November 2015 to now, the AD line is making new highs while price has so far failed to make a corresponding new high. This indicates weakness in price; the increase in market breadth is unable to be translated to increase in price.
It remains to be seen if price can make new highs beyond the prior highs of 3rd November, 2015. If price can manage to do that, then this hidden bearish divergence will no longer be correct, but the fact that it is so strong at this stage is significant. The AD line will be watched daily to see if this bearish divergence continues or disappears.
The 200 day moving average for the AD line is now increasing. This alone is not enough to indicate a new bull market. During November 2015 the 200 day MA for the AD line turned upwards and yet price still made subsequent new lows.
DOW THEORY
I am choosing to use the S&P500, Dow Industrials, Dow Transportation, Nasdaq and the Russell 2000 index. Major swing lows are noted below. So far the Industrials, Transportation and Russell 2000 have made new major swing lows. None of these indices have made new highs.
I am aware that this approach is extremely conservative. Original Dow Theory has already confirmed a major trend change as both the industrials and transportation indexes have made new major lows.
At this stage, if the S&P500 and Nasdaq also make new major swing lows, then my modified Dow Theory would confirm a major new bear market. At that stage, my only wave count would be the bear wave count.
The lows below are from October 2014. These lows were the last secondary correction within the primary trend which was the bull market from 2009.
These lows must be breached by a daily close below each point.
S&P500: 1,821.61
Nasdaq: 4,117.84
DJIA: 15,855.12 – close below on 25th August 2015.
DJT: 7,700.49 – close below on 24th August 2015.
Russell 2000: 1,343.51 – close below on 25th August 2015.
This analysis is published @ 07:54 p.m. EST.
I normally avoid talking about the market and politics when seeing patients, however one gentleman who knows that I dabble in the market was in for an adjustment and starting going off about how the market was going back to new highs,, he said, surely you think we are in a bull market don’t you?,,, I smiled and said ,no I don’t,,and don’t call me Shirley. he just laughed,,end of conversation.
SPY May 6 201 puts have a delta of 0.33 and a current bid ask spread of 1.87/1.92. A target of around 2120 for SPX should see SPY trade at just about 210 as primary two comes to a nail-biting conclusion. Each three point move up in SPY should reduce the price of those puts by just about 1.00 so if SPX hits anywhere close to 2100 next week, those puts are going to be awfully mis-priced considering what could be directly ahead…a really manic final run up go actually see the bid go to 0.01/0.05 intra-day…which is essentially free… 🙂
Draghi must be wondering what’s next
http://bloom.bg/1VcKKi9
As counter-intuitive as it may seem, scalping upside moves in this down-trend has been easier than the moves down. The sweet spot of the impulsive moves down have been occurring intra-day and unless you were positioned ahead of time, it is really difficult to make any profits worth the effort, especially if you trade options. As soon as the move down begins the option premiums go sky high and trying to get positioned the day of the decline is a waste of time. The real key has been spotting the end of impulses down and taking positions then if you are trading short term. It will be interesting to discover on Monday, if we were presented with such an opportunity at the end of Friday’s impulse down. If futures are up strongly on Monday, I will re-load a few SPY 206 calls at the open for an upside scalp. If they are down strongly that would be self-explanatory. If they are down slightly, I would be looking for an initial move down to start the trading day followed by a strong intra-day reversal, similar to the start of minute one up. Stay frosty! 🙂
I must say I am quite amused over the uproar surrounding the so-called “Panama Papers”.
All my friends who know I am from the BVI want to know where we are hiding all those trillions in off-shore accounts. 🙂
Those folk in the UK are particularly puzzling. They silently allow the cretin politicians they put in office to erode their freedoms and wreck their economy with all kinds of bone-headed schemes, wantonly squandering the remarkable opportunities for fiscal soundness far into the future presented to them the past several decades by the North Sea oil discovery, but now they want to riot because Cameron has an off-shore account?!
I am coming to conclusion that, like the fluoride poisoning the drinking water of so many clueless Americans, there must be something in the air some European countries are breathing that is leading to severe cranial malfunction.
The Dutch seem to have a clue…
Yep – living in Isle of Man I’m getting the same sort of questions. The funny thing is that the people who actually live in these places are (usually) squeaky clean. If you don’t live under a totalitarian government then you don’t need to hide anything. There is pretty much no crime at all in IoM.
For years the UK government has been bashing IoM (and other places) and branding us a tax haven, when the real truth of the matter is that UK (and other countries) are far bigger and better tax havens than IoM could ever wish for. The amount of laundered money in UK property and the non dom UK tax rules make so called ‘tax shelters’ look like amateurs.
That said, if I lived in UK (or anywhere else ‘onshore’) I would not be trying to hide funds in shell companies offshore – it is just plain stupidity and morally wrong. If you choose to live somewhere you should play by the same rules as everyone else regardless how draconian.
If these people are making so much money they need to hide it, then I cannot understand why they don’t just get the heck out… IoM and BVI are wonderful places to live with a fantastic standard of living (yeah BVI is a bit warmer than IoM, but yer can’t have everything 🙂 )
Just realised that some of these characters may want to hide it as it came from ‘dodgy’ activities. These kind of people are def not welcome on my pretty little island nor do we want them to stash their ill-gotten gains here!!
The additional warmth in the BVI is nothing a quick splash in any one of numerous white sand beaches could not speedily remedy. The gentleman who heads the FSC (financial services corporation) and I were school and house mates; yes, back then we had the British system (like Harry Potter) of academic houses. He tells the funniest stories about how much pressure they get from the US State Department and the UK about their IBCs. He does not have too much respect for these apparatchiks trying to lecture him about money laundering and other such skulduggery when it is so rampant in their own home countries…talk about irony….!
Isle of Man,, I had to look it up, very interesting, out in the middle of the Irish Sea. Is Isle of Man self governed? I never would have thunk that that is where you live,, I didn’t pick up on your accent at all! I would guess that driving that big truck of yours has limits .
Yep – it is claimed to be the oldest continuous parliamentary body in the world.
https://en.wikipedia.org/wiki/Tynwald
It is indeed – is claimed to be the oldest continuous parliamentary body in the world.
http://www.buzzfeed.com/robinedds/reasons-living-in-the-isle-of-man-ruins-you-for-life
Most people (not me) have a *very* mild Liverpool sort of accent – there has been a direct ferry service from Liverpool for decades so I guess a lot of people migrated from there over the years.
Yeah – parking that thing is a bit of a challenge sometimes – particularly on Saturdays. Fortunately the window is too high for parking inspectors to put a fixed penalty ticket on 🙂
Regarding people being angry at the wrong thing – I think people are waking up to the fact that something is wrong and they feel cheated and angry, but they still aren’t quite sure what it is they should be angry about or why things went so wrong so quickly. It would help if they stopped watching so much TV and listening to the endless propaganda spewed from it (and other media) on a daily basis.
The tide of social mood is turning because the Ponzi scheme has almost collapsed – but I think it is 20 years too late. In many countries the changes and actions now required to give people a reasonable amount of hope for their own and their childrens futures probably won’t be very pretty or easy.
Another thought for consideration, market players want majority of holders to get long on the market as everything is so good earnings are growing, jobs are getting created, financial systems are healthy…so what is the best way to assure the retail investors to commit their hard earned money… Float a news that they feel secure and buy the market… “There is an outstanding short position of over 1 trillion dollars that will keep the rally going as the shorts cover with each move higher…”
This will make sure people are not going to sell the stocks on smaller declines and by the time markets have dropped significantly, it will be too late and they will stay invested rather than losing the money.
I wonder if the media asked the establishments to show the evidence how they came up with that number on short positions. It is totally irresponsible on media to simply push the news that is not supported by evidence.
Don’t believe that $1 Trillion Sort position.
It includes being short on all inverse ETF’s which is in effect a long position. So that number is BS!
Thanks for that idea Joseph. I was contemplating that idea also: the massive short covering taking the market to new all time highs and beyond. Also, the earnings expectations are so low for the upcoming earnings season. I was thinking the earnings surprises to the upside (with the bar set so low) would also take the market higher… My gut feeling, and my money is still on the short side though.
As I take a step back, I wouldn’t be surprised if the market meanders here for a while, bouncing between SPX 2100 and 2000. Just to frustrate everyone on the long and short side…
In reviewing the weekly charts, we did not get a hanging man candle. For a hanging man candle the lower shadow line must be at least twice as long as the real body. So it does not work.
That does not mean the candle is not bearish, however. This week’s and last week’s candles on the weekly chart shows that the bulls pushed it up to 2075 SPX. But they could not hold it. The bears pushed it down and held it down. It shows exhaustion on the part of the bulls and the bears are gaining strength.
Friday’s price action seemed quite tepid for a third wave but that could easily change on Monday. Minute one up on March 28 also began with a relatively weak candle. Minute one up lasted five days, and the only daily red candle during that wave was the start of minuette four on March 31, which moved lower the next day to start minuette five up to a new recovery high of 2075.07 on April 1. Looking at how minute one up started, one could argue that the weak candle for the start of minute three up is not exceptionally unusual. It does suggest if we are in minute three up we should see strong upward movement begin on Monday and continue for at least a few days. If futures are weak on Sunday night I think it would greatly weaken the case for a third wave up. Whatever scenario plays out, we are very likely only days from the start of what could prove to be an epic wave down. I think a quick scalp to the upside would be low risk with futures confirming the third wave up.
Nice spot, Verne. The similarity is clear and has a good chance of repeating the follow through upwards.
But I am not sure I agree they are weak candles but rather strong or bullish. In each case the bulls were able to open the market above the previous day’s close. This is a occurring after several days of declines. That shows strength for the bulls. In each case, the bulls were able to close above the previous day’s close and that day’s open. Again, I think this shows strength for the bulls. They were able to stop the bear’s assault.
I think those two days, candles, may be showing the bulls have wrestled away control and are going to push it higher. Which is what happened the following day in minute 1 in the above chart. If that theory / reasoning is correct, then we have another piece of evidence supporting the probability of a strong move up Monday.
And as importantly, if your identification of this action at the start of impulse waves, for the upside, proves consistently reliable, we will add one more valuable weapon to our arsenal. Thanks Verne.
Most welcome!
I do agree with your assessment of the possible significance of the candles. I may have chosen an imprecise word by referring to the candle as “weak” as I did not intend it in the sense of bullish or bearish but more directionally weak.
The following day’s candle was a fat green one and a strong bullish signal. If it had been a fat red one it would have been conversely a strong bearish signal. Perhaps “skinny” would be better nomenclature. And that’s the real skinny folks! 🙂
(Not to be confused with having “skin” in the game)
Yep. Calls expiring next week are pricey so bullish sentiment prevails. If futures are only mildly lower Sunday we may see a similar scenario as played out with the start of minute one up with a candle that first moves lower then up big time…just to keep the bears off balance of course… 🙂
Thanks to all for today’s and all week’s participation in this blog. I feel very fortunate to be here. So thanks and have a great weekend.
Take a step back and look at the big picture. Take a look at a 4 or 5 year long chart of the daily prices for all the major averages. Use 200 day moving average. What do you see? The markets / indices are all giving the same picture. They are all lined up and ready to go. Everything is synchronized. That makes whatever happens next all the more powerful.
What do I see? I see in those 4 & 5 year charts a road leading up a mountain. The elevation to the left of the chart is sea level and we are now on top of a mountain. Except we have gone a bit past the peak elevation and have begun the trip back down the mountain. the driver in the car thinks everything is wonderful. Such beautiful scenery. Sure there have been a few bumps in the road over the last year. But nothing to spoil the trip. And they proceed in confidence.
They have a problem though. They do not know that not too far ahead the mountain stops its gentle decline and ends with a cliff. It always does. It always will. At the bottom of the cliff we be piles of dead bulls / lemmings / auto drivers, whatever.
As you may know, I am not fully loaded with my short positions. But I am in and willing to wait to 2100 or more if necessary. But I also know how the cliff can happen. So this week as last, I got some skin in the game. And I am excited because I have patiently waited for this for years. Last year was very challenging because net result was basically sideways. All that frustration and hard work is about to pay off.
I say all this because I do not think we are witnessing the start of wave five of the continuing bull market. Joe Namath (Super Bowl winning quarterback in the late ’60’s) said the week before the game that he guaranteed the New York Jets would beat the Balimore Colts the reigning powerhouse of the NFL. Well, Joe and the Jets won. I though that took a lot of balls or insanity to say such a brash thing. And when his balls were on the line, he won!
A new leg up in the continuing bull market ain’t gonna happen. I guarantee it! We either go to 2100+ and top, then crash. Or, we are in the start of the crash right now. I don’t mind either. Rather I am looking forward to the next couple of weeks.
(Please excuse me for any offensive words etc. I did not mean hurt or offend anyone. I never do. I was just reverting to the language of my more challenging upbringing on the streets of Chicago. I’ll be polite again.)
oh my gawd… you said balls..(grin) I loved visiting Chicago,,I even had a hot dog..
The best. Every other street corner had a hot dog place. In between you could buy the best pizza in the world. I miss parts of it. But there are already at 900+ murders in the city itself not counting the suburbs. I said good-bye 16 years ago.
Rodney, I must admit you picked a great example in Joe Namath to make your point. He was the player that started my enjoyment of Football when I was a kid growing up in Brooklyn NY. I have been a die hard NY Jets fan & season ticket holder ever since. But I gave up my season tickets when they fired Rex Ryan.
I too have been waiting an this for a long time. My 1st major short position was put on in May of 2015 to play this (Leap Options & other). I still have that position in Leap options and I still believe it will pay off big. The May 2015 to now could have been more profitable if I traded out and in more often. That’s why I am back with Lara’s service… looking for an few extra med term trades.
No need to be politically correct… political correctness is ruining the core values & principals of this nation… as the other great man who grew up in Queens NY says often.
Be who you are… don’t let the PC Police change you.
An interesting observation about this week’s market action.
They trotted out a number of former FED chairmen along with Yellen on Bloomberg to talk a lot of drivel (I am surprised Volcker allowed himself to be so demeaned!) trying to justify the FED’s bloated balance sheet, inaction on rates, and then concluded that the US economy was “fundamentally sound”.
They then waited until close to the open this morning to ratchet up the futures market in the hope that the lemmings would all jump on board.
Well guess what? They did not, for the most part, and what we saw the rest of the day was not so much aggressive selling, as much as simply an absence of buyers.
To the extent that the banksters can entice the crowd to collude with them in a manic push of the markets higher, I think that game is over.
That does not mean they are done. I expect to see them double down over the week-end with a big cash dump into futures to try and press the case. i for one do not think it will be the start of a third wave up, and will expect the effort to fade, just as price did today. I stayed in the day-trade today a bit too long with my second batch of calls but will not make that mistake again come Monday. If futures are up huge Sunday night, I will again trade the open but I fully expect the pop to be re-traced to the downside. Either way I load the remainder of my short-term shorts on Monday.
If it is a third up, I still would be happy to pile any profits into positions anticipating the avalanche down. If we see a blood-bath in futures on Sunday, that certainly needs no explanation, now does it? 🙂
Have a great week-end everybody!
Vern,
Did you catch the stuff Greenspan mentioned about FED not having good data or better read on the economy and hence challenging. He did state this was the case in the past and still is the case.
So all folks who think FED has better visibility and must see something in the future are dreaming or should I say blind following the blind..
If you read between the lines of some of the comments you definitely get the sense that we are in real serious trouble. Greenspan’s subterfuge about the quality of the data is just another bit of smoke and mirrors feint to blunt Yellen’s now well known mantra about FED decisions being “data dependent”.
I had a hard time listening to them and literally felt ill as they droned on with all the propaganda they have to know is patently false. The have built a frightful house of cards that is going to come crashing down on all our heads I am afraid. The gold miners are going hog-wild and it is amazing how similar all the charts are. They all look to be breaking out from a fourth wave triangle so Lara’s call for a correction may be right on target; unless we are about to see the famous commodity extended fifth wave up. Apparently Lara is expecting an intermediate third up for the metal so they be at different stages in the wave count. There are lots of back-room rumours about new gold-back currencies….
China and Russia are pressing for delivery of gold they bought so pretty soon it will breakout and real panic will start then
The FED owes Germany tons, who apparently meekly agreed to have it sent to them over the next seven years! Can you imagine? I think the Germans don’t want to make waves as they know widespread awareness of the true supply story about Gold would instigate wholesale panic and spell the doom for fiat currencies, including their own. Every single gram of gold mined in China by law remains in the country and they are simultaneously cleaning out the COMEX supply. They are being very smart and doing it gradually so as not to attract too much attention, but I hear the COMEX is now scrambling as they cannot bully the Chinese into paper settlements as they do their retail clients. The charts of gold and silver metals are on a tear! I think we are about to get a final buying opportunity over the next week or two. Some of the charts are parabolic and due for a pullback.
Vern,
I don’t think the claimed reserve at Fort Knox actually exists, I suspect that they used it to keep lid on gold prices.
I hit the city and I lost my band
I watched he needle take another man,
GONE, GONE, the damage done…
Neil Young
One interesting item that was NOT reported or commented on anywhere but on Zero Hedge early on Friday…
Fed To Hold Closed, Unexpected Meeting Under “Expedited Procedures” On Monday To Discuss Rates
http://www.zerohedge.com/news/2016-04-08/fed-hold-unexpected-meeting-under-expedited-procedures-monday-discuss-rates
Those unexpected meetings and former Fed Chairmen speaking on Bloomberg is ominous. Those sort of things are happening for very important reasons. Five or six years from now when they make the movie about this crash, we will see what was really happening behind the scenes. Thanks Joseph.
Are you now a Buffalo Bills fan?
Still a Jets fan but also following the Bills each week and watching their games when on the air in NJ.
I must have been showing some Joy when after each game Rex (Bills) beat the Jets last season, especially after the 2nd game because my wife (also a die hard Jets fan) was really upset and angry with me.
Rex brought the Jets to a place no other coach had in 2009 & 2010… for that I will be forever grateful. If they had just a little more talent on offense & at QB position… it might have been one or two SB wins. Now the Jets are starting over yet again… I might not get to enjoy a SB win before I die or be at an age to care.
He! He! Yellen will unctuously announce that a proper response to the data now requires a 25 basis points rate cut! Can you believe these people??!! 😀
We still have what looks like a clear five up followed by a three down on the hourly chart.
I’m moving the invalidation point (and my stop on a small buy) up to the end of minute ii.
Minute iii should be underway. The analysis won’t change much except for that moving of the invalidation point. The target is still 2,119.
Now I know this is a deep correction. But it hasn’t made a new low and so far this downwards movement today looks like a three. It can’t be an unfolding five down either, the fourth wave would be in first wave price territory.
And so if we have had a trend change there are now three first and second waves to the downside.
A new high above 2,052.98 would eliminate the possibility that upwards movement is yet another second wave, so would add some confidence to the main wave count.
And I still don’t think intermediate (C) is truncated by 41.41 points.
Yep. Although it’s quite deep, it does count as a three on the one hour chart. UVXY is making me a bit nervous though…it should be heading straight South toward new lows ahead of third wave up…maybe the deep correction is making it act out of character…
This (possible) minuette ii looking very similar to minute ii on the 1 min chart atm.
No real good clues today (other than that last pop upwards stopping todays downwards move being viewed as a straight 5 – at best it must be a couple of 1,2s) – could still go eirther way imho.
Still SOH – if we gap through 2022 on Monday then so be it. I’ll not be too worried whether I picked UVXY up at 15 or 25 when it’s trading above 100 🙂
That said, I suppose the poss minuette (i) being a nice impulse up from yesterdays lows was maybe a decent clue…
Next week should provide clarity – I’m travelling all day Wednesday and Thursday so hopefully we’ll have some kind of resolution before then.
How are doing for volume both UVXY and TVIX now over 34 million shares traded each …?
Is it going to start as Sunday Bloody Sunday and lead into manic, panic Monday ?
Volume huge on UVXY…
I think the overall shape of this wave count down is too rounded to be a wave 2. I think a 3 down is shaping up!
It’s just got lower
SPX almost negative and UVXY still down 4.7% – looks bullish to me atm.
We should soon know – if this is minuette ii then it should almost be over. It is still contained within its base channel so nothing unusual just yet.
Going above 2053 now would seal the deal – but we might not get that today.
Below 2033 the theory goes up in smoke.
I looked into the subject of truncation, I found that it is possible to have significant truncation, notice the disproportion in this picture,,
LOLOLOLOL…
HAHAHAAHAH…
I’m not yelling, just lmao…
Thanks Doc… 🙂
LMAO
Me too! Truth – I laughed out loud. Thanks doc
We may be seeing a lot of algo trading today with the heavy hitters all SOH waiting for the other to move. Unless we see some hot and heavy action into the close we will probably end the day a wash. I am keeping rest of short term ammo in cash until we know more. Have a great weekend all!
There is the break from that triangle – will it reverse and head South, or take out this morning highs?
This could go either way folks. The market is clearly tired, but that has never stopped the banksters. While a huge sell-off looks imminent, it is not necessarily inevitable. The banksters could step in with a big cash dump to bolster the bulls’ flagging spirits. Any such bankster largesse in my view will be short-lived in its efficacy; I think the markets are running on empty.
Yep – we’ve currently still got a series of lower highs and lower lows from the 2075 high, so still not alot of clarity atm.
Impulse up from this morning looks textbook though, so there is still some fight left it would seem. Bring it on I say – I’d very much like to pick up a truck load of UVXY in the mid teens.
No doubt the rest of the day will be a snooze fest with a gap up on Monday to kick off the 3rd of a 3rd.
Once again we are seeing the ubiquitous triangle developing. The current action does look corrective so Olga may be right about it being minuette two of minute three. The pattern lately has been for price action to break in one direction from these triangles and quickly reverse and head in the opposite direction. One minute chart has UVXY heading back South so we may see a break one way or the other soon…
Anyone care to take a stab at the current hourly wave count? Where is Olga???
Lurkin….. 🙂
Imho we are currently in minuette ii of minute iii. Once this has finished we should blast higher in minuette ii of minute iii. First target for this downward move to finish is 2043 (61.8 fib), second target 2040 to fill the gap. Below there starts to smell fishy.
Yesterdays low is the line in the sand for the above view (below 2034 is invalidated)
ThanQ 🙂
No worries…
Edit: ‘we should blast higher in minuette *iii* of minute iii’
Good call. Today’s gap and yesterday’s low are very important at is today’s high at 2060.
I have just added to my short positions. Another 1/8 of my full position. I am now at 3/8 full.
3 wagons ready to go. 5 more to fill.
If we close today where we are right now, SPX 2049, Monday could be a gap an go to the downside taking out 2022.
Disclaimer: The preferred count is preferred until it isn’t. Lara has warned caution and that should be strongly considered. I am responsible for my decisions and mine alone.
I am still holding a bit of dry powder to be deployed if indices print the rest of the indices print a red candle today. UVXY bearish put spread the only my only remaining hedge…I doubt we will re-visit 18.00 anytime soon…
Farewell and adieu, to you Spanish Ladies…
Farewell and adieu, ye ladies of Spain….! 🙂
I am grabbing all the UVXY calls I can get my hot little hands on….
Verne, can I ask you what expiration date you’re looking at?
Sorry about the delay in replying as I did not see this query until now. I am buying May standard expiration to be on the safe side. As soon as the trend down is confirmed, I will exit those positions and buy contracts two weeks out…the most powerful UVXY trades are made the same week of capitulation but that needs extremely close monitoring of the wave count and price action and not everyone has the time or patience for that.
A safe approach is to cash in when price breaches the upper BB, and short it on the second close back beneath the upper BB, at least ONE MONTH out if you are buying puts. Selling the shares short is fairly low risk as I have never seen it spend an extended period above the upper BB. The volatility reversion-to-the-mean trade is the bread and butter trade of quite a few savvy traders. All the best executing the trade! 🙂
ThanQ for your input. I’m not going to be shorting UVXY, but I am waiting to buy some calls on it if it goes back below 19 again. If Lara’s analysis is correct, and if we’re in a minute iii up, I’m guessing UVXY will be cheap if and when we approach 2100 on SPX…
If we are in a third wave up, we will likely see a new 52 week low below 17.97 next week. A new 52 week low would be the best buying opportunity this year. Anything below 20 is a good risk reward ratio trade imo, especially for those buying the shares. Calls should be at least a few weeks to expiration…
What is particularly dicey about the market’s lethargy is there has not been a lot of selling pressure so far as I can determine. When that is going on the wrangling between bulls and bears is pretty evident in the contested price action. What we have is a tired, lumbering, aged bull about to collapse under the weight of its own inertial ennui…
I had to look up that word: ennui
a feeling of listlessness and dissatisfaction arising from a lack of occupation or excitement.
Bingo! 🙂
Don’cha think it fits?
I do not believe we are in a third wave up, nor do I believe minute two is continuing…NDX already in the red…I think things are about to get very ugly…for the bulls that is…
COMPQX (Nasdaq) had a bearish MACD daily cross over yesterday. Today QQQ has done the same.
Yep. So far, five up, three down off the bottom for UVXY…
I knew it would be insanity going into the week-end long but who knew we would see an intra-day bull-trap sprung??!!
Very tricksy! 🙂
NASDAQ leaders all in read now, selling should gain momentum after 1:00PM as folks want to clean the portfolios going into the weekend of any unnecessary risk based on market’s current posture.
Take a look at SPX 30min Chart for 5 days and that pattern today… What followed looks impulsive to me.
UVXY is steadily being accumulated…major bearish implications…out of remaining long trades…
Vern,
I suspect we see the markets breakdown to the downside , technology has been pretty weak and if this is all the bulls can muster into the weekend, we got a sell off coming in the afternoon IMHO
I think it is going to be a blood-bath…I was thinking UVXY going below 20 would be a great buying opportunity but I had absolutely no idea that it would be so short-lived…this is starting to look like a very explosive situation developing, truncation or no; it is looking to me like any remaining upside potential is very limited at best…of course we ought not be too surprised…all the signals of the market’s condition have been staring us in the face for many days now…
Vern,
Nice setup on IBB, what do you think?
It’s probably going to take out the Feb 11 low at 240.55…the last bounce attempt got nowhere near the 200 dma…
Keeping an eye on UVXY gap from yesterday at 22.07 which may get filled in a head fake. If we take out yesterday’s high at at 22.93 all bets are off and I think this upward correction is over…
If the SPX closes below 2075 or so today, we will have a weekly hanging man candle. This bearish reversal pattern must be confirmed by follow through to the downside next week. But it is a bearish reversal candle nonetheless.
SPX needs to take out 2067.33 an move above that to give confidence in the preferred bear count. Right now it is stalled in what might just be a normal correction. The next attempt at 2067 will be telling if the bulls have wrestled back control.
Verne’s concern is well warranted. It is just one reason I do not like to trade against the main trend, in t his case bearish. In a bear market, the surprises are to the downside.
.
Thanks Barry. I’ve corrected it to read “below 2075”. My bad!
Wise observation. I got a bit greedy with the second batch of those SPY calls. A good reminder about leaving profits in the market on short term trades….especially against the main trend…live and learn…unless the banksters step in in a big way (which they well might), it is not looking too good for the bulls.. 🙁
I don’t like the looks of this slow fade folks. We may have the makings of a second wave up instead of a third. Watching closely but this is starting to look a bit suspicious for what should be a third impulse up…if we go below a 50% re-trace of this morning’s move up I am bailing on the long trades….
Small second wave correction underway. Next target 2067.33 which should fall this morning…
There are probably still some short positions entered yesterday that are holding on hoping for a reversal. If the indices approach the amount of the decline yesterday on the upside we should see a spike up as the early eager beavers bail…
Selling half SPY 205 calls….
SPY calls now trading at 0.85. Opened STC limit order of 1.25 good for the day.
Still holding UVXY 21.5 put for a bit more downside as I think 18.00 in play…
If you trade UVXY shares instead of options, this is probably the last time this year you are going to see it below 20.00 “Nuff said! 🙂
The caution regarding UVXY in play. Decline is quite orderly, unlike the plunge we normally see with block-sale shorting at the advent of impulses up. The caution is indeed warranted. It may find initial support around 20.00
I am willing to buy shares at 18 so selling the 18/16 put spread with expectation of being assigned shares if UVXY trading at 18 or below at the end of next week….
When we get to and above 2100, there is a very good chance we will see many negative divergences. I will look for daily MACD and RSI to produce negative divergences. That will be a good set up with limited risk and potential huge reward.
I have a feeling we are going to see some stiff resistance at 2075 so minute three may stall there. It makes sense that we would see a final run at the round number pivot of 2100 on minute five up after a shallow minute four.
UVXY now just below 20.00….
The market generally does what it takes to fool the most folk. Anyone who was not already positioned and jumped on the band wagon yesterday and did not close their trades out intra-day are going to loose money unless they are positioned for the long term. The market is again starting to display long waves at lower degree which may be a harbinger of what’s coming; after all, yesterday’s down-draft was in a corrective wave so we can imagine how violent the upcoming impulses down are going to be. After minute three, minute four should be shallower to show alternation with minute two and I plan on getting re-positioned short-term during that final pull-back. SPY 205 calls expiring tomorrow are a cinch for the nimble. Looks like that 21.50 UVXY put (just for giggles) picked up yesterday should be an easy double – pre-market bid is 20.48 and it is going lower into the close I suspect. A short term bearish trade on UVXY is also low risk for the nimble. The targets notwithstanding, I plan on going into the weekend short term neutral. I hear Momma Grizzly roaring just around the corner…. 🙂
Good morning to all.
I know Grizzly bears. I adventure among them and have encountered many. One only a few paces away. That was scary. But the thing is, Grizzlies do not announce their presence especially when they are around the corner. Despite their size they can be surprisingly stealthy. After all, they catch elk and deer especially the fawns but the adults frequently as well.
I think the equity bears are just like that. The bear market can be stealthy. If you watch closely, you can see tracks and tell tale signs. But for the uninitiated, they have no ideal the bear is right around the corner. And they end up mauled and perhaps eaten. By the way, Grizzly bears disembowel their prey eating all the internal organs first. They are especially fond of the heart!
That is why a move to 2100 now will capture the most people. They will say we now have a higher low and higher high. They will be looking for a new all time high. They will say, “The way is clear! Lets go for it.”
And then pow! The bear will pounce and before they know what has happened they will be dying or dead.
One other point. Grizzly bears are know to ‘false charge’ or bluff charge. They will run right up to you and even past you. They want to see how you react. if you run, you’re dead. If you stand your ground, you have a chance as they may just back off (if you do not look them in the eyes). If they attack, you should not fight back against a Grizzly. Just play dead and tolerate the pain as they bite and claw. Fortunately, black bears which are way more common are not nearly as aggressive or dangerous. Nothing to play around with though.
The bear market of 2015-2017 is a Grizzly. It is going to disembowel the masses.
Now on that note, Have a wonderful day!
Lets see this final 5th Wave up and then a true collapse where we can sell and walk away. looking forward to this
Thanks for the lesson Rod. It seems to me the characteristics you describe are right in keeping with what’s going to befall the hapless bulls. Thanks to Lara’s spot-on analysis, our ears are much more attuned to the ursine predator, stealthy though its moves may be… 🙂
On the trading front, I expect this third up to take out 2075 sometime today so will be snagging a few 205 SPY calls at the open for a quick scalp, to be redeemed before the close.
I am looking also for UVXY to descend below 20 at which time the 21.50 put will be laid to rest. Have a great day all!
Filled on 205 calls @0.60 per contract…
The Wilshire 5000 also at a turning point:
https://1.bp.blogspot.com/-KSVqV4fjWAU/VwbFj6I2bzI/AAAAAAAAcMA/ZdeNcZpbfTsL6AZtGhJr-jvHkT3A01e3Q/s1600/Wilshire%2BDaily.png
Hi Team,
USD/JPY at an important juncture.
http://blog.kimblechartingsolutions.com/2016/04/king-dollaryen-could-break-down-send-risk-off-message-to-stocks/
woo hoo,,,