
Upwards movement was expected. This is what happened.
The Elliott wave count remains on track.
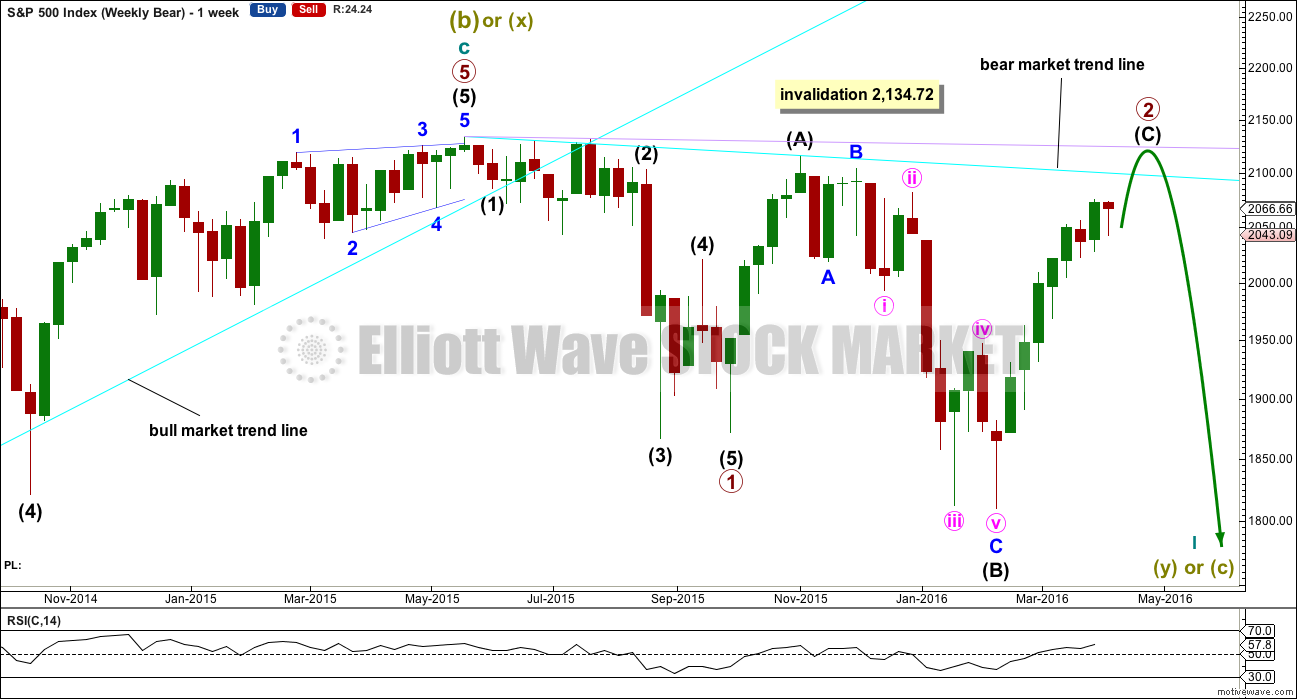
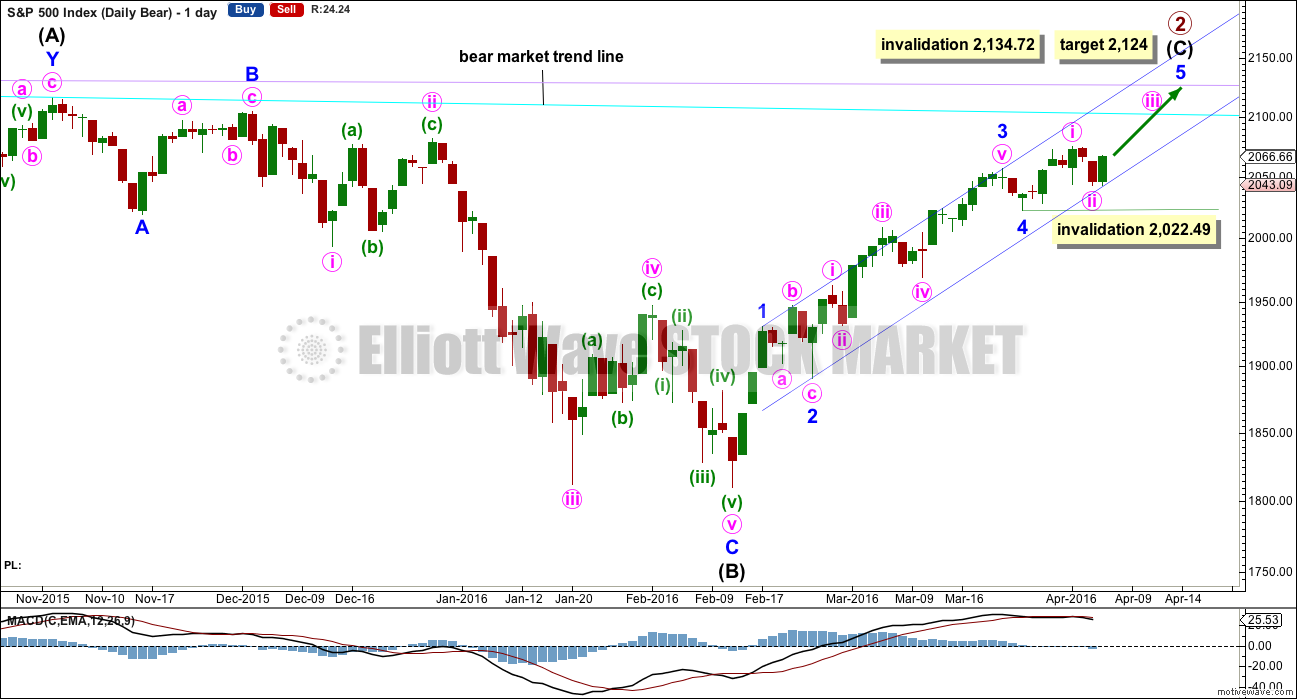
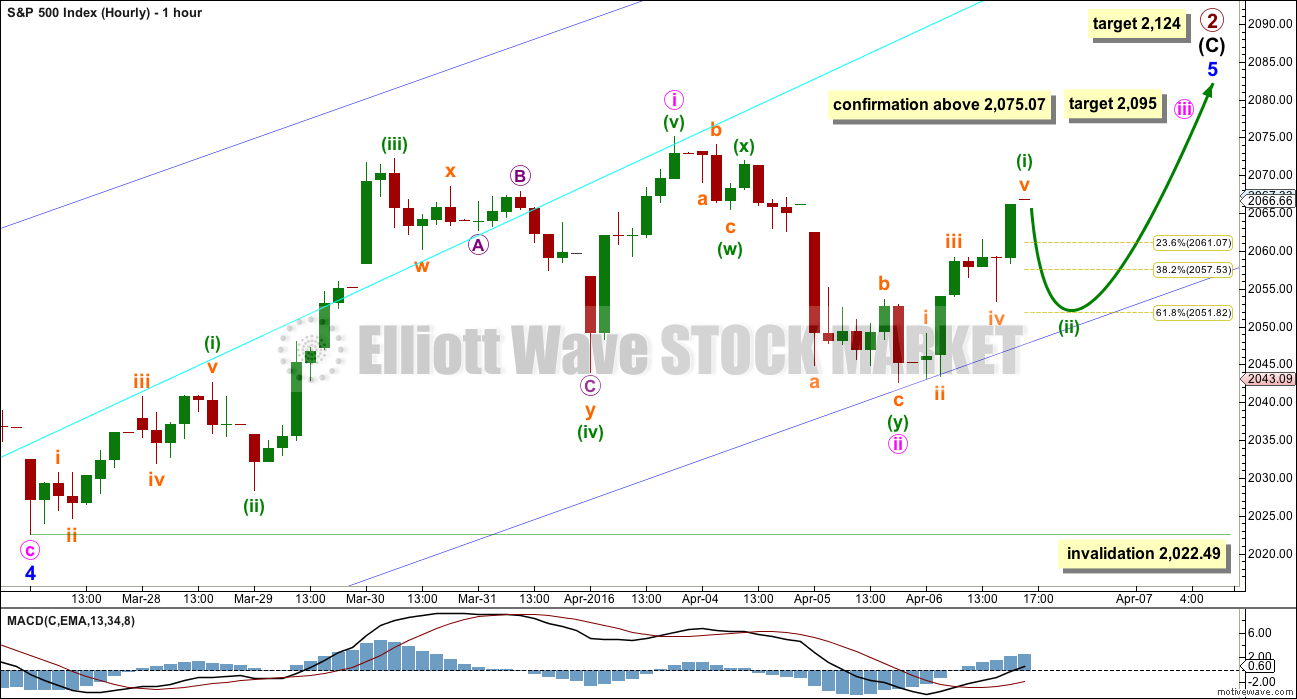
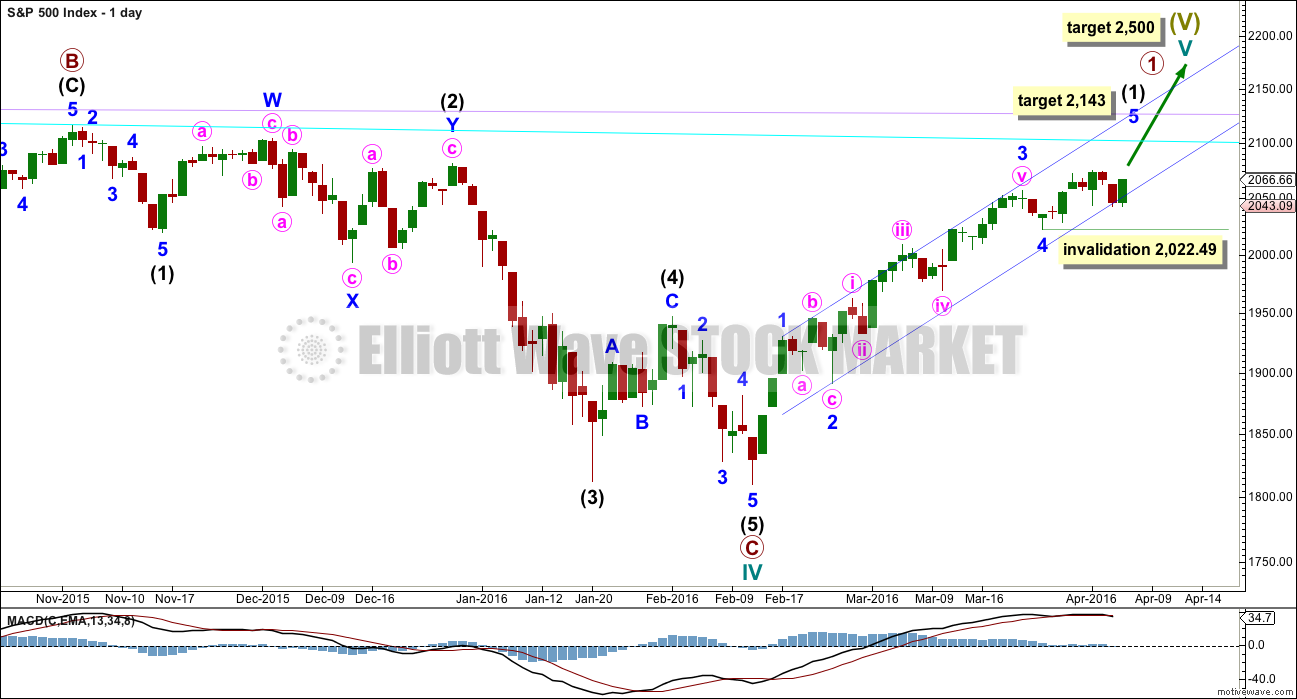
Summary: This is still a bear market rally until proven otherwise. A final fifth wave up is required to complete the structure. The target is 2,124. The invalidation point for this rally is 2,134.72. A short term target for a small third wave up is at 2,095, which may take a few days to get there.
To see last published monthly charts click here.
To see how each of the bull and bear wave counts fit within a larger time frame see the Grand Supercycle Analysis.
To see detail of the bull market from 2009 to the all time high on weekly charts, click here.
New updates to this analysis are in bold.
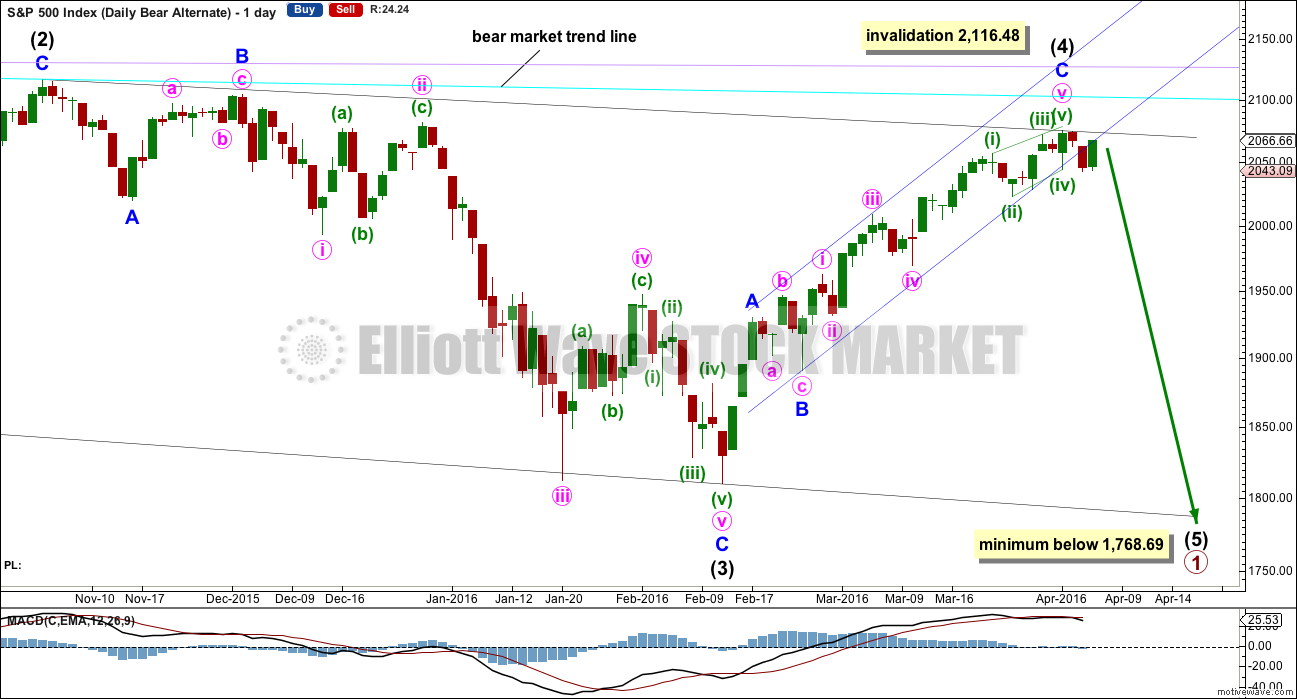
BEAR ELLIOTT WAVE COUNT
WEEKLY CHART
Click chart to enlarge.
This bear wave count fits better than the bull with the even larger picture, super cycle analysis found here. It is also well supported by regular technical analysis at the monthly chart level.
Importantly, there is no lower invalidation point for this wave count. That means there is no lower limit to this bear market.
Primary wave 1 may be complete and may have lasted 19 weeks, two short of a Fibonacci 21. So far primary wave 2 has begun its 26th week. It looks unlikely to continue for another 8 weeks to total a Fibonacci 34, so it may end in about two to three weeks time. This would still give reasonable proportion between primary waves 1 and 2. Corrections (particularly more time consuming flat corrections) do have a tendency to be longer lasting than impulses.
Primary wave 2 may be unfolding as an expanded or running flat. Within primary wave 2, intermediate wave (A) was a deep zigzag (which will also subdivide as a double zigzag). Intermediate wave (B) fits perfectly as a zigzag and is a 1.21 length of intermediate wave (A). This is within the normal range for a B wave of a flat of 1 to 1.38.
Intermediate wave (C) is likely to make at least a slight new high above the end of intermediate wave (A) at 2,116.48 to avoid a truncation and a very rare running flat. However, price may find very strong resistance at the final bear market trend line. This line may hold price down and it may not be able to avoid a truncation. A rare running flat may occur before a very strong third wave down.
If price moves above 2,116.48, then the new alternate bear wave count would be invalidated. At that stage, if there is no new alternate for the bear, then this would be the only bear wave count.
Primary wave 2 may not move beyond the start of primary wave 1 above 2,134.72.
DAILY CHART
Click chart to enlarge.
Intermediate wave (A) fits as a single or double zigzag.
Intermediate wave (B) fits perfectly as a zigzag. There is no Fibonacci ratio between minor waves A and C.
Intermediate wave (C) must subdivide as a five wave structure. It is unfolding as an impulse.
Intermediate wave (C) does not have to move above the end of intermediate wave (A) at 2,116.48, but it is likely to do so to avoid a truncation. If it is truncated and primary wave 2 is a rare running flat, then the truncation is not likely to be very large. As soon as price is very close to 2,116.48 this wave count looks at the possibility of a trend change.
The next wave down for this wave count would be a strong third wave at primary wave degree.
A bull market trend line for this rally is drawn across the first two small swing lows as per the approach outlined by Magee. This upwards sloping cyan line may provide support for corrections along the way up. Price broke below the cyan line. It may now provide resistance. The S&P has a tendency to break out of channels or below lines and then continue in the prior direction. It is doing that here.
At 2,124 minor wave 5 would reach 0.618 the length of minor wave 3. Intermediate wave (C) would avoid a truncation and the wave count would remain valid. Primary wave 2 would fulfill its purpose of convincing everyone that a new bull market is underway, and it would do that right before primary wave 3 surprises everyone.
Within minor wave 5, no second wave correction may move beyond the start of its first wave below 2,022.49.
Within the impulse of intermediate wave (C), minor wave 2 is an expanded flat and minor wave 4 is a zigzag. These two corrections look to be nicely in proportion.
Although technically the structure for intermediate wave (C) could be seen as complete, it would probably be severely truncated by 41.41 points. This is not impossible, but the probability of it is too low to seriously consider.
HOURLY CHART
Click chart to enlarge.
Minute wave i subdivides as a five wave structure. Minute wave ii has corrected to the 0.618 Fibonacci ratio so far, so it could be over here.
My only cause for concern today is the five wave look to minute wave ii on the hourly chart. This downwards movement may also be an unfolding impulse. If that is the case, then the lower edge of the dark blue channel should be breached and price should move quickly below 2,022.49. If that happens, then this hourly wave count would be invalidated. At that stage, I would consider the possibility that intermediate wave (C) is over and truncated by 41.41 points.
While price remains above 2,022.49 this wave count will have a higher probability than the idea that intermediate wave (C) is over and severely truncated. It should be expected that the trend remains the same (in this case up) until proven otherwise.
At 2,095 minute wave iii would reach equality in length with minute wave i. Minute wave iii must move above the end of minute wave i at 2,075.07.
If minute wave ii continues further, it may not move below the start of minute wave i at 2,022.49.
It is also possible that minute wave ii could be an incomplete zigzag. This idea would be eliminated only with a new high above 2,075.07. At that stage, upwards movement could not be a B wave within a continuing zigzag, so minute wave ii would be confirmed as over and minute wave iii would be confirmed as underway. If this happens, then the invalidation point may be moved up to the end of minute wave ii at 2,042.56.
So far upwards movement for Wednesday subdivides nicely as a five on the hourly chart and five minute chart levels. Minuette wave (i) may be complete here, or subminuette wave v may continue higher as an extension. Minuette wave (ii) may begin the next session with a little downwards movement to about 2,058 or 2,052. Thereafter, upwards movement should continue.
If tomorrow begins by more upwards movement, then the Fibonacci retracement about minuette wave (i) must be redrawn and the targets for minuette wave (ii) would necessarily change. The lower edge of the blue channel won’t change though, so this should provide final support for any corrections including minuette wave (ii).
Draw the dark blue channel using Elliott’s first technique: the first trend line from the highs of minor waves 1 to 3, then a parallel copy on the low of minor wave 2. This lower edge perfectly shows where downwards movement is currently finding support. This trend line should hold, if this wave count is correct. The first indication that something is wrong would be a breach of the lower edge of the trend channel.
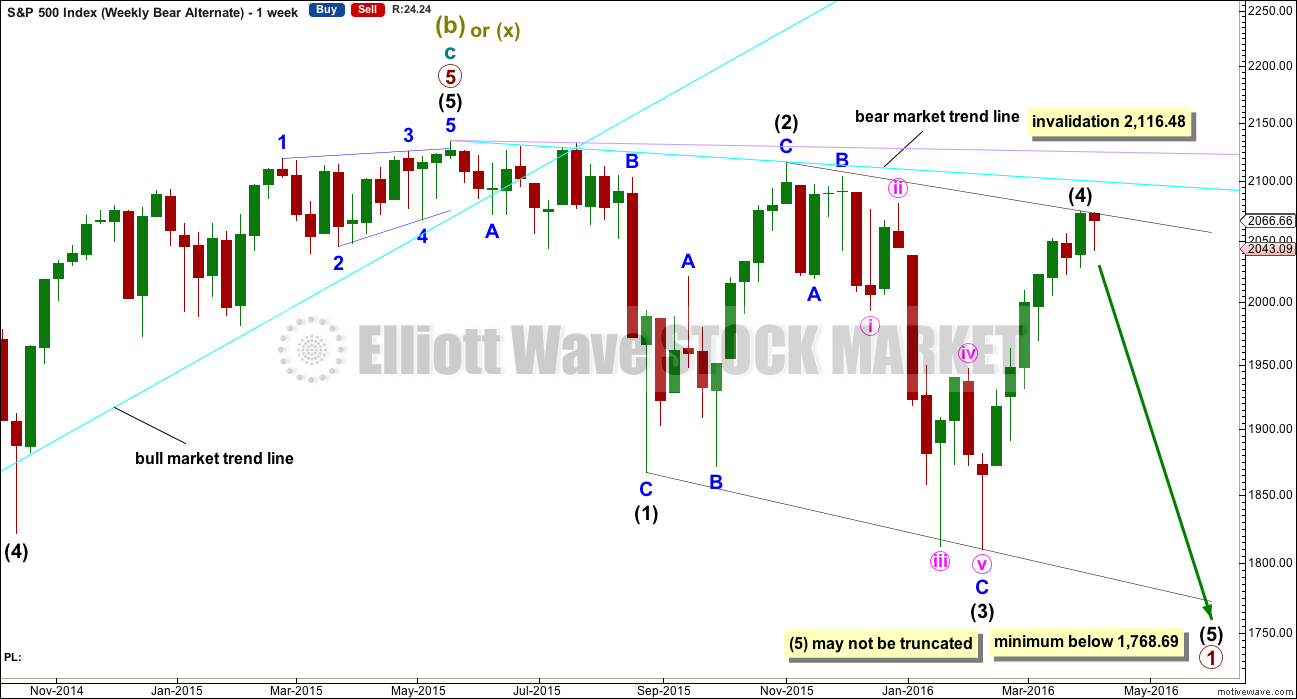
ALTERNATE WEEKLY CHART
Click chart to enlarge.
Primary wave 1 may subdivide as one of two possible structures. The main bear count sees it as a complete impulse. This alternate sees it as an incomplete leading diagonal.
The diagonal must be expanding because intermediate wave (3) is longer than intermediate wave (1). Leading expanding diagonals are not common structures, so that reduces the probability of this wave count to an alternate.
Intermediate wave (4) must continue higher and may find resistance at the cyan bear market trend line. Intermediate wave (4) may not move above the end of intermediate wave (2) at 2,116.48.
ALTERNATE DAILY CHART
Click chart to enlarge.
Within a leading diagonal, subwaves 2 and 4 must subdivide as zigzags. Subwaves 1, 3 and 5 are most commonly zigzags but may also sometimes appear to be impulses.
Intermediate wave (3) down fits best as a zigzag.
In a diagonal the fourth wave must overlap first wave price territory. The rule for the end of a fourth wave is it may not move beyond the end of the second wave.
Expanding diagonals are not very common. Leading expanding diagonals are less common.
Intermediate wave (4) must be longer than intermediate wave (2), so it must end above 2,059.57. This minimum has been met. The trend lines diverge.
Intermediate wave (4) may be over. If it is over here, then intermediate wave (5) must move below the end of intermediate wave (3), so it may not be truncated. Because the diagonal is expanding intermediate wave (5) must be longer than equality in length with intermediate wave (3). It must end below 1,768.69.
The final fifth wave of minute wave v is seen as an ending contracting diagonal. It does not have a very typical look though. The trend lines converge, but only just. The final fifth wave of the diagonal has not overshot the (i)-(iii) trend line and falls slightly short. This reduces the probability of this part of the wave count.
Leading diagonals may not have truncated fifth waves. Intermediate wave (5) would most likely be a zigzag, must end below 1,810.10, and must be longer in length than intermediate wave (3) which was 306.38 points.
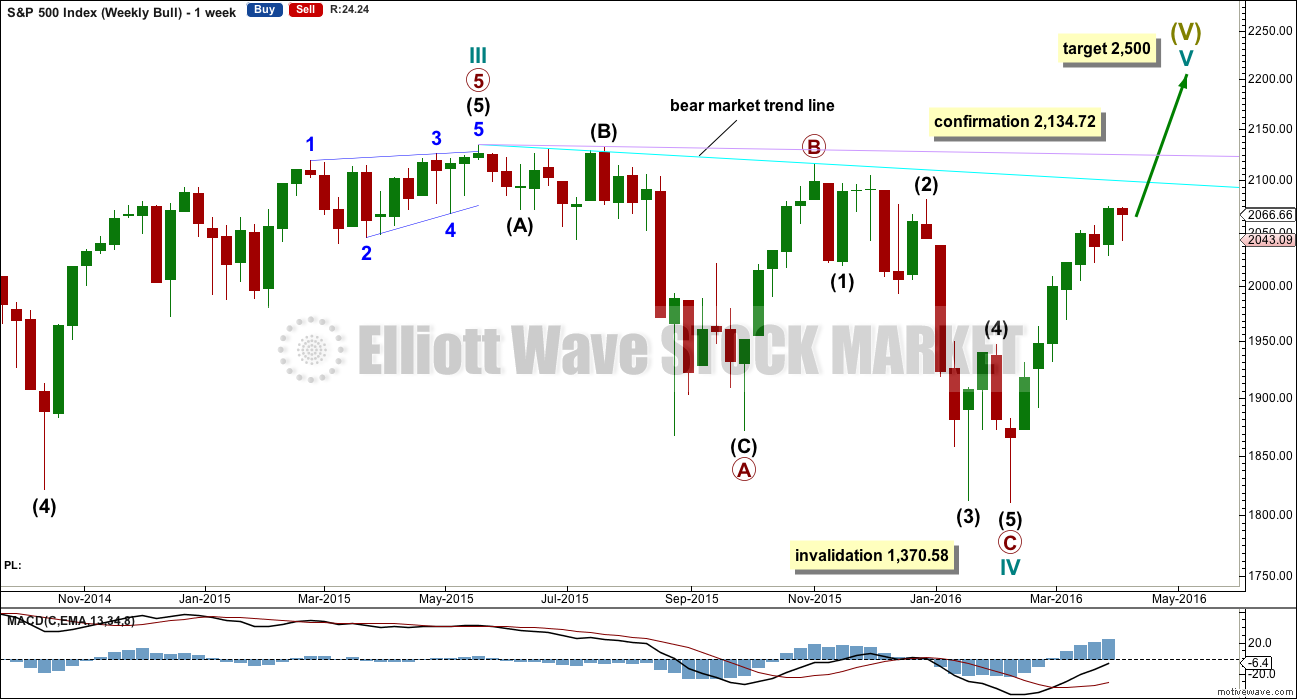
BULL ELLIOTT WAVE COUNT
WEEKLY CHART
Click chart to enlarge.
Cycle wave II was a shallow 0.41 zigzag lasting three months. Cycle wave IV may be a complete shallow 0.19 regular flat correction, exhibiting some alternation with cycle wave II.
At 2,500 cycle wave V would reach equality in length with cycle wave I.
Price remains below the final bear market trend line. This line is drawn from the all time high at 2,134.72 to the swing high labelled primary wave B at 2,116.48 on November 2015. This line is drawn using the approach outlined by Magee in the classic “Technical Analysis of Stock Trends”. To use it correctly we should assume that a bear market remains intact until this line is breached by a close of 3% or more of market value. In practice, that price point would be a new all time high which would invalidate any bear wave count.
This wave count requires price confirmation with a new all time high above 2,134.72.
While price has not made a new high, while it remains below the final bear market trend line and while technical indicators point to weakness in upwards movement, this very bullish wave count comes with a strong caveat. I do not have confidence in it.
DAILY CHART
Click chart to enlarge.
Intermediate wave (2) is seen as an atypical double zigzag. It is atypical in that it moves sideways. Double zigzags should have a clear slope against the prior trend to have the right look. Within a double zigzag, the second zigzag exists to deepen the correction when the first zigzag does not move price deep enough. Not only does this second zigzag not deepen the correction, it fails to move at all beyond the end of the first zigzag. This structure technically meets rules, but it looks completely wrong. This gives the wave count a low probability.
If the bull market has resumed, it must begin with a five wave structure upwards at the daily and weekly chart level. So far that is incomplete.
Downwards movement may not be a lower degree correction within minute wave v because it is in price territory of the first wave within minute wave v. This downwards movement must be minor wave 4. At 2,143 minor wave 5 would reach equality in length with minor wave 1.
Within minor wave 5, no second wave correction may move beyond the start of its first wave below 2,022.49.
TECHNICAL ANALYSIS
DAILY CHART
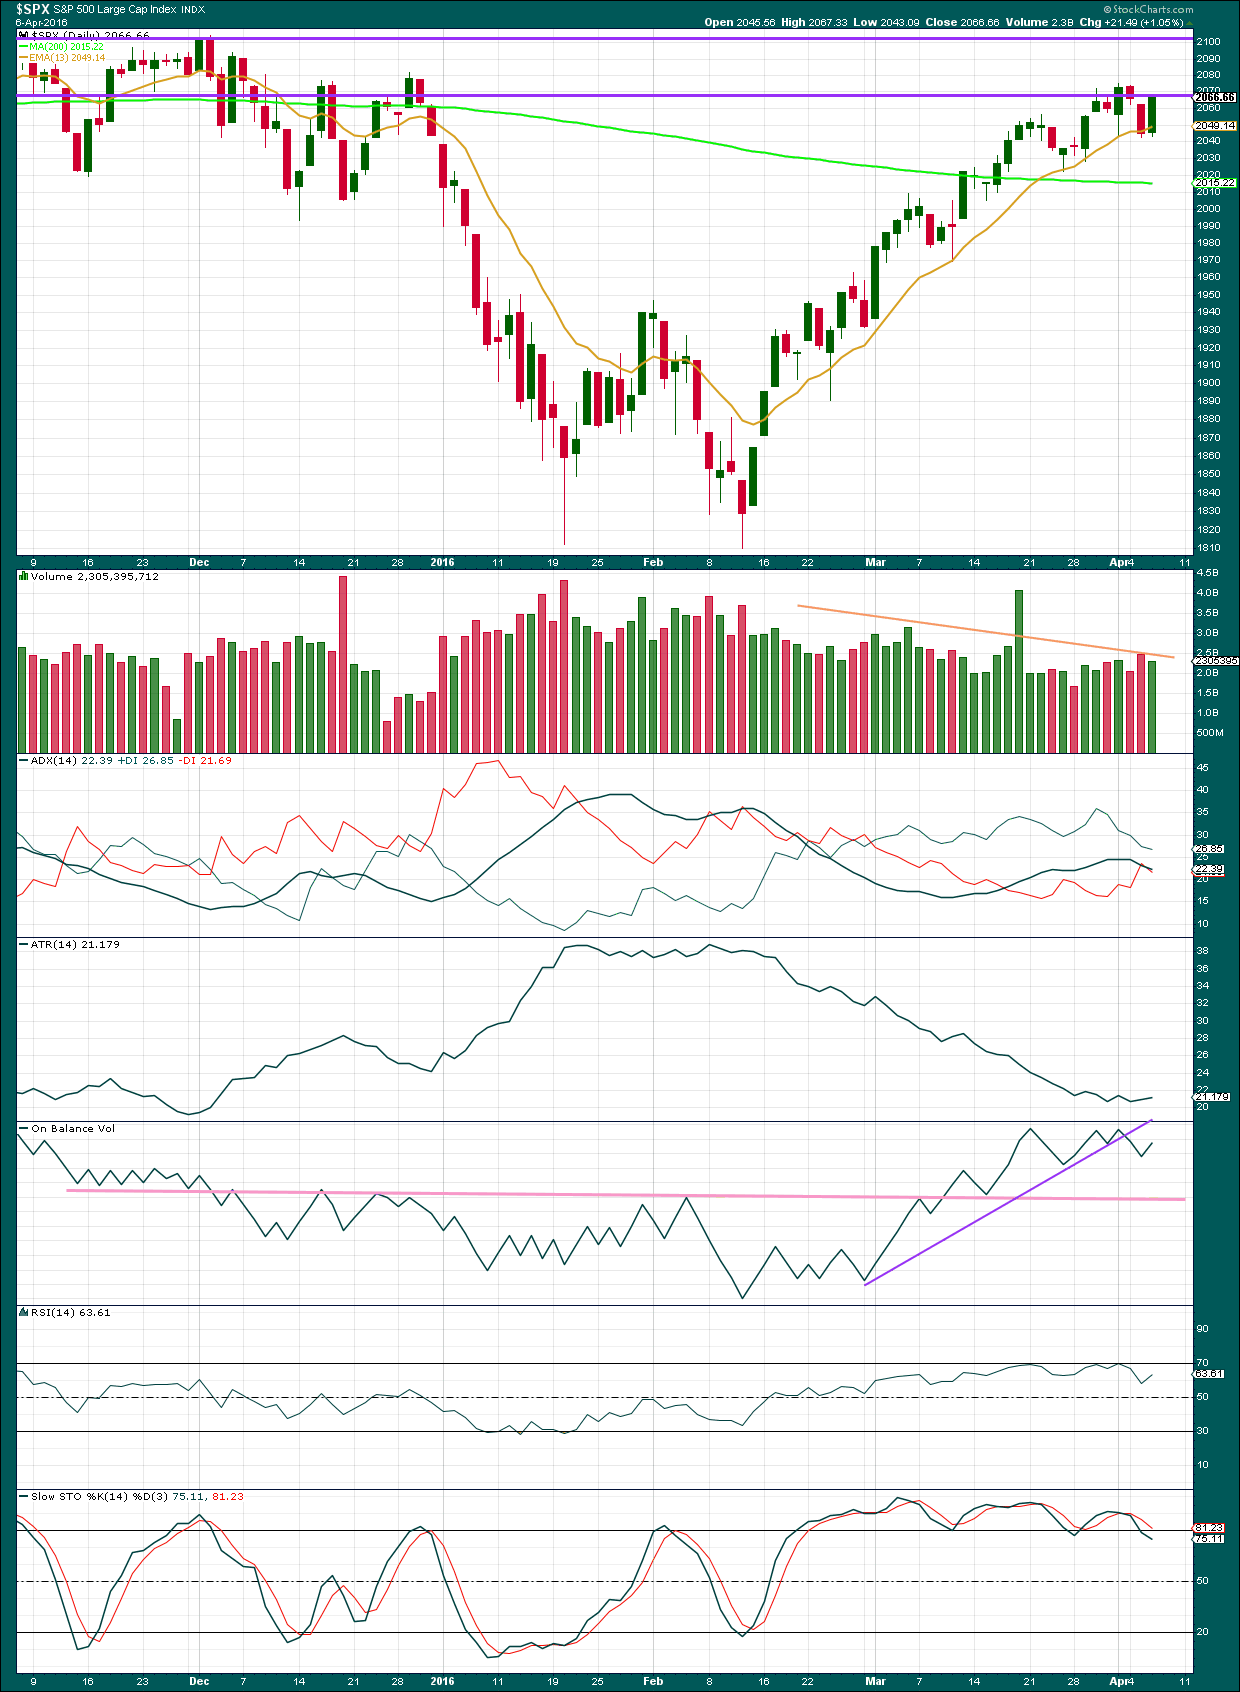
Click chart to enlarge. Chart courtesy of StockCharts.com.
Volume data on StockCharts is different to that given from NYSE, the home of this index. Comments on volume will be based on NYSE volume data when it differs from StockCharts.
Price has been trending upwards now for 37 days. The 13 day moving average is showing where corrections are finding support. Price has again found support at this average. The upwards trend looks to be intact.
ADX is declining, indicating the market is not trending. This may be due to a small consolidation. However, this does indicate weakness. ADX is based on a 14 day average. For just two downwards days to have such an effect indicates that the trend is weak. Overall, ADX is not indicating a clear upwards trend anymore.
ATR indicates there is something wrong with this trend. Normally a trend comes with increasing ATR but this trend is unusual in that it comes with clearly declining ATR. The trend is weak. ATR is still overall flat.
This upwards movement is coming overall with declining volume. The rise in price is not sustainable and is not supported by volume. This is further weakness in this trend.
Volume increased as price fell for two days, supporting the fall in price. Now volume declines as price rises. This trend is weak because it is not supported by volume, so it is not sustainable. Overall, volume continues to decline as price moves higher (ignoring the options expiry date).
On Balance Volume is giving a weak bearish signal with a break below the purple line. This signal is weak because the line is steep, only tested twice and not long held. For OBV to give a clearer bearish signal it needs to break below the pink line which his strong technical significance.
RSI is not yet overbought, so there is still room for this upwards trend to continue.
Stochastics is showing double negative divergence with price. This does not indicate upwards movement must end here and it is just further warning that this trend is weak.
INVERTED VIX DAILY CHART
Click chart to enlarge. Chart courtesy of StockCharts.com.
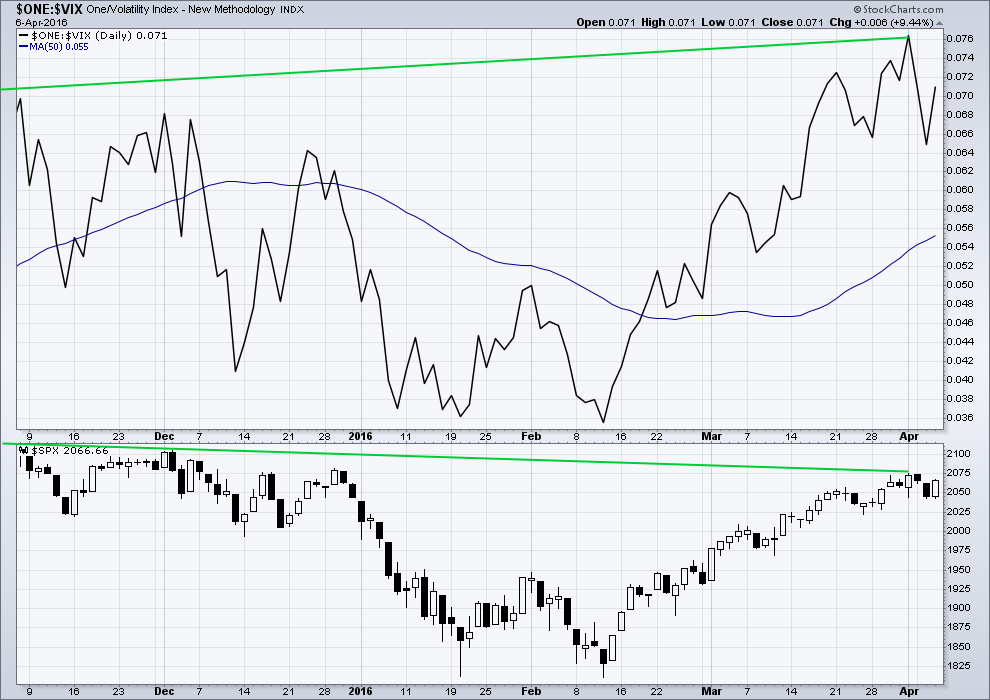
Volatility declines as inverted VIX climbs. This is normal for an upwards trend.
What is not normal here is the divergence over a reasonable time period between price and inverted VIX. The decline in volatility is not translating to a corresponding increase in price. Price is weak. This divergence is bearish.
BULLISH PERCENT DAILY CHART
Click chart to enlarge. Chart courtesy of StockCharts.com.
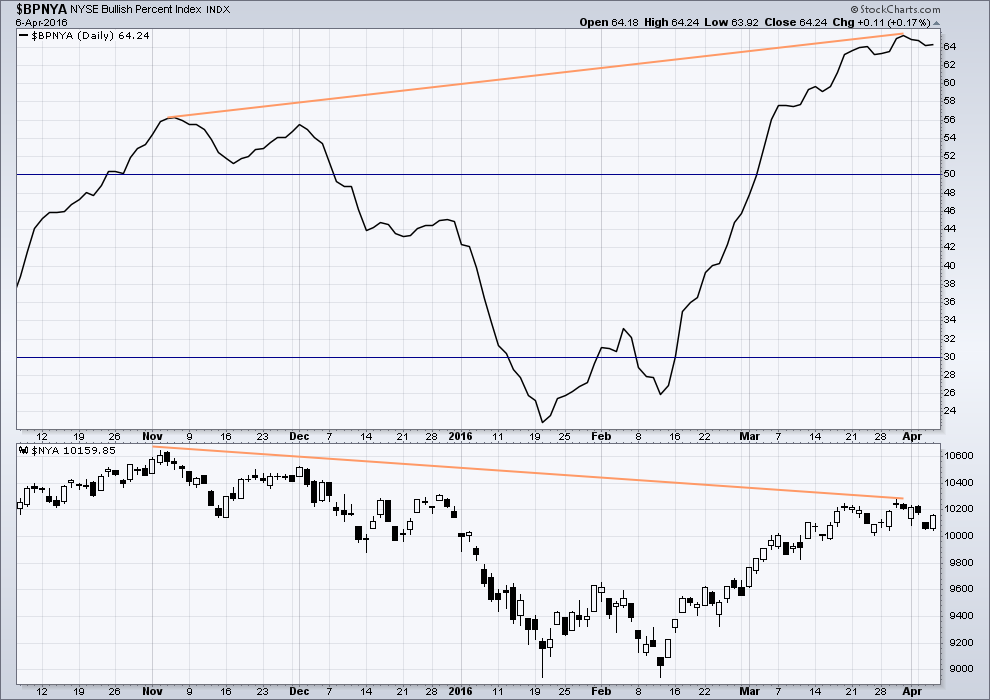
There is strong hidden bearish divergence between price and the Bullish Percent Index. The increase in the percentage of bullish traders is more substantial than the last high in price. As bullish percent increases, it is not translating to a corresponding rise in price. Price is weak.
This looks like an overabundance of optimism which is not supported by price.
ADVANCE DECLINE LINE
Click chart to enlarge. Chart courtesy of StockCharts.com.
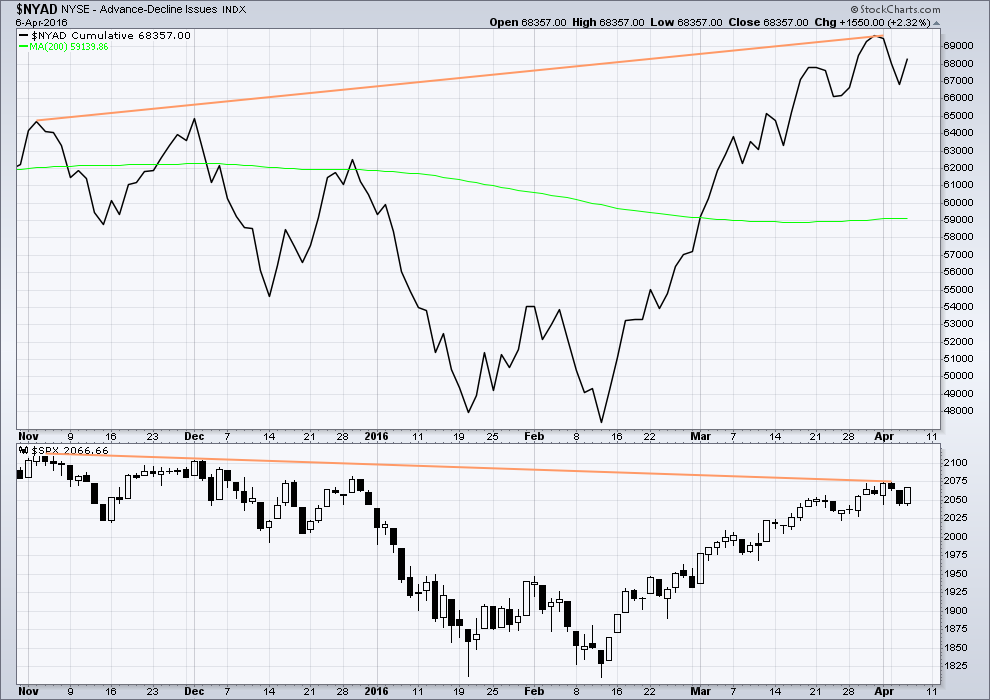
With the AD line increasing, this indicates the number of advancing stocks exceeds the number of declining stocks. This indicates that there is breadth to this upwards movement.
From November 2015 to now, the AD line is making new highs while price has so far failed to make a corresponding new high. This indicates weakness in price; the increase in market breadth is unable to be translated to increase in price.
It remains to be seen if price can make new highs beyond the prior highs of 3rd November, 2015. If price can manage to do that, then this hidden bearish divergence will no longer be correct, but the fact that it is so strong at this stage is significant. The AD line will be watched daily to see if this bearish divergence continues or disappears.
The 200 day moving average for the AD line is now increasing. This alone is not enough to indicate a new bull market. During November 2015 the 200 day MA for the AD line turned upwards and yet price still made subsequent new lows.
DOW THEORY
I am choosing to use the S&P500, Dow Industrials, Dow Transportation, Nasdaq and the Russell 2000 index. Major swing lows are noted below. So far the Industrials, Transportation and Russell 2000 have made new major swing lows. None of these indices have made new highs.
I am aware that this approach is extremely conservative. Original Dow Theory has already confirmed a major trend change as both the industrials and transportation indexes have made new major lows.
At this stage, if the S&P500 and Nasdaq also make new major swing lows, then my modified Dow Theory would confirm a major new bear market. At that stage, my only wave count would be the bear wave count.
The lows below are from October 2014. These lows were the last secondary correction within the primary trend which was the bull market from 2009.
These lows must be breached by a daily close below each point.
S&P500: 1,821.61
Nasdaq: 4,117.84
DJIA: 15,855.12 – close below on 25th August 2015.
DJT: 7,700.49 – close below on 24th August 2015.
Russell 2000: 1,343.51 – close below on 25th August 2015.
This analysis is published @ 11:05 p.m. EST.
It has occurred to me that for Gold I’m expecting a few days to a week or two of downwards movement.
Thereafter for Gold I’m expecting an intermediate degree third wave up.
While for the S&P I’m expecting a few more days of upwards movement, followed by a primary degree third wave down.
These fit in nicely. What if they change trend at the same time? Primary wave 3 begins to plummet on the S&P when Gold starts a big third wave up.
What if they change trend at the same time? What if?
Your subscribers, who manage money and positions well, can make a lot of money if an intermediate 3rd and primary 3rd take place. That’s what if!!
And that is just one reason I am thankful to be here.
Sweet! I’ve got my eye on a few of the miners, and will be laddering into GLD on the way down. You members (who don’t subscribe to the Gold service) say “Thank You” to Lara for the freebie! 🙂
I have been thinking about joining and now may be a good time…
While this is looking suspicious so far, I am not going to be bearish while price is above 2,022.49. Two reasons:
1. Second waves are often very deep. They don’t always stop at the 0.618 Fibonacci ratio. They can be deeper.
2. The S&P often breaches channels and trend lines, looking like a trend change, only to then turn around and continue in the prior trend direction.
We do not have confirmation at all that this upwards movement is over.
TBH I just don’t like the look of that alternate bear count. Fourth and second waves within diagonals are most often clearer zigzags than this fourth wave is. It looks like an impulse, not a zigzag. The final fifth wave ending diagonal within it didn’t have the typical overshoot of the 1-3 trend line.
Now this is not to say that count can’t be correct. It could be. Just that the problems I see with it reduce its probability.
The main count will see minute ii now a complete zigzag. The trend remains the same, until proven otherwise. The safest route to approaching this market.
If that was the end of minute two down, futures should be rockin’ overnight. That scenario is a perfect bankster fit, and the pause at the end of the day says we are just warmin’ up. Minute three up will in all likelihood be accompanied by a new series of 52 week lows in UVXY, breaking the 17.97 low set a few days ago. The euphoria of the bulls on the final wave up should be epic, while those of us who trade the dark side quietly watch….and wait…
If futures elevated, I will be trading the long side at the open…but just for the day…thank you! Nite all! 🙂
That’s exactly what I’m expecting. UVXY has provided some really nice trades the past couple days – hopefully I haven’t missed the boat.
The truck is backed up – just waiting to load er up.
I am using a wagon train approach. I have 2 of my 8 wagons filled. I need to fill the other 6 before the wagon train takes its journey to the bottom. I want to get a good price for my cargo. So I can;t rush thing.
By the way, using a wagon trais also reduces my carbon footprint. Thus I can save the world and whales while the Central Banks sell their citizens down the river on a barge.
ok,, just make sure you scrape up those horse puckys along the way. hey Rodney, you think Olga has a big truck or one of those old Datsun pickups
Olga’s truck is in the background
http://bloximages.chicago2.vip.townnews.com/trib.com/content/tncms/assets/v3/editorial/4/74/4746d685-7543-52db-9254-b396441a8003/4e605d2d3bb49.image.jpg
And if you look closely, that is her driving!
whoa Nellie,, now that is a truck !, I wonder if she has ever had to change a flat tire on that thing.
May I politely recommend an 18-wheeler (or two) at the next low? 🙂
we trade the dark side,,. Verne… I am your Father,,( said in my Darth Vader voice)
Hi Dad! Wassup! 🙂
I did not take on any more short positions even as the H&S neckline was and is being tested. If the pattern is to work out, the SPX needs to move down and now so to speak.
But I did not take any more positions because the preferred bear count is still preferred. I will be happy if we get up to or a bit beyond 2100. There is where I have planned to take another 1/4 or 1/2 or my full position.
If it breaks 2022+ I will reassess. However, if it breaks 2022 it may not be too far before we get a sizable correction and a better entry point. This demonstrates another reason to sometimes enter early. Some may be worried they cannot get in at a good entry. They chase the market. That happens in flash crashes etc. But, since I went in a bit early, I already have a position for the move down and I think I got reasonable entry points especially considering the trading instruments /vehicles I use. Therefore, I don’t feel compelled to force it and get what turns out to be a horrible entry point. So either way I am happy and planned to take advantage of good entry points. Both entry and exit points are important to manage. That is my plan anyways.
So I see Lara’s preferred count as THE preferred count until it isn’t preferred.
One of my favorite sayings I learned here is :
Bulls make money.
Bears make money.
Pigs (I am not sure how it ends) but something like, Pigs get slaughtered.
Did anybody see what the Yen did today? Yikes! Must be a lot of happy FX traders. That thing blew through the upper BB like dynamite. There should be a great reversion to the mean trade somewhere in that scenario…
That’s how UVXY is going to look once the downhill slide starts in the market… I’m waiting for one more push to the lows, maybe get a little closer to the lower BB’s, then snap up to the upper bands and break through like the Yen…
Yeah! I sure hope all those UVXY short sellers are prepared for what’s a coming. If they start to bail early, after the first gap up open the fat candles are going to be coming hot and heavy as the shorts cover; then there will be the legitimate push as folk pile into puts as the market heads South….should be fascinating!
SPX Volume is higher than yesterday.
And closed below the channel line from the Feb Low.
or an ABC fourth wave zig zag.
I think this is an expanded flat in a fourth wave under Lara’s bullish scenario.
Until we break 2022+, this whole move down from 2075 can be counted as three waves down completing minute ii, with iii, iv, and v, yet to complete.
Yep – with fib retrace and c=a @ 2034 – right where we bounced.
Still not a done deal but worth keeping an eye on.
For me the low risk trade is cashing out here and waiting for 2022 to be taken out. The risk is 15 or so points (or that we gap below 2022).
That’s my current plan anyway. 2022 should repel price like a magnet if it is technically significant.
Same poles of a magnet that is 😉 🙂
Hi Olga; I am making a spec trade on tomorrow’s expiration UVXY 21.5 puts…just for giggles. I know that should appeal to the contrarian in you…. 🙂
Blimey, I hope it’s cash you had earmarked for burning 🙂 🙂
Not sure how I would even start to calculate the risk / reward on that trade given the time element and everything else.
I’m staying SOH atm – if 2022 is in the cards then I want all my powder dry to throw at it. I’m still hopefull that I’ll get a truck load of discounted UVXY sometime soon.
As Jim Carrey said in “The Mask” “Somebody…Stop Meh!” 🙂
(Just between you and me…it was only one contract…!) 🙂
If this was a minuette three it sure was deep..
I meant of course minuette two….
Or minute ii 😉 🙂
Reached 76.4 fib up to now – deep but not too suspicious (yet).
Let’s see if we gap through 2022 tomorrow morning.
The buy the dip bulls are out in force… they are all Giddy and excited about this gift!
If this is P3 down, it will draw in those suckers like moths to a flame…let ’em come for the grand crisping…..! 🙂
I was a bit pre-mature on the impulse down. I think we just now completed a small degree four of the fifth down. NOW we re-trace.
Any volume figures Joseph?
At 3:00PM About = to yesterday… but IMO volume will accelerate in the last hour today.
Thanks. And of course we are still very, very early in the move down, if it turns out to be that. Volume will build. Thanks again.
My only caveat about this being intermediate five down is what happened the past several weeks did not at all have the personality of a fourth wave but rather a second. I have never ever seen UVXY make new 52 week lows ahead of a fifth wave down of any degree. As a matter of fact we had an uncharacteristic massive spike during a fourth wave last August. For what it’s worth….
If Lara’s primary count turns out to not be a truncation, then I prefer that count. Otherwise this count is the best fit imho.
So you think we are at the threshold of intermediate three of primary three in this count Thomas, is that correct? New 52 week lows in UVXY just ahead of intermediate three of primary three is what I would expect…absolutely!
Yes, that is correct. 🙂
I think we now have a complete impulse down. What next??!!!
Is the party just getting started? Or another painstaking move to re-trace, or perhaps start minuette three up?
Vern,
It will be good if today 2022 gets taken out for good.
I want to see it not only taken out, but taken to the wood-shed and thoroughly spanked!! 🙂
I am thinking we may be in the middle of this 1st series of waves down, ie the middle of a third at some small degree. Therefore, we have another 40 points or more down to go before a tradable bounce. We will see.
Rodney,
I think it will be two step down and next drop will take us below the 2000 easy. Now waiting and waiting for plays to develop. A lot of tech plays like AAPL ect are sitting on 0.786 on the daily chart. Hmmm, tomorrow brings more clarity
The H&S pattern neck line at 2042 roughly has been broken. Target around 2010.
I am hoping for move lower and then a retest of the neckline later. If it materializes, I will take more short positions around 2040. If not, I will ride this to 2022 and see what happens.
The NASDAQ just had a crossover of the daily MACD. It was the last of the major averages to do this. MACD on the daily is now pointing down and RSI is doing the same.
Rod my man…you may have been right about that UVXY gap being of the breakaway variety. I am keeping a close eye on how the BBs expand in response to today’s action, If the explode the run to the top could take awhile….
No more covered calls against my UVXY shares thank you berry berry much…. 🙂
If this drop continues, it could get ugly. And that is why I have layered in my short positions earlier this week.
You tha’ man…good call….
The contrarian in me is thinking this might be a very good place to go long 🙂
I’d personally rather be in cash than long at this point in the game, but the risk / reward may be pretty good here.
If UVXY dives that would be a sign to jump on the long side…
My theory about banksters conduct best fitting the wave count (or vice versa)would now call for minuette three up! 🙂 🙂 🙂
Agreed – seems to be hanging tough atm.
I sold out a little bit early – gotta get that crystal ball checked out.
Don’t you just want to slap yourself when you see your trade triple, just after you took a double???!!!! 🙂
The risk of a plunge is too big for me to have any long positions unless used as a hedge. But you are very nimble and quick which I am not, especially in equity trading.
Selling a few more UVXY calls deep in the money on today’s pop. Will wait for break of 2022.49 pivot and deploy with close expiration dates for bit more bang….Selling SPY 204.5 puts…no need to be avaricious…. 🙂 🙂
Considering the implication of taking out 2022 – we’re not that far away right now 🙂
Would mean we are likely in an intermediate 5th down rather than a big 3rd, but I’ll take it anyway.
That was my concern. I’d much rather big in a big third down rather than face the completion of a leading diagonal because then we have that darned 2nd wave coming at us soon. But the market is always right, price is the best indicator and we take what we can.
The market is NOT always right…. That’s a myth created by Wall Street marketers! Just a FACT!
When it moves against you it sure does feel like it my man…just saying… 🙂 🙂 🙂
I know it is far fetched but any chance that FED is or was indirectly funding the market ramp up even though on paper they are not in QE mode. I wonder if there is daily data being published on repos that FED is involved with.
Oh yeah! Between them and the working group, they have pumped in hundreds of billions, if not trillions. I remember how when everyone was expecting the Chinese to defend the “red line” in the sand of 3500 on the Shanghai index and reporters asked Yellen about the impotence of the Chinese Central Bank how she replied with this smirk on her face that they were “not deft” enough. ‘Nuff Said!
They no longer even bother denying it. Wonder what would happen to us if we tried to manipulate the market….
When social mood turns their day of reckoning will soon follow.
Olga,
I think that moment is coming sooner than expected, this is part of the process that makes FED useless and ineffective. waiting and waiting for 2000 to be taken out like it was nothing followed by 1950.
I am saving something special for that 2000 pivot… 🙂
If I had enough money to manipulate the market, I wouldn’t be here trying to make a little more. I’d be in Tahiti or my own personal island somewhere.
Who says you won’t? If this market does what we both think it’s setting up to do you should be able to get yourself a few islands mate..better yet, take some of your haul and visit mine in the BVI! 🙂
What the Fed says publicly and what they actually do are night and day. Keep in mind all money at that level is digital. Would the public ever know if the Fed uses it’s surrogates like JP Morgan or Goldman to place $10 billion digital (make believe monopoly money) into a market? No. Just like unemployment may be publicly 5% while in actuallity 95 million are not in the USA workforce.
Everything you hear or see from government is a mirage , an illusion. EW is a good tool (not perfect) to see reality. Forget whatever “establishment” says. Follow reality.
Like a tsunami in the ocean—government can be at the podium bleating on about how government has everything under control (trust us you are safe) the tsunami will do what it will.
EW helps see reality (the tsunami).
There’s somebody out there with a huge smile on their face over the prospect of relieving me of my beloved UVXY shares…looks likes it’s going past the 21.55 profit margin. Smart dude! Unlike VIX options, they don’t have to wait until expiration to exercise the calls…any minute now I expect… 🙂
UVXY breaking to the upside. Time to buy back those 205.50 puts. They’re gonna cost me 1.60 Yikes! No worries. Holding 204.50 and expect them to do well, net cost so far about 20c per contract, very cheap hedge outlay…. 🙂
Is it just me, or does it seem that the alternate bear count is the more likely wave count at this stage. I know the price of 2022.49 has not been breached to invalidate the main wave count, but price action with it breaching the lower trend channel (on the alternate daily), with a throwback to that channel and now continuing down? I think an hourly wave count for that alternate would be helpful, no?
Still waiting patiently for a clearer pic, but wanted to say I just love reading all the posts from all of you… I learn so much 🙂
I’d give them equal odds atm. We might still be in minute ii – if so c = a @ approx 2034.
We’re in a bit of a no mans land atm imho – S&P will happily jump straight back into a trend line so whilst that should be given weight, it is really only price which tells the truth.
Action around the lower base channel of this move from 2075 high is the next interesting point for me personally. I’m expecting we will break below 2042 fairly soon.
76.4% fib retrace is also at 2034 🙂
Below there things start smellin mighty suspicious.
Here is my hourly count for the alternate. 🙂
We need to stay below SPX 2050.44 to keep the 1-2 thesis alive…
I can count 5 down now from todays high, so in theory we can go back up in another 2.
I sold my short position and will re-buy if we go under 2042.52 / this current move up is confirmed a three. Current move might just be a back test of the lower trendline.
Currently SOH awaiting more of the pattern to unfold.
I am seeing it a bit differently, with wave four of the impulse just getting done and wave five coming up…
Could be – we won’t really get any clarity until we get a bit closer to 2022.
We could still be in minute ii as I suspected yesterday (which I only considered due to max Bull / Bear frustration factor). Only going below 2022 will turn that to dust. We’re currently still in the base channel from the 2075 high so this move down could still be corrective. But we are now below the lower main channel – if only the S&P respected its channels that might mean something!
Back in no mans land now imho. Will awaiting a break of 2042.52 and lower edge of the base channel.
It’s looking like that move up yesterday was a sneaky double zig zag.
zig zag rather – not sure where I got the double from…
UVXY is edging higher – still a short sale ban on IB – feel the pain!!
Yep. It is starting to be like money in the bank to expect when SPX does that deceptive channel break only to climb right back in. It SOH time for certain…
Are we looking at a fourth wave triangle possibly?
Maybe not…move still looking corrective…
By the way folks, there is a monstrous amount of UVXY calls sold short and there’s gonna be some pain in the house. For the longest while I was puzzling over why UVXY sometimes got decoupled from VIX and it is now clear it is because of the massive short selling of the shares themselves, which when it becomes extreme, will not properly reflect the put/call ratio which the VIX is based on. The lagging spike we saw last September came from short sellers who held on after the August 24 VIX capitulation and then finally panicked during intermediate four down. If we break 2022.49 go take their money!!! 🙂
Vern,
Patience and I hear you. Waiting till we break below 2000 on the way to 1890 for panic to set into the markets. Waiting and Watching…
Thanx for that info Verne…
Waiting patiently for that opportunity…
🙂
No problem guys. I did a bit of digging on why IBKR was banning short sales as it did not make any sense to me at all; after all, what did they care as long as they got their commissions right? Well not so fast. It turns out rumour has it IBKR had been playing fast and loose with allowing traders to sell short shares that were not first secured per very strict SEC rules. You are not allowed to sell shares short that the brokerage has not secured and you are also on the hook for any dividends that come due while you are shorting the stock. No wonder the thing was making such while swings…they were shorting more shares than were in existence!!!! Kinda like the paper Gold market… 🙂 🙂 🙂
Once the downside gets going folk owning UVXY shares are going to sit on ’em and that massive short cohort is going to be squeeeeeeezed! Ouch!
There is also a short sale ban on SCO & TVIX today – so it’s not only UVXY. They seem to have bans on various instruments at different times.
If you try to short something that is banned they email you if they ‘find’ stock available to short. I’m guessing they operate a first come first served system.
“While swings???!!” Jeez! “Wild” I tell ya…what were those fingers thinking?? 🙂
Lara,
in your main hourly analysis, do you mean Minuette II instead of Minute II, as it is in green?
Not anymore. With a new low below minuette (i) this can’t be minuette (ii).
It’s minute ii as a larger zigzag.
If 2116 or 2124 target (eventually) arrives what’s the number for UVXY? What will be low point for UVXY?
Ordinarily it should break the 52 week low of 17.97. Since these are very unusual circumstances, it is also possible to see a stark divergence with SPX making a new recovery high, and UVXY staying above its previous low. At some point the short sellers are going to start getting nervous riding this beast…
Draghi is telling everybody “No surrender” mpfffff…! 🙂
Sounds good. Thanks.
I missed an opportunity to buy back my covered calls yesterday at a nice 30% haircut. I am quite sure I am going to get called at away at the 20 strike price next week. Oh well…the 1.55 profit per contract is not too bad…we can’t have everything now can we?!
🙂
The post 10:30AM bounce to go up in smoke and have no legs today… all day. IMO
Volatility can be a good clue in this kind of dicey environment… it tends to climb steadily North despite price fluctuations when the down-trend is the real deal…
The 30 Year US Treasury Bond may go sub 2.50% yield in the next several days. It is currently signaling something big is about to blow up… if < 2.50% & continues lower that signal becomes a screaming signal… if < 2.25% it all becomes a certainty! What the blow up is, well… ??? Just know, it will not be pleasant!
Safe haven signal of the smartest money or the elite few.
The last bubble to burst will be the bond market. We had the 2000 internet bubble burst. Bonds did not really participate. We had the 2008 credit crunch and housing markets burst and bonds did not fully participate. Now we have the 3rd big bubble to burst. This time I think bonds will participate and get slaughtered. The bond market is essentially the biggest market of all. When it bursts, it is going to be ugly because sovereign credit / central banks will default. Cyrpess and Greece were just a warm up!
I heard a guy on Bloomberg this morning yapping about the current flight that is beginning from even so-called “investment- grade” corporate bonds represents “an opportunity”! I was shaking my head in amazement as he said this with an absolutely straight face. There is already a smell of smoke in the room I am afraid…
It’s funny how when hedges against your main positions go South you could care less! 🙂 🙂 🙂
I guess I should buy those 205.5 puts back soon…
I am only talking about the 30 Year US Treasury Bond as the signal… NOTHING ELSE is!
I don’t want any confusion here.
I don’t think declining yields pose any threat to the bond market. Declining yields means increasing bond prices. The bond market, all of it, including Treasuries will blow up when rates rise, NOT when they decline. If low rates were going to lead to a disaster, it would have already happened. What will blow up the bond market is when folk start worrying about getting their money, any of it, back! Just my two cents. 🙂
BTW, yields on Spanish bonds are on the march….
The Bond market blowing up is not what I am talking about… you missed my entire point. I am no rookie in Fixed Income… followed this specific market since 1979 and worked in this specific market.
Something may blow up at the current 30 year US T yield…
I will repeat…
The 30 Year US Treasury Bond may go sub 2.50% yield in the next several days. It is currently signaling something big is about to blow up… if < 2.50% & continues lower that signal becomes a screaming signal… if < 2.25% it all becomes a certainty! What the blow up is, well… ??? Just know, it will not be pleasant!
Safe haven signal of the smartest money or the elite few.
If you don't get it, I can't help you.
Joseph,
So what you are saying is that demand for 30 year bonds is so large that folks are willing to lock their money for 30 years despite the low return as they don’t see better and safe opportunities elsewhere. This should be interesting as I assume the following based on the 30 year bond yield action
1. Economy is slowing and demand is going down for growth items such as auto and homes
2. Other asset classes are being cashed in for raising the money.
3. the risk on other asset classes is significant enough for the investor to run for the safety of the bonds.
Idiot Draghi’s comment about ‘No Surrender’ says it all. The central bankers are acting like gambling addicts. Sadly in this process they will destroy life savings of millions of retail folks.
It’s a signal that something is going to blow UP. That something at this moment remains unknown! But Blow UP it will… if the yield on the 30 Year US Treasury Bond breaks < 2.50% & continues lower.
Going out of town till next week… Good Luck all!
Just watch the signal I gave you and be careful out there.
Joseph,
Is the yield curve inverted ? if yes, that will be tell tale sign just as it was prior to 2000 and 2008 downtrends.
Just trying to have a conversation Joseph, no intention to offend at all. My understanding is conventional wisdom states that an inverted yield curve( when long term debt is cheaper than short term) is a recession predictor. I am simply making the point that the collapse of the bond market, which will ultimately happen with rising yields, is going to be the ultimate financial catastrophe, recession or no….I see you prefer to be a bit cryptic and that is OK. I never miss an opportunity to learn something new… 🙂
Vern,
Other wrench in this game is the currency. now everyone around the world is in the devaluation process, china, india (heck they just cut the rates again while their Central Bankers in an interview said previous measure by US FED got some relief for us but not good going forward), so USD gets stronger which is not what FED wants to see .
Additionally, on the GOLD front it seems very odd that GOLD is hovering back and forth around the 1275 mark for a along time. I wonder who has it pinned to this level and why..
Very, very, very funny business going on with gold. I read somewhere recently that the COMEX is frantically scrambling to deliver the metal to Chinese Futures traders who insist on delivery of the metal instead of cash. How strange is that- they can force you and me to accept worthless manipulated paper with ridiculous rules about minimum contract sizes for delivery while the supply steadily heads East. For those not having a stash set aside already, the miners is the next best avenue to play the metal. No substitute for possession though…as they say, that is nine tenths of the law… 🙂
NOT talking about inverted yield cure!
We have broken the lower channel and exceeded the 61.8 re-tracement for minuette two…
The gap you see on today’s UVXY could be a breakaway gap to start its move up. Often they go unfilled for quite some time.
Eyeing it closely. We have had the last few ones filled in a bit of a false start. If P3 is here it is going to remain open for some time I imagine…
Anybody thinks we are looking at a series of 1,2s?
Looking for UVXY gap at 16.68 to be filled to signal possible start of minuette three up. As we noted yesterday, the gap got filled late in the trading day so the same could be the case today. The waves are playing out in a torturous manner, as is typical toward a trend’s termination. Will wait to buy back 205.5 puts until 2022.49 breached. Eyeing 205 calls for possible upside scalp but that is looking more and more tenuous. SPX 2022.49 remains pivotal…
Playing it safe with yesterday’s UVXY 20 strike calls and taking the quick double…we could still reverse…
Price is right back at the lower trendline – we shouldn’t go much lower now if we are to see minuette iii anytime soon.
If we go below 2042.52 then that opens up the possibility that we are still in minute ii but that would likely take us well below the lower trendline so is a bit suspicious. It would also likely mean minute ii is going quite close to the wire (2022) which would be fine by me 🙂
Always happy to get some low risk trades in the bag.
Oops! I meant UVXY 18.68…
My line in the sand is currently 2057.71 – above there I will bail on the short position I took yesterday and await further confirmation.
Pullback currently still above the lower trendline and could still just be minuette ii imho. 2042 also key in the short term.
We have a head & shoulders topping pattern developing on the 15 minute chart. The head is at 2075 and the neckline at 2042. A break of 2042 would give a target of 2010 (2075-2043=32 — 2042-32=2010).
This is only a potential pattern. It must be confirmed with a break of the neckline. Often H&S patterns break the neckline and then return to test the neckline before completing the move.
Yesterday I mentioned the potential hanging man candlestick on the week chart. If we close the week below 2037, the hanging man is eliminated but replaced with a very bearish engulfing pattern.
Just a couple of things to watch for while we are still expecting a move up towards 2100 where by the way, there is massive resistance.
Oh, I forgot to say, “Good morning to you all.”
Thanks Rodney. I count 5 down and 3 up from the peak at 2075.
The jobless claims report this morning is again quite a puzzle. Literally tens of thousands of lay-offs were announced across a broad range of industries last quarter, the highest number in the last seven years. Nonetheless, claims supposedly fell by 9000.00! What a conundrum- they have to make the administration look good, even if they do so by lying through their teeth, and if Frau Yellen gets thrown under the bus, so be it! 🙂
Futures suggesting that we will get minuette two down out the gate. I do not think they are indicating a third wave down so in my view Lara’s main count is pretty much confirmed. If we stay above 2022.49 I will maintain upside bullish straddle and make an upside trade via SPY 205 calls expiring this week the moment SPX goes into the green today. This will definitely be a day trade as considering market conditions, I am loathe to hold any long position overnight. The 200 dma and round number pivots are just about at a confluence point and I think P3 will announce its arrival with futures signaling that both will be summarily taken out. As the great poet said “They also serve, who only stand and wait…”
Top O’ the morning everyone! Have an awesome trading day!
wow,, I’m slipping,, way to do it Rodney ! as Lara would say,, Dammit . (grin)
He he – I know we are all (quite rightly) careful what forms of ‘expression’ we use here. And tbf it makes a refreshing change, which in turn creates an open platform to a wider range of views. Certainly if I had people insult me because they did not agree with my views then I would just choose not to post and I’m sure there are others here that would do the same. The ‘zero tolerance’ system Lara employs therefore works imho.
With that said, it makes me grin that Lara has given licence to use that particular word – and so everyone is totally gonna take full advantage!! 🙂 🙂 Kinda reminds me of my childhood (what can I get away with saying without ending up being whacked!)
Olga, I agree this is an open platform that often refreshes. I love to laugh and so many here give me smiles and laughter. Thanks.
However, where I come from geographically and socially, getting ‘whacked’ means you swim with the fishes, you bite the dust, you are pushing up daisies. The home town of my childhood was basically the Chicagoland region. My grandfather worked for Al Capone. I will not tell the rest of the story on any open platform.
Doc is going to be mad …
I know. I am going to hide out for a while tonight and tomorrow. But I am still glad I got this once in a lifetime championship of being the first respondent on EWSM. I think it is at least worth a ………
Thoid! 🙂 Man! It was crowded this evening! 🙂
First… Guess not
I did it. First !!!!!!
While I am not superstitious, this must be a good omen!
By the way, I don’t believe in jinxes either. We used to have a member who was always saying, “No jinx” as if he had to say that to prevent bad things. Avoid it.