A little downwards movement was expected for the session. This is what happened.
Summary: This is still a bear market rally until proven otherwise. A final fifth wave up is required to complete the structure. The target is 2,124. The invalidation point for this rally is 2,134.72. A short term target for a small third wave up tomorrow is at 2,095, which may take a few days to get there.
To see last published monthly charts click here.
To see how each of the bull and bear wave counts fit within a larger time frame see the Grand Supercycle Analysis.
To see detail of the bull market from 2009 to the all time high on weekly charts, click here.
New updates to this analysis are in bold.
BEAR ELLIOTT WAVE COUNT
WEEKLY CHART
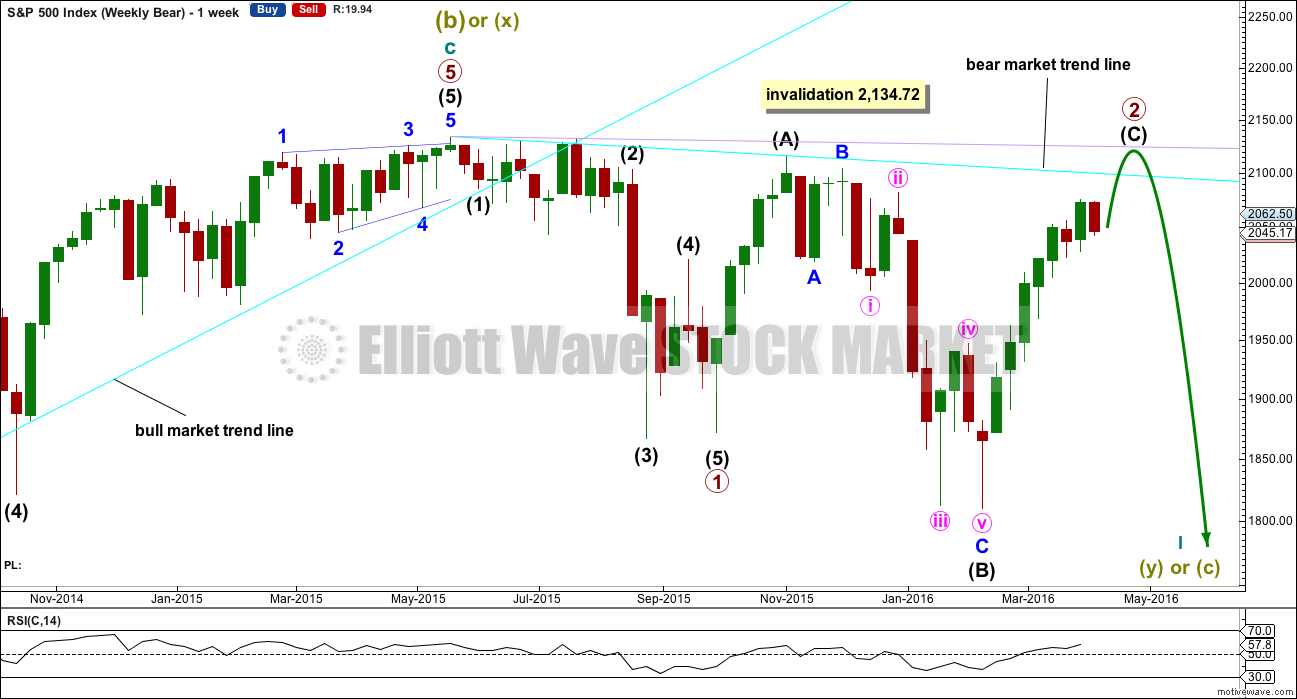
This bear wave count fits better than the bull with the even larger picture, super cycle analysis found here. It is also well supported by regular technical analysis at the monthly chart level.
Importantly, there is no lower invalidation point for this wave count. That means there is no lower limit to this bear market.
Primary wave 1 may be complete and may have lasted 19 weeks, two short of a Fibonacci 21. So far primary wave 2 has begun its 26th week. It looks unlikely to continue for another 8 weeks to total a Fibonacci 34, so it may end in about two to three weeks time. This would still give reasonable proportion between primary waves 1 and 2. Corrections (particularly more time consuming flat corrections) do have a tendency to be longer lasting than impulses.
Primary wave 2 may be unfolding as an expanded or running flat. Within primary wave 2, intermediate wave (A) was a deep zigzag (which will also subdivide as a double zigzag). Intermediate wave (B) fits perfectly as a zigzag and is a 1.21 length of intermediate wave (A). This is within the normal range for a B wave of a flat of 1 to 1.38.
Intermediate wave (C) is likely to make at least a slight new high above the end of intermediate wave (A) at 2,116.48 to avoid a truncation and a very rare running flat. However, price may find very strong resistance at the final bear market trend line. This line may hold price down and it may not be able to avoid a truncation. A rare running flat may occur before a very strong third wave down.
If price moves above 2,116.48, then the new alternate bear wave count would be invalidated. At that stage, if there is no new alternate for the bear, then this would be the only bear wave count.
Primary wave 2 may not move beyond the start of primary wave 1 above 2,134.72.
DAILY CHART
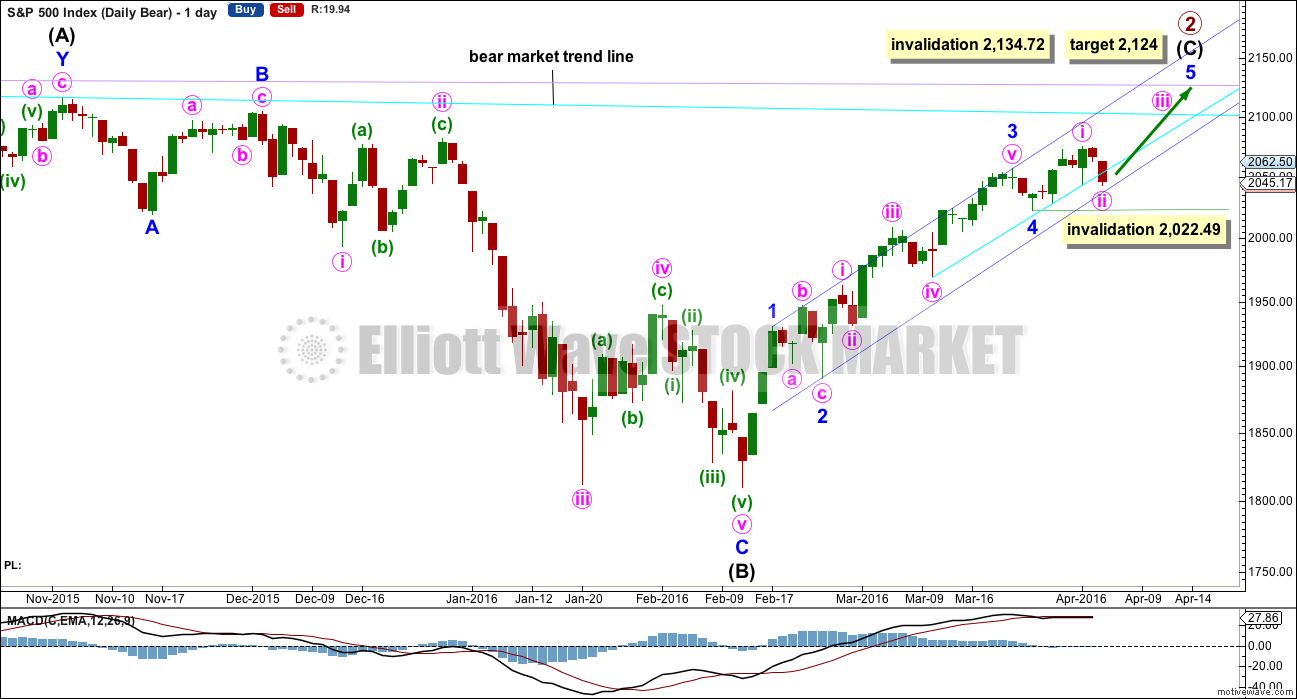
Intermediate wave (A) fits as a single or double zigzag.
Intermediate wave (B) fits perfectly as a zigzag. There is no Fibonacci ratio between minor waves A and C.
Intermediate wave (C) must subdivide as a five wave structure. It is unfolding as an impulse.
Intermediate wave (C) does not have to move above the end of intermediate wave (A) at 2,116.48, but it is likely to do so to avoid a truncation. If it is truncated and primary wave 2 is a rare running flat, then the truncation is not likely to be very large. As soon as price is very close to 2,116.48 this wave count looks at the possibility of a trend change.
The next wave down for this wave count would be a strong third wave at primary wave degree.
A bull market trend line for this rally is drawn across the first two small swing lows as per the approach outlined by Magee. This upwards sloping cyan line may provide support for corrections along the way up. Price broke below the cyan line. It may now provide resistance. The S&P has a tendency to break out of channels or below lines and then continue in the prior direction. It is doing that here.
At 2,124 minor wave 5 would reach 0.618 the length of minor wave 3. Intermediate wave (C) would avoid a truncation and the wave count would remain valid. Primary wave 2 would fulfill its purpose of convincing everyone that a new bull market is underway, and it would do that right before primary wave 3 surprises everyone.
Within minor wave 5, no second wave correction may move beyond the start of its first wave below 2,022.49.
Within the impulse of intermediate wave (C), minor wave 2 is an expanded flat and minor wave 4 is a zigzag. These two corrections look to be nicely in proportion.
Although technically the structure for intermediate wave (C) could be seen as complete, it would probably be severely truncated by 41.41 points. This is not impossible, but the probability of it is too low to seriously consider.
HOURLY CHART
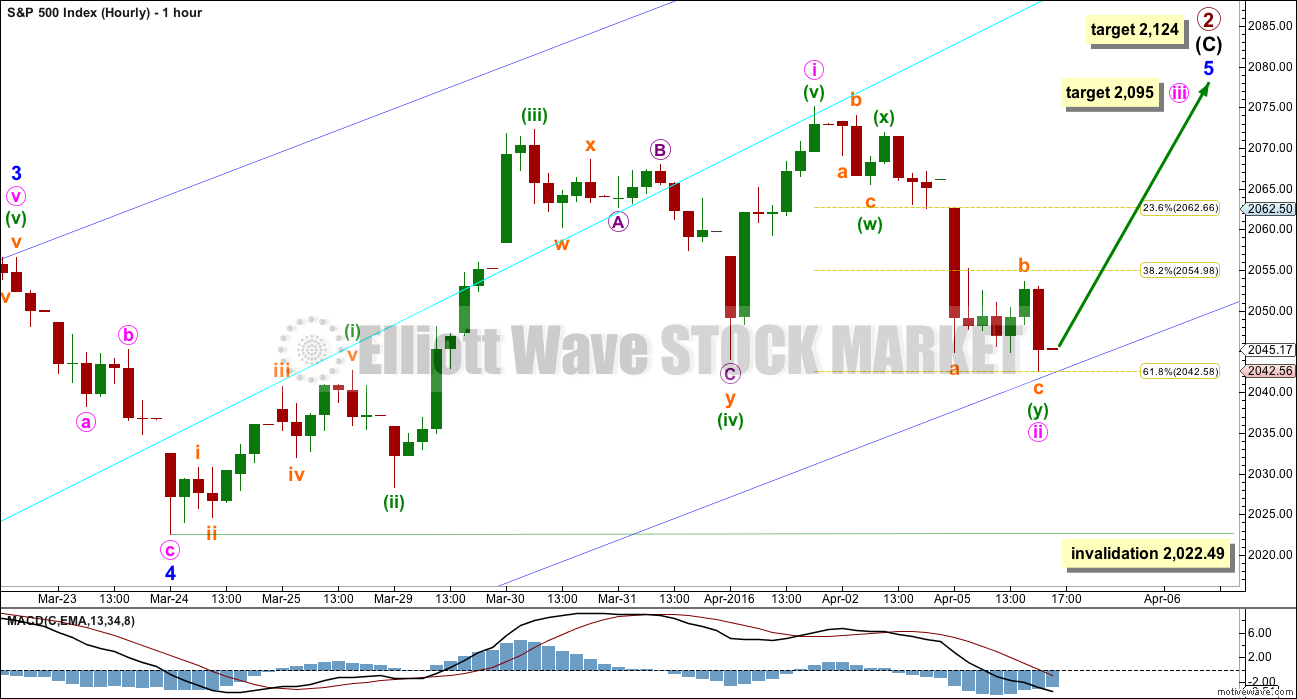
Minute wave i subdivides as a five wave structure. Minute wave ii has corrected to the 0.618 Fibonacci ratio so far, so it could be over here.
My only cause for concern today is the five wave look to minute wave ii on the hourly chart. This downwards movement may also be an unfolding impulse. If that is the case, then the lower edge of the dark blue channel should be breached and price should move quickly below 2,022.49. If that happens, then this hourly wave count would be invalidated. At that stage, I would consider the possibility that intermediate wave (C) is over and truncated by 41.41 points.
While price remains above 2,022.49 this wave count will have a higher probability than the idea that intermediate wave (C) is over and severely truncated. It should be expected that the trend remains the same (in this case up) until proven otherwise.
At 2,095 minute wave iii would reach equality in length with minute wave i. Minute wave iii must move above the end of minute wave i at 2,075.07.
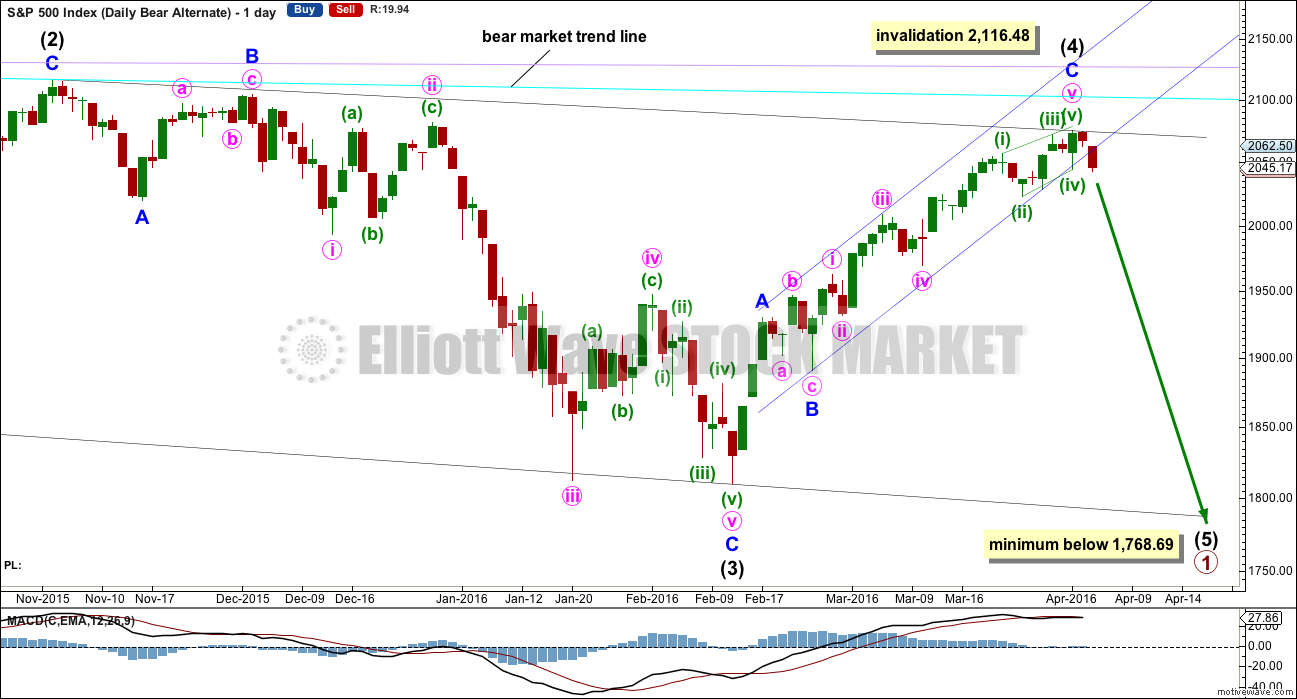
ALTERNATE WEEKLY CHART
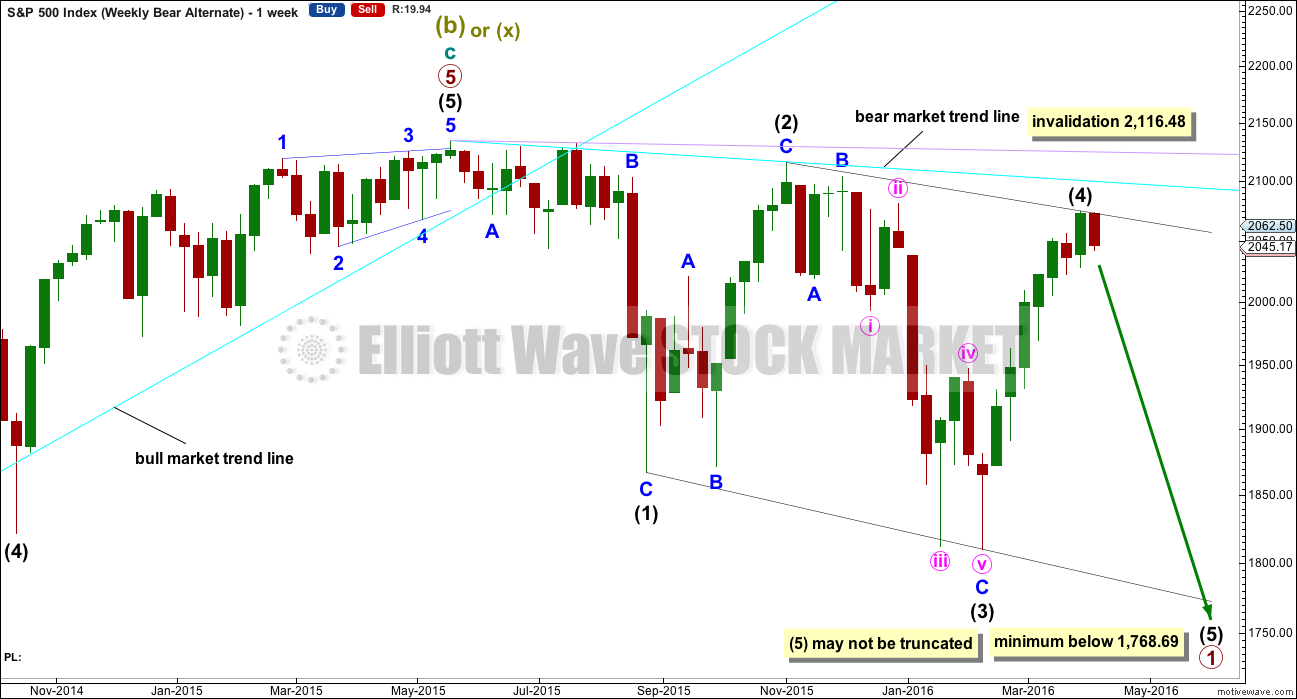
Primary wave 1 may subdivide as one of two possible structures. The main bear count sees it as a complete impulse. This alternate sees it as an incomplete leading diagonal.
The diagonal must be expanding because intermediate wave (3) is longer than intermediate wave (1). Leading expanding diagonals are not common structures, so that reduces the probability of this wave count to an alternate.
Intermediate wave (4) must continue higher and may find resistance at the cyan bear market trend line. Intermediate wave (4) may not move above the end of intermediate wave (2) at 2,116.48.
ALTERNATE DAILY CHART
Within a leading diagonal, subwaves 2 and 4 must subdivide as zigzags. Subwaves 1, 3 and 5 are most commonly zigzags but may also sometimes appear to be impulses.
Intermediate wave (3) down fits best as a zigzag.
In a diagonal the fourth wave must overlap first wave price territory. The rule for the end of a fourth wave is it may not move beyond the end of the second wave.
Expanding diagonals are not very common. Leading expanding diagonals are less common.
Intermediate wave (4) must be longer than intermediate wave (2), so it must end above 2,059.57. This minimum has been met. The trend lines diverge.
Intermediate wave (4) may be over. If it is over here, then intermediate wave (5) must move below the end of intermediate wave (3), so it may not be truncated. Because the diagonal is expanding intermediate wave (5) must be longer than equality in length with intermediate wave (3). It must end below 1,768.69.
The final fifth wave of minute wave v is seen as an ending contracting diagonal. It does not have a very typical look though. The trend lines converge, but only just. The final fifth wave of the diagonal has not overshot the (i)-(iii) trend line and falls slightly short. This reduces the probability of this part of the wave count.
Leading diagonals may not have truncated fifth waves. Intermediate wave (5) would most likely be a zigzag, must end below 1,810.10, and must be longer in length than intermediate wave (3) which was 306.38 points.
BULL ELLIOTT WAVE COUNT
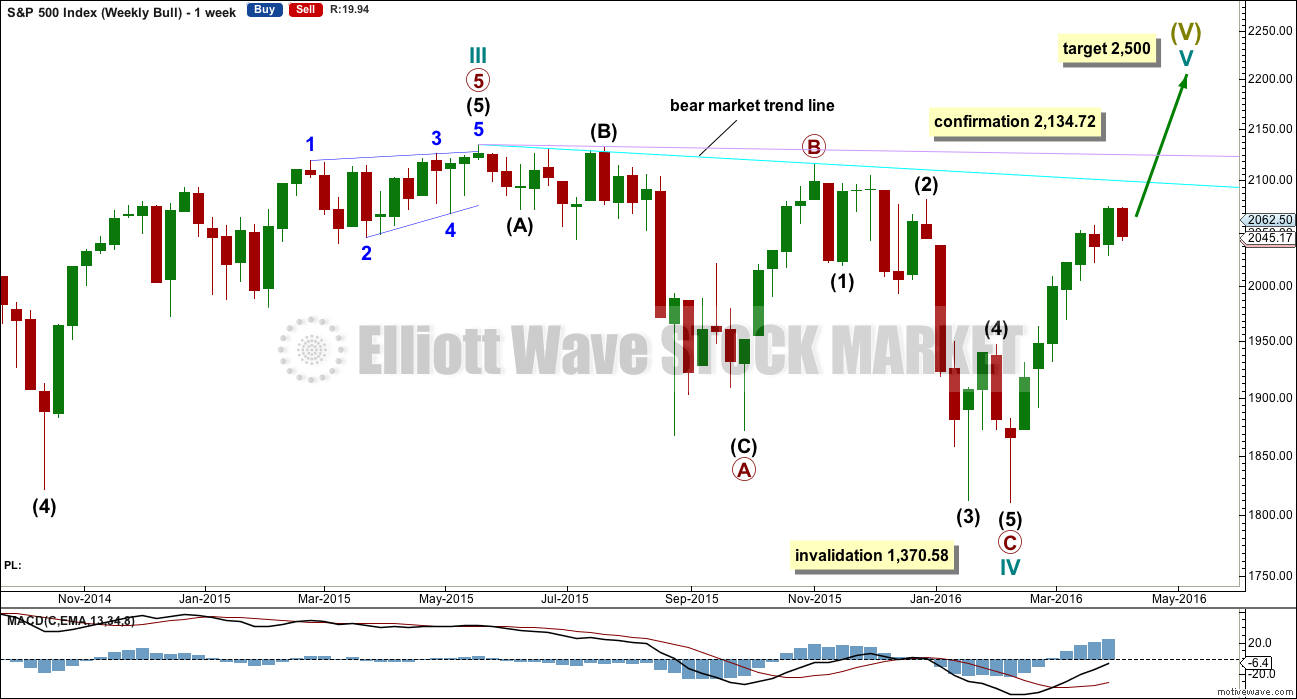
WEEKLY CHART
Cycle wave II was a shallow 0.41 zigzag lasting three months. Cycle wave IV may be a complete shallow 0.19 regular flat correction, exhibiting some alternation with cycle wave II.
At 2,500 cycle wave V would reach equality in length with cycle wave I.
Price remains below the final bear market trend line. This line is drawn from the all time high at 2,134.72 to the swing high labelled primary wave B at 2,116.48 on November 2015. This line is drawn using the approach outlined by Magee in the classic “Technical Analysis of Stock Trends”. To use it correctly we should assume that a bear market remains intact until this line is breached by a close of 3% or more of market value. In practice, that price point would be a new all time high which would invalidate any bear wave count.
This wave count requires price confirmation with a new all time high above 2,134.72.
While price has not made a new high, while it remains below the final bear market trend line and while technical indicators point to weakness in upwards movement, this very bullish wave count comes with a strong caveat. I do not have confidence in it.
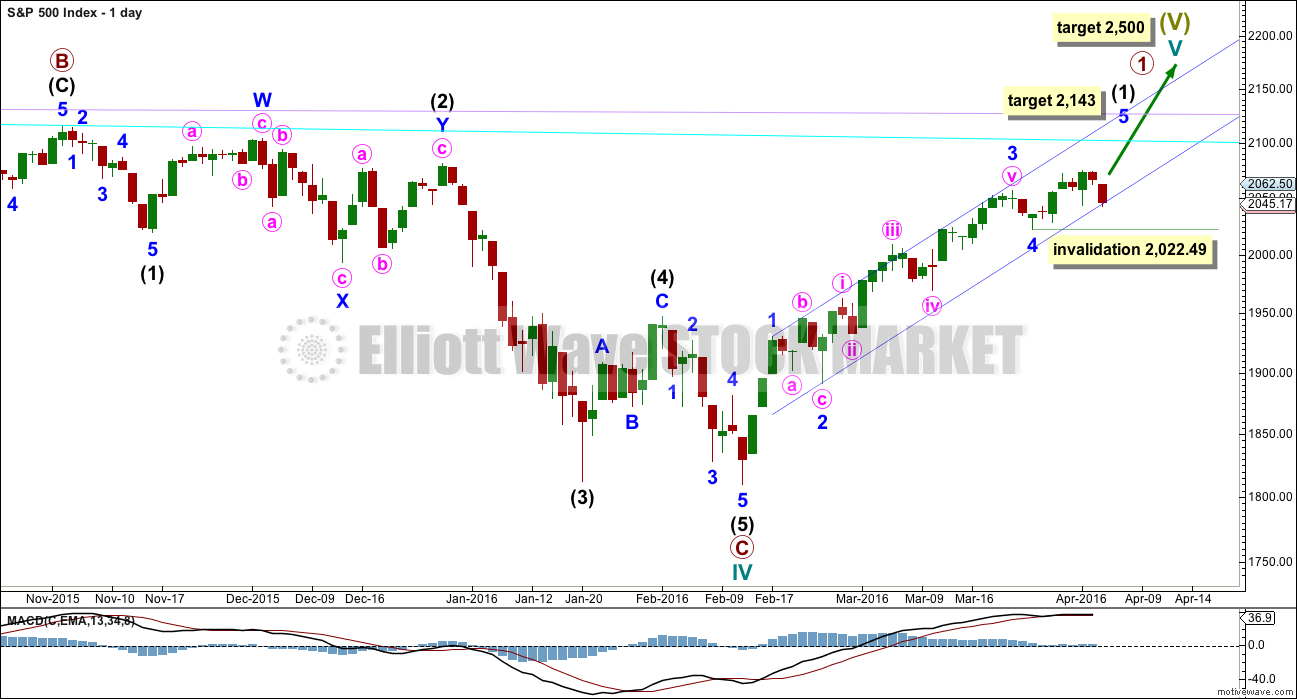
DAILY CHART
Upwards movement cannot now be a fourth wave correction for intermediate wave (4) as price is now back up in intermediate wave (1) territory above 2,019.39. This has provided some clarity.
For the bullish wave count, it means that primary wave C must be over as a complete five wave impulse.
Intermediate wave (2) is seen as an atypical double zigzag. It is atypical in that it moves sideways. Double zigzags should have a clear slope against the prior trend to have the right look. Within a double zigzag, the second zigzag exists to deepen the correction when the first zigzag does not move price deep enough. Not only does this second zigzag not deepen the correction, it fails to move at all beyond the end of the first zigzag. This structure technically meets rules, but it looks completely wrong. This gives the wave count a low probability.
If the bull market has resumed, it must begin with a five wave structure upwards at the daily and weekly chart level. So far that is incomplete.
Downwards movement may not be a lower degree correction within minute wave v because it is in price territory of the first wave within minute wave v. This downwards movement must be minor wave 4. At 2,143 minor wave 5 would reach equality in length with minor wave 1.
Within minor wave 5, no second wave correction may move beyond the start of its first wave below 2,022.49.
TECHNICAL ANALYSIS
DAILY CHART
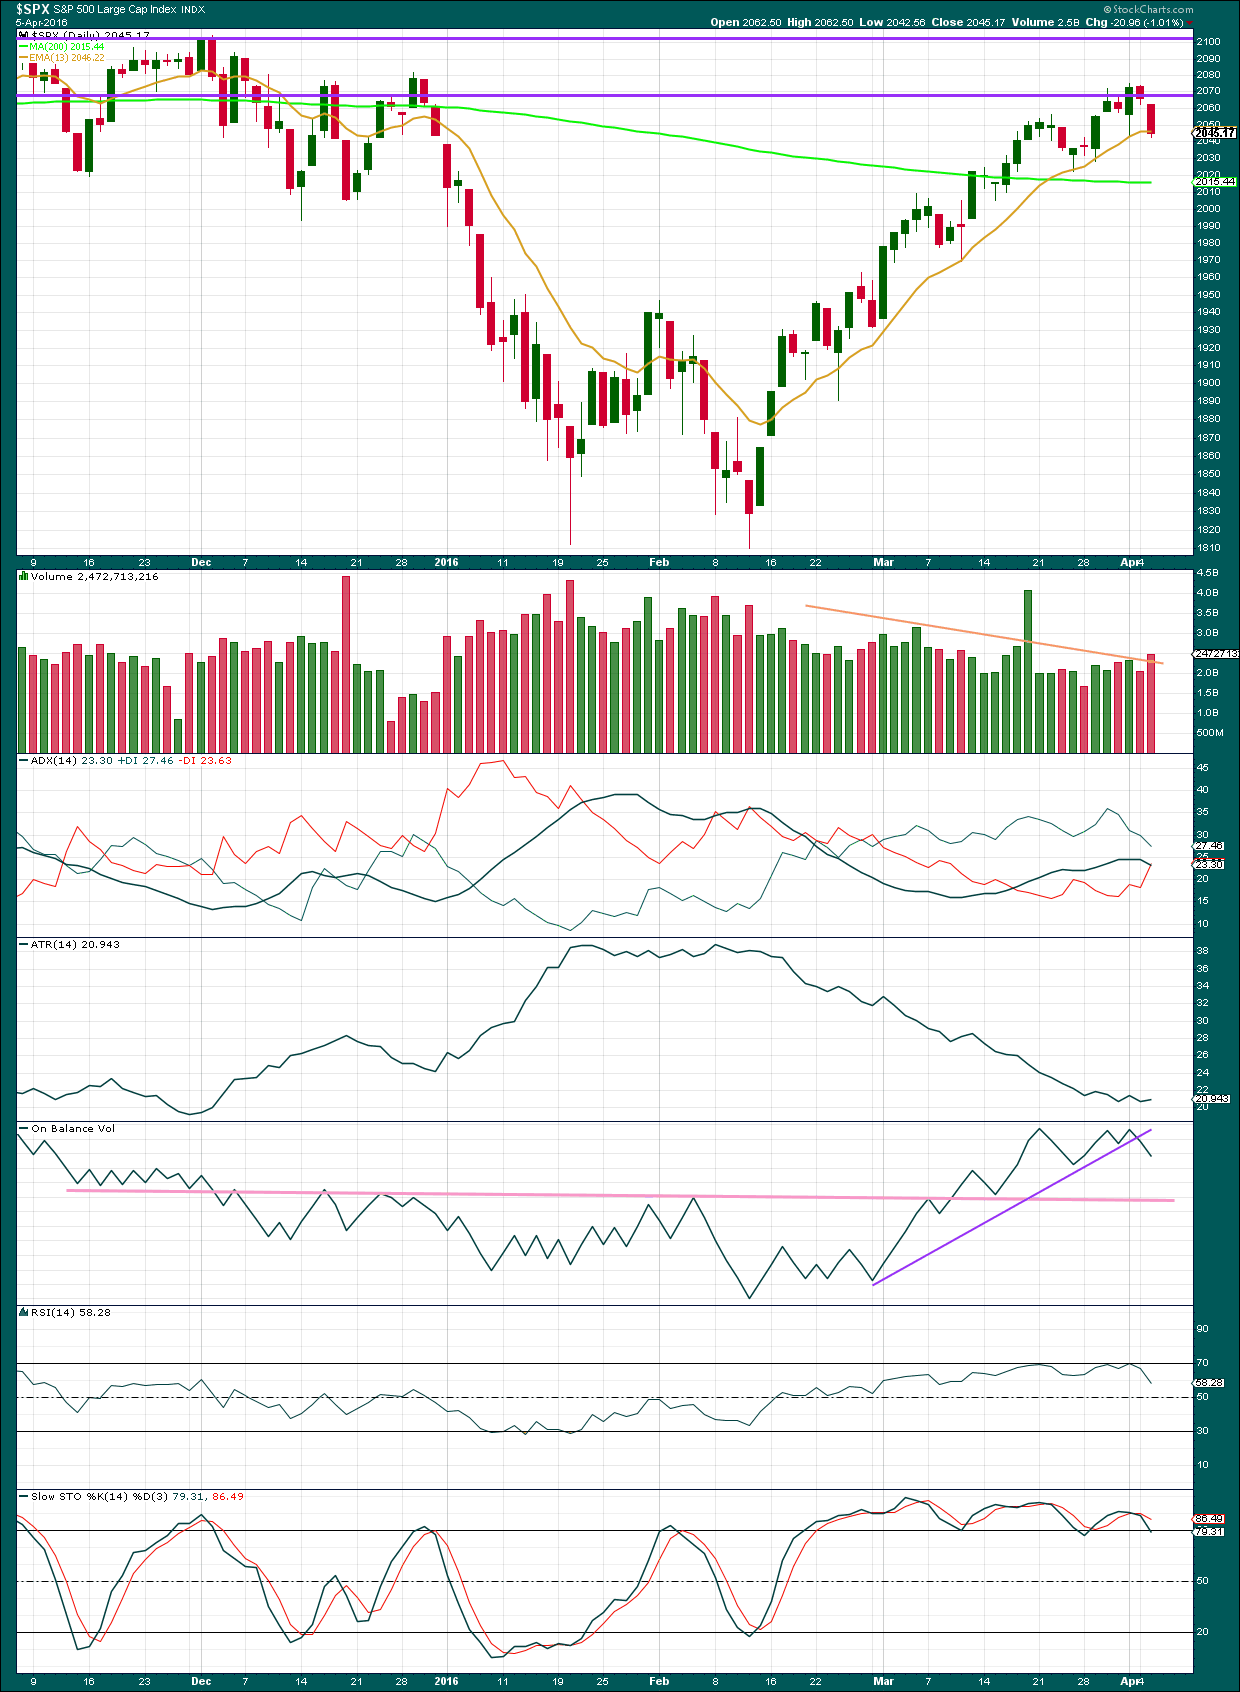
Click chart to enlarge. Chart courtesy of StockCharts.com.
Volume data on StockCharts is different to that given from NYSE, the home of this index. Comments on volume will be based on NYSE volume data when it differs from StockCharts.
Price has been trending upwards now for 35 days. The 13 day moving average is showing where corrections are finding support. If the upwards trend is still intact, then this average should stop the downwards movement from price today here.
ADX is today declining, indicating the market is not trending. This may be due to a small consolidation. However, this does indicate weakness. ADX is based on a 14 day average. For just two downwards days to have such an effect indicates that the trend is weak. Overall, ADX is not indicating a clear upwards trend anymore.
ATR indicates there is something wrong with this trend. Normally a trend comes with increasing ATR but this trend is unusual in that it comes with clearly declining ATR. The trend is weak. ATR today is flattening off indicating the average range is expanding. This may be due to a trend change, but ATR may yet turn back down.
This upwards movement is coming overall with declining volume. The rise in price is not sustainable and is not supported by volume. This is further weakness in this trend.
Volume has increased today while price moved lower. There was support for the fall in price. However, this has happened before during this rally on 26th and 29th of February and that was followed by more upwards movement. This support for the fall in price supports the bear Elliott wave count, but it does not say that the rally must end here.
On Balance Volume is giving a weak bearish signal with a break below the purple line. This signal is weak because the line is steep, only tested twice and not long held. For OBV to give a clearer bearish signal it needs to break below the pink line which his strong technical significance.
RSI no longer shows divergence with price: the last high in price corresponds with a very slight new high on RSI. RSI is not yet overbought, so there is still room for this upwards trend to continue.
Stochastics is showing double negative divergence with price. This does not indicate upwards movement must end here and it is just further warning that this trend is weak.
INVERTED VIX DAILY CHART
Click chart to enlarge. Chart courtesy of StockCharts.com.
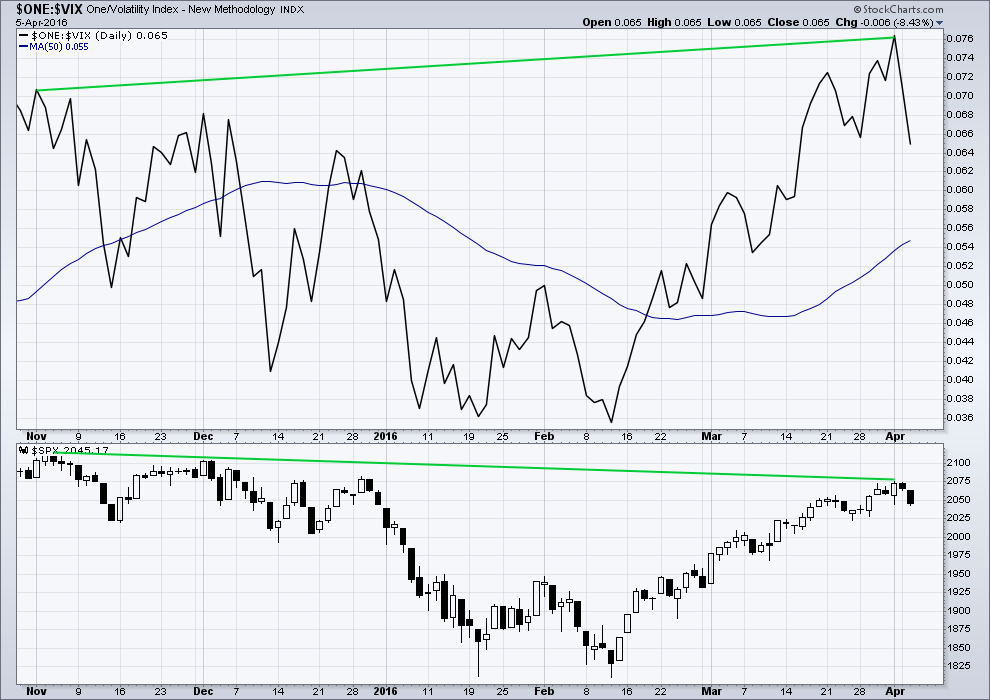
Volatility declines as inverted VIX climbs. This is normal for an upwards trend.
What is not normal here is the divergence over a reasonable time period between price and inverted VIX. The decline in volatility is not translating to a corresponding increase in price. Price is weak. This divergence is bearish.
BULLISH PERCENT DAILY CHART
Click chart to enlarge. Chart courtesy of StockCharts.com.
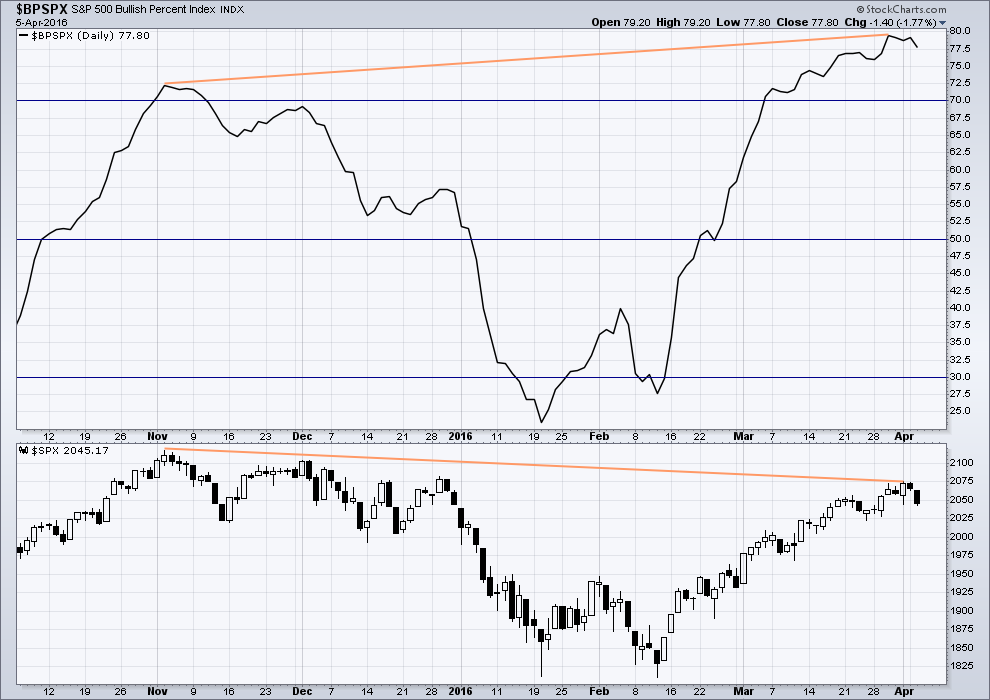
There is strong hidden bearish divergence between price and the Bullish Percent Index. The increase in the percentage of bullish traders is more substantial than the last high in price. As bullish percent increases, it is not translating to a corresponding rise in price. Price is weak.
This looks like an overabundance of optimism which is not supported by price.
ADVANCE DECLINE LINE
Click chart to enlarge. Chart courtesy of StockCharts.com.
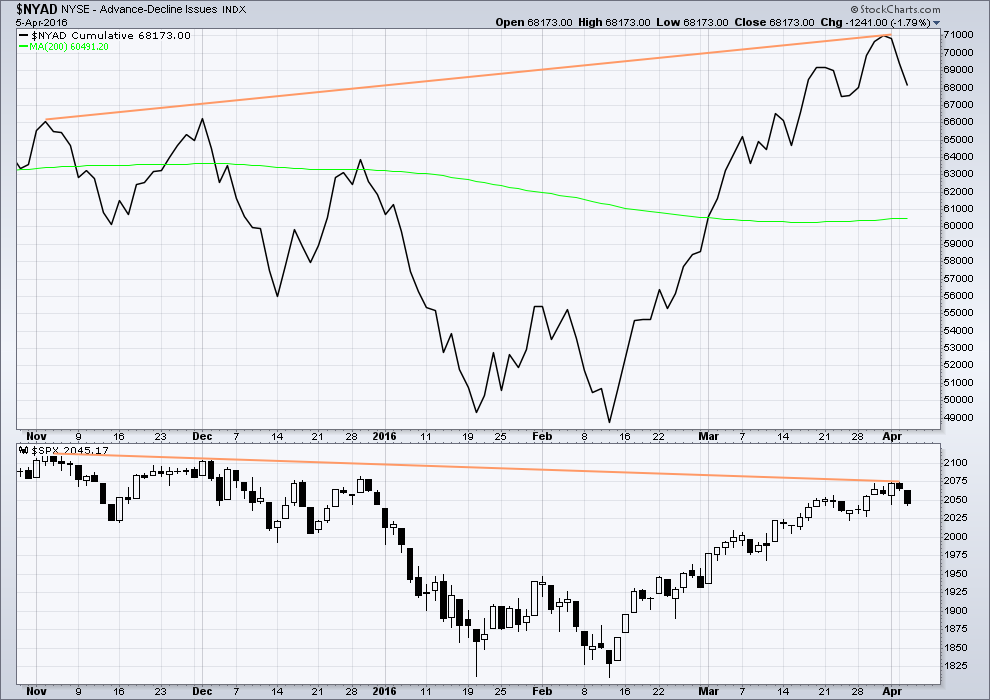
With the AD line increasing, this indicates the number of advancing stocks exceeds the number of declining stocks. This indicates that there is breadth to this upwards movement.
From November 2015 to now, the AD line is making new highs while price has so far failed to make a corresponding new high. This indicates weakness in price; the increase in market breadth is unable to be translated to increase in price.
It remains to be seen if price can make new highs beyond the prior highs of 3rd November, 2015. If price can manage to do that, then this hidden bearish divergence will no longer be correct, but the fact that it is so strong at this stage is significant. The AD line will be watched daily to see if this bearish divergence continues or disappears.
The 200 day moving average for the AD line is now increasing. This alone is not enough to indicate a new bull market. During November 2015 the 200 day MA for the AD line turned upwards and yet price still made subsequent new lows.
DOW THEORY
I am choosing to use the S&P500, Dow Industrials, Dow Transportation, Nasdaq and the Russell 2000 index. Major swing lows are noted below. So far the Industrials, Transportation and Russell 2000 have made new major swing lows. None of these indices have made new highs.
I am aware that this approach is extremely conservative. Original Dow Theory has already confirmed a major trend change as both the industrials and transportation indexes have made new major lows.
At this stage, if the S&P500 and Nasdaq also make new major swing lows, then my modified Dow Theory would confirm a major new bear market. At that stage, my only wave count would be the bear wave count.
The lows below are from October 2014. These lows were the last secondary correction within the primary trend which was the bull market from 2009.
These lows must be breached by a daily close below each point.
S&P500: 1,821.61
Nasdaq: 4,117.84
DJIA: 15,855.12 – close below on 25th August 2015.
DJT: 7,700.49 – close below on 24th August 2015.
Russell 2000: 1,343.51 – close below on 25th August 2015.
This analysis is published @ 08:06 p.m. EST.

seems everybody is in a big hurry to jump into wave 3 down,, do we trust the count? or not. Granted, I want to slide into some shorts but it seems we would be way early. I’m going to hang on to my SDS puts trusting that Laras count is correct,, dammit anyways.
In my case doc, it is a tactical move. I’ve mentioned before that I cannot trade on a day to day basis. I cannot guarantee I will be at my desk to open or close a trade at any specific point. So, I phase in my trades. Sometimes only after the expected move materializes and other times before we can be certain. Again it is just tactics for me that suit my lifestyle.
As far as trust I place in Lara’s counting ability, that is very high. I give her analysis and commentary more weight than any other TA methods or persons. When I see tonight’s analysis, I will plan my tactics. I only have 1/4 of what I expect as my final positions.
Just kind of my thoughts as to why I am doing what I am doing which I have not shared in some time.
My ultimate stop on these positions is 2135. I can handle the heat up to that point. But then again, Lara’s count is targeting just beneath 2135. However, it is just a target. A target based upon EW science. Lara is an engineering scientist who likes to surf! (Hope that is okay Lara). Trading is often as much an art as a science. One needs to know more that just TA. The trick for me is to not let greed or fear impact my trading strategies or tactics.
Finally, doc, I’ve tried to beat you to the 1st poll position before. Obviously I never have been able to claim that title even for 24 hours! You are one of the champs! Hope you did as well on the course today.
There are 2 bear counts on the table which have the recent high and 2022 as their (short term) ‘sway points’.
We’re closer to a new higher high than 2022 so I have taken a small short punt based on current weakness. I’m also thinking we might see a minuette 2 drop before minuette 3 of minute 3, though I may have already missed the boat there.
If we were closer to 2022 than a higher high then I’d have probably taken a small punt in the other direction.
Nothing more than that for me personally. Tomorrow should reveal a bit more of Mr Markets’ hand.
There are quite a few very experienced traders in this membership, Rodney is one of them.
While I would not be trying to pick a top, I’m sure members going short here are capable of managing their risk accordingly. I’m sure they have a plan, and it’s not for me to say they’re wrong when their experience is so much greater than mine.
What I will say though is for those of us who are not so experienced, entering short here is very risky indeed. We have absolutely zero confirmation that the upwards trend for this rally is over. There has been no trend channel breach, no price confirmation, no break below the moving average providing support.
Apart from the very experienced members here my warning is do not enter short yet; trying to pick a high often does not end well.
I have made the judgement to also not enter long, the risk of primary 3 happening while I sleep is too great. I don’t want my trade to be taken out well below my stop by a highly volatile market. When P3 arrives (if it does, if I’m right) I will enter after day 1 of confirmation.
thank you for a great answer,,Lara, Rodney and Olga,,
Very well said Lara. Thanks you.
I take Lara’s comment very seriously. While we do not have a change in trend, we are still in an uptrrend and even have a bull count open. If we go above 2135, which is close at hand, then the upside risk is 2500. That is a lot of risk.
I sure hope no one ever bases their decisions on anything I write or do. I would never want that kind of pressure. I could not handle it emotionally if someone lost money because of my comments, thoughts, and trading.
I also always remember, no one, absolutely no one has any responsibility for the trades I make except me, especially the market itself. The market is never wrong only me and my decisions.
Also remember, never follow a gun slinger. I have a bit of that in me still. Only now, after paying my dues for years, I do my best to make sure my greed does not cause me to be quick on the draw often or even ever. Everyone trades at their own risk. Don’t follow a gun slinger unless you are willing to be shot down from time to time.
I just share what I am doing because many of us here do that and it has been very helpful to me. Now Lara, get tonight’s count done so I can reload my six shooter and take aim at the target which is the heart of a bull!
Yes…. all the Bulls are Giddy for that 2500. They are so excited! They are out in force!
It is exactly because we do trust the count that some of us are willing to get positioned early. This is critical for option traders as it means we can get positioned while premiums still favor put buyers. A skilled analyst who gets the counts mostly right and are reasonably accurate with targets is worth his/her weight in gold to an options trader. Laddering into positions ahead of a big move (even as they temporarily go underwater) is the only way to make serious returns trading options. The strategy is probably a bit different for folk actually selling shares short. Any one way, unhedged bet in the current market is fraught with risk imo, and that goes double for being long only…
Worth a read, lots of people are anticipating a bear market:
http://www.thegoldandoilguy.com/enough-americans-have-already-voted-chaos-is-coming/
I really like his concluding statement, copied below:
These incredible trade setups are a once in a decade opportunity and more money can be made during some of the roughest times in the stock market and economy if you know which simple trades to place and when to buy and sell.
Some days ago or perhaps a week or more ago, I mentioned how spectacular an opportunity we have to short this market if Lara’s main bear count is correct. I pointed out that this sort of trade set up with relatively small risk and potentially “life-changing” rewards is rare and a gift.
To quote the author:
In 2008, we had a very similar situation set up in the market and I was able to generate life-changing returns from these moves, …..
So much TA is pointing to this event along with current economic conditions. I am more than persuaded it is going to happen and very soon it will start.
For your reading pleasure
http://www.globalresearch.ca/financial-market-manipulations-become-more-extreme-more-desperate/5367860
Well this is just fantastic isn’t it. I take a short on oil because it’s in a clear downtrend and my analysis there is right on so far, only to get stopped out because I use a trend line and place my stop too close. It remains to be seen if that is a good thing, oil has come up to touch the final short term bear market trend line, will it stop there?
While I choose to forgo the opportunity on the S&P and not enter a buy here, due to the risk of Primary 3 waiting in the wings.
Dammit!
Anyway, a new high above 2,075.07 would add confidence to this count. At that stage the downwards move for minute ii could not be labelled as a five (which it does look suspiciously like on the hourly chart) and more confidence can be had in the main count and the target.
So far it’s looking good. So far this upwards move looks like a small five.
Here are some clues to look for overnight. If the banksters jack up futures triple digits and we see a slow fade towards the open, we are probably going to get a third down tomorrow. Bye! Bye! 🙂
(that means I am going to get spanked on those 205.50 puts I sold but I will be unloading ’em like a hot potato at the open…!)
Vern,
I hope your predictions come true tomorrow, we have been waiting a bit too long now.
I have learned to never underestimate the banksters! They are a pretty ruthless bunch. It does appear however, the end of their seven year long machinations are close at hand….and you are right, it has seemed like an eternity waiting for reality to catch up with this freakish market… 🙂
Lara cussin again? I missed at the action, whacking the lil white ball
FYI: SPX Volume Lower Today than yesterday.
Confirming distribution stage…so be careful
Wouldn’t surprise me at all if this is how the session closes. An upwards day on lighter volume.
The volume profile is bearish.
There is so much weakness in this rally, I am genuinely surprised that so many analysts may be calling it a new bull market. Are they not seeing what I’m seeing?
They are. But as the old saying goes: “Who are you going to believe…me, or your lying eyes!” 🙂 🙂 🙂
It is truly amazing what bias can do to our perception. One of the reasons I enjoy the diversity of views on the forum- keeps us fro going koo! koo!
Sometimes my family tells me I went koo! koo! long time ago!
Bull saying $1 Trillion in short positions out there and none have covered yet. So expecting new highs in 2016.
Sounds like BS to me… as this whole move for 2-11 low mostly short covering? No?
Bulls selling the BS in full force!
I don’t know where their numbers are coming from… Could it be all the Bulls short selling all the inverse ETF’s.
Is any of that broken out or is all that in one number? Anyone know? Can anyone point me to where these numbers are all listed?
Thanks
This just means that they are trying hype and pull in more retail folks ..part of distribution that they must do before taking them to the shed.
Yeah. I have been hearing that propaganda about short interest on SPX from Bloomberg for the last week now! Even when UVXY was making new 52 week lows! ha! ha!
Do you know if the short selling numbers of Inverse ETF’s are separated out from the total short selling number?
Because if it’s not, it seems to me that the total number would be very inflated.
Yep. I think that is exactly the problem. The inverse ETFs are something of a black hole trading arena and all the longs lurking on the short side of the inverse ETFs are not accounted for when assessing market optimism. That is one of the reasons their movement is so explosive when the market turns. The leverage is amplified by all the folk bailing to get out of the way of the runaway train….
I know for a fact that the professionals who are bullish LOVE to short the inverse 3X ETF’s due to the additional erosion in price that they receive in share price over time. It’s like Short them and hold forever. These ETF’s are reverse split to death over the long term.
So if what you say is correct… (number NOT separated out) the short selling numbers are extremely distorted due to shorting inverse ETF’s.
Not too much adjustment on SPY 205.50 puts on this move up. Still fetching 0.41/0.43 on bid ask. They really should get a lot cheaper with this week expiration…price action saying to be careful…!
Technically, VIX should be reflective of the put/call ratio which in turn should determine option prices. I have often wondered what happens when traders buy neither puts not calls but simply trade the ETFs. I would imagine you could move the market with a large enough order, regardless of what the put/call ration was. Lots of short selling of UVXY today so no wonder IB put their foot down…. 🙂
I’ve just bought a 10% UVXY position with a stop just above 2075.
I don’t expect much more downside to UVXY even if we make new highs.
There seems to be alot of weakness despite price going higher – I’m wondering if the alternate count is playing out and we’re just finishing wave 2 of the first impulse down. Above 2075 invalidates that idea.
I’m still expecting the main count is correct so this is a bit of a punt. If we get a 3 wave down now (poss minuette 2) or a higher high, I’ll bail on the position.
SPY 205.50 puts fetched 0.48 per contract, a bit less than the 204.5 put of the straddle cost yesterday. Will try and get filled on a stink bid of a dime to buy back as and if market moves higher…risk one buck per contract if we get a face-ripping gap down…
Interesting divergence between DJI and SPX, the latter making its impulse low yesterday and DJI with its low this morning….Transports have remained in the red…
Yep! Final impulse up underway. Should see a short correction for minute four after this move followed by final move up. I think I will give UVXY a bit more room to move down and buy back those calls for half price. I expect my time underwater below 18.50 hopefully will not be protracted… 😉
The overbought condition of this market is now extreme. Trading these final moves up on the long side is a little bit like playing with fire but I think I will sell the SPY 205.5 puts to hedge my 204.50 puts over the next 48 hours….
This current blast higher might only be sub min 5 of minuette 1 of minute 3.
There is (currently) RSI divergence on 3 min chart so not sure it is minuette 3 of minute 3 yet.
In any case the move off yesterdays low is impulsive so we should see new higher highs sooner or later. 2022 remains key.
We *could* even still be in minute 2, with the high just now being wave B of minute 2.
I think this is less probable but it would cause maximum frustration to both Bulls and Bears so I’ve got my beady eye on it 😉
Minute 1 lasted 6 days – Minute 2 took only 2 days, which is fine but it might want to mess around a bit longer.
So where did the Fed minutes day Giddy Bulls all Go???
Who knows? I can count five up three down from yesterday’s lows so the jury is still out on where we go from here….watching….
Looks like the Fed Giddy Bulls have arrived! Look at them run… they are so excited!
Interesting! UVXY moved exactly down to close gap at 19.17 from Monday’s close. Market trading heavy. No sellers around on very tepid volume. Lots of pumping but little traction.
That is where I filled some more short positions. Once the gap was filled, I entered the order.
You sneaky little devil…! 🙂
(Don’t tell anyone but I added a few calls…)
Usual short sale ban on UVXY now on IB.
The move up from yesterdays low counts as quite a nice impulse to me.
I guess it could be a C wave but I’m more inclined to think that it was minuette (i) of minute (iii) and this current move down right now will be corrective / fully retraced.
If that assumption is correct then we should be about to get a blast higher in minuette (iii) of minute (iii).
I see that. And id that is the case, I am just guessing the min iii of minute iii would take it up to about 2080 or so. That is the upper Bolinger band on the daily chart. If that happens, I will most likely take another 1/4 of my full short position.
I have to leave my office for the rest of the day. But I do not think anymore major action will occur. Tomorrow we may have a gap up for min iii of minute iii with iv and v to go. A couple more days. Maybe early next week.
I’d say minuette iii should take it higher than that so to allow minute iv to not go into minute i price, but got to admit this move is looking weak (though the impulse was textbook).
Everything in me is telling me that this market is ready to drop big style, but I’m resisting my emotions and letting price prove me right or wrong one way or another.
I’m hoping we blast higher so I can get my hands on some seriously discounted shorts.
In the US we can get those at Goodwill !!! he-he
now I really gotta go!
Took some more short positions at SPX 2060. Now at 1/4 of full position.
This move higher continues to look suspect to me. Rather than a sustained impulse to the upside, I think we may see an emotional spike up on FED jawboning that will quickly be reversed. If UVXY stays above 18.50 by the end of the day I will buy back calls for a small gain and hold onto shares…be right back to see what if anything has transpired…Cheerio! 🙂
We will not know until the close Friday. But, we have a hanging man candlestick forming on the weekly SPX chart. If the week closes a bit higher than 2060 and lower than 2072, it will be formed perfectly. This is a bearish pattern so we may have another signal the bulls have lost control. Just one piece of evidence to look for come Friday’s close.
I don’t think it’s going to take that long for a resolution….
10 more minuets until the Giddy Bulls get going… after the Fed BS ad nauseam!
Muted reaction so far!
2059.57 minimum has been achieved for the alternate
Move off morning’s high looks like three. Lemmings waiting for some juicy tidbit from the FED talking heads later today, as if anything they say ultimately matters…we should head a bit higher I think… 🙂
it has been a long while but never heard anyone since Greenspan days using the term ‘Irrational exuberance’ . That was effective in fixing the markets overbought conditions. I suspect that work has been removed from the FED approved list of terms for use.
This market feels like 2000 internet bubble market and some more, waiting and waiting for the 2:00Pm revelations
If this is a second wave correction for minute three up we need to take out 2059.19 in the next hour…and stay above this morning’s low of 2043.41, unless of course minute three up began at yesterday’s low of 2042.56…
Sold covered UVXY 20 strike call expiring next week for 1.55
Will sell to close position at break-even price of 18.50
If UVXY is above 20 at the end of next week shares will be called away at price of 20.
If UVXY goes below 18.50, 20 strike calls will have to be bought back.
Nice 50% pop on 204.5 strike bullish leg of straddle. Will hang on to 204.5 puts as move up not that convincing…filled on UVXY @ 19.99
we could be in the start of minute 3 or it could be a flat in wave 2 of 3 down?
That’s it… will be boring until the Fed minutes are released at 2:00PM. Later!
This second wave correction whether bullish or bearish, is starting to look like some kind of barrier triangle. Should be almost over.
Finding support so far at the lower channel line… If this breaks down from here strongly I think 2022.49 will be taken out.
Why? The $DJT Dow Transports are breaking lower at this moment. This lead in 2015.
Yep. After bouncing on the 200 dma on March 29, DJT (and IYT) has now moved below it. Looks like it’s attempting to give a kiss goodbye- a great place to snag a few puts…
No fill on order to buy UVXY @20. The chart proportions for minute two of minor three and minute two of minor five right now look absolutely perfect so a long continuation of the latter could alter that symmetry. Very little movement in straddle. Time to SOH.
I think we have seen the first five wave down of wave 3 and we are currently in wave 2 correction.
If this is a wave two correction in a new primary degree downtrend we will know by day’s end. Yesterday’s lows should soon fall, and UVXY should bolt past 25.00
DAX already underwater. CAC-40 and FTSE also weak. UVXY down a bit pre-market, but not as much as would be expected ahead of a third wave up, even a third of five. Today should be quite interesting and revealing of the market’s near term future. Another green close for UVXY would confirm the trigger and would be a very cautionary note for the bulls imo.
Where, oh where are the banksters?! Unless they are playing ‘possum, futures should be sky-high in both Europe and the US in the usual co-ordinated buying ahead of what looks to be an impending market rout. What is particularly strange about their absence is there is a legitimate expectation of a strong move higher in minute three based on the wave count so a sharp move up in the futures is what would have been expected, unlike the frenzied ambush buying we have seen in the past ahead of expected declines. What gives??!
Are they out of ammo? (hard to imagine since they can print ad infinitum), or has the worm turned? There is something rotting in Denmark… 🙂
Must be the Panama leak that has them worried and they are saving their pennies for more pressing matters… 🙂 🙂
As a ‘newbee’ and beginner in EW analysis could it be that minute wave ii on the hourly chart is actually a 5 down end to an expanding flat correction?
Welcome Geoff.
As a newbee or a long timer (I’m in my 5th year here), it has proven best to trust Lara’s counts. She is the expert of experts in EW analysis. Certainly she has been wrong. Who hasn’t been wrong? But she is quick to see it and admit it. While I am considering that other indicators and technical analysis may be indicating a top, and while I write in this forum about the possibility, I will always place a huge amount of weight on Lara’s count and will not go against her counts. That has proven futile.
What I am doing is expecting the top very soon, as she indicates and beginning to amass my short positions.
Again, welcome and all the best to you as well as all those who subscribe to EWSM.
No, because wave A within a flat must be a three not a five.
What it could be is minuette (a) of a zigzag for minute ii.
That idea would be eliminated with a new high.
I have learned the hard way that the S&P does not always have fives that look like fives on all time frames, nor threes that look like threes on all time frames. It makes this market particularly difficult to analyse.
Im a loozer again? I did back up my prius today.
Now now, there’s nothing wrong with electric cars.
739 HP for an electric vehicle! Wow!
Where’s Doc? Is he backing up the truck? 😉