A little upwards movement was expected but did not happen.
Summary: This is still a bear market rally until proven otherwise. A final fifth wave up is required to complete the structure. The target is 2,124. The invalidation point for this rally is 2,134.72. A short term target for a small fifth wave is now at 2,088. In the short term, tomorrow may begin with a little downwards movement to 2,055 before the upwards trend resumes.
To see last published monthly charts click here.
To see how each of the bull and bear wave counts fit within a larger time frame see the Grand Supercycle Analysis.
To see detail of the bull market from 2009 to the all time high on weekly charts, click here.
New updates to this analysis are in bold.
BEAR ELLIOTT WAVE COUNT
WEEKLY CHART
This bear wave count fits better than the bull with the even larger picture, super cycle analysis found here. It is also well supported by regular technical analysis at the monthly chart level.
Importantly, there is no lower invalidation point for this wave count. That means there is no lower limit to this bear market.
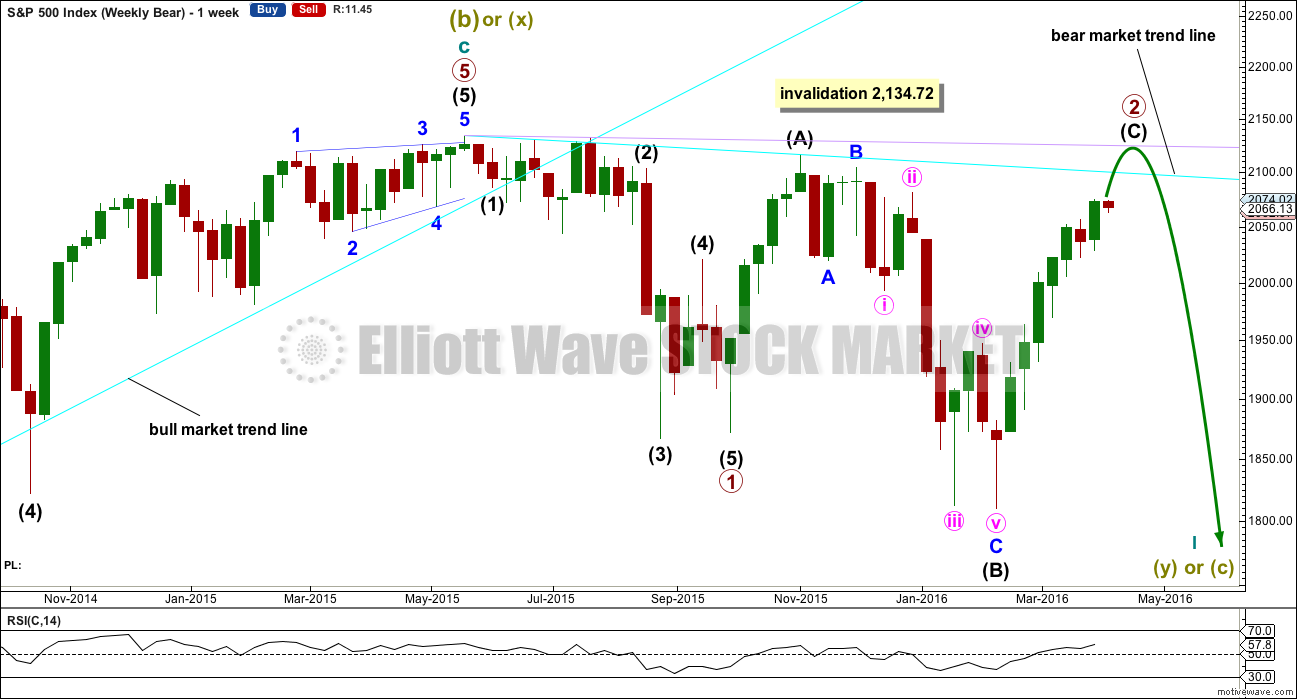
Primary wave 1 may be complete and may have lasted 19 weeks, two short of a Fibonacci 21. So far primary wave 2 has begun its 26th week. It looks unlikely to continue for another 8 weeks to total a Fibonacci 34, so it may end in about two to three weeks time. This would still give reasonable proportion between primary waves 1 and 2. Corrections (particularly more time consuming flat corrections) do have a tendency to be longer lasting than impulses.
Primary wave 2 may be unfolding as an expanded or running flat. Within primary wave 2, intermediate wave (A) was a deep zigzag (which will also subdivide as a double zigzag). Intermediate wave (B) fits perfectly as a zigzag and is a 1.21 length of intermediate wave (A). This is within the normal range for a B wave of a flat of 1 to 1.38.
Intermediate wave (C) is likely to make at least a slight new high above the end of intermediate wave (A) at 2,116.48 to avoid a truncation and a very rare running flat. However, price may find very strong resistance at the final bear market trend line. This line may hold price down and it may not be able to avoid a truncation. A rare running flat may occur before a very strong third wave down.
If price moves above 2,116.48, then the new alternate bear wave count would be invalidated. At that stage, if there is no new alternate for the bear, then this would be the only bear wave count.
Primary wave 2 may not move beyond the start of primary wave 1 above 2,134.72.
DAILY CHART
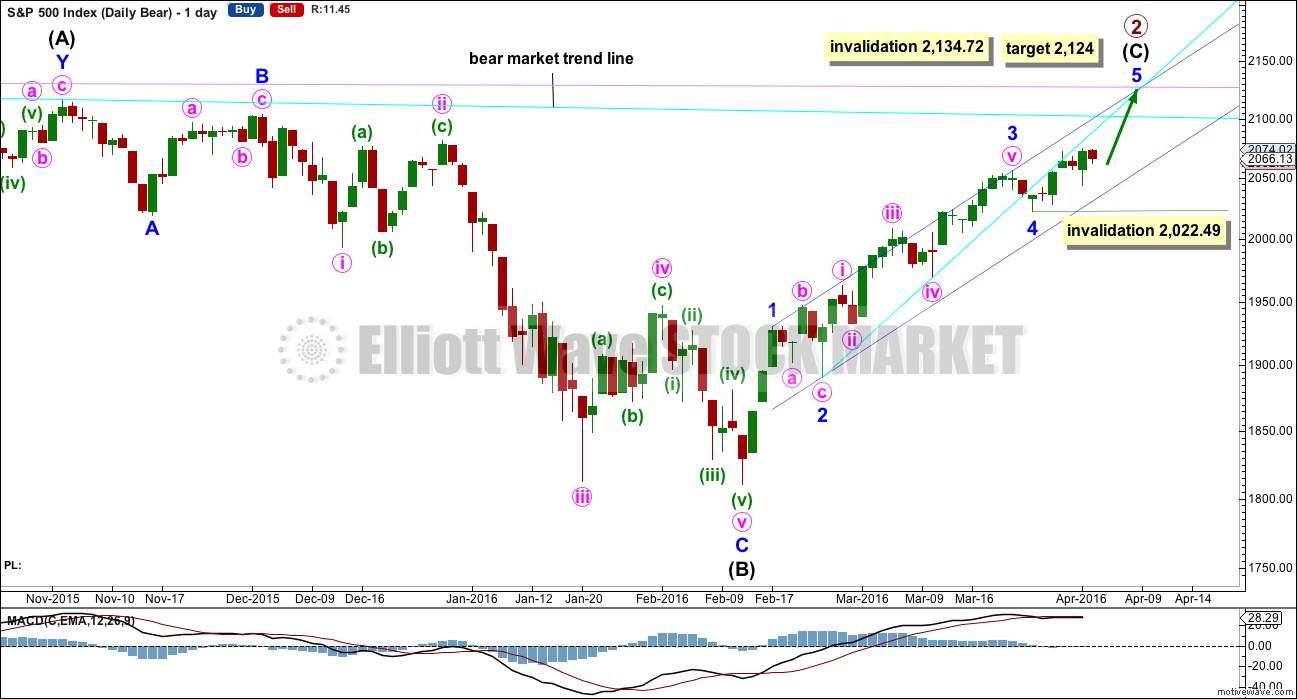
Intermediate wave (A) fits as a single or double zigzag.
Intermediate wave (B) fits perfectly as a zigzag. There is no Fibonacci ratio between minor waves A and C.
Intermediate wave (C) must subdivide as a five wave structure. It is unfolding as an impulse.
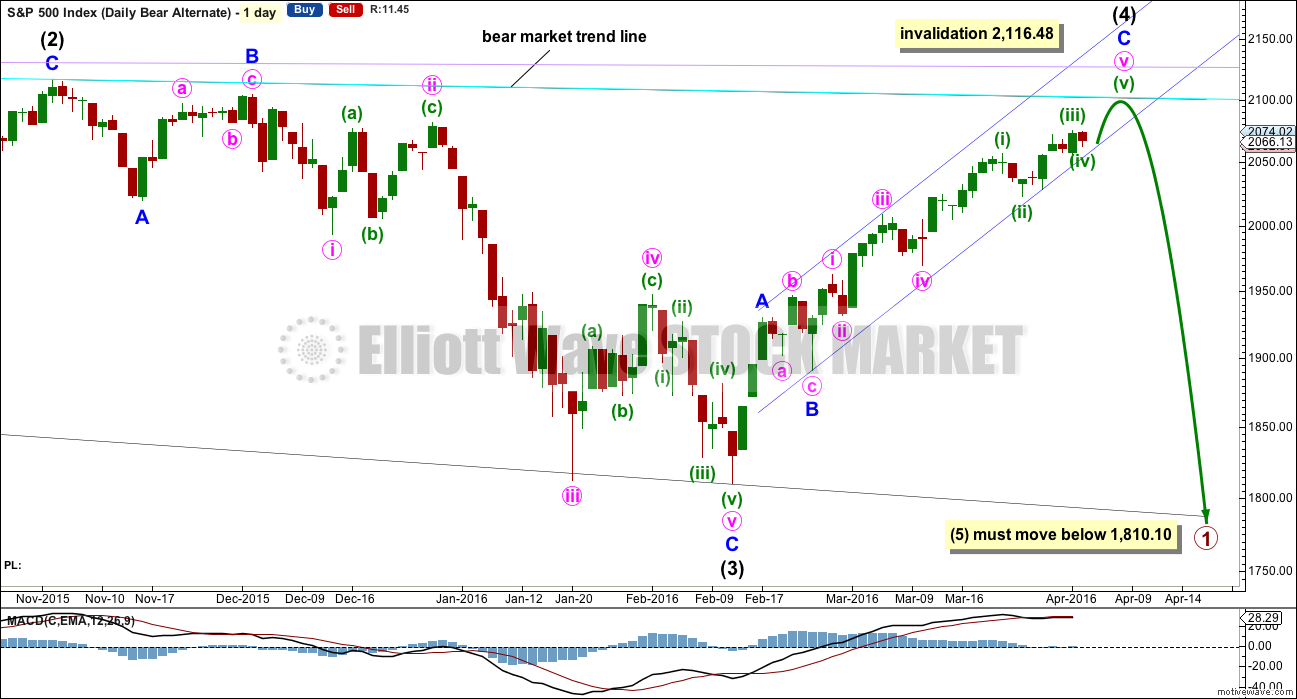
Intermediate wave (C) does not have to move above the end of intermediate wave (A) at 2,116.48, but it is likely to do so to avoid a truncation. If it is truncated and primary wave 2 is a rare running flat, then the truncation is not likely to be very large. As soon as price is very close to 2,116.48 this wave count looks at the possibility of a trend change.
The next wave down for this wave count would be a strong third wave at primary wave degree.
A bull market trend line for this rally is drawn across the first two small swing lows as per the approach outlined by Magee. This upwards sloping cyan line may provide support for corrections along the way up. Price broke below the cyan line. It may now provide resistance. The S&P has a tendency to break out of channels or below lines and then continue in the prior direction. It is doing that here.
At 2,124 minor wave 5 would reach 0.618 the length of minor wave 3. Intermediate wave (C) would avoid a truncation and the wave count would remain valid. Primary wave 2 would fulfill its purpose of convincing everyone that a new bull market is underway, and it would do that right before primary wave 3 surprises everyone.
Within minor wave 5, no second wave correction may move beyond the start of its first wave below 2,022.49.
Within the impulse of intermediate wave (C), minor wave 2 is an expanded flat and minor wave 4 is a zigzag. These two corrections look to be nicely in proportion.
Although technically the structure for intermediate wave (C) could be seen as complete, it would probably be severely truncated. This is not impossible, but the probability of it is too low to seriously consider.
HOURLY CHART
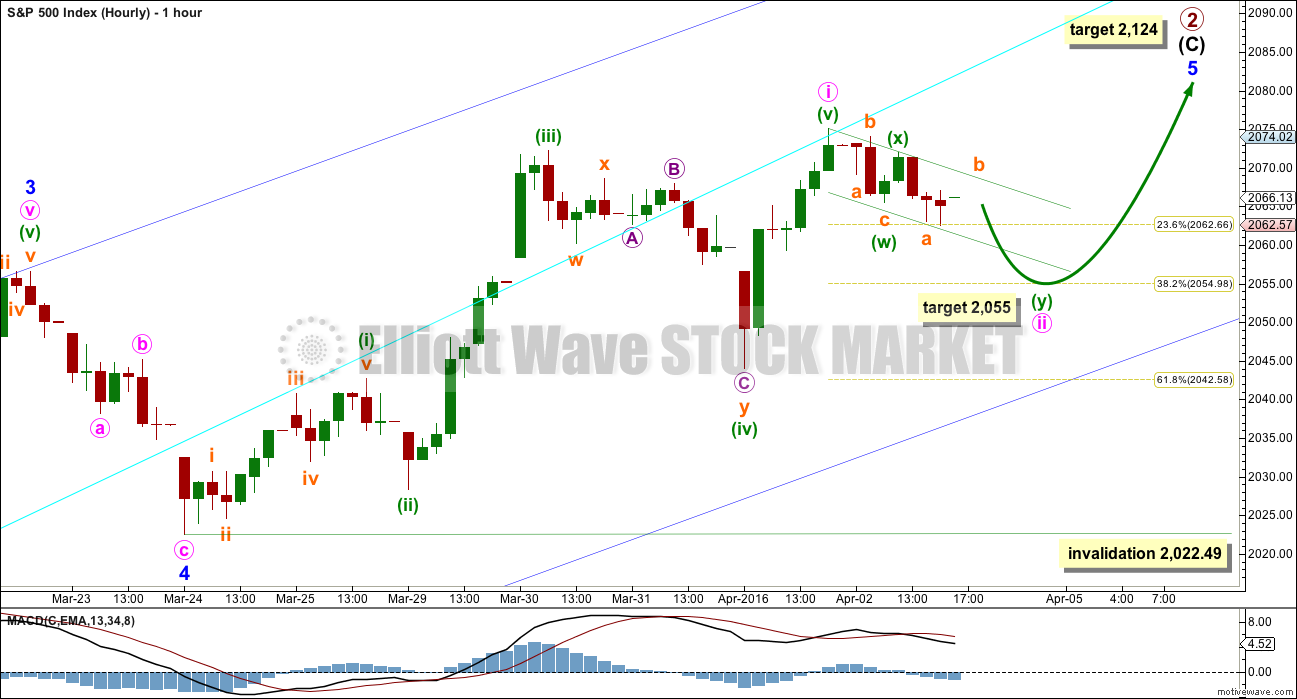
Minuette wave (v) must be over. It will subdivide as a five on the five minute chart although it does not look perfect as a five on the hourly chart. The S&P just does not always have waves which look correct at all time frames.
Minute wave ii may be subdividing as a double zigzag. This fits on the five minute chart. At 2,055 the second zigzag would reach about 1.618 the length of the first zigzag and minute wave ii would correct to the 0.382 Fibonacci ratio of minute wave i. If this target is wrong, it may not be low enough. The second likely point for minute wave ii to end is the 0.618 Fibonacci ratio at 2,043.
So far minute wave ii fits neatly within a small channel. The first indication that it is over may be a breach of the upper edge of this channel.
Minute wave ii should show up on the daily chart as one to three red candlesticks or doji. It may not move beyond the start of minute wave i below 2,022.49.
ALTERNATE WEEKLY CHART
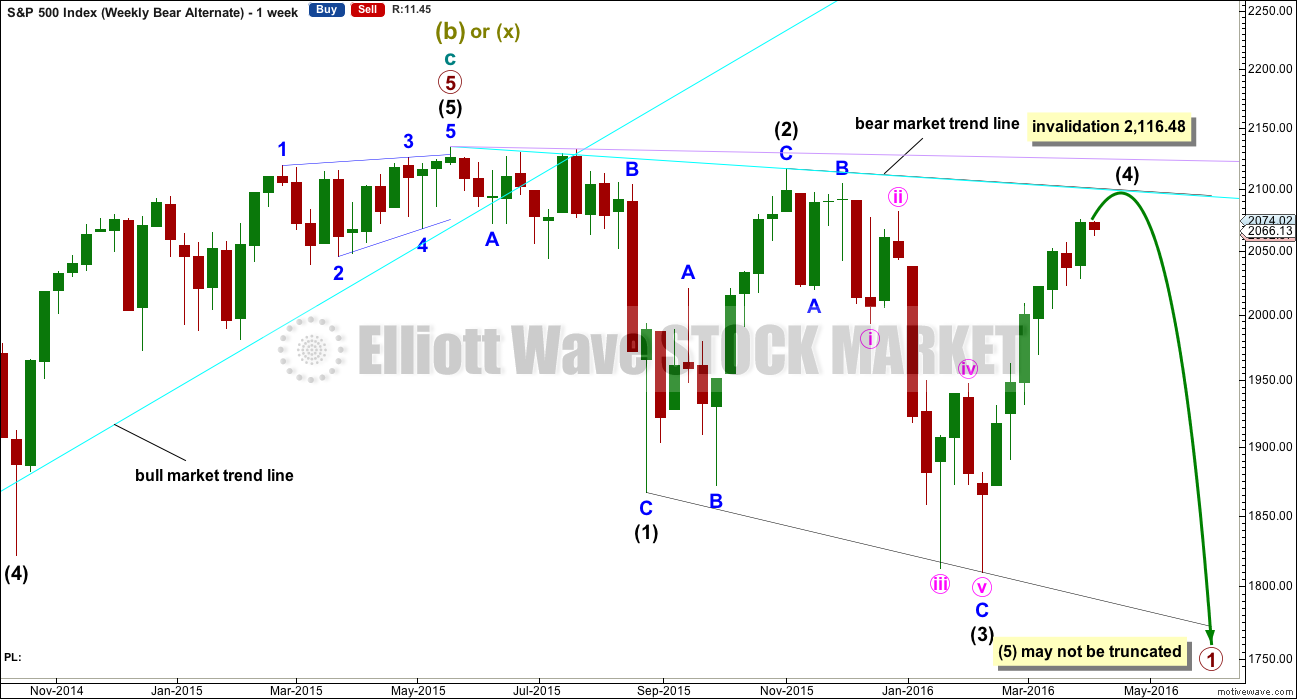
Primary wave 1 may subdivide as one of two possible structures. The main bear count sees it as a complete impulse. This alternate sees it as an incomplete leading diagonal.
The diagonal must be expanding because intermediate wave (3) is longer than intermediate wave (1). Leading expanding diagonals are not common structures, so that reduces the probability of this wave count to an alternate.
Intermediate wave (4) must continue higher and may find resistance at the cyan bear market trend line. Intermediate wave (4) may not move above the end of intermediate wave (2) at 2,116.48.
ALTERNATE DAILY CHART
Within a leading diagonal, subwaves 2 and 4 must subdivide as zigzags. Subwaves 1, 3 and 5 are most commonly zigzags but may also sometimes appear to be impulses.
Intermediate wave (3) down fits best as a zigzag.
In a diagonal the fourth wave must overlap first wave price territory. The rule for the end of a fourth wave is it may not move beyond the end of the second wave.
Expanding diagonals are not very common. Leading expanding diagonals are less common.
Intermediate wave (4) must be longer than intermediate wave (2), so it must end above 2,059.57. If this minimum is not met, this wave count would be invalid. The trend lines must diverge.
Leading diagonals may not have truncated fifth waves. Intermediate wave (5) would most likely be a zigzag, must end below 1,810.10, and must be longer in length than intermediate wave (3) which was 306.38 points.
BULL ELLIOTT WAVE COUNT
WEEKLY CHART
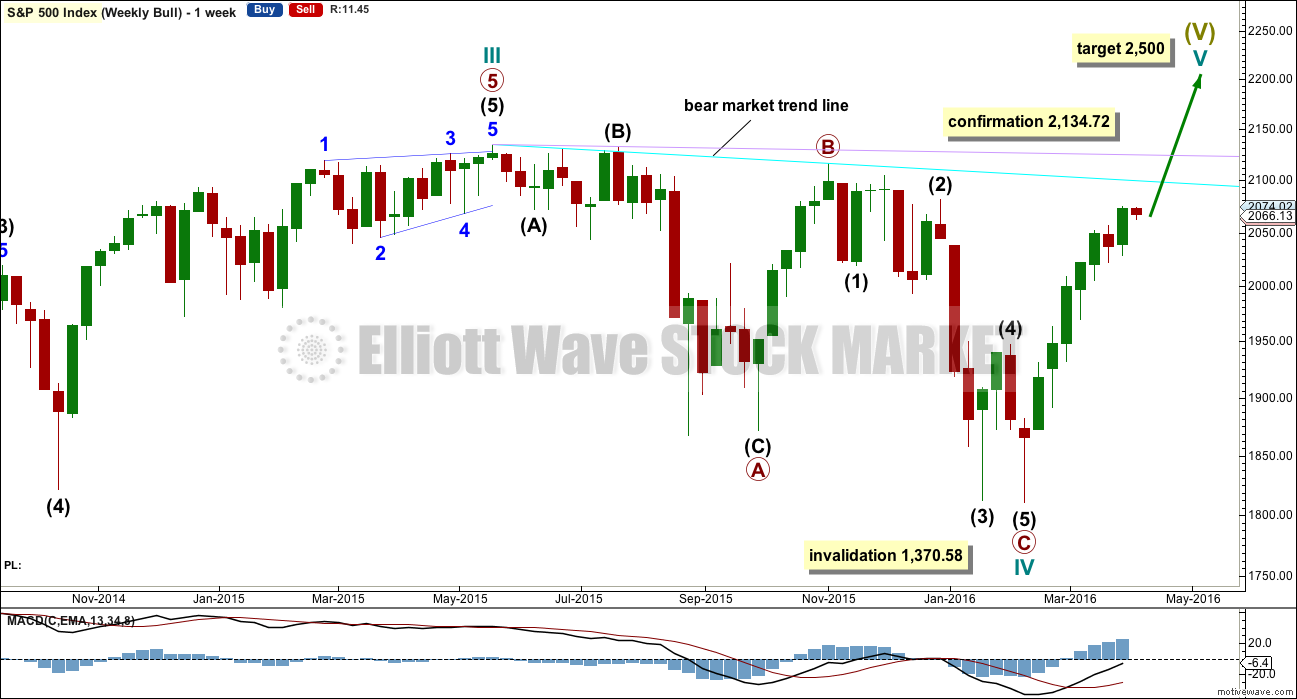
Cycle wave II was a shallow 0.41 zigzag lasting three months. Cycle wave IV may be a complete shallow 0.19 regular flat correction, exhibiting some alternation with cycle wave II.
At 2,500 cycle wave V would reach equality in length with cycle wave I.
Price remains below the final bear market trend line. This line is drawn from the all time high at 2,134.72 to the swing high labelled primary wave B at 2,116.48 on November 2015. This line is drawn using the approach outlined by Magee in the classic “Technical Analysis of Stock Trends”. To use it correctly we should assume that a bear market remains intact until this line is breached by a close of 3% or more of market value. In practice, that price point would be a new all time high which would invalidate any bear wave count.
This wave count requires price confirmation with a new all time high above 2,134.72.
While price has not made a new high, while it remains below the final bear market trend line and while technical indicators point to weakness in upwards movement, this very bullish wave count comes with a strong caveat. I do not have confidence in it.
DAILY CHART
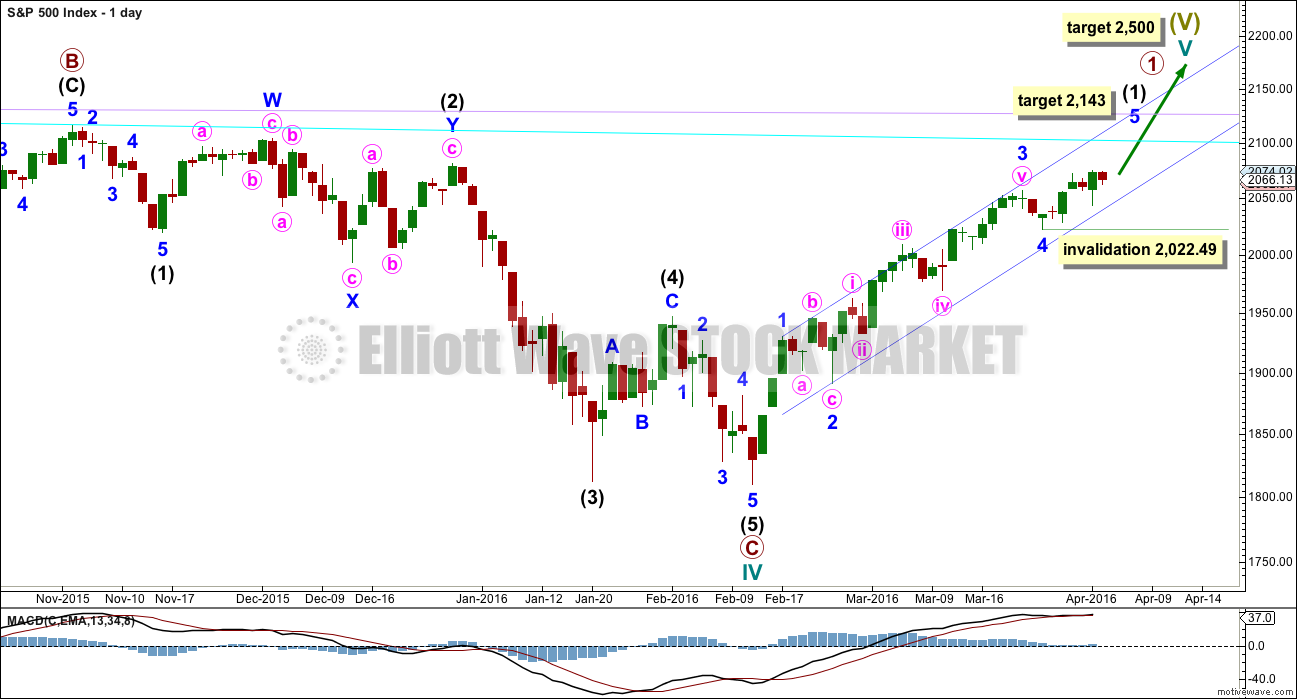
Upwards movement cannot now be a fourth wave correction for intermediate wave (4) as price is now back up in intermediate wave (1) territory above 2,019.39. This has provided some clarity.
For the bullish wave count, it means that primary wave C must be over as a complete five wave impulse.
Intermediate wave (2) is seen as an atypical double zigzag. It is atypical in that it moves sideways. Double zigzags should have a clear slope against the prior trend to have the right look. Within a double zigzag, the second zigzag exists to deepen the correction when the first zigzag does not move price deep enough. Not only does this second zigzag not deepen the correction, it fails to move at all beyond the end of the first zigzag. This structure technically meets rules, but it looks completely wrong. This gives the wave count a low probability.
If the bull market has resumed, it must begin with a five wave structure upwards at the daily and weekly chart level. So far that is incomplete.
Downwards movement may not be a lower degree correction within minute wave v because it is in price territory of the first wave within minute wave v. This downwards movement must be minor wave 4. At 2,143 minor wave 5 would reach equality in length with minor wave 1.
Within minor wave 5, no second wave correction may move beyond the start of its first wave below 2,022.49.
TECHNICAL ANALYSIS
DAILY CHART
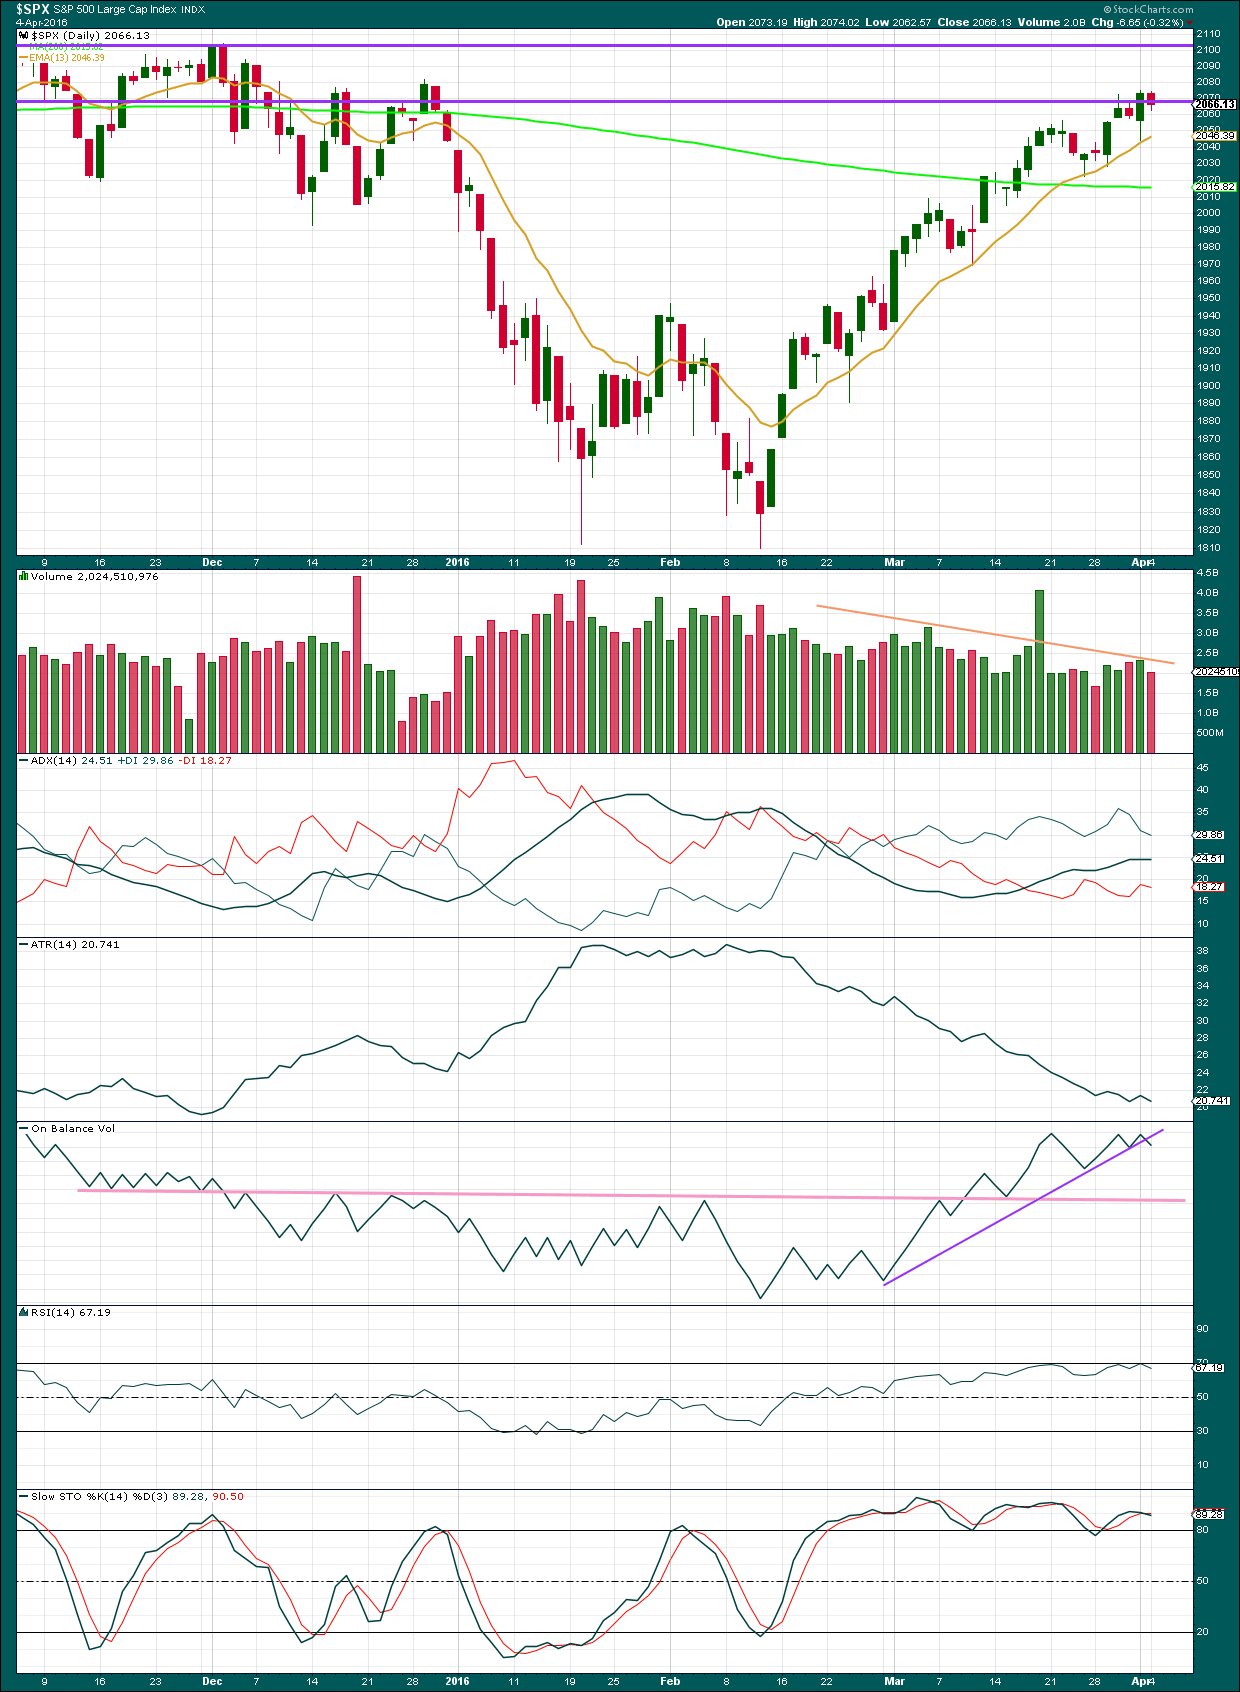
Click chart to enlarge. Chart courtesy of StockCharts.com.
Volume data on StockCharts is different to that given from NYSE, the home of this index. Comments on volume will be based on NYSE volume data when it differs from StockCharts.
Price has been trending upwards now for 35 days. The 13 day moving average is showing where corrections are finding support.
ADX is again flat today, indicating the market is not trending. This may be due to a small consolidation. However, this does indicate weakness. ADX is based on a 14 day average. For just one downwards day to have such an effect indicates that the trend is weak. Overall, ADX is not indicating a clear upwards trend anymore.
ATR indicates there is something wrong with this trend. Normally a trend comes with increasing ATR but this trend is unusual in that it comes with clearly declining ATR. The trend is weak.
This upwards movement is coming overall with declining volume. The rise in price is not sustainable and is not supported by volume. This is further weakness in this trend.
On Balance Volume is today giving a weak bearish signal with a break below the purple line. This signal is weak because the line is steep, only tested twice and not long held. For OBV to give a clearer bearish signal it needs to break below the pink line which his strong technical significance.
RSI no longer shows divergence with price: the last high in price corresponds with a very slight new high on RSI. RSI is not yet overbought, so there is still room for this upwards trend to continue.
Stochastics is showing double negative divergence with price. This does not indicate upwards movement must end here and it is just further warning that this trend is weak.
INVERTED VIX DAILY CHART
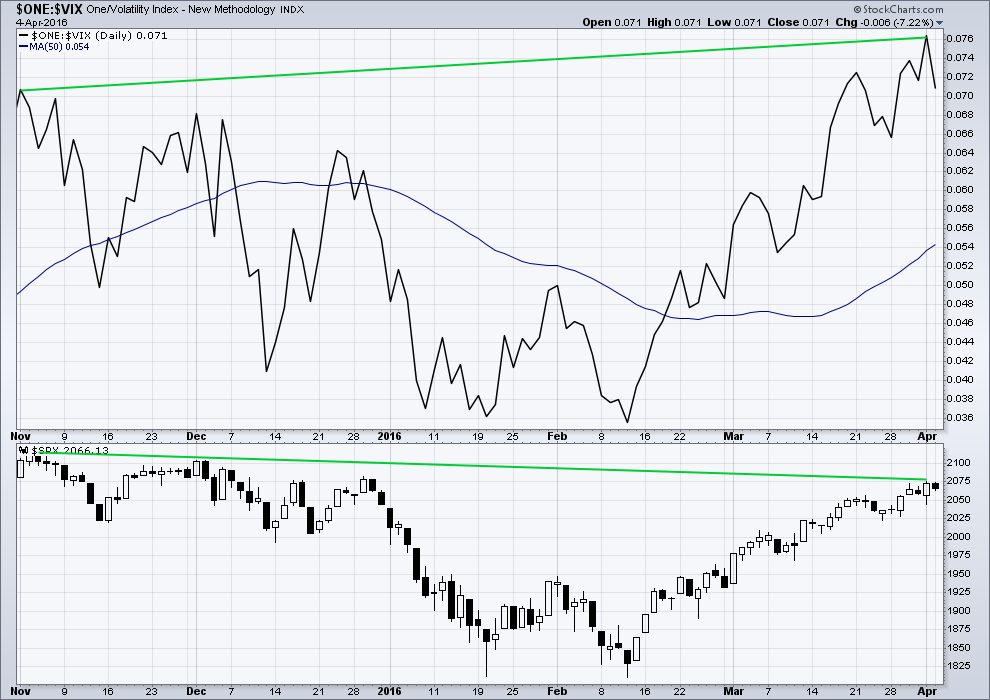
Click chart to enlarge. Chart courtesy of StockCharts.com.
Volatility declines as inverted VIX climbs. This is normal for an upwards trend.
What is not normal here is the divergence over a reasonable time period between price and inverted VIX. The decline in volatility is not translating to a corresponding increase in price. Price is weak. This divergence is bearish.
BULLISH PERCENT DAILY CHART
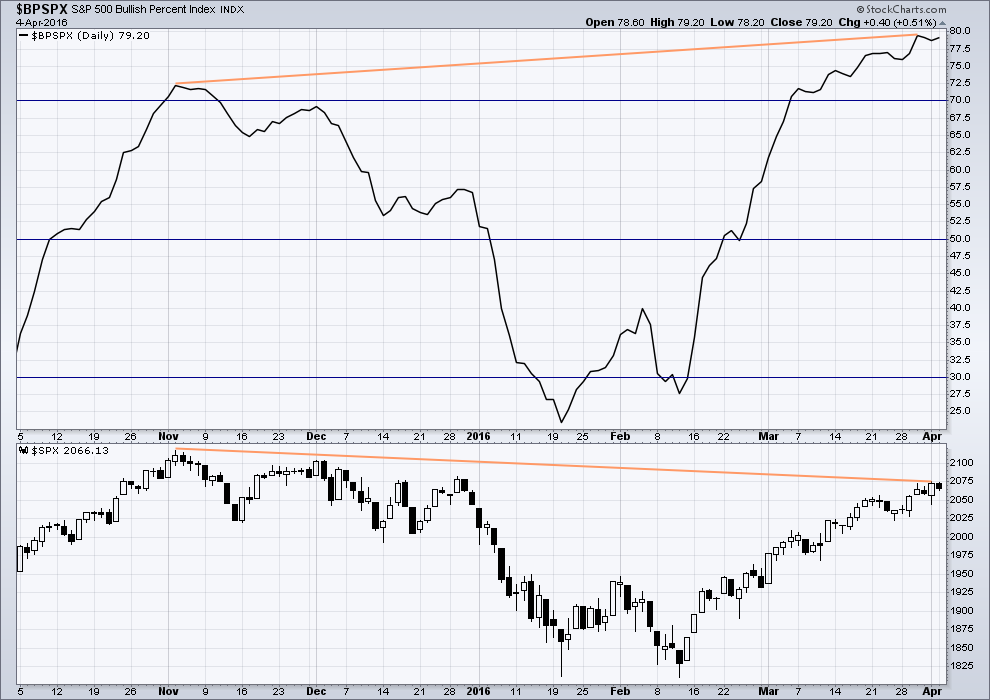
Click chart to enlarge. Chart courtesy of StockCharts.com.
There is strong hidden bearish divergence between price and the Bullish Percent Index. The increase in the percentage of bullish traders is more substantial than the last high in price. As bullish percent increases, it is not translating to a corresponding rise in price. Price is weak.
This looks like an overabundance of optimism which is not supported by price.
While the slight day to day divergence with price and bullish percent on Friday was followed by downwards movement for Monday, this may work again but in the opposite direction. Price overall moved lower today but the number of bullish traders increased. This may indicate upwards movement overall for Tuesday.
ADVANCE DECLINE LINE
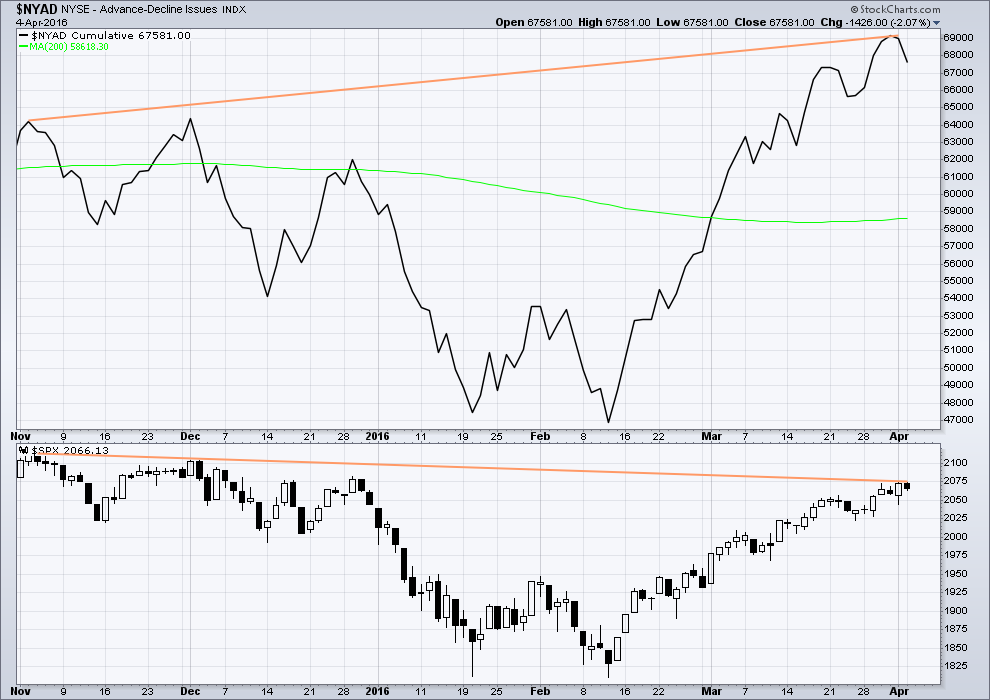
Click chart to enlarge. Chart courtesy of StockCharts.com.
With the AD line increasing, this indicates the number of advancing stocks exceeds the number of declining stocks. This indicates that there is breadth to this upwards movement.
From November 2015 to now, the AD line is making new highs while price has so far failed to make a corresponding new high. This indicates weakness in price; the increase in market breadth is unable to be translated to increase in price.
It remains to be seen if price can make new highs beyond the prior highs of 3rd November, 2015. If price can manage to do that, then this hidden bearish divergence will no longer be correct, but the fact that it is so strong at this stage is significant. The AD line will be watched daily to see if this bearish divergence continues or disappears.
The 200 day moving average for the AD line is now increasing. This alone is not enough to indicate a new bull market. During November 2015 the 200 day MA for the AD line turned upwards and yet price still made subsequent new lows.
DOW THEORY
I am choosing to use the S&P500, Dow Industrials, Dow Transportation, Nasdaq and the Russell 2000 index. Major swing lows are noted below. So far the Industrials, Transportation and Russell 2000 have made new major swing lows. None of these indices have made new highs.
I am aware that this approach is extremely conservative. Original Dow Theory has already confirmed a major trend change as both the industrials and transportation indexes have made new major lows.
At this stage, if the S&P500 and Nasdaq also make new major swing lows, then my modified Dow Theory would confirm a major new bear market. At that stage, my only wave count would be the bear wave count.
The lows below are from October 2014. These lows were the last secondary correction within the primary trend which was the bull market from 2009.
These lows must be breached by a daily close below each point.
S&P500: 1,821.61
Nasdaq: 4,117.84
DJIA: 15,855.12 – close below on 25th August 2015.
DJT: 7,700.49 – close below on 24th August 2015.
Russell 2000: 1,343.51 – close below on 25th August 2015.
This analysis is published @ 07:46 p.m. EST.

Whether the SPX has reached its top or not, its not too early for some well-placed puts. The canaries are falling left and right in this coal mine–markets that have led the SPX down in the recent past are: high yield bonds (HYG), which resumed its downtrend two weeks ago, the banking index (KBE) which today broke down out of its correction channel, and transports (IYT), which is knocking hard on the lower bound of its correction channel. Besides that, we have a huge bull apparently beginning in bonds (TLT), a bearish signal.
In addition to some individual stocks, I’m short HYG and getting short KBE tomorrow, with an eye on IYT and SPX later when we have more confirmation.
I am with you on this, thomas. RUT & NYA are also signalling a change in process.
I like your statement, “The canaries are falling left and right in this coal mine”
I am hoping more upward movement materializes so I can buy my shorts at a discount. It is often prudent to take some positions as the correction is completing and the trend starts changing. This is so because waiting for trendline breaks, confidence points, confirmations etc often puts you at a less profitable entry point without a reduction of any risk.
But patience is a real virtue for traders. Thanks for the comments.
that was a devious spike lower at the close,, earlier I picked up some SDS puts in anticipation of the upmove that was started afterhours
The second target is met and slightly exceeded. This is a common point for a second wave.
We have seen downwards days on higher volume before during this rally, so an increase in volume indicates support for the fall in price, but looking at recent behaviour does not mean it has to end the rally here.
We don’t have a candlestick reversal pattern at the high on the daily chart, but then we have seen a bearish engulfing pattern before and it wasn’t the high. So that doesn’t mean too much I expect today.
I keep coming back to that truncation. Intermediate (C) would be truncated by just over 40 points if it is over. That is a huge truncation.
I guess that could happen if primary 3 is REALLY strong. But still. That’s just too big for me to consider a reasonable probability at all.
We need to wait for price to either break below the dark blue channel or preferably below 2,022.49 before we can have any confidence that this rally is over.
For now, I’m still expecting more upwards movement so that intermediate (C) isn’t so hugely truncated. And as counterintuitive as it seems I’m considering entering a small buy at the end of this session to ride a small third wave up over the next few days. I say counterintuitive because it would seemingly go against the many bearish comments below.
Tomorrow is Federal Reserve minutes day of the last meeting… The Bulls are all giddy because it always means a POP in market prices.
Could well be the last serious pop the Bulls get for quite some time.
I’m hopeful we’ll see some conclusion to this slow motion train crash by the weekend but no doubt it’ll drag on for as long as possible.
I’m too chicken to go long here- if we got a bit closer to 2022 I’d consider it. In my mind being in cash (i.e. not being short) is as good as being long atm.
I’m concluding the same actually. There is just so much weakness in this market at this time. OBV is giving a bearish signal (albeit a weak signal) today, ATR is flattening off, there is huge divergence with multiple indicators, ADX is turning down…
But price is sitting right on the lower blue trend line. If it is going to go up from here then it should do so right from this point.
Thanks for the update Lara and if you go long I hope it works out for you.
Do you have any examples of running flats? There isn’t one in “Elliott Wave Principle”. I also didn’t see anything in that book on acceptable truncation amounts for a running flat. Do you have another resource you refer too for this?
🙂
Here’s an example on the S&P which is the most recent.
Intermediate (2) is a double flat.
Minor W is an expanded flat and minor Y is a running flat.
Within minor Y minute b is a 1.42 length of minute a, minute c is truncated by 1.88 points.
From page 48 of Frost and Prechter:
“in a rare variation on the 3-3-5 pattern, which we call a running flat, wave B terminates well beyond the beginning of wave A as in an expanded flat, but wave C fails to travel its full distance, falling short of the level at which wave A ended… the forces in the direction of the larger trend are so powerful that the pattern is skewed in that direction. The result is akin to the truncation of an impulse.”
Of the few running flats I have seen which in hindsight are definitely running flats, the truncation is small.
There is no guideline as to how large an acceptable truncation may be. My experience says to expect only a small truncation.
Chart should have been attached
SPX bounced right off of 2042.56 – i believe Lara had a 2nd downside target of 2043
Was 61.8% fib retrace..
76.4% is around 2034.90
I’m now SOH until 2022 is taken out or we get close to the upwards target – whichever comes first.
FWIW,
McClellan thinks a significant top was made (last Friday was a desperate attempt by the bulls) and now turned bearish expecting down trend to resume.
For short term traders the smart thing to do now is watch. For the adventurous, option straddles would fit the bill. I think we are going to see a strong move one way or the other overnight so I am executing a few at the money straddles on SPY at 204.50 strike calls and puts in equal amounts. The bulls are hanging on for dear life. Let’s see if they are good for one last pop higher. Good luck everybody!
Vern,
Does the UVXY green close work for you? There was certainly a slew of buying pressure and it closes near the high of the day. Waiting and waiting….
The second green close after a new 52 week low has been a very reliable entry point in the past. If it goes back below 20, I plan on buying another 1000 shares with short term ammo and immediately selling next week’s 20 strike call options on the position for a covered call trade with the intention of getting called away. Another 52 week low would be an amazing buying opportunity.
It will be interesting to see if the banksters step in overnight to goose prices higher for a final wave up. Based on the UVXY price action, although hedging with a straddle, I am leaning towards the bearish camp, but as they say past performance is no guarantee of…well… you know! 🙂
Huge battle erupting over market direction. UVXY creeping back toward 19.17 The immediate bearish case requires a green close.
Let’s see if the bulls can push into the green and so confirm the main bearish count. It looks like they are fighting for dear life! 🙂
Volume Today at the 2:00PM hour is higher than at least the last 10 days. 10 Days is as far back as I had time to test.
Thanks Joseph. I think that is significant and supports the idea that the bears are taking control.
It’s now a certainty… Volume will be higher than yesterday and for the last 10 days… now confirmed!
1,040.177 Million and still rising
SPX Low today 2042.56 so it penetrated 2042.67!
There was an announcement of an increase of outstanding shares for TVIX but no such announcement for UVXY. However, I just noticed at the spike high of 91.25 back on September 1 of last year only around 22 million shares were traded. Volume at the February 11 high of 61.92 was almost twice as high at around 40 million. The have clearly added more UVXY shares, and I suspect a bunch of ’em have been sold short. Somebody must have “borrowed” mine! 🙂
Looks like we are headed for the second target of 2043. I expect we will get a reversal there. If we do not, the bears are going to blow out the 2000 pivot. Stand by… 🙂
On the 1 & 5 minute charts, we have formed a descending triangle this morning. If it breaks below the bottom support line of roughly 2045, it gives a target of 2035. We should know in a few minutes if this is going to follow trough to the downside.
Where is Olga when we need her!? 🙂
The triangle seems to be contracting so I agree a break of some sort is coming…
The pattern has broken out to the upside. Therefore, the expected target is nullified.
UVXY hanging tough. These gaps during corrective moves generally quickly filled. Hmmnn…!
Looks like a solid break away gap. 🙂
So far it’s hanging tough and seeming to find support just above 20…waiting and watching…
According to the wave count, the Y portion of the double zig-zag must be underway and looks to need a new low to complete before a reversal.
The longer we go without a reversal, the higher the chances of a waterfall sell-off into the close…right now the bulls are not looking too sprightly and if we are going to see a new recovery high they really need to get going and I mean soon…if UVXY clears 25 today I think the chances of a new high will be greatly diminished… 🙂
Move down today coming on relatively light volume, probably corrective as per wave count…looking for confirmation with UVXY reversal…
If you compare volume to yesterday at this exact time, Today’s volume is higher than yesterday. So I guess it depends on where today closes in price terms.
Entering buy-stop order for SPY 106 calls expiring this week at just above yesterday’s close of 106.25
Ooops! Make that 206!
If minute three up is on deck, UVXY will fill the gap from yesterday’s close at 19.17 sometime this morning. Ordinarily one would expect to see a new 52 week low and that would be entirely normal as the market posts a new recovery high. Any divergence in the form of a higher low above 17.97, followed by a move above today’s high would imo signal the rally’s death knell.
Vern,
Only resistance I see is on weekly at 21.01 for UVXY, If the selling picks up steam and UVXY rises through it without difficulty, Nothing before 21.66 followed by 23.94 based off the 17.97 bottom. Your thoughts.
Yep! Its acting quite bullish. I don’t think the shorts have started covering yet as volume is still a bit muted. I would want to see a strong move through 25 to rule out a move back down. The first sign of the short sellers running for cover will be a big fat green candle.
Vern,
21.01 did not even see this coming now hoping we take out the other two levels as well with same force….waiting and waiting…
It does seem to be in stealth mode does it not? If it penetrates the area of the March 24 candle that would be very bad news for the bulls I think. The range that day was 23.27 – 25.60
Long term positions starting to creep back into the green sooner than expected! Premiums apparently going up. 🙂
For anyone considering the ending diagonal wave count, here is a chart with a few confidence levels. 2022.49 aligns nicely with Lara’s invalidation level for the primary bear wave count. The lower edge of the diagonal looks to be penetrated at the open this morning.
Thanks Thomas. Back in May 2015 the top was the completion of an ending diagonal. Why not now? I do not pretend to have any proficiency with Elliott wave counting. But you chart looks good to me. On the break of the upward sloping wedge (ending diagonal) the daily MACD has finally crossed over and the histogram has turned negative for the first time since early February.
Whatever the case, whatever happens over the next few days, the ship is turning around. The bulls are losing control and the bears are taking control.
Thomas; any reason why you did not extend the wedge containing the diagonal back to its start at wave five? The diagonal’s start is usually a good target for the initial re-tracement.
I believe the target is 1969.25, which is the start of the ending diagonal. Thanks for pointing that our Verne.
Cool! 🙂
See Lara’s weekly bear wave count for an example of how to draw the ending diagonal lines.
Thomas,
Would be nice for a change to see markets take out both of the levels today…waiting and waiting..
Beware the banksters! Never underestimate their determination to delay their day of reckoning. Overnight futures already taking on second wave characteristics as they steadily buy it from deep in the red. I would not be surprised to see us open in the green or go positive shortly after the open. Keep an eye on UVXY. Even a gap up open must be followed up by a second green close for a buy to be triggered. I expect they will empty the chambers on this last run up, and after they are done, time to bring out the 50mm cannons, or in Olga’s case, the kitchen sink! One way we will know P3 has arrived will be the way futures react to their attempts to pump them- the attempts will be violently sold, sending them deeper in the red as the night progresses, as opposed to steadily marching higher. Their ability to still pump the markets suggests the animal spirits remain animated. Nonetheless, the infamous “Slope of Hope” rapidly approaches. although in this case rather than a slope, I suspect it is going to be a waterfall. If at any time the DJI 17,000 and SPX 2000 pivots are violated on a close, including today – the banksters are toast! Stay Frosty! 🙂
S&P Future -17.25 (2040)
DOW Future -125 (17517)
NASDAQ Futures -28.25 (4472)
EMEA and Asia in RED, waiting and watching how we open…
I am a paltry phorth ? it is closing time, Im going home to pout
Maybe neth time?! 😀
Thanks Lara. Excellent as always. I am going to use the next 25 to 50 points up to get about 50% of my short position. Then I will complete the position with channel breaks and other confidence points.
If, on the outside chance we break 2022, then I will look for a spot to fill the rest of my position. When the market is plunging, though, it becomes a bit more challenging to go short simply because one often tries to wait until a bounce up to go short. But then one discovers the bounce up doesn’t materialize until we are way down. That is why I am willing to start taking on some risk and expose myself (to the market not to any of you!!!).
No matter what, I think we are only days away from a significant high.
Have a great evening.
“That is why I am willing to start taking on some risk and expose myself…”
Is that what they mean by having some “skin” in the game? 😉
That is what they mean if you are playing skins and shirts.
However, where I come from that ‘skin’ is green and says Federal Reserve Note. Now how much is that worth? What has the Federal Reserve ever produced that gives its notes worth? What wealth have they ever created other than paper? A day of reckoning is coming.
This wave count is absolutely exquisite. A classic strong third wave up in minute three of minor five to dislodge any remaining bears and also shake out party early arrivals. I think we may even see the move up continue into the week-end with the final minute five of minor five up. Reloading those 207.50 SPY calls at the open looks like a low risk trade. Let’s see what saith the futures…
TIF put in a bearish engulfing candle today so some players appear to be exiting early…
First! 🙂