
Upwards movement was expected; price made new highs.
The session began with a whipsaw which remained just above the invalidation point.
Summary: This is still a bear market rally until proven otherwise. A final fifth wave up is required to complete the structure. The target is 2,124. The invalidation point for this rally is 2,134.72. A short term target for a small fifth wave is now at 2,088.
To see last published monthly charts click here.
To see how each of the bull and bear wave counts fit within a larger time frame see the Grand Supercycle Analysis.
To see detail of the bull market from 2009 to the all time high on weekly charts, click here.
New updates to this analysis are in bold.
BEAR ELLIOTT WAVE COUNT
WEEKLY CHART
Click chart to enlarge.
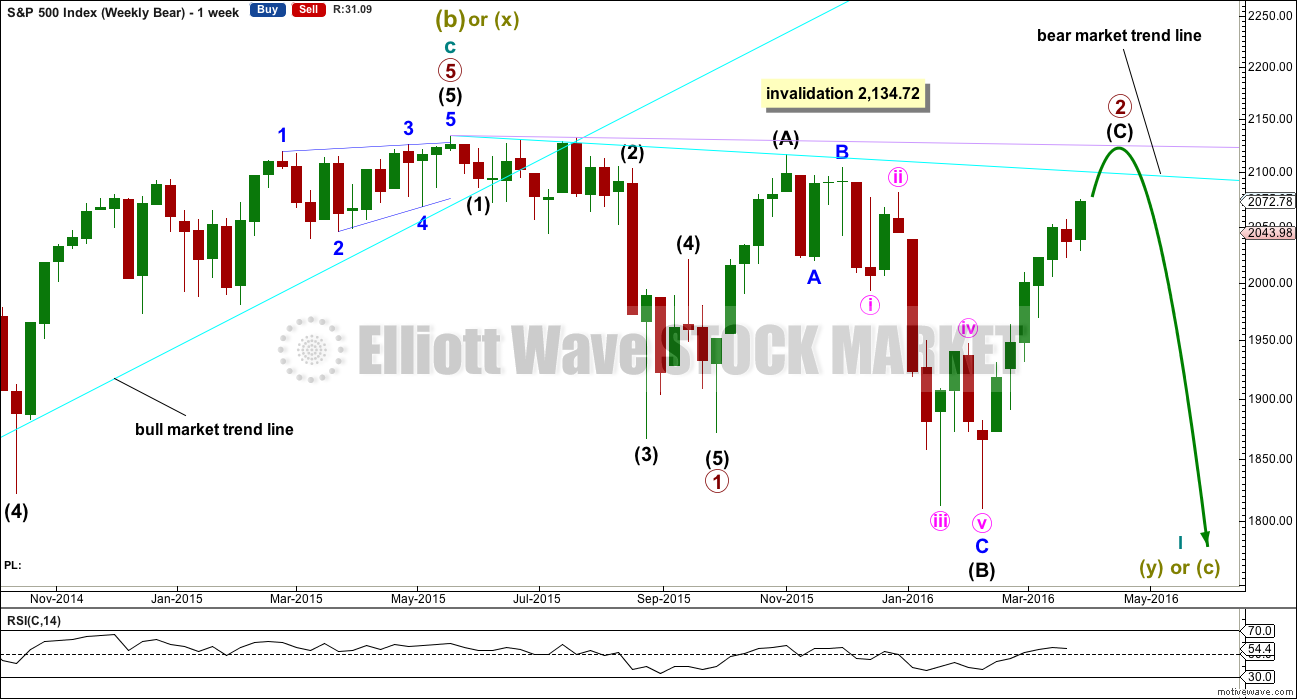
This bear wave count fits better than the bull with the even larger picture, super cycle analysis found here. It is also well supported by regular technical analysis at the monthly chart level.
Importantly, there is no lower invalidation point for this wave count. That means there is no lower limit to this bear market.
Primary wave 1 may be complete and may have lasted 19 weeks, two short of a Fibonacci 21. So far primary wave 2 has completed its 25th week. It looks unlikely to continue for another 9 weeks to total a Fibonacci 34, so it may end in about two to five weeks time. This would still give reasonable proportion between primary waves 1 and 2. Corrections (particularly more time consuming flat corrections) do have a tendency to be longer lasting than impulses.
Primary wave 2 may be unfolding as an expanded or running flat. Within primary wave 2, intermediate wave (A) was a deep zigzag (which will also subdivide as a double zigzag). Intermediate wave (B) fits perfectly as a zigzag and is a 1.21 length of intermediate wave (A). This is within the normal range for a B wave of a flat of 1 to 1.38.
Intermediate wave (C) is likely to make at least a slight new high above the end of intermediate wave (A) at 2,116.48 to avoid a truncation and a very rare running flat. However, price may find very strong resistance at the final bear market trend line. This line may hold price down and it may not be able to avoid a truncation. A rare running flat may occur before a very strong third wave down.
If price moves above 2,116.48, then the new alternate bear wave count would be invalidated. At that stage, if there is no new alternate for the bear, then this would be the only bear wave count.
Primary wave 2 may not move beyond the start of primary wave 1 above 2,134.72.
DAILY CHART
Click chart to enlarge.
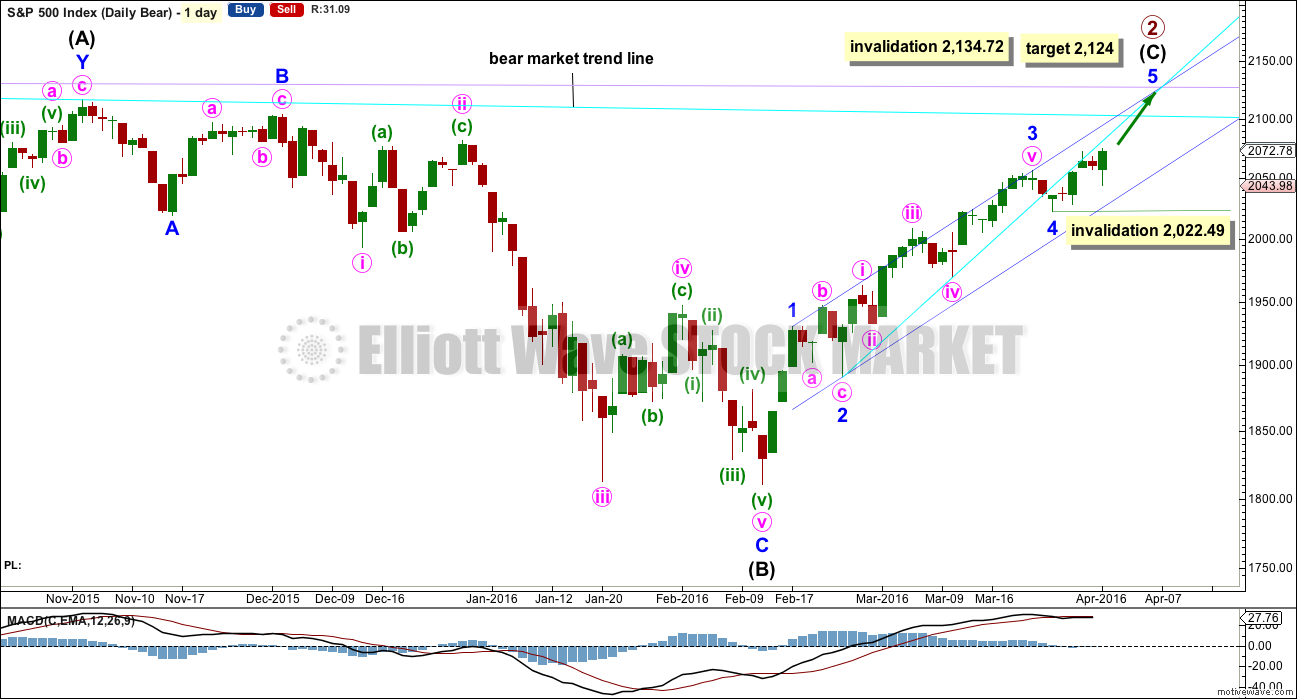
Intermediate wave (A) fits as a single or double zigzag.
Intermediate wave (B) fits perfectly as a zigzag. There is no Fibonacci ratio between minor waves A and C.
Intermediate wave (C) must subdivide as a five wave structure. It is unfolding as an impulse.
Intermediate wave (C) does not have to move above the end of intermediate wave (A) at 2,116.48, but it is likely to do so to avoid a truncation. If it is truncated and primary wave 2 is a rare running flat, then the truncation is not likely to be very large. As soon as price is very close to 2,116.48 this wave count looks at the possibility of a trend change.
The next wave down for this wave count would be a strong third wave at primary wave degree.
A bull market trend line for this rally is drawn across the first two small swing lows as per the approach outlined by Magee. This upwards sloping cyan line may provide support for corrections along the way up. Price broke below the cyan line. It may now provide resistance. The S&P has a tendency to break out of channels or below lines and then continue in the prior direction. It is doing that here.
At 2,124 minor wave 5 would reach 0.618 the length of minor wave 3. Intermediate wave (C) would avoid a truncation and the wave count would remain valid. Primary wave 2 would fulfill its purpose of convincing everyone that a new bull market is underway, and it would do that right before primary wave 3 surprises everyone.
There is now a clear five up on the hourly and daily charts from the low labelled minor wave 4. This indicates that minor wave 4 should be over and minor wave 5 should be underway. The invalidation point may be moved up. Within minor wave 5, no second wave correction may move beyond the start of its first wave below 2,022.49.
Within the impulse of intermediate wave (C), minor wave 2 is an expanded flat and minor wave 4 is a zigzag. These two corrections look to be nicely in proportion.
Although technically the structure for intermediate wave (C) could be seen as complete, it would probably be severely truncated. This is not impossible, but the probability of it is too low to seriously consider.
HOURLY CHART
Click chart to enlarge.
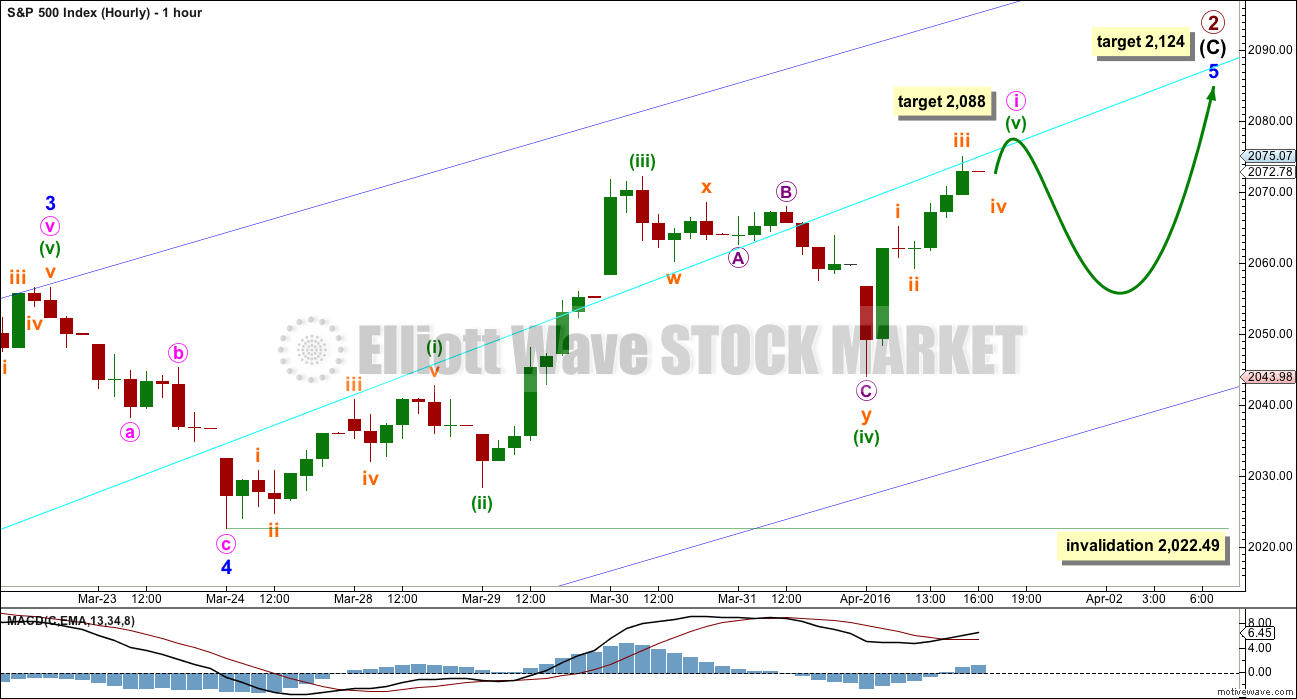
Friday’s session began with a whipsaw lower to move minuette wave (iv) close to the price territory of minuette wave (i). The invalidation point held, the wave count remains valid, and now a clear looking five up on the hourly chart has developed.
Within minuette wave (v), the structure does not look complete on the hourly or five minute charts. More upwards movement may be expected to complete it. At 2,088 minuette wave (v) would reach equality in length with minuette wave (iii).
A correction downwards for minute wave ii should unfold when minute wave i is complete.
Within minuette wave (v), a small fourth wave correction for subminuette wave iv should take an hour to three, before more upwards movement. Subminuette wave iv in the very short term may not move into subminuette wave i price territory below 2,065.13.
A new low below 2,065.13 could not be subminuette wave iv within the final wave of minuette wave (v), so a new low below 2,065.13 would be price indication that minute wave i in its entirety is very likely to be over and the correction for minute wave ii should be underway.
Minute wave ii should show up on the daily chart as one to three red candlesticks or doji. It may not move beyond the start of minute wave i below 2,022.49.
ALTERNATE WEEKLY CHART
Click chart to enlarge.
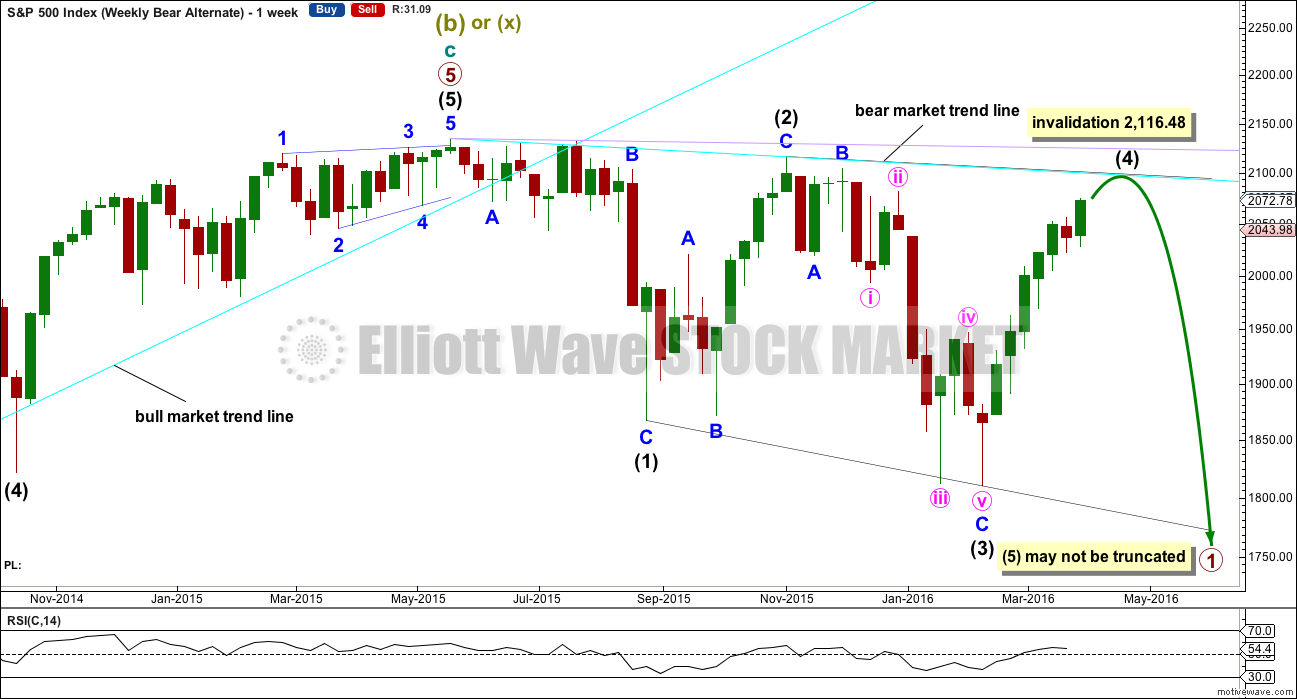
Primary wave 1 may subdivide as one of two possible structures. The main bear count sees it as a complete impulse. This alternate sees it as an incomplete leading diagonal.
The diagonal must be expanding because intermediate wave (3) is longer than intermediate wave (1). Leading expanding diagonals are not common structures, so that reduces the probability of this wave count to an alternate.
Intermediate wave (4) must continue higher and may find resistance at the cyan bear market trend line. Intermediate wave (4) may not move above the end of intermediate wave (2) at 2,116.48.
ALTERNATE DAILY CHART
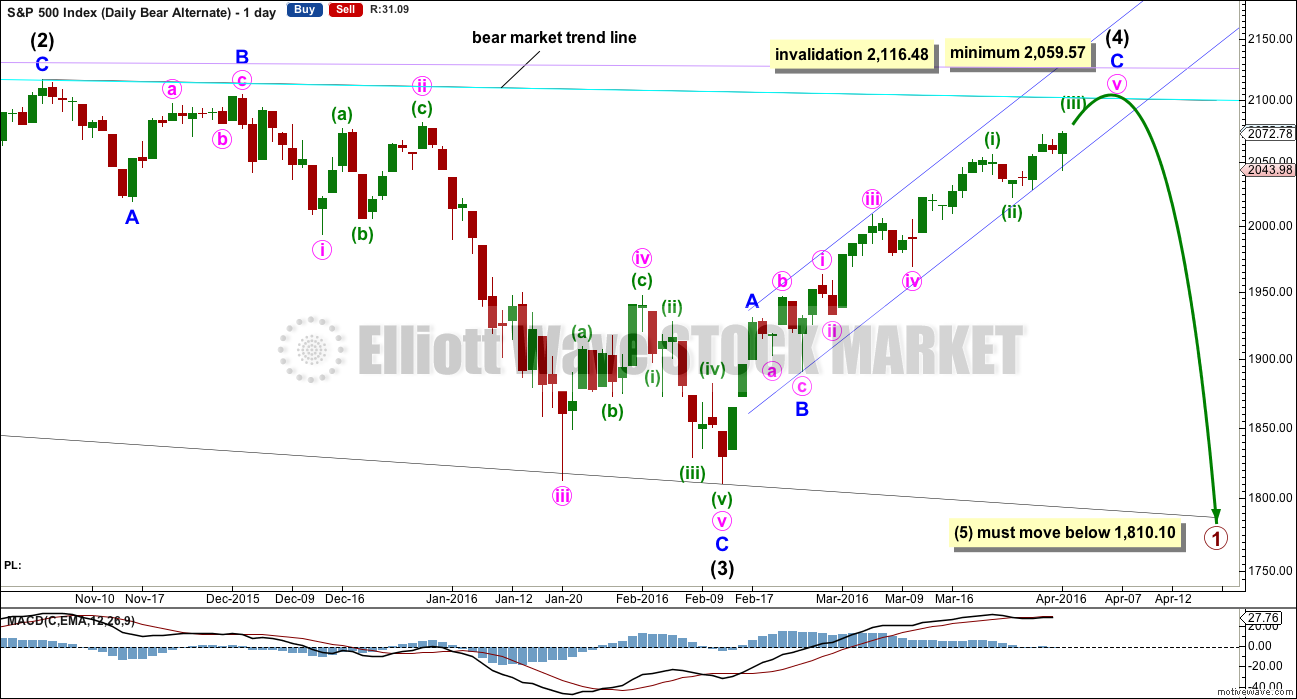
Click chart to enlarge.
Within a leading diagonal, subwaves 2 and 4 must subdivide as zigzags. Subwaves 1, 3 and 5 are most commonly zigzags but may also sometimes appear to be impulses.
Intermediate wave (3) down fits best as a zigzag.
In a diagonal the fourth wave must overlap first wave price territory. The rule for the end of a fourth wave is it may not move beyond the end of the second wave.
Expanding diagonals are not very common. Leading expanding diagonals are less common.
Intermediate wave (4) must be longer than intermediate wave (2), so it must end above 2,059.57. If this minimum is not met, this wave count would be invalid. The trend lines must diverge.
Leading diagonals may not have truncated fifth waves. Intermediate wave (5) would most likely be a zigzag, must end below 1,810.10, and must be longer in length than intermediate wave (3) which was 306.38 points.
BULL ELLIOTT WAVE COUNT
WEEKLY CHART
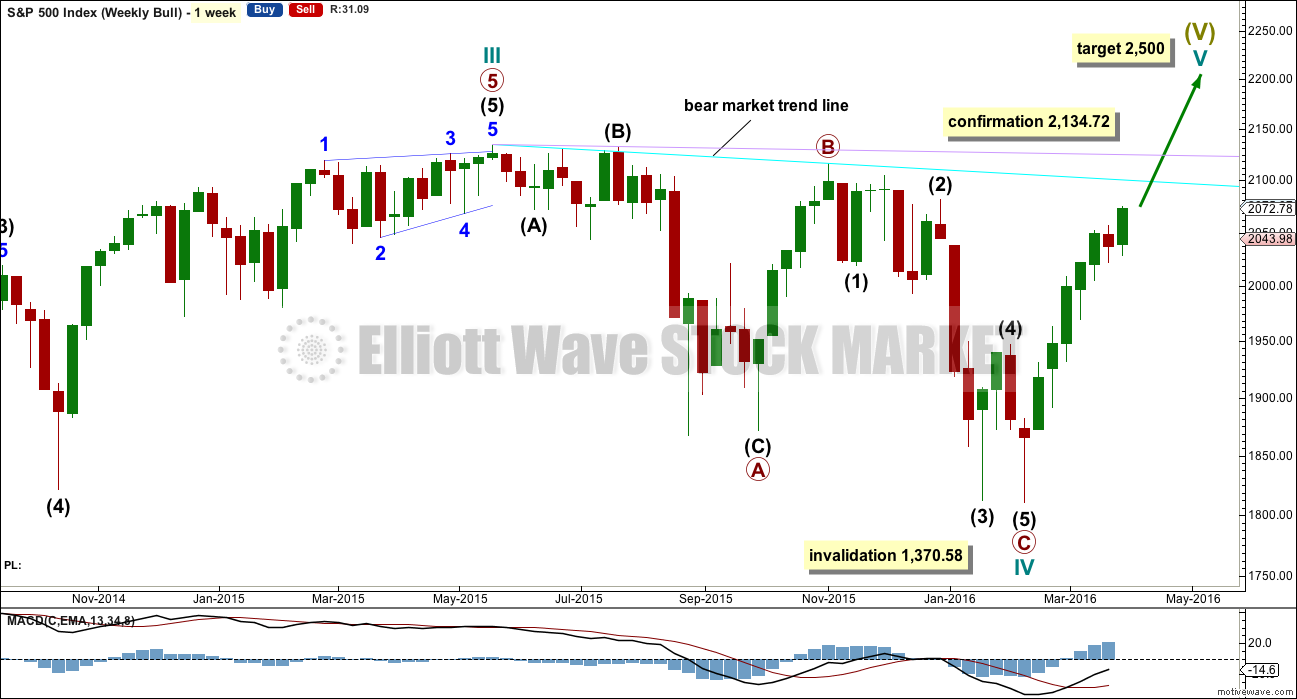
Click chart to enlarge.
Cycle wave II was a shallow 0.41 zigzag lasting three months. Cycle wave IV may be a complete shallow 0.19 regular flat correction, exhibiting some alternation with cycle wave II.
At 2,500 cycle wave V would reach equality in length with cycle wave I.
Price remains below the final bear market trend line. This line is drawn from the all time high at 2,134.72 to the swing high labelled primary wave B at 2,116.48 on November 2015. This line is drawn using the approach outlined by Magee in the classic “Technical Analysis of Stock Trends”. To use it correctly we should assume that a bear market remains intact until this line is breached by a close of 3% or more of market value. In practice, that price point would be a new all time high which would invalidate any bear wave count.
This wave count requires price confirmation with a new all time high above 2,134.72.
While price has not made a new high, while it remains below the final bear market trend line and while technical indicators point to weakness in upwards movement, this very bullish wave count comes with a strong caveat. I do not have confidence in it.
DAILY CHART
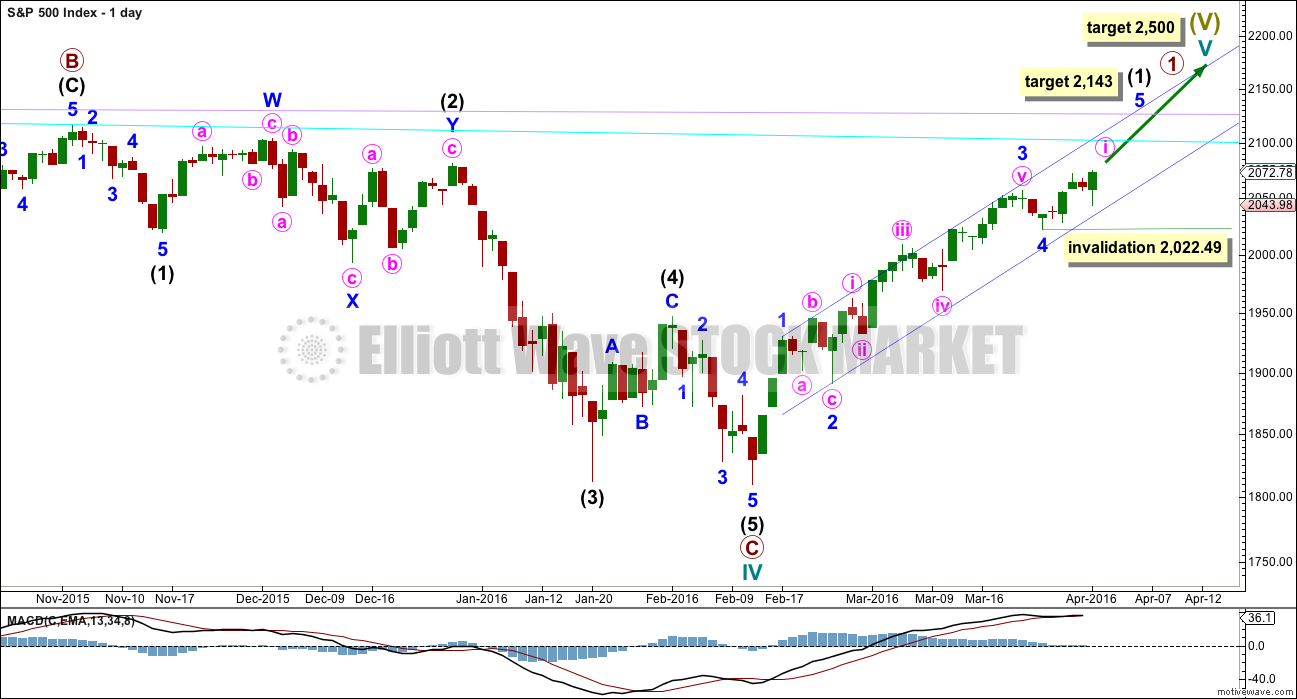
Click chart to enlarge.
Upwards movement cannot now be a fourth wave correction for intermediate wave (4) as price is now back up in intermediate wave (1) territory above 2,019.39. This has provided some clarity.
For the bullish wave count, it means that primary wave C must be over as a complete five wave impulse.
Intermediate wave (2) is seen as an atypical double zigzag. It is atypical in that it moves sideways. Double zigzags should have a clear slope against the prior trend to have the right look. Within a double zigzag, the second zigzag exists to deepen the correction when the first zigzag does not move price deep enough. Not only does this second zigzag not deepen the correction, it fails to move at all beyond the end of the first zigzag. This structure technically meets rules, but it looks completely wrong. This gives the wave count a low probability.
If the bull market has resumed, it must begin with a five wave structure upwards at the daily and weekly chart level. So far that is incomplete.
Downwards movement may not be a lower degree correction within minute wave v because it is in price territory of the first wave within minute wave v. This downwards movement must be minor wave 4. At 2,143 minor wave 5 would reach equality in length with minor wave 1.
Within minor wave 5, no second wave correction may move beyond the start of its first wave below 2,022.49.
TECHNICAL ANALYSIS
DAILY CHART
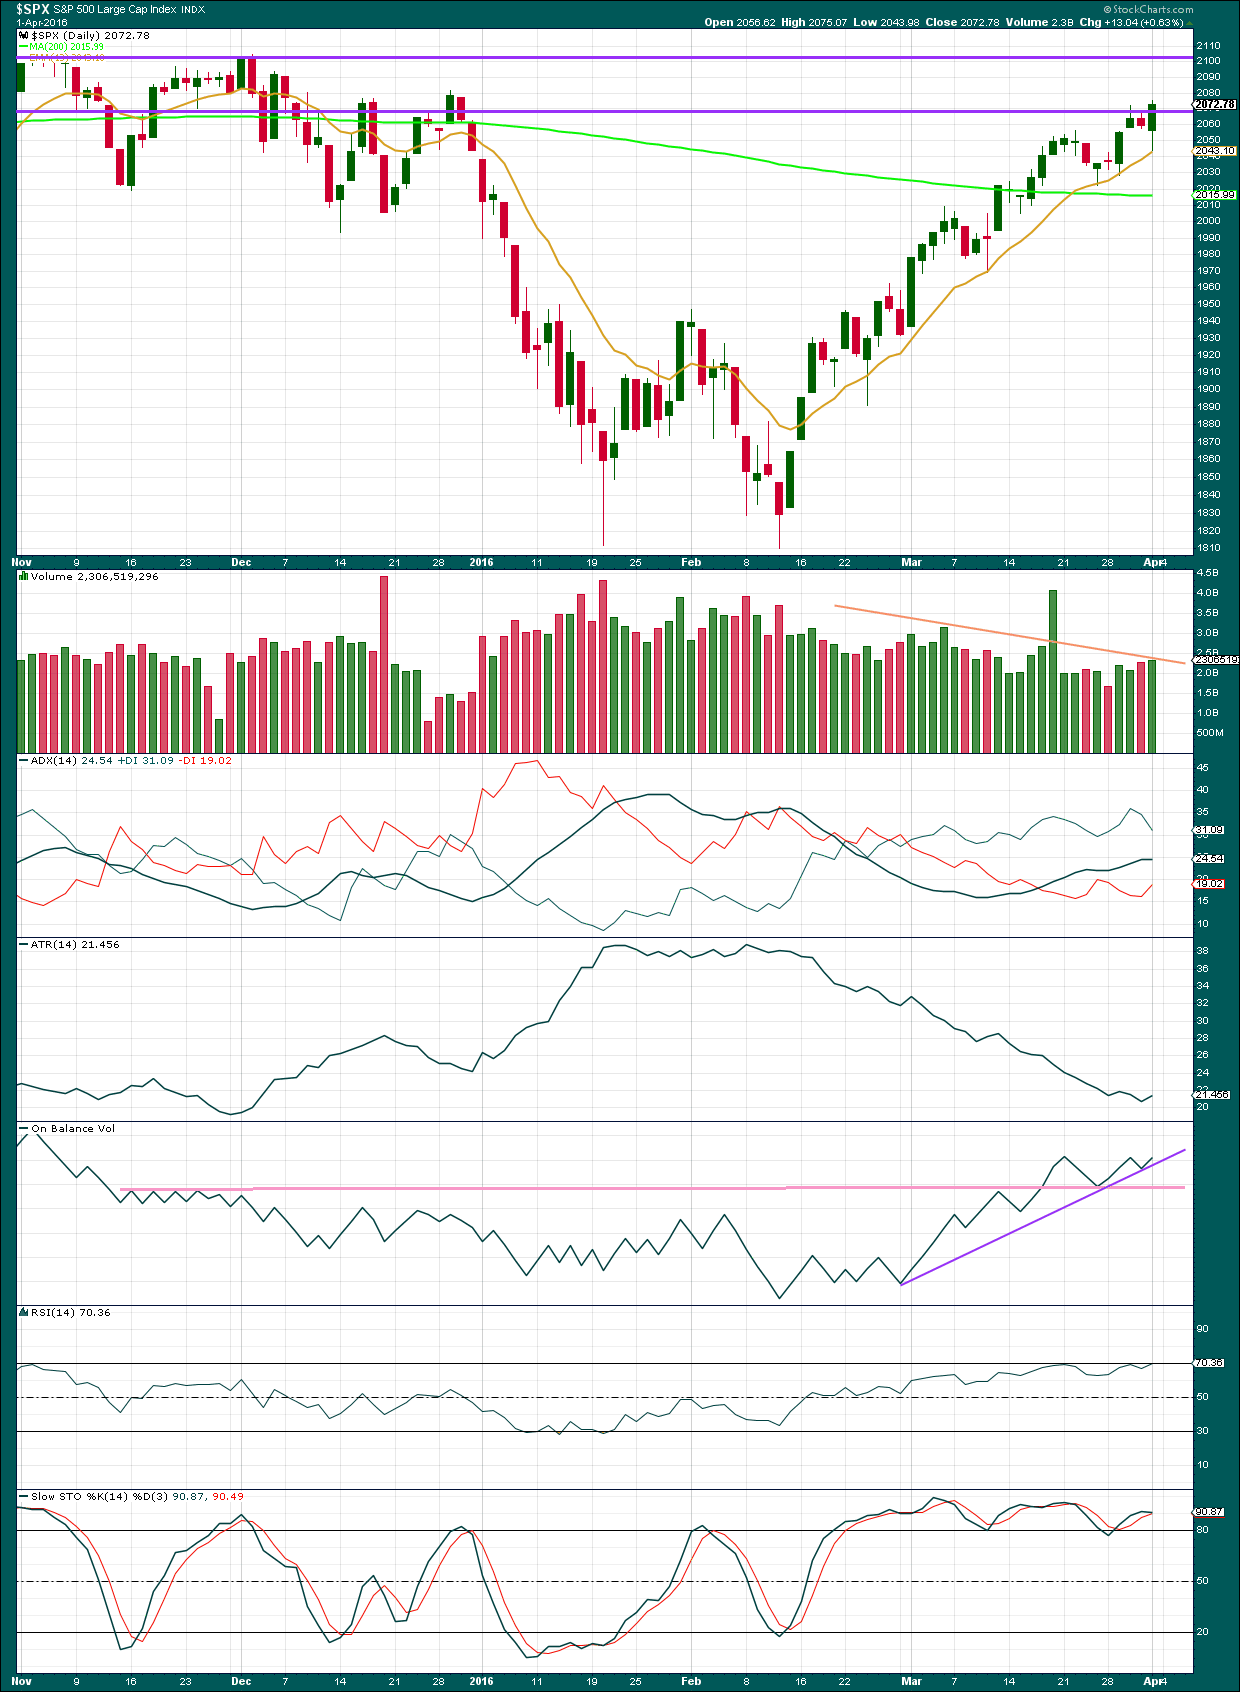
Click chart to enlarge. Chart courtesy of StockCharts.com.
Volume data on StockCharts is different to that given from NYSE, the home of this index. Comments on volume will be based on NYSE volume data when it differs from StockCharts.
Price is clearly trending upwards making higher highs and higher lows, moving upwards for 34 days. ADX is increasing indicating the market is trending upwards.
ATR still disagrees though. There is something wrong with this trend. Normally during a trend ATR increases. ATR declines in a consolidating market.
The exponential moving average is changed from 9 to 13 days. This is more clearly showing where downwards corrections are finding support along the way up, with only one exception.
On Balance Volume has found support at the purple line. This line has been tested twice now but is still not very technically significant. More confidence may be had in this upwards trend while OBV remains above the purple and pink lines.
RSI is exhibiting weak divergence with price: as price made a new high on Friday, RSI failed to also make a corresponding high. This indicates weakness in price, but it does not say a trend change must happen here.
Stochastics also continues to exhibit bearish divergence with price. This trend is weak.
The persistent and clear weakness in this upwards trend across several indicators strongly supports the main bearish Elliott wave count. This trend looks more like a bear market rally than a normal bull market.
INVERTED VIX DAILY CHART
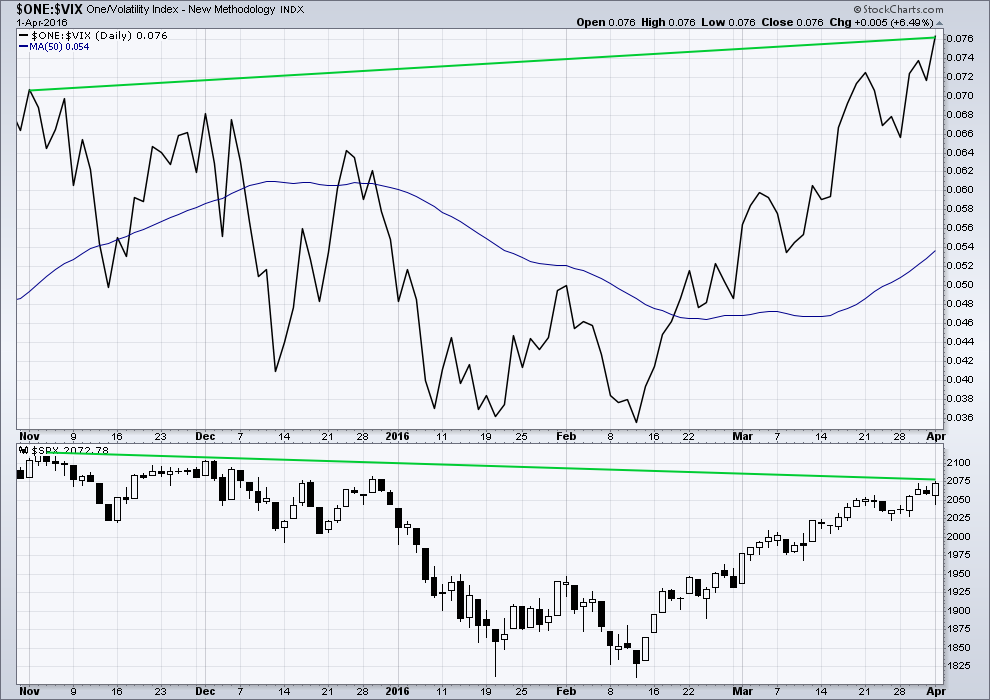
Click chart to enlarge. Chart courtesy of StockCharts.com.
Volatility declines as inverted VIX climbs. This is normal for an upwards trend.
What is not normal here is the divergence over a reasonable time period between price and inverted VIX. The decline in volatility is not translating to a corresponding increase in price. Price is weak. This divergence is bearish.
BULLISH PERCENT DAILY CHART
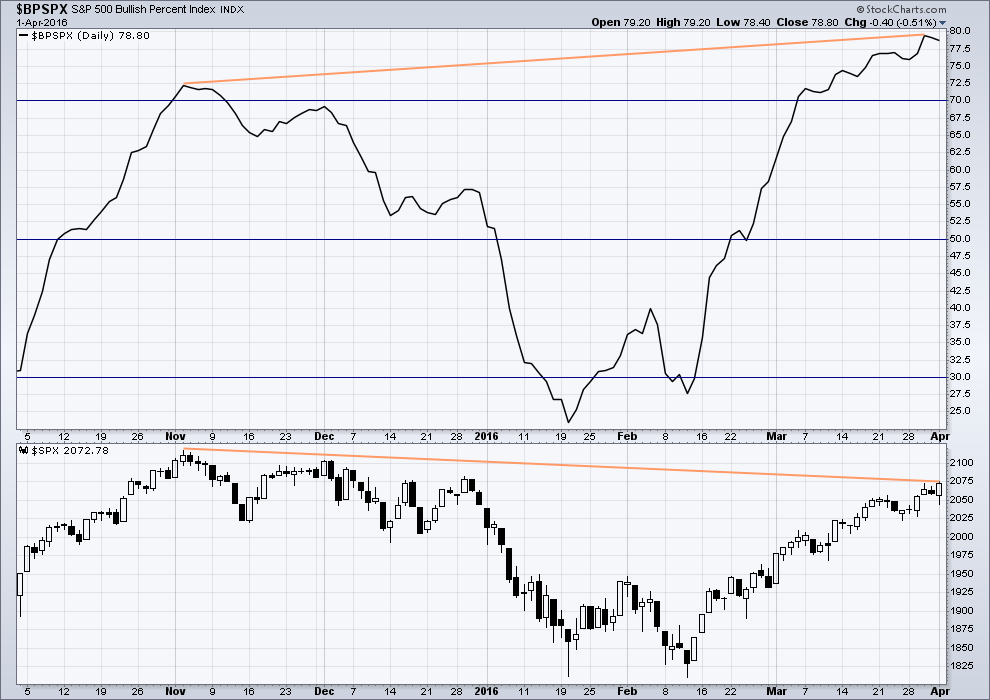
Click chart to enlarge. Chart courtesy of StockCharts.com.
There is strong hidden bearish divergence between price and the Bullish Percent Index. The increase in the percentage of bullish traders is more substantial than the last high in price. As bullish percent increases, it is not translating to a corresponding rise in price. Price is weak.
This looks like an overabundance of optimism which is not supported by price.
The percentage of bullish traders declined as price made new highs on Friday. This indicates short term weakness in price, and this may support the Elliott wave count short term which expects a second wave correction to begin shortly.
ADVANCE DECLINE LINE
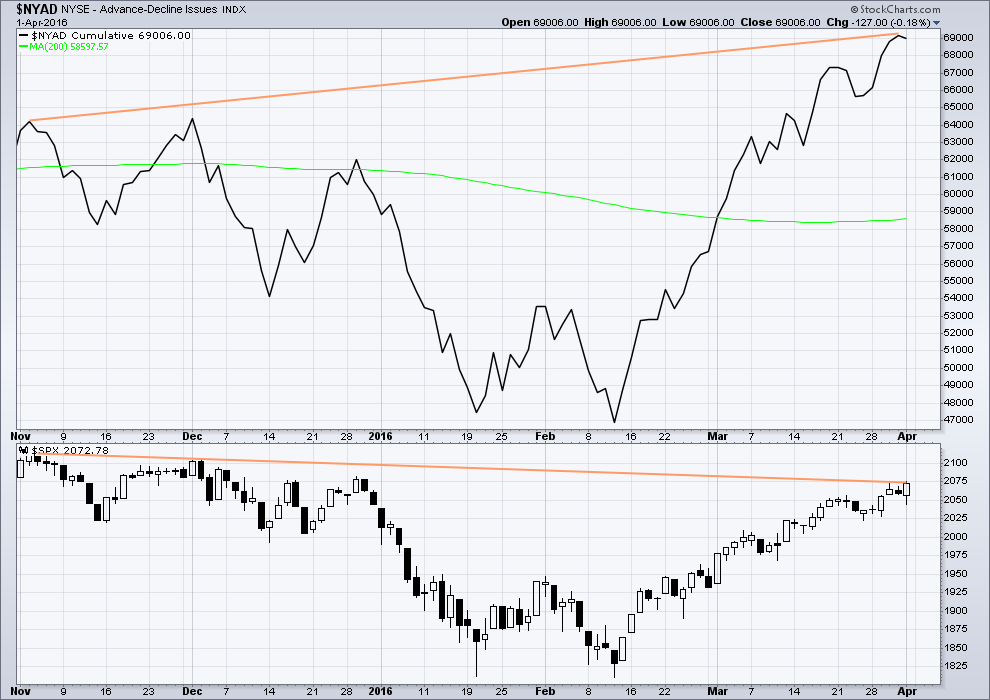
Click chart to enlarge. Chart courtesy of StockCharts.com.
With the AD line increasing, this indicates the number of advancing stocks exceeds the number of declining stocks. This indicates that there is breadth to this upwards movement.
This breadth was not seen on Friday though. The AD line declined while price made new highs, so this new high was not supported by breadth.
From November 2015 to now, the AD line is making new highs while price has so far failed to make a corresponding new high. This indicates weakness in price; the increase in market breadth is unable to be translated to increase in price.
It remains to be seen if price can make new highs beyond the prior highs of 3rd November, 2015. If price can manage to do that, then this hidden bearish divergence will no longer be correct, but the fact that it is so strong at this stage is significant. The AD line will be watched daily to see if this bearish divergence continues or disappears.
The 200 day moving average for the AD line is now increasing. This alone is not enough to indicate a new bull market. During November 2015 the 200 day MA for the AD line turned upwards and yet price still made subsequent new lows.
DOW THEORY
I am choosing to use the S&P500, Dow Industrials, Dow Transportation, Nasdaq and the Russell 2000 index. Major swing lows are noted below. So far the Industrials, Transportation and Russell 2000 have made new major swing lows. None of these indices have made new highs.
I am aware that this approach is extremely conservative. Original Dow Theory has already confirmed a major trend change as both the industrials and transportation indexes have made new major lows.
At this stage, if the S&P500 and Nasdaq also make new major swing lows, then my modified Dow Theory would confirm a major new bear market. At that stage, my only wave count would be the bear wave count.
The lows below are from October 2014. These lows were the last secondary correction within the primary trend which was the bull market from 2009.
These lows must be breached by a daily close below each point.
S&P500: 1,821.61
Nasdaq: 4,117.84
DJIA: 15,855.12 – close below on 25th August 2015.
DJT: 7,700.49 – close below on 24th August 2015.
Russell 2000: 1,343.51 – close below on 25th August 2015.
This analysis is published @ 10:23 p.m. EST.
The last wave up will subdivide as a five on the five minute chart. With a strong extended first wave.
So far this downwards movement fits nicely as a double zigzag on the five minute chart.
And so I was expecting minuette (v) to have a five wave look to it on the hourly chart, but it’s not going to do that. Hasn’t done that.
Minute ii is underway.
Now I see a lot of comment about a high being in place. And this could be so. But from an EW POV intermediate (C) would be truncated by 41.41. That is just huge. Possible, but extremely unlikely.
A truncation of less than 10 points I could accept. A truncation just over 40 points I just can’t accept.
And so I know everything is extreme, overbought, overhyped, this goose is overcooked… but I’m still expecting more upwards movement for this to have the right look.
That view would be proven wrong with a new low below 2,022.49. And considering the size of the next decline if it is primary 3, this is a very close by price point.
I heartily agree! 🙂
and we certainly dont like our goose overcooked… https://www.youtube.com/watch?v=qTwXudZTWQA
actually,, that is what will happen to this overcooked market
I’ll have mine extra crispy if that’s allright…! 🙂
Brilliant. Cheers for the laugh Doc.
One of the best scenes of one of the best movies ever made, imo.
I got a SPY spike in my data feed (@ 207.50) just at the close so it looks like we go higher tomorrow. Rather than chase it higher, I am entering stink bids to buy next week’s expiration 207.5 puts for a .75 or less, currently trading at 2.30/2.35. ‘Nite all!
On the 1 and 5 minute charts it is getting messy (difficult to count) as we get towards the close. So I revert back to the hourly count. The hourly count now has 2 completed waves down from the high of 2075 and a 3rd wave unfolding.
It seems like the bulls are losing control and the bears are starting to assert themselves.
I think we have at least one more move up. This does not have the look of the start of a major wave down. Any kind of managed decline, considering the degree down we are expecting, in my view will have to be viewed as corrective. Primary three down will not be tentative when it arrives…UVXY will tell us tomorrow I trust…
New low under 2063.01 would be clearly five down; very sloppy, but nonetheless an impulse…
There it goes. I am looking for a down move to 2060 – 2057. Then a bounce (4th wave) up to about 2070. There I will take more positions. That is my plan anyways. But those don’t always work out!
There appears to be alot of 3 wave structures from the 2022 low – will Minor 5 morph into an ending diagonal?
Price seems reluctant to move higher or lower atm.
That ending diagonal is looking like a possibility….I agree about the three- wave looks…
I can’t yet see a 5 down from the 2075 high – best I can count is nested 1,2s??
Price has now broken below the Minor 2/4 trendline on the 5 min chart, albeit it did that a couple of times before and just jumped right back in.
Is still within the base channel from the high so I’m not too impressed yet.
I don’t know why I was think that we exceeded Friday’s high today. I just noticed that we did not so we could indeed have had a completed five up. Dazed and confused! 😀
It is remarkable that UVXY has still not given its upside trigger with a second green close after making a new 52 week low since they started on March 16. If the next leg down has started it will close green today and really should do so tomorrow as well.
Nice ambush by the MMs! 🙂
They took it right down to my stop price and now back up to .45 on the reversal.
One of the good reasons for using mental stops.
Very close to being stopped out with calls falling to 0.42
Let’s see what she does…could be single zig-zag just completed….
Stopped out at 0.40….no worries…very small speculative position…
I was looking for one more wave up. But this move down from 2075 is looking impulsive. We may not get another high.
I am looking for the point to enter my first short position. Probably 25% of full position.
I’ve entered my first short position. Only about 14% of final / full position.
We have been seeing these kind of sharp moves in corrective waves lately. It still looks corrective to me, but you could be right. What should be the third wave down on the second 1-2 count does not look like it really means business to me (also on one minute chart)….
That is why I have only taken a small position. Lets see how far up we move from 2063.
No matter what though, the count needs to be adjusted.
I agree – the final wave up looks like a 3 but it could also be counted as a 5 imho on 1 min chart (extended 1st, and very small sideways 4th wave) – so don’t think any of the counts will change (yet) when zooming out on the bigger picture.
I think we are probably in minute (ii) now – 2022 level is obv key here.
If the current hourly bear count is correct, 2065.13 must not be breached. If it is breached the counts must be adjusted.
And there it goes. It is breached.
We now have a possible 1-2, 1-2 down from the high of 2075.07.
Using the 1 minute chart.
Lowering cost basis to .55 per contract. Stop at .40…
Double Zig-Zag underway? Needs to move a bit below 2065.46 to confirm…
or ending diagonal?
Here’s an alternate wave count for SPX hourly.
Based on the extreme sentiment conditions, and the UVXY action, I have a difficult time seeing much more upside, although I was thinking we would get at least one more pop to complete the current impulse up. We will see…if we have an ending diagonal the reversal should be quite brutal and retrace to the diagonal’s start in very short order….
Buying this week’s expiration 207.5 calls at market price of 0.60. STC order for 1.00 on quick upside wave five pop. Target should be hit at around 2080.00
The sentiment extreme continues. I have never ever seen UVXY make six new fifty week lows in a time frame as it has recently, absent new 52 week highs in the markets. I am really wondering if we could be at the threshhold of an impulse higher yet to be completed. Of course in many ways we are in uncharted waters in the markets, so truth may be stranger than fiction so far as price action is concerned.
Not looking at all like an impulse up so sub-min four must be continuing…move still looking corrective.
Sub-min four of minute one looks to be continuing as yet another triangle formation. I expect we will see the predictable thrust to the upside towards target of 2088 to complete minuette five of minute one followed by a quick reversal for minute two of minor five according to Lara’s main count. Will try to buy minute two pullback at stop-buy price of SPX 2050 for final move up with conservative exit at 2075.00 This week’s SPY 206 calls sport a delta of .56 so a move down to round number support at around 2050 should make calls available for about 0.75 per contract. The target of SPX 2088 should be an easy double with good risk to reward ratio. Looks like sub-min four morphed into an expanded flat (B looks a bit short so could be a zig-zag)with C just completed. If so we should start a move higher just about now…
Vern,
Interesting anomaly VIX up over 8%, TVIX and UVXY are just around 1%. Do you know why?
VIX measures expected volatility thirty days out, so folk apparently a bit cautious about the immediate term. They are are also absolutely bullish on the medium and long term action in the market, convinced that sugar daddy FED will arrest any significant market decline that develops. UVXY signalling elevated market complacency about any long term market decline. TViX as an ETN of VIX itself (as opposed to VIX futures like UVXY) should more closely mirror VIX and I am not sure why it often does not. I tend to avoid it for that reason.
The TVIX anomaly can be particularly aggravating as it is supposed to be 2X the DAILY VIX action so excuses about fees and/or slippage make no sense whatsoever. It is a flawed derivative IMO.
Folks here is little bit of info on negative rates…while we wait and wait.. complete article http://www.24hgold.com/english/news-gold-silver-financial-wonderland-reader-questions-on-negative-rates-and-money-heaven.aspx?contributor=Mish&article=8214877534H11690&redirect=False
Here are some Q&As.
Questions on negative rates keep coming in: Where does the money go? Who benefits? Will the Fed do the same? What’s Draghi up to?
A quick refresher course on paying interest on excess reserves vs. charging interest on excess reserves is in order.
Q: Who has negative rates?
A: The European Central Bank (ECB), Sveriges Riksbank in Sweden, the Swiss National Bank (SNB), the Bank of Japan (BoJ), and Denmark’s Danmarks Nationalbank (DN) all have negative rates.
Q: Negative rates on what?
A: The above five countries have negative rates on “excess reserves”. Switzerland also has negative rates on deposits. Most banks are reluctant to put negative rates on deposits fearing banks runs and currency hoarding.
Q: How much are we talking about?
A: Bloomberg Quick Take notes “more than $7 trillion of government bonds worldwide offer yields below zero.”
Q: How do excess reserves come into play?
A: Central banks create them through monetary actions like repos and QE hoping to get credit flowing.
Think of it this way: money is printed into existence even though there are no creditworthy borrowers who want loans.
The irony is banks cannot lend excess reserves. Money lent by one bank will simply appear as excess reserves when the money is deposited elsewhere. Mathematically, someone has to hold every cent of money created by central banks.
Q: Who collects the money?
A: If the central bank charges money on excess reserves, the central bank collects the money. In general, bondholders pay money to hold bonds with negative rates. Borrowers get paid to borrow. Yes, this is absurd.
Q: Who benefits from low and negative rates?
A: Asset holders benefit from cheap money, at least initially. Asset prices went through the roof when ECB president Mario Draghi issued his famous “Whatever it Takes” speech on July 26, 2012. Various rounds of QE by the Fed also sent the stock market higher. The obvious consequence is easy to explain: asset bubbles break, leaving banks and borrowers in worse shape.
Q: Is there a limit to negative rates and resultant bubbles?
A: There is always a limit. Everyone is guessing where it is. At some point the greater fools run out or the consequences are such that policies are abandoned. It’s possible we hit the limit today (March 10, 2016), given the strong reversal following ECB announcements by Draghi, initially interpreted to be a huge bazooka. As it appears now, the bazooka backfired. See Draghi’s “Shock and Awe” campaign morphs into “Shock and Aw Shucks” for further discussion.
Q: Why doesn’t the Fed resort to negative rates?
A: Given negative rates have proven to be of negative benefit, why would the Fed want to? However, central banks don’t see in those terms. Here are a couple of reasons I presume the Fed does understand:
1.Negative rates hurt bank profits.
2.The Fed pays interest on excess deposits. This is a back-door, free-money handout to banks that everyone ought to be protesting. Over time, the the Fed has bailed out the banks in numerous ways.
3.The US has numerous money market funds that would immediately be destroyed if the Fed implemented negative rates.
Money market funds are not in vogue in Eurozone as they are here. Banks can always raise other fees to mask negative deposit rates. Money market funds cannot do the same.
Q: If negative rates hurt bank profits, why has Europe and Japan embraced them?
A: I suspect Draghi believes asset bubbles and equity support will do more for the Eurozone than lost bank profits. Given the collapse of economic bubbles is very damaging, Draghi is very wrong.
Never underestimate the propensity for central bank stupidity.
The bankster insanity continues and compounds. Their experimentation with negative interest rates is going to blow up in their faces as soon as we begin to see defaults in corporate bonds. Amazingly enough, the bad paper resulting from the implosion of the fracking credit mania has yet to be priced into the market. As soon as they are forced to acknowledge and write down those losses there will be a trigger effect as they are forced to unload “safer” assets to cover the significant shortfalls that result. Patience in this screwed up market is the key. Tick…tick…tick.. tick…
During the financial crisis, the FED injected tens of billions to avoid money market funds “breaking the buck” and so destroying trillions in pension fund value. Frau Yellen betrayed the level of her confusion and delusion by talking about looking into the “possiblilty” of negative interest rates here in the US. You are absolutely right that the implications are far more disruptive for US markets if NIRP is adopted. Frankly I think the FED would face a flurry of lawsuits if they tried it. In a year from now we are not going to believe that US markets were trading so close to all-time highs in April. I am expecting some kind of massive news event to usher in the the next stage of the decline and I do not think this time it will be “managed.”
Vern,
I am under the impression that majority if senior administration officials including the president are required to put their assets into US Government Bonds or some such similar instrument. So their skin in the game with respect to living through the negative impacts of theoretical policy experimentation are next to nothing. It is the average citizen who is relying on them to make the right decision and hoping that his investments and retirement is safe.
I personally think the current administration will be remembered for letting an opportunity to fix the financial institution in US slip with minimal action. This kind of explains their focus on foreign policy to keep population distracted. This will impact the future generations profoundly.
This is the trump card of the criminals in Washington – the 17 trillion or so sitting in private pension funds. There is a Harvard economist (her name escapes me) who has already floated a paper touting the expediency of forcibly converting these assets into Treasuries. The attempt should reveal just how brain-dead the American public really is. They will of course start with Federal employees who will not have much say in the matter. The real test will come when they try to confiscate privately held accounts as well as those of State employees. The state employees are probably toast as the Union bosses are as corrupt as the Washington politicians. If there is enough of a revolt, they will probably “compromise” by grandfathering in the old accounts and mandating that at least a portion of all on-going contributions to private pension funds be earmarked for Treasuries. I am hoping to be out of the US in the next year or so. Ugghhh! 🙁
BTW, this is the “solution” Japan chose and is now completely out of any means of internally funding their gargantuan on-going national debt, now around 250% of GDP.
1st,, I bet there were some out there thinking that,,, good he wont do the first thing anymore,,
No I wasn’t thinking that at all. But I did forget to tell you that you have won a free lifetime subscription to EWSM and EW Gold! To claim your prize all you need to do is tell us all on what day will this current Primary Wave 2 will reach its top.
Really though, you got me good. For the life of me, I could not figure out what you were doing such a thing. We all owe you one now.
Can’t beat you doc. You the man.