
Upwards movement was expected but did not happen.
Downwards movement remains above the invalidation point.
Summary: This is still a bear market rally until proven otherwise. A final fifth wave up is required to complete the structure. The target is 2,124. The invalidation point for this rally is 2,134.72. A short term target for a small fifth wave is now at 2,078.
To see last published monthly charts click here.
To see how each of the bull and bear wave counts fit within a larger time frame see the Grand Supercycle Analysis.
To see detail of the bull market from 2009 to the all time high on weekly charts, click here.
New updates to this analysis are in bold.
BEAR ELLIOTT WAVE COUNT
WEEKLY CHART
Click chart to enlarge.
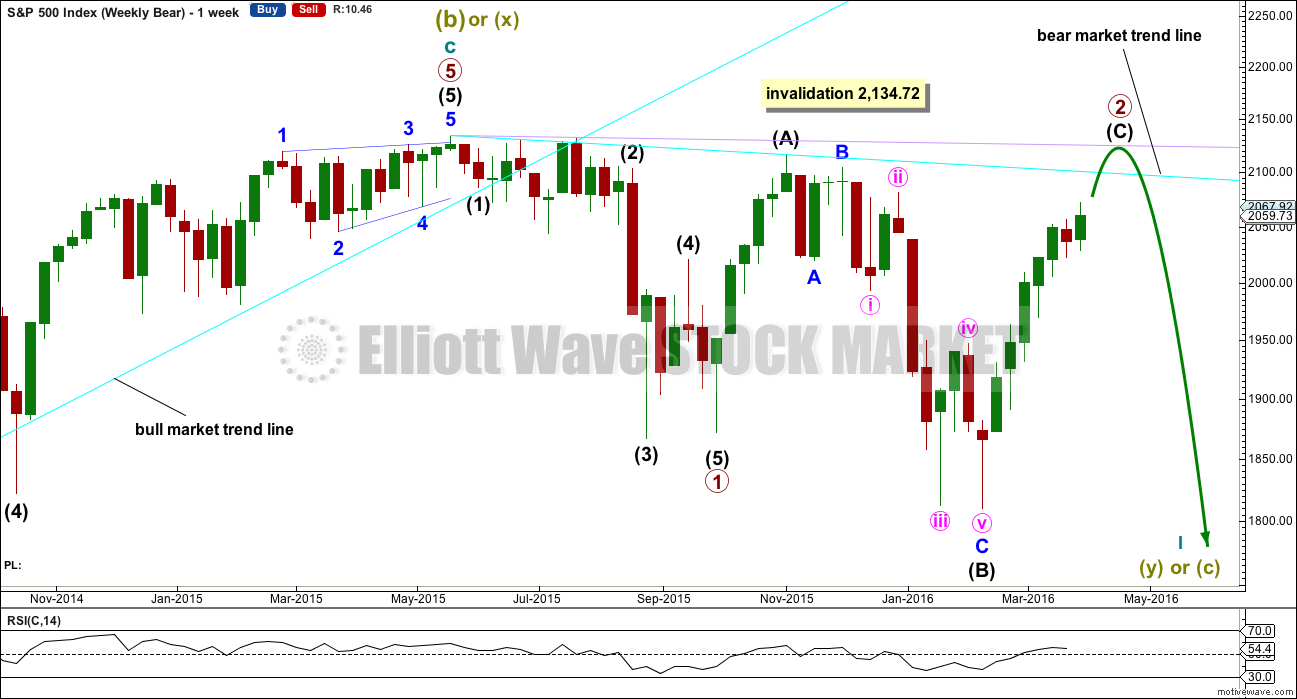
This bear wave count fits better than the bull with the even larger picture, super cycle analysis found here. It is also well supported by regular technical analysis at the monthly chart level.
Importantly, there is no lower invalidation point for this wave count. That means there is no lower limit to this bear market.
Primary wave 1 may be complete and may have lasted 19 weeks, two short of a Fibonacci 21. So far primary wave 2 is in its 25th week. It looks unlikely to continue for another 9 weeks to total a Fibonacci 34, so it may end in about two to five weeks time. This would still give reasonable proportion between primary waves 1 and 2. Corrections (particularly more time consuming flat corrections) do have a tendency to be longer lasting than impulses.
Primary wave 2 may be unfolding as an expanded or running flat. Within primary wave 2, intermediate wave (A) was a deep zigzag (which will also subdivide as a double zigzag). Intermediate wave (B) fits perfectly as a zigzag and is a 1.21 length of intermediate wave (A). This is within the normal range for a B wave of a flat of 1 to 1.38.
Intermediate wave (C) is likely to make at least a slight new high above the end of intermediate wave (A) at 2,116.48 to avoid a truncation and a very rare running flat. However, price may find very strong resistance at the final bear market trend line. This line may hold price down and it may not be able to avoid a truncation. A rare running flat may occur before a very strong third wave down.
If price moves above 2,116.48, then the new alternate bear wave count would be invalidated. At that stage, if there is no new alternate for the bear, then this would be the only bear wave count.
Primary wave 2 may not move beyond the start of primary wave 1 above 2,134.72.
DAILY CHART
Click chart to enlarge.
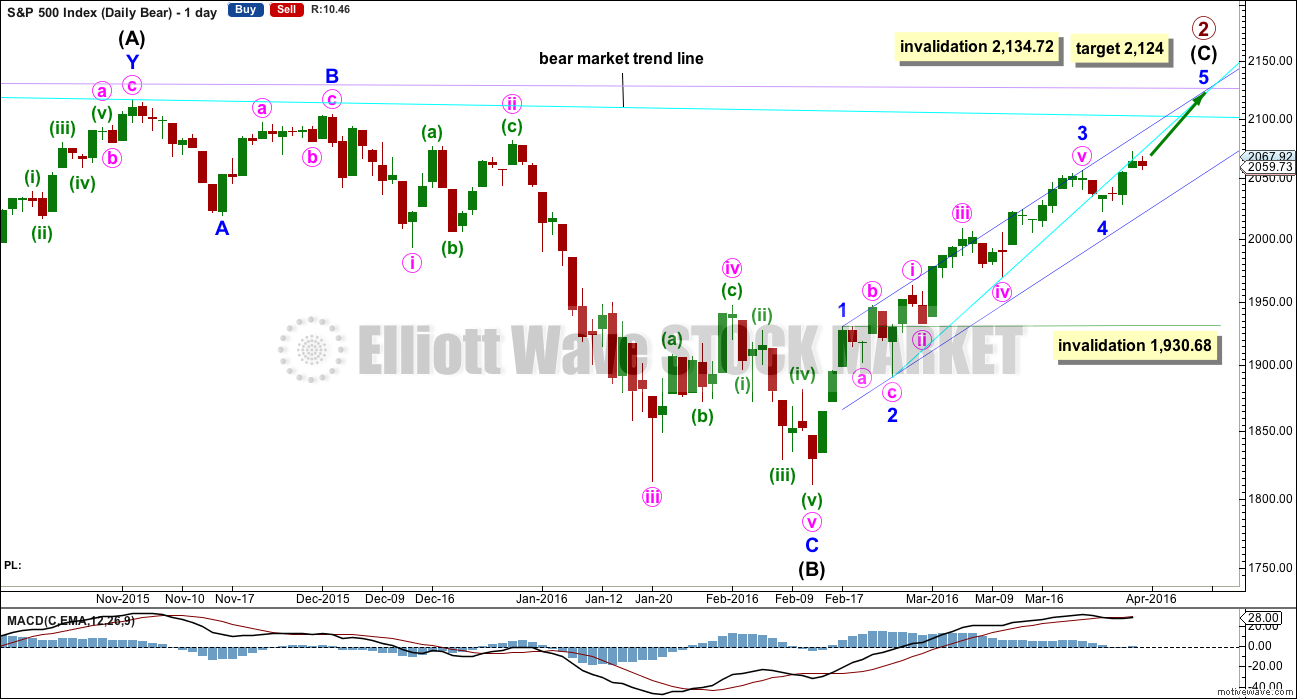
Intermediate wave (A) fits as a single or double zigzag.
Intermediate wave (B) fits perfectly as a zigzag. There is no Fibonacci ratio between minor waves A and C.
Intermediate wave (C) must subdivide as a five wave structure. It is unfolding as an impulse.
Intermediate wave (C) does not have to move above the end of intermediate wave (A) at 2,116.48, but it is likely to do so to avoid a truncation. If it is truncated and primary wave 2 is a rare running flat, then the truncation is not likely to be very large. As soon as price is very close to 2,116.48 this wave count looks at the possibility of a trend change.
The next wave down for this wave count would be a strong third wave at primary wave degree.
A bull market trend line for this rally is drawn across the first two small swing lows as per the approach outlined by Magee. This upwards sloping cyan line may provide support for corrections along the way up. Price broke below the cyan line. It may now provide resistance. The S&P has a tendency to break out of channels or below lines and then continue in the prior direction. It may do this again here.
At 2,124 minor wave 5 would reach 0.618 the length of minor wave 3. Intermediate wave (C) would avoid a truncation and the wave count would remain valid. Primary wave 2 would fulfill its purpose of convincing everyone that a new bull market is underway, and it would do that right before primary wave 3 surprises everyone.
If it continues lower, then minor wave 4 downwards may not move into minor wave 1 price territory below 1,930.68.
Within the impulse of intermediate wave (C), minor wave 2 is an expanded flat and minor wave 4 is a zigzag if it is over as labelled. These two corrections look to be nicely in proportion. It is most likely that minor wave 4 is over and minor wave 5 upwards is underway.
Minor wave 5 looks like an incomplete impulse so far on the daily and hourly chart. The small second and now fourth wave corrections within it are showing up on the daily chart clearly. If tomorrow produces a green candlestick, this structure will be clear and the invalidation point for the daily chart may then be moved up to the start of minor wave 5 at 2,022.49.
Although technically at that point the structure for intermediate wave (C) could be seen as complete, it would probably be severely truncated. This is not impossible, but the probability of it is too low to seriously consider.
HOURLY CHART
Click chart to enlarge.
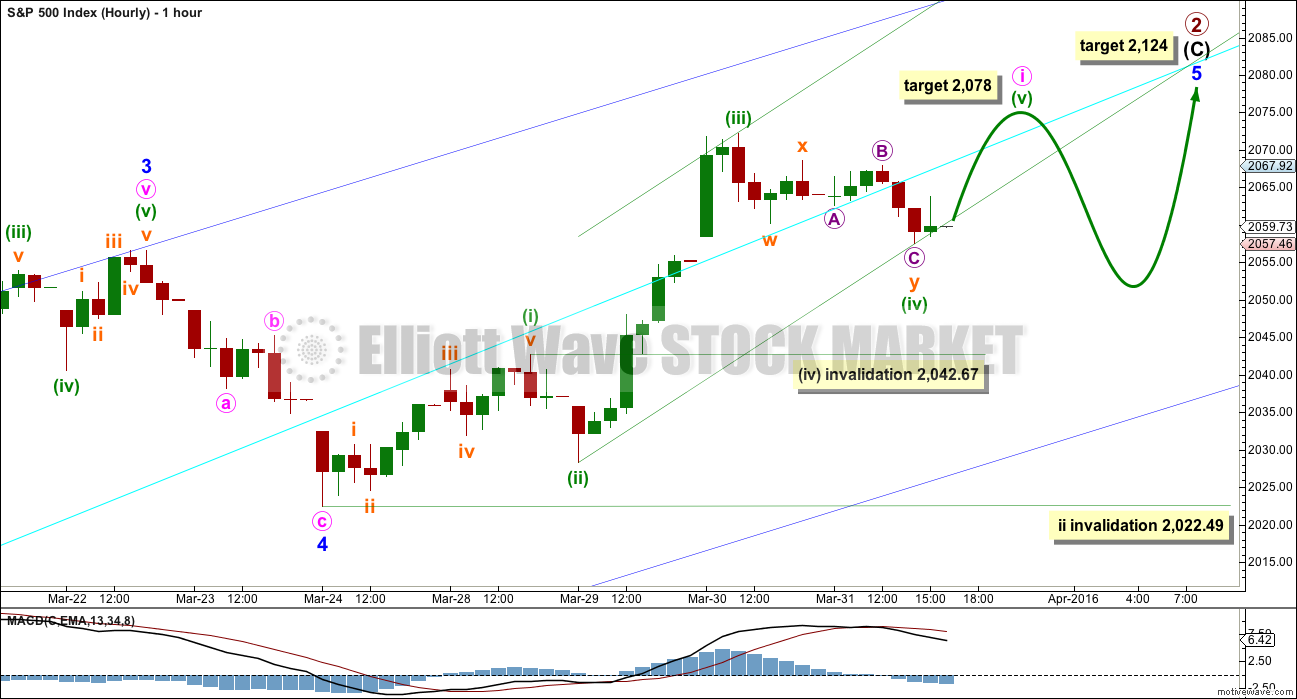
Minute wave i is an almost complete impulse. Minuette wave (iv) has moved lower as a double zigzag. The structure is complete. It is most likely that price will move upwards from here.
At 2,078 now minuette wave (v) would reach equality in length with minuette wave (i). Because there is no Fibonacci ratio between minuette waves (i) and (iii), it is more likely that minuette wave (v) will exhibit a ratio to either of (i) or (iii). Equality between the fifth and first waves of an impulse is the most common ratio.
If minuette wave (iv) continues any lower, it may not move into minuette wave (i) price territory below 2,042.67.
The structure of minute wave i may be complete as soon as price makes a new high above 2,072.21. The invalidation point is then at 2,022.49. Minute wave ii may not move below the start of minute wave i.
Minuette wave (v) may end midway within the green channel, which is drawn using Elliott’s second technique: the first trend line from the ends of the second and fourth waves and a parallel copy on the end of the third wave.
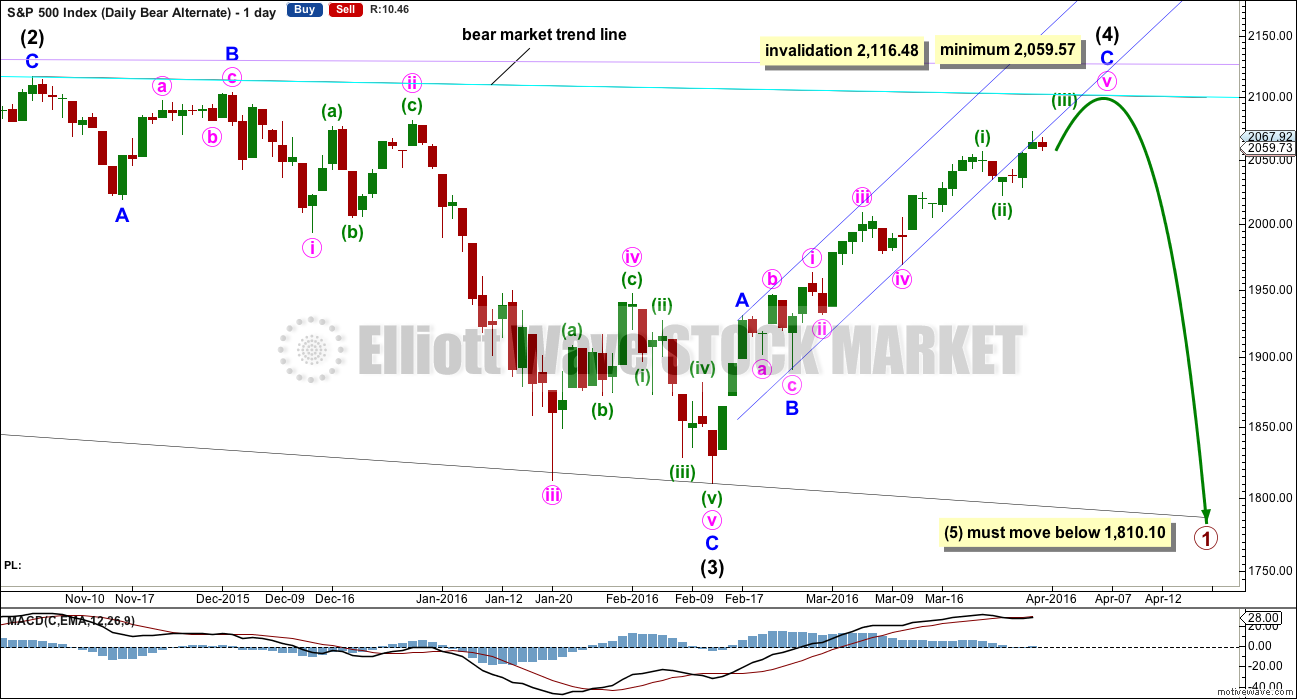
ALTERNATE WEEKLY CHART
Click chart to enlarge.
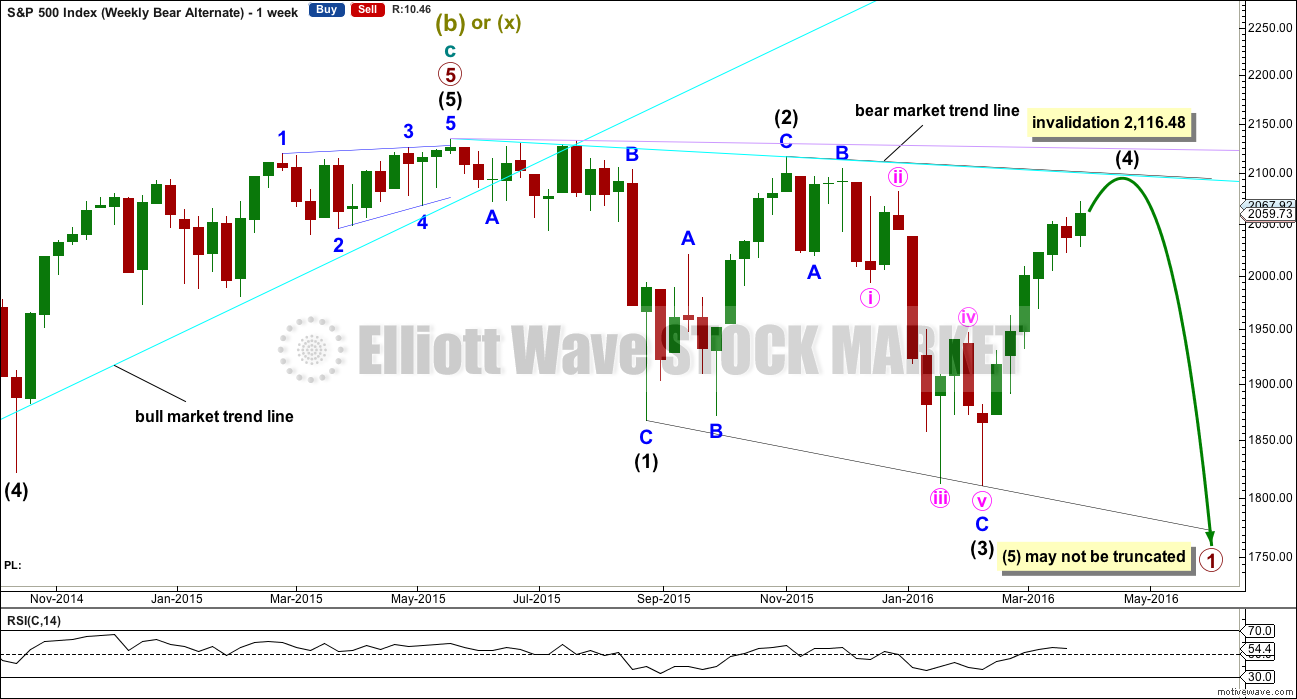
Primary wave 1 may subdivide as one of two possible structures. The main bear count sees it as a complete impulse. This alternate sees it as an incomplete leading diagonal.
The diagonal must be expanding because intermediate wave (3) is longer than intermediate wave (1). Leading expanding diagonals are not common structures, so that reduces the probability of this wave count to an alternate.
Intermediate wave (4) must continue higher and may find resistance at the cyan bear market trend line. Intermediate wave (4) may not move above the end of intermediate wave (2) at 2,116.48.
ALTERNATE DAILY CHART
Click chart to enlarge.
Within a leading diagonal, subwaves 2 and 4 must subdivide as zigzags. Subwaves 1, 3 and 5 are most commonly zigzags but may also sometimes appear to be impulses.
Intermediate wave (3) down fits best as a zigzag.
In a diagonal the fourth wave must overlap first wave price territory. The rule for the end of a fourth wave is it may not move beyond the end of the second wave.
Expanding diagonals are not very common. Leading expanding diagonals are less common.
Intermediate wave (4) must be longer than intermediate wave (2), so it must end above 2,059.57. If this minimum is not met, this wave count would be invalid. The trend lines must diverge.
Leading diagonals may not have truncated fifth waves. Intermediate wave (5) would most likely be a zigzag, must end below 1,810.10, and must be longer in length than intermediate wave (3) which was 306.38 points.
BULL ELLIOTT WAVE COUNT
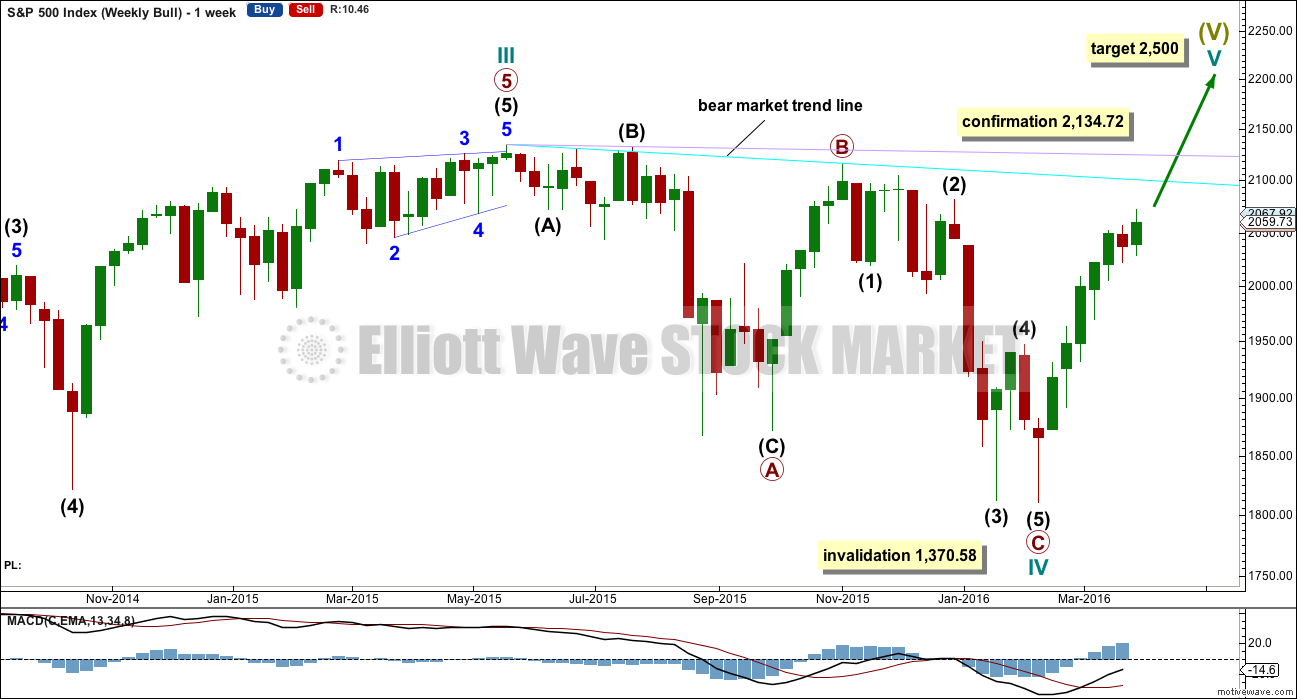
WEEKLY CHART
Click chart to enlarge.
Cycle wave II was a shallow 0.41 zigzag lasting three months. Cycle wave IV may be a complete shallow 0.19 regular flat correction, exhibiting some alternation with cycle wave II.
At 2,500 cycle wave V would reach equality in length with cycle wave I.
Price remains below the final bear market trend line. This line is drawn from the all time high at 2,134.72 to the swing high labelled primary wave B at 2,116.48 on November 2015. This line is drawn using the approach outlined by Magee in the classic “Technical Analysis of Stock Trends”. To use it correctly we should assume that a bear market remains intact until this line is breached by a close of 3% or more of market value. In practice, that price point would be a new all time high which would invalidate any bear wave count.
This wave count requires price confirmation with a new all time high above 2,134.72.
While price has not made a new high, while it remains below the final bear market trend line and while technical indicators point to weakness in upwards movement, this very bullish wave count comes with a strong caveat. I do not have confidence in it.
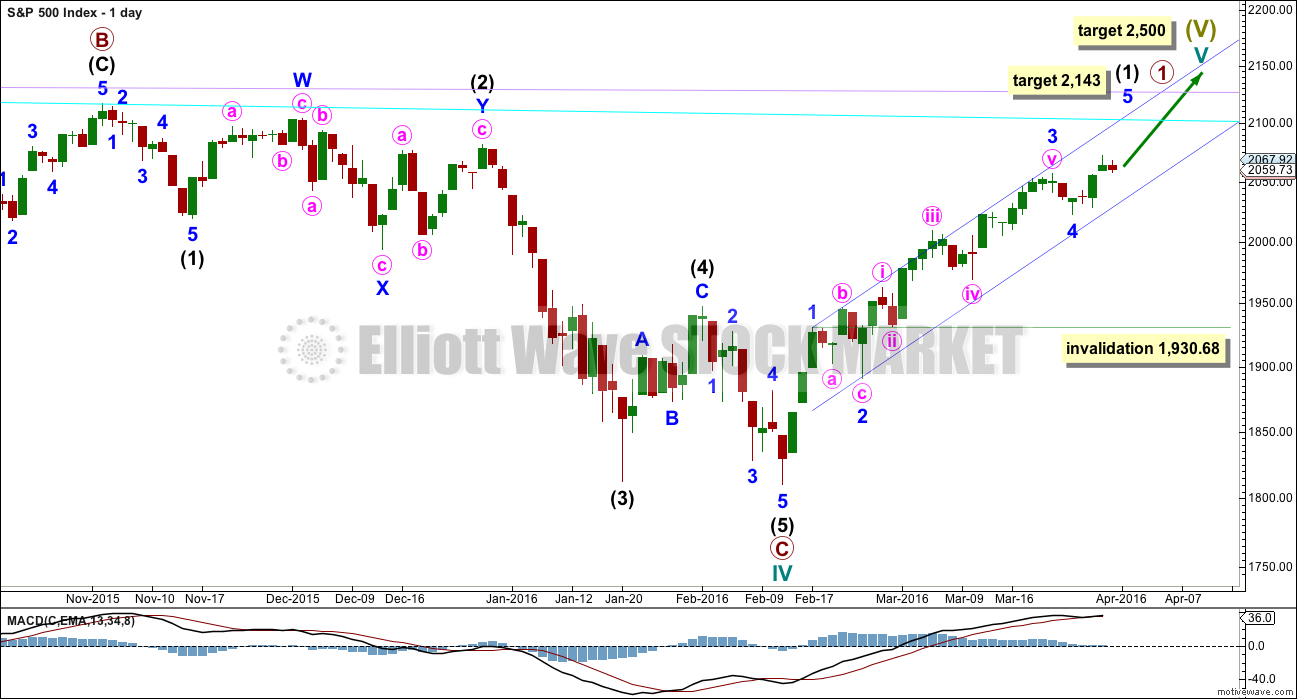
DAILY CHART
Click chart to enlarge.
Upwards movement cannot now be a fourth wave correction for intermediate wave (4) as price is now back up in intermediate wave (1) territory above 2,019.39. This has provided some clarity.
For the bullish wave count, it means that primary wave C must be over as a complete five wave impulse.
Intermediate wave (2) is seen as an atypical double zigzag. It is atypical in that it moves sideways. Double zigzags should have a clear slope against the prior trend to have the right look. Within a double zigzag, the second zigzag exists to deepen the correction when the first zigzag does not move price deep enough. Not only does this second zigzag not deepen the correction, it fails to move at all beyond the end of the first zigzag. This structure technically meets rules, but it looks completely wrong. This gives the wave count a low probability.
If the bull market has resumed, it must begin with a five wave structure upwards at the daily and weekly chart level. So far that is incomplete.
Downwards movement may not be a lower degree correction within minute wave v because it is in price territory of the first wave within minute wave v. This downwards movement must be minor wave 4. At 2,143 minor wave 5 would reach equality in length with minor wave 1.
Minor wave 4 may not move into minor wave 1 price territory below 1,930.68.
TECHNICAL ANALYSIS
DAILY CHART
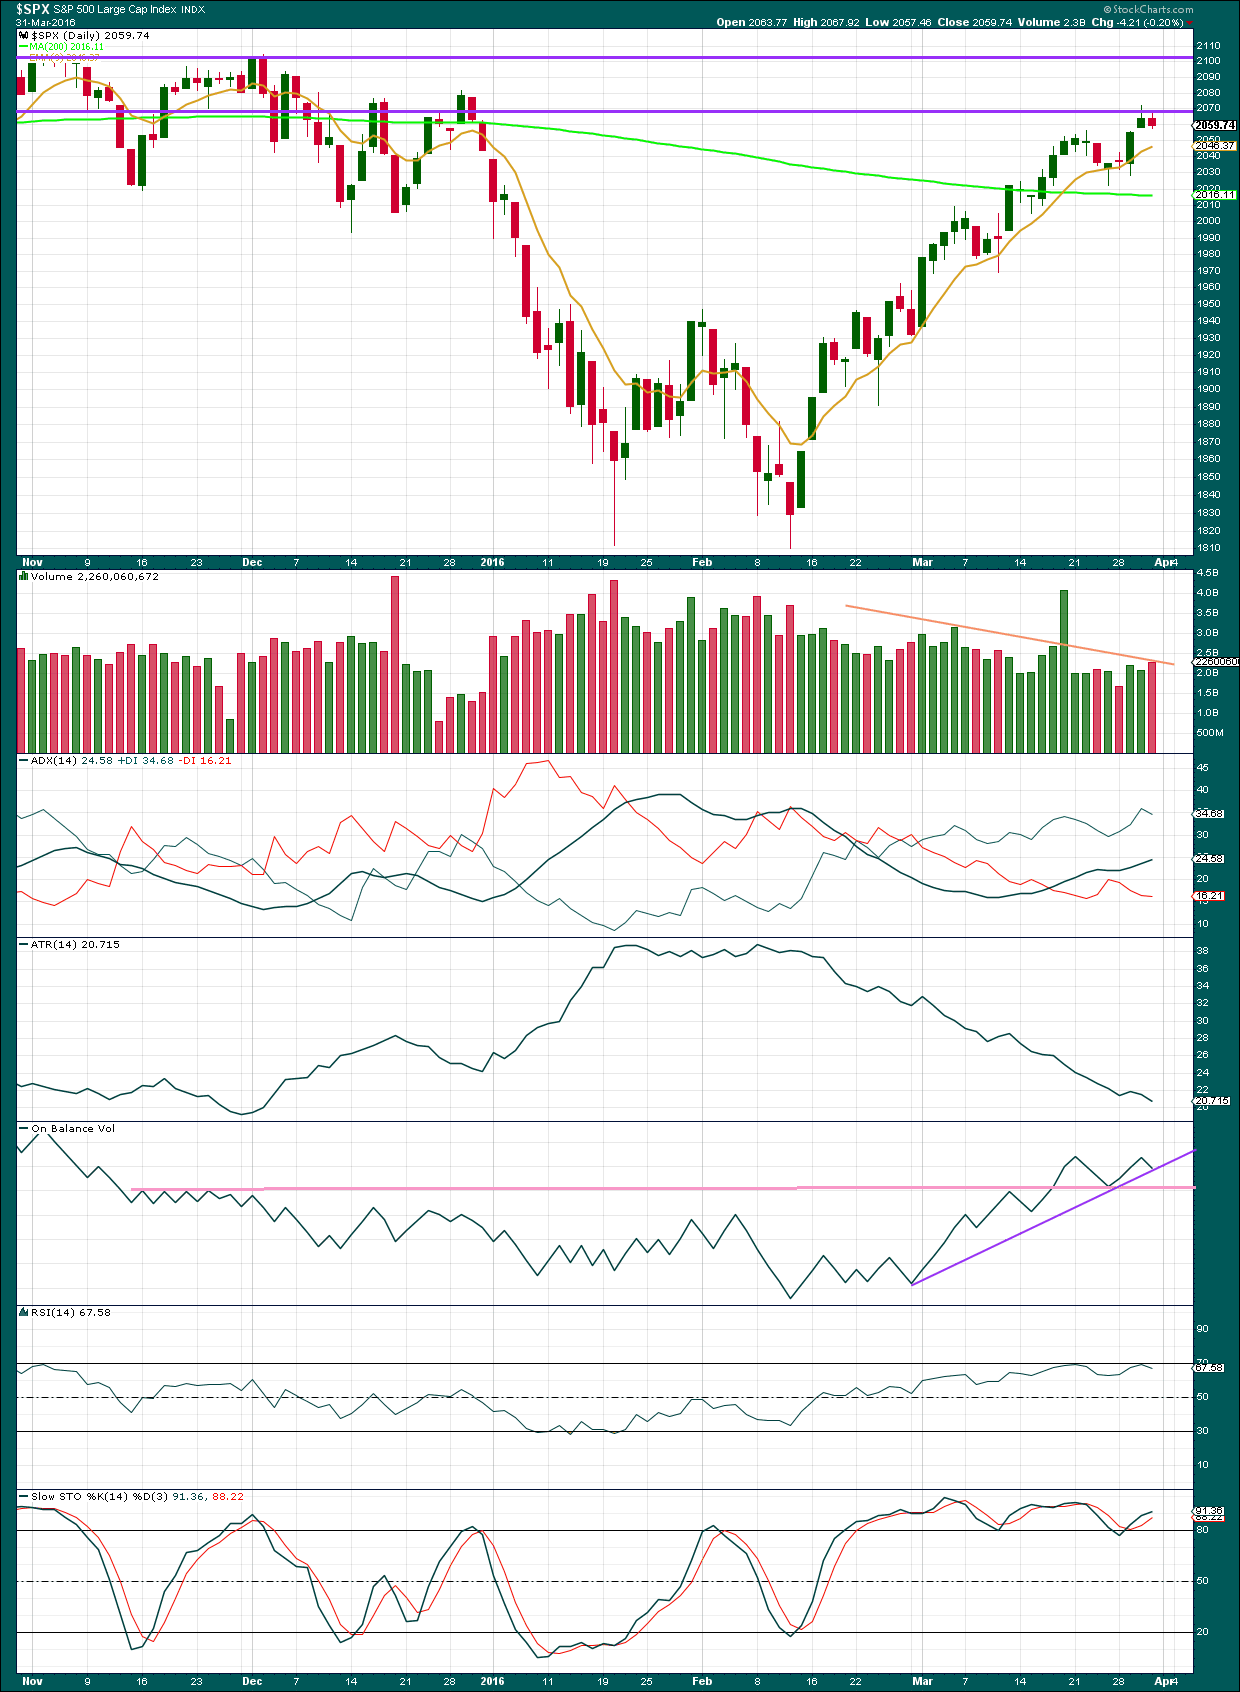
Click chart to enlarge. Chart courtesy of StockCharts.com.
Volume data on StockCharts is different to that given from NYSE, the home of this index. Comments on volume will be based on NYSE volume data when it differs from StockCharts.
Price is finding resistance at the horizontal trend line which is about 2,070.
A downwards day on increased volume is bearish. This indicates further weakness in price and supports the bigger picture that sees this upwards movement as a bear market rally and not a new bull market.
Overall, it is becoming clear that as price rises volume declines (orange trend line on volume, ignoring the options expiry date). This is more typical of a bear market rally than a bull market; there is not enough support for the rise in price for it to be sustained.
ADX is increasing, indicating the market is trending.
ATR still disagrees. Normally, during a trending market ATR increases but here is persistently declining. There is something wrong with this trend; it is not normal.
On Balance Volume has bounced up from the pink trend line which is highly technically significant. This bounce is bullish. The purple line on OBV is today redrawn across the last two lows of OBV; this line may provide some support, but it is not very technically significant.
RSI shows some divergence with price from the last swing high on 22nd March to the high of 30th March. While price made new highs RSI failed to make corresponding new highs, RSI was essentially flat. This indicates further weakness in price. This does not mean that price must turn down here, sometimes this divergence persists for a while and develops to double or triple divergence. Occasionally divergence disappears (rarely with RSI). It is a warning that the trend is weak.
Stochastics is overbought, but this oscillator may remain extreme for periods of time during a trending market. Stochastics also exhibits bearish divergence with price.
INVERTED VIX DAILY CHART
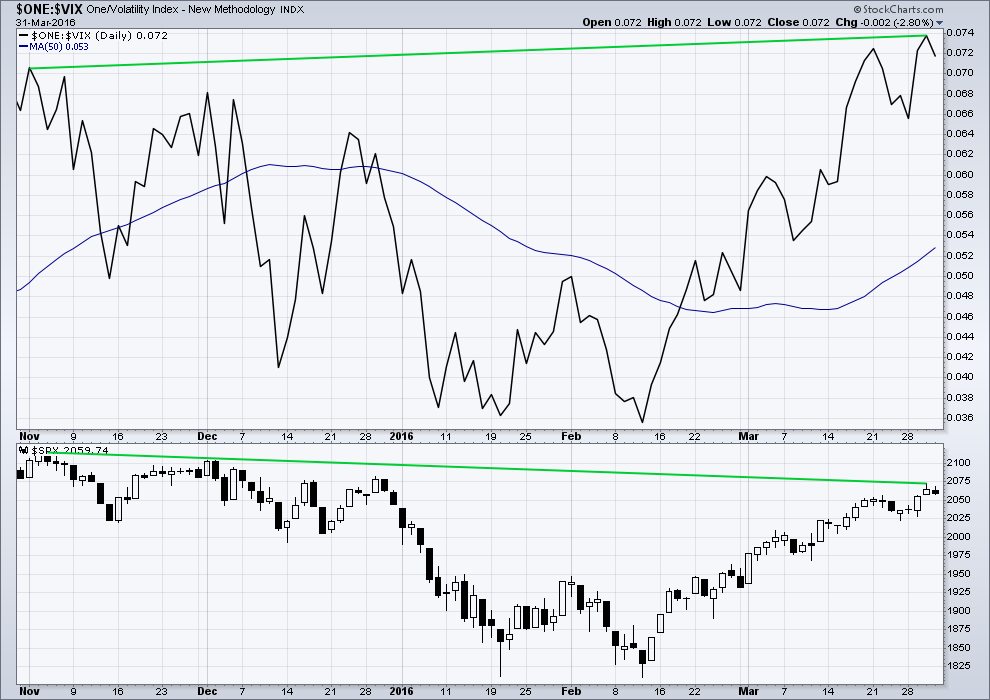
Click chart to enlarge. Chart courtesy of StockCharts.com.
Volatility declines as inverted VIX climbs. This is normal for an upwards trend.
What is not normal here is the divergence over a reasonable time period between price and inverted VIX. The decline in volatility is not translating to a corresponding increase in price. Price is weak. This divergence is bearish.
BULLISH PERCENT DAILY CHART
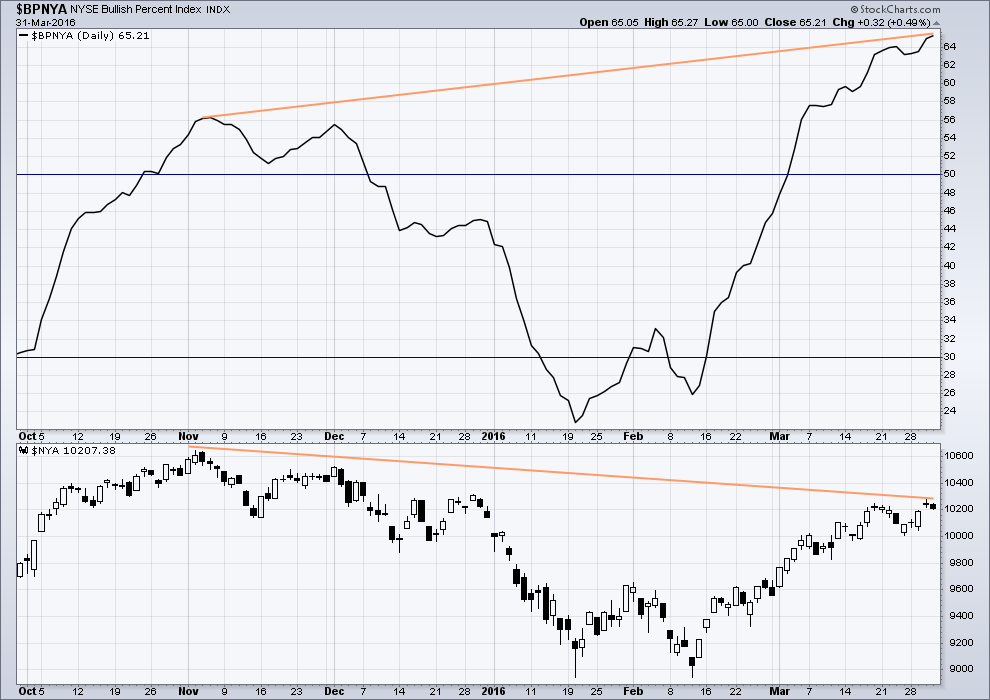
Click chart to enlarge. Chart courtesy of StockCharts.com.
There is strong hidden bearish divergence between price and the Bullish Percent Index. The increase in the percentage of bullish traders is more substantial than the last high in price. As bullish percent increases, it is not translating to a corresponding rise in price. Price is weak.
This looks like an overabundance of optimism which is not supported by price.
The number of bullish traders again increased today and yet this could not translate into an increase in the price of the index. This is further (short term) indication of weakness in price.
ADVANCE DECLINE LINE
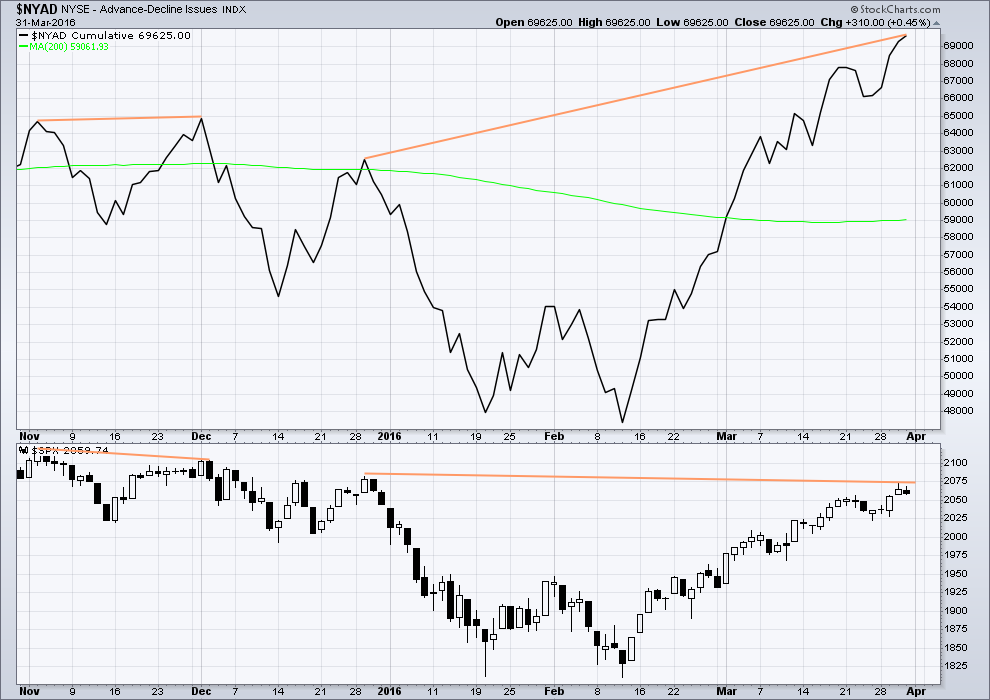
Click chart to enlarge. Chart courtesy of StockCharts.com.
The Advance Decline line shows no short term (day to day basis) divergence with price. With the AD line increasing, this indicates the number of advancing stocks exceeds the number of declining stocks. This indicates that there is breadth to this upwards movement.
Longer term, looking back over the last five months, there are two cases of hidden bearish divergence between price and the AD line.
From November 2015 to December 2015 the AD line made a new high while price failed to make a corresponding high. This indicated weakness in price and preceded new lows for price.
Now again from 29th December, 2015, to now the AD line is making new highs but price has so far failed to also make corresponding new highs. This again is an indication of weakness in price. Despite price rising with market breadth increasing, the breadth increase is not translating to substantial rises in price.
It remains to be seen if price can make new highs beyond the prior highs of 29th December, 2015. If price can manage to do that, then this hidden bearish divergence will no longer be correct, but the fact that it is so strong at this stage is significant. The AD line will be watched daily to see if this bearish divergence continues or disappears.
The 200 day moving average for the AD line is now increasing. This alone is not enough to indicate a new bull market. During November 2015 the 200 day MA for the AD line turned upwards and yet price still made subsequent new lows.
The AD line today advanced while overall price fell to produce a small red candlestick. This indicates further weakness in price. Although more stocks advanced than declined, it was not enough to translate into an increase in the price of the index.
DOW THEORY
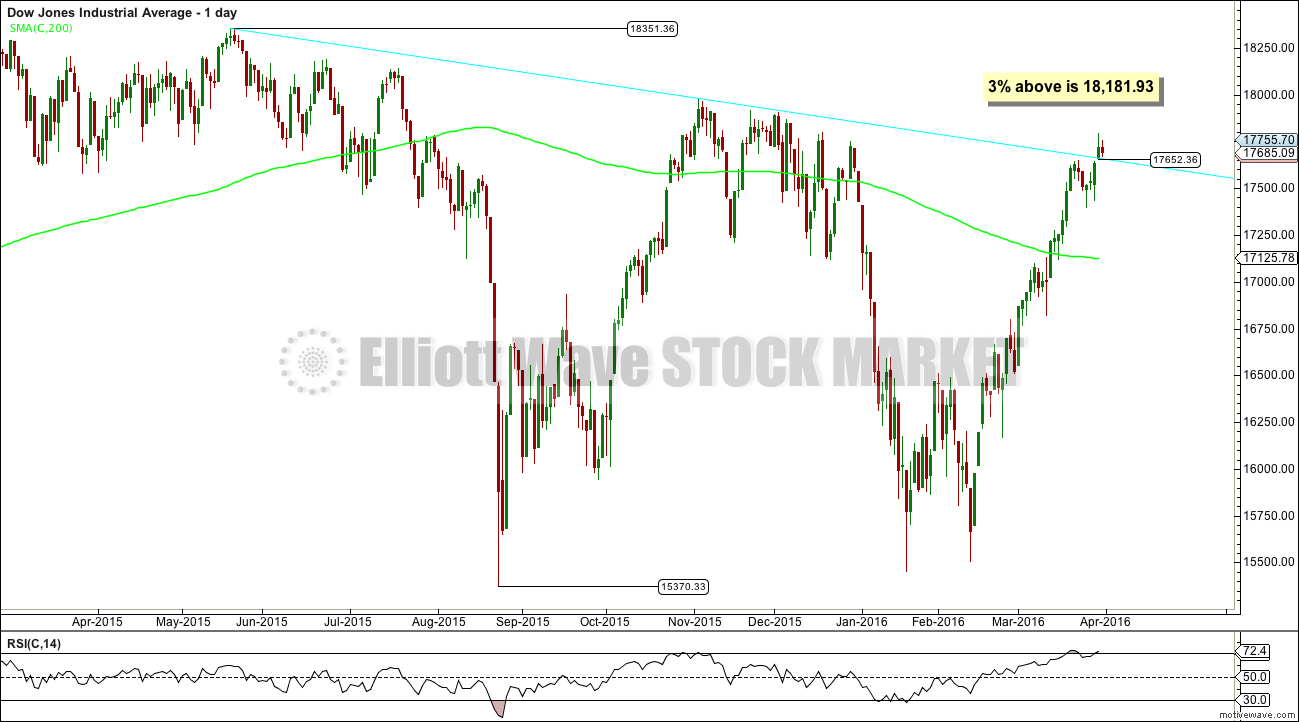
Click chart to enlarge.
The Dow Industrials broke above its bear market trend line. If price closes 3% or more above this trend line, calculated at 18,181.93, then this index would be indicating a new bull market. This would require confirmation by DJI and SPX at least. Price today came back to test that trend line for a typical looking throwback. An upwards bounce would be normal price behaviour about here, but it does not mean price must continue upwards and not again come to test the line or break below it.
I am choosing to use the S&P500, Dow Industrials, Dow Transportation, Nasdaq and the Russell 2000 index. Major swing lows are noted below. So far the Industrials, Transportation and Russell 2000 have made new major swing lows. None of these indices have made new highs.
I am aware that this approach is extremely conservative. Original Dow Theory has already confirmed a major trend change as both the industrials and transportation indexes have made new major lows.
At this stage, if the S&P500 and Nasdaq also make new major swing lows, then my modified Dow Theory would confirm a major new bear market. At that stage, my only wave count would be the bear wave count.
The lows below are from October 2014. These lows were the last secondary correction within the primary trend which was the bull market from 2009.
These lows must be breached by a daily close below each point.
S&P500: 1,821.61
Nasdaq: 4,117.84
DJIA: 15,855.12 – close below on 25th August 2015.
DJT: 7,700.49 – close below on 24th August 2015.
Russell 2000: 1,343.51 – close below on 25th August 2015.
This analysis is published @ 09:00 p.m. EST.
I see the same count as Olga.
The downwards spike (which took out my buy while I slept for a small profit, because I moved my stop higher) is minuette (iv). The upwards move now is minuette (v) to complete a five wave impulse for minute i.
And this is still minute i within minor 5. Minor 5 is still extremely unlikely to be over.
I’ll still be expecting more upwards movement towards the target 2,124.
2078 still the target for this first wave up?
I sold my sds puts at the close, I like Verne am nervous about being long over the weekend
Target now 2,088. That is where minuette (v) = minuette (iii).
Minuette (v) is just short of 1.618 X minuette (i), but the structure looks incomplete.
I would expect another push up to begin the new week, and then a second wave correction. Which may last a few days, probably only 2-3.
Exited my SPY 106 calls on this pop. That was close! 🙂
Market now in an area of very thick resistance. I personally would not want to be long over the week-end…yet another 52 week UVXY low…
I don’t know how much money is being spent to push this market but the A/D line now stands at 1300/1385. So brought the advances up from 580ish to present level.
I wont be first anymore,, I am cancelling my subcription
🙂 🙂
APRIL FOOLS,,,, oops ,didnt mean to yell
Man…! You had me in a cold sweat there…especially since I just could not work up the courage to ask…what the…!!! 😀
Me too!
OMG
I’m so glad to hear it!
You totally had me too. I was sad, now I’m happy 🙂
I sorry,,, guess I shouldnt have done a mean April fools… but I did get you, hee hee,, is April fools day a thing in NZ ?
Oh yeah, we do April Fools for sure.
And no worries, I do like a good prank.
Despite the temporary spike down this morning, it looks like some sort of triangle formation is continuing. A spike upward out of it for a final wave of the move should still be ahead. Hopefully it will breathe some life into those SPY calls!
I seems this impulse up is not complete. I am not sure what to make of the fourth wave if it is continuing…
How would this mornings down & up sequence be counted into the above bear counts?
Thanks… I am not good at real time counting.
I count it as minuette (iv) of minute (i) – invalidation is 2042.67 which today’s action did not reach.
It’s also possible it could have been minute (ii), but I cannot see where minuette (iv) & (v) ended if that was the case.
We should now get a new higher high to complete minute (i). Initial invalidation remains 2042.67
Just to clarify… You are counting at the 1 min chart level?
Anyone have the down & up sequence count of this morning for the hourly bear?
Well… My gut tells me to be fully in right here. So that is what I did for better or worse. Let that long lost 3 down begin.
If the market gets any more overbought, it will exceed anything I have seen the past eight years…I have a bit of dry powder left from unloaded longs recently but I am already positioned for what I think is a’ coming… 🙂
The banksters are furiously fighting the trend. They are spending a fortune in Europe trying to dig out of a sea of red. Effort looking kinda weak so far. This thing could get ulgy and fast we go back in the red….keep an eye on the VIX…
Has anyone considered the possibility that minor wave 5 is playing out as an ending diagonal where we are now finishing wave 2 of the diagonal? It would be one way the market could grind a bit higher and drag this out for another week or two…
Interesting. I guess you could see zig-zags in the move up so far. I am sure Lara will have an expert comment on the possibility…wave four not yet invalidated…
While I have no confidence in anything that comes out of the current administration, the jobs report, bogus or not, means Yellen is in serious trouble. This could be the catalyst that ignites the volatility inferno. She clearly now has absolutely no excuse for not raising interest rates. But for all the reasons often discussed on this forum, she simply cannot! It would be monetary suicide for the FED. This may be the straw that finally breaks the camel’s back- her resolute failure to raise rates when the data is absolutely screaming that it’s time…
I think the banksters will make another desperate cash dump so we could still see one more pop up despite Europe…
Vern,
This is the process and these are the actions that will make FED loose their credibility. that will be the final straw. They will reap what they have sowed.
Pump is in progress now but should fail by mid day and drop speed expected to pickup. Those are my expectations based on the market moves so far so waiting and watching for now.
They are certainly quickly running out of ammo. By the time they decide to take back the 25 basis points rate hike and usher in a new round (as if they ever stopped) by way of announcement, we should be quite a ways South of here…
The problem is no one and that includes the President will be able to hold FED responsible for these irresponsible actions. My limited understanding is that there is no rule book to tell them what and why..they sort of make things along the way just as the dot plot rules got changed part way through the process.
Hot-plug from the oven ….
Volatility at a critical juncture. VIX sitting at two year trend line ( red arrow pointing to brown trend-line) and what it does next will tell us if minor five goes higher.
Uvxy up over 5% pre market
Significant. Europe heading South. We need to be alert to the next few hours…
Loved the video!
knock knock….
whos there
OMG!
Your little guy has reminded me of the finer things in life…. at the very least, go for a ride, check out the view, hold your head up and put the wind in your face!
Thank you so much for sharing with all of us. Hope you don’t mind me re-posting your link on today’s page.
https://drive.google.com/file/d/0BzNyJOX-GIcOQjdXeHp6aVJiZEU/view?usp=sharing
Im glad you were touched ,,
That is too good! My little buddy was with me for 15 years. Rode in the basket on my bike.