
Upwards movement was again expected.
Summary: This is still a bear market rally until proven otherwise. A final fifth wave up is required to complete the structure. The target is 2,124. The invalidation point for this rally is 2,134.72.
To see last published monthly charts click here.
To see how each of the bull and bear wave counts fit within a larger time frame see the Grand Supercycle Analysis.
To see detail of the bull market from 2009 to the all time high on weekly charts, click here.
New updates to this analysis are in bold.
BEAR ELLIOTT WAVE COUNT
WEEKLY CHART
Click chart to enlarge.
This bear wave count fits better than the bull with the even larger picture, super cycle analysis found here. It is also well supported by regular technical analysis at the monthly chart level.
Importantly, there is no lower invalidation point for this wave count. That means there is no lower limit to this bear market.
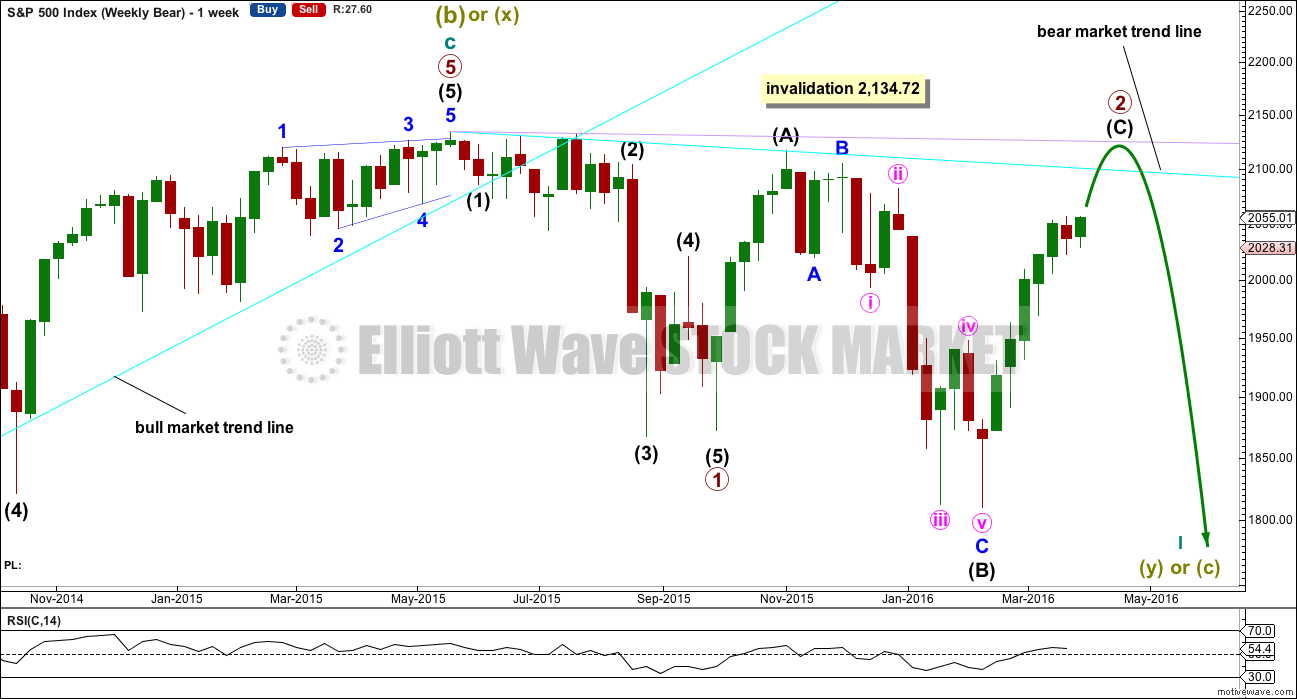
Primary wave 1 may be complete and may have lasted 19 weeks, two short of a Fibonacci 21. So far primary wave 2 is in its 25th week. It looks unlikely to continue for another 9 weeks to total a Fibonacci 34, so it may end in about two to five weeks time. This would still give reasonable proportion between primary waves 1 and 2. Corrections (particularly more time consuming flat corrections) do have a tendency to be longer lasting than impulses.
Primary wave 2 may be unfolding as an expanded or running flat. Within primary wave 2, intermediate wave (A) was a deep zigzag (which will also subdivide as a double zigzag). Intermediate wave (B) fits perfectly as a zigzag and is a 1.21 length of intermediate wave (A). This is within the normal range for a B wave of a flat of 1 to 1.38.
Intermediate wave (C) is likely to make at least a slight new high above the end of intermediate wave (A) at 2,116.48 to avoid a truncation and a very rare running flat. However, price may find very strong resistance at the final bear market trend line. This line may hold price down and it may not be able to avoid a truncation. A rare running flat may occur before a very strong third wave down.
If price moves above 2,116.48, then the new alternate bear wave count would be invalidated. At that stage, if there is no new alternate for the bear, then this would be the only bear wave count.
Primary wave 2 may not move beyond the start of primary wave 1 above 2,134.72.
DAILY CHART
Click chart to enlarge.
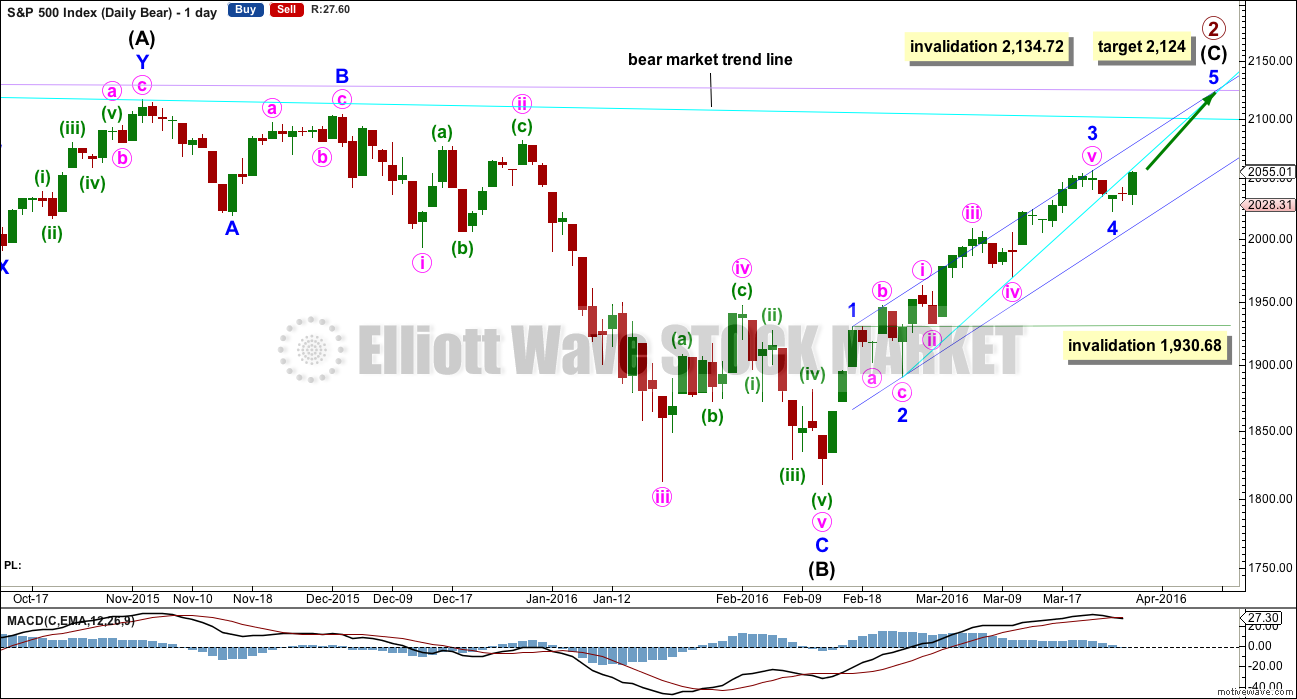
Intermediate wave (A) fits as a single or double zigzag.
Intermediate wave (B) fits perfectly as a zigzag. There is no Fibonacci ratio between minor waves A and C.
Intermediate wave (C) must subdivide as a five wave structure. It is unfolding as an impulse.
Intermediate wave (C) does not have to move above the end of intermediate wave (A) at 2,116.48, but it is likely to do so to avoid a truncation. If it is truncated and primary wave 2 is a rare running flat, then the truncation is not likely to be very large. As soon as price is very close to 2,116.48 this wave count looks at the possibility of a trend change.
The next wave down for this wave count would be a strong third wave at primary wave degree.
A bull market trend line for this rally is drawn across the first two small swing lows as per the approach outlined by Magee. This upwards sloping cyan line may provide support for corrections along the way up. Price broke below the cyan line. It may now provide resistance. The S&P has a tendency to break out of channels or below lines and then continue in the prior direction. It may do this again here.
At 2,124 minor wave 5 would reach 0.618 the length of minor wave 3. Intermediate wave (C) would avoid a truncation and the wave count would remain valid. Primary wave 2 would fulfill its purpose of convincing everyone that a new bull market is underway, and it would do that right before primary wave 3 surprises everyone.
If it continues lower, then minor wave 4 downwards may not move into minor wave 1 price territory below 1,930.68.
Within the impulse of intermediate wave (C), minor wave 2 is an expanded flat and minor wave 4 is a zigzag if it is over as labelled. These two corrections look to be nicely in proportion. It is most likely that minor wave 4 is over and minor wave 5 upwards is underway.
HOURLY CHART
Click chart to enlarge.
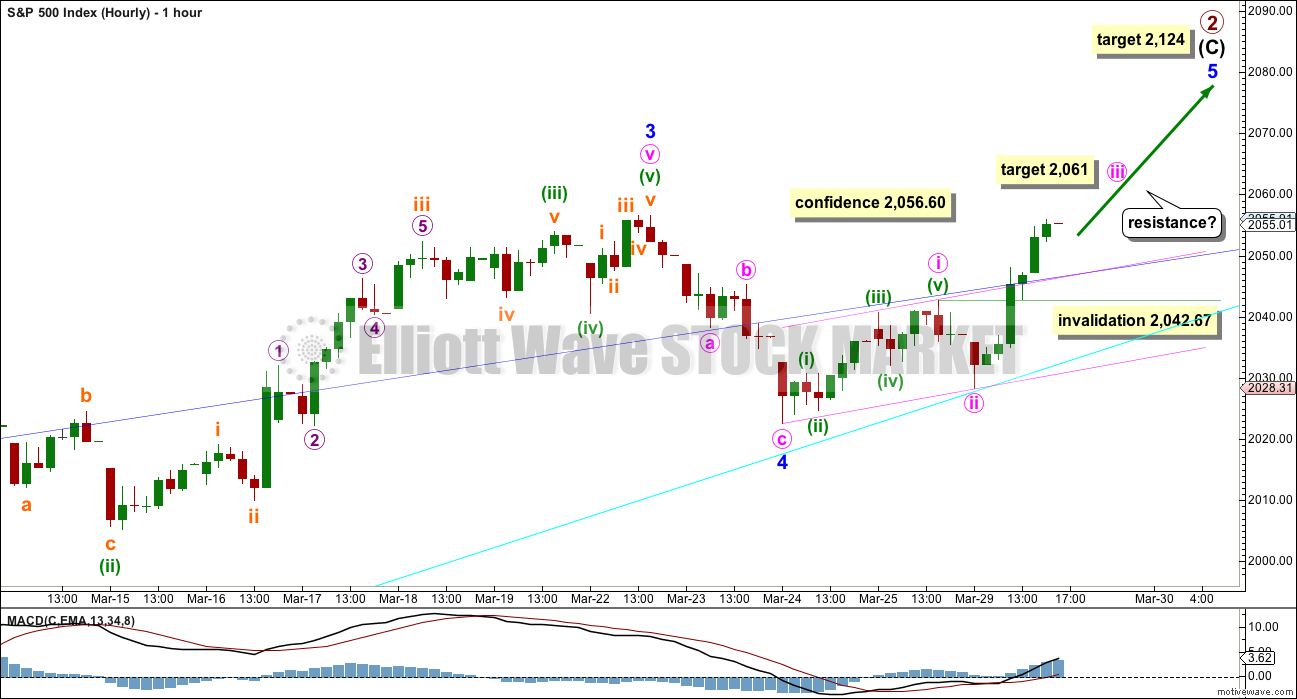
The degree of labelling within minor wave 5 may yet need to be moved down one degree. The degree may be changed when the next impulse up is complete, depending on how long the next impulse takes.
Minute wave i subdivides as an impulse within minor wave 5. Minute wave iii has moved above the end of minute wave i. Minute wave iii would reach 1.618 the length of minute wave i at 2,061. If this target is wrong, it may not be high enough. The next Fibonacci ratio in the sequence is 2.618 which gives a higher target of 2,081.
Whether this upwards movement is minute wave iii or minuette wave (iii) one degree lower, the following fourth wave correction may not move into first wave price territory below 2,042.67.
The pink channel is a base channel about minute waves i and ii. The upper edge may provide support for corrections now that this channel has been breached by upwards movement.
The cyan trend line is copied over from the daily chart. So far this trend line may provide some resistance. If price fully breaks above that line, then it may provide support.
Minor wave 5 may end at the upper edge of the dark blue channel also copied over from the daily chart.
ALTERNATE WEEKLY CHART
Click chart to enlarge.
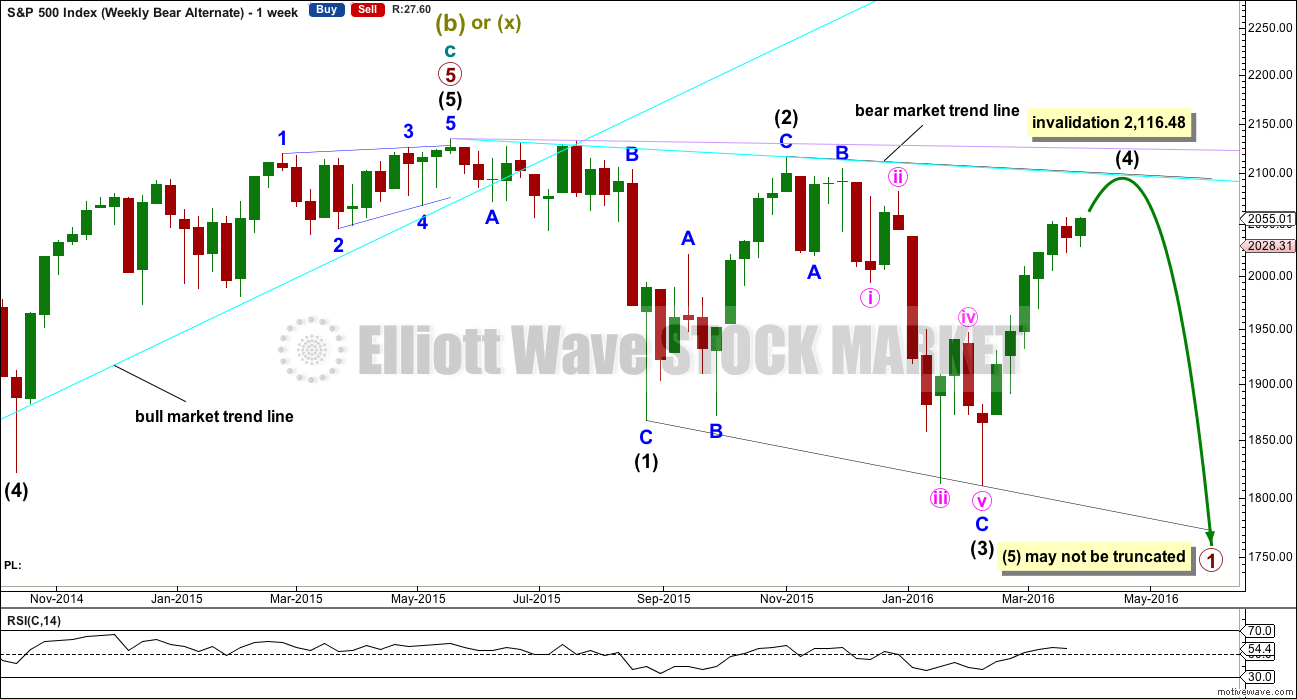
Primary wave 1 may subdivide as one of two possible structures. The main bear count sees it as a complete impulse. This alternate sees it as an incomplete leading diagonal.
The diagonal must be expanding because intermediate wave (3) is longer than intermediate wave (1). Leading expanding diagonals are not common structures, so that reduces the probability of this wave count to an alternate.
Intermediate wave (4) must continue higher and may find resistance at the cyan bear market trend line. Intermediate wave (4) may not move above the end of intermediate wave (2) at 2,116.48.
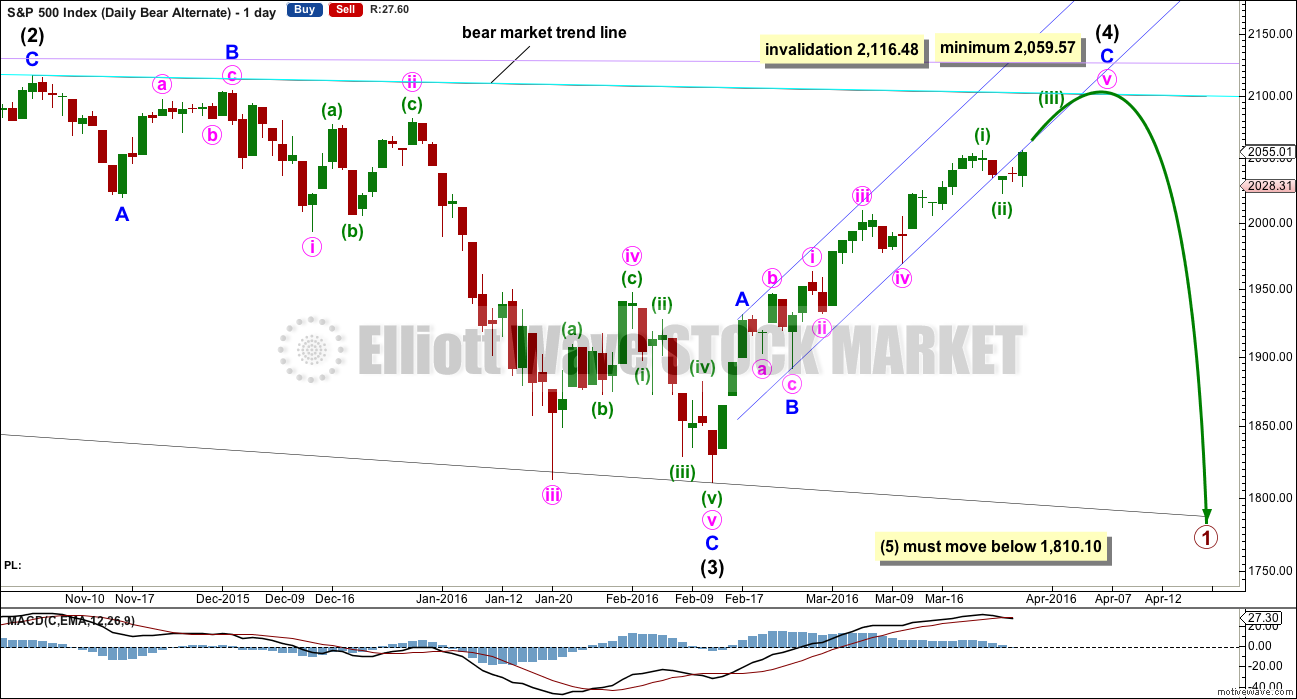
ALTERNATE DAILY CHART
Click chart to enlarge.
Within a leading diagonal, subwaves 2 and 4 must subdivide as zigzags. Subwaves 1, 3 and 5 are most commonly zigzags but may also sometimes appear to be impulses.
Intermediate wave (3) down fits best as a zigzag.
In a diagonal the fourth wave must overlap first wave price territory. The rule for the end of a fourth wave is it may not move beyond the end of the second wave.
Expanding diagonals are not very common. Leading expanding diagonals are less common.
Intermediate wave (4) must be longer than intermediate wave (2), so it must end above 2,059.57. If this minimum is not met, this wave count would be invalid. The trend lines must diverge.
Leading diagonals may not have truncated fifth waves. Intermediate wave (5) would most likely be a zigzag, must end below 1,810.10, and must be longer in length than intermediate wave (3) which was 306.38 points.
BULL ELLIOTT WAVE COUNT
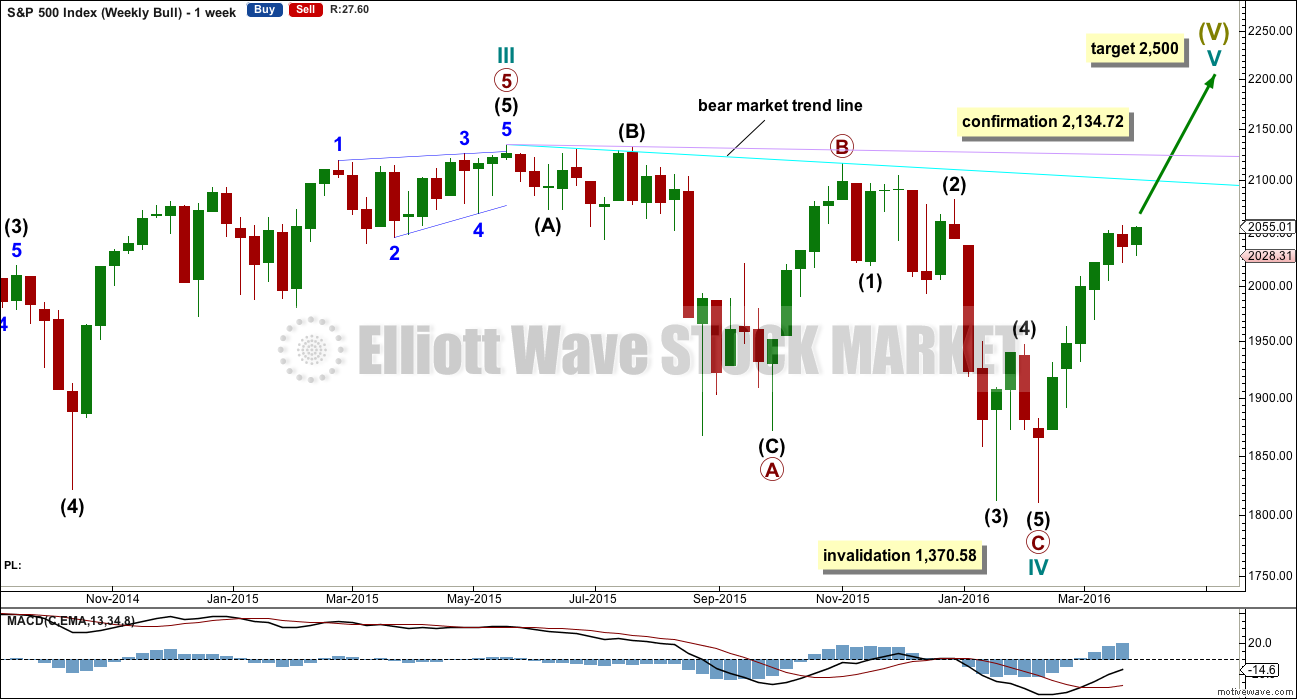
WEEKLY CHART
Click chart to enlarge.
Cycle wave II was a shallow 0.41 zigzag lasting three months. Cycle wave IV may be a complete shallow 0.19 regular flat correction, exhibiting some alternation with cycle wave II.
At 2,500 cycle wave V would reach equality in length with cycle wave I.
Price remains below the final bear market trend line. This line is drawn from the all time high at 2,134.72 to the swing high labelled primary wave B at 2,116.48 on November 2015. This line is drawn using the approach outlined by Magee in the classic “Technical Analysis of Stock Trends”. To use it correctly we should assume that a bear market remains intact until this line is breached by a close of 3% or more of market value. In practice, that price point would be a new all time high which would invalidate any bear wave count.
This wave count requires price confirmation with a new all time high above 2,134.72.
While price has not made a new high, while it remains below the final bear market trend line and while technical indicators point to weakness in upwards movement, this very bullish wave count comes with a strong caveat. I do not have confidence in it.
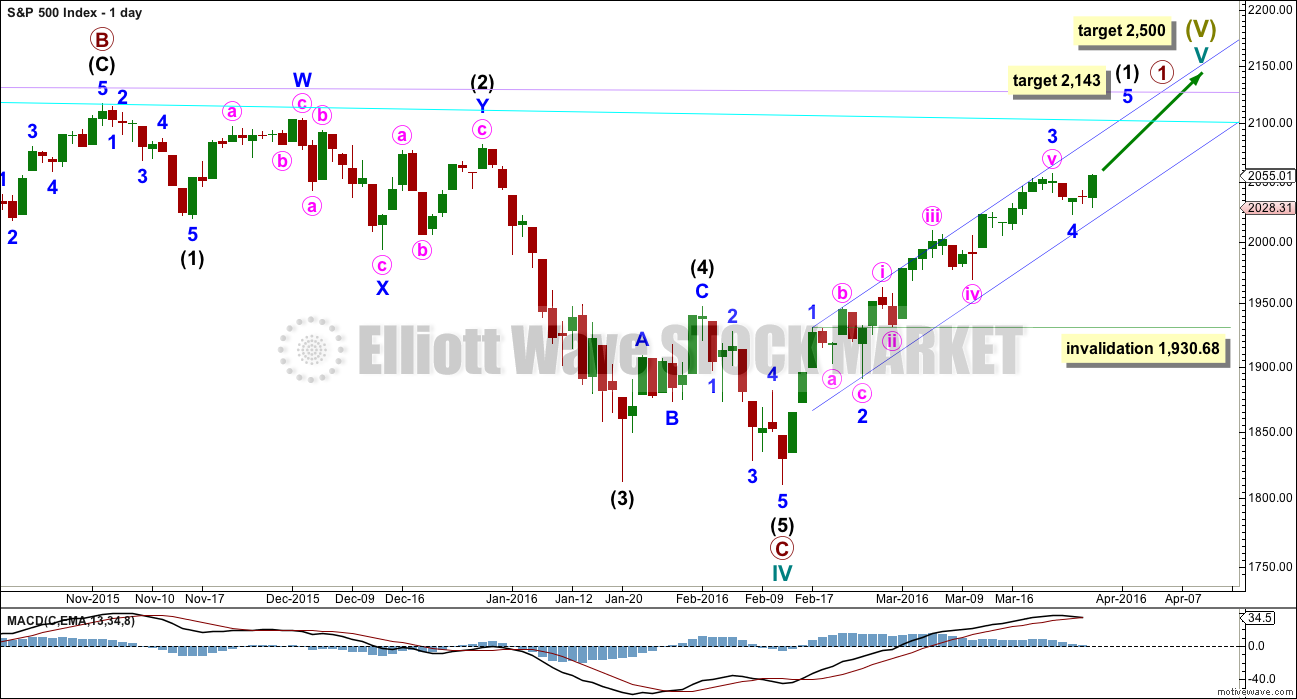
DAILY CHART
Click chart to enlarge.
Upwards movement cannot now be a fourth wave correction for intermediate wave (4) as price is now back up in intermediate wave (1) territory above 2,019.39. This has provided some clarity.
For the bullish wave count, it means that primary wave C must be over as a complete five wave impulse.
Intermediate wave (2) is seen as an atypical double zigzag. It is atypical in that it moves sideways. Double zigzags should have a clear slope against the prior trend to have the right look. Within a double zigzag, the second zigzag exists to deepen the correction when the first zigzag does not move price deep enough. Not only does this second zigzag not deepen the correction, it fails to move at all beyond the end of the first zigzag. This structure technically meets rules, but it looks completely wrong. This gives the wave count a low probability.
If the bull market has resumed, it must begin with a five wave structure upwards at the daily and weekly chart level. So far that is incomplete.
Downwards movement may not be a lower degree correction within minute wave v because it is in price territory of the first wave within minute wave v. This downwards movement must be minor wave 4. At 2,143 minor wave 5 would reach equality in length with minor wave 1.
Minor wave 4 may not move into minor wave 1 price territory below 1,930.68.
TECHNICAL ANALYSIS
DAILY CHART
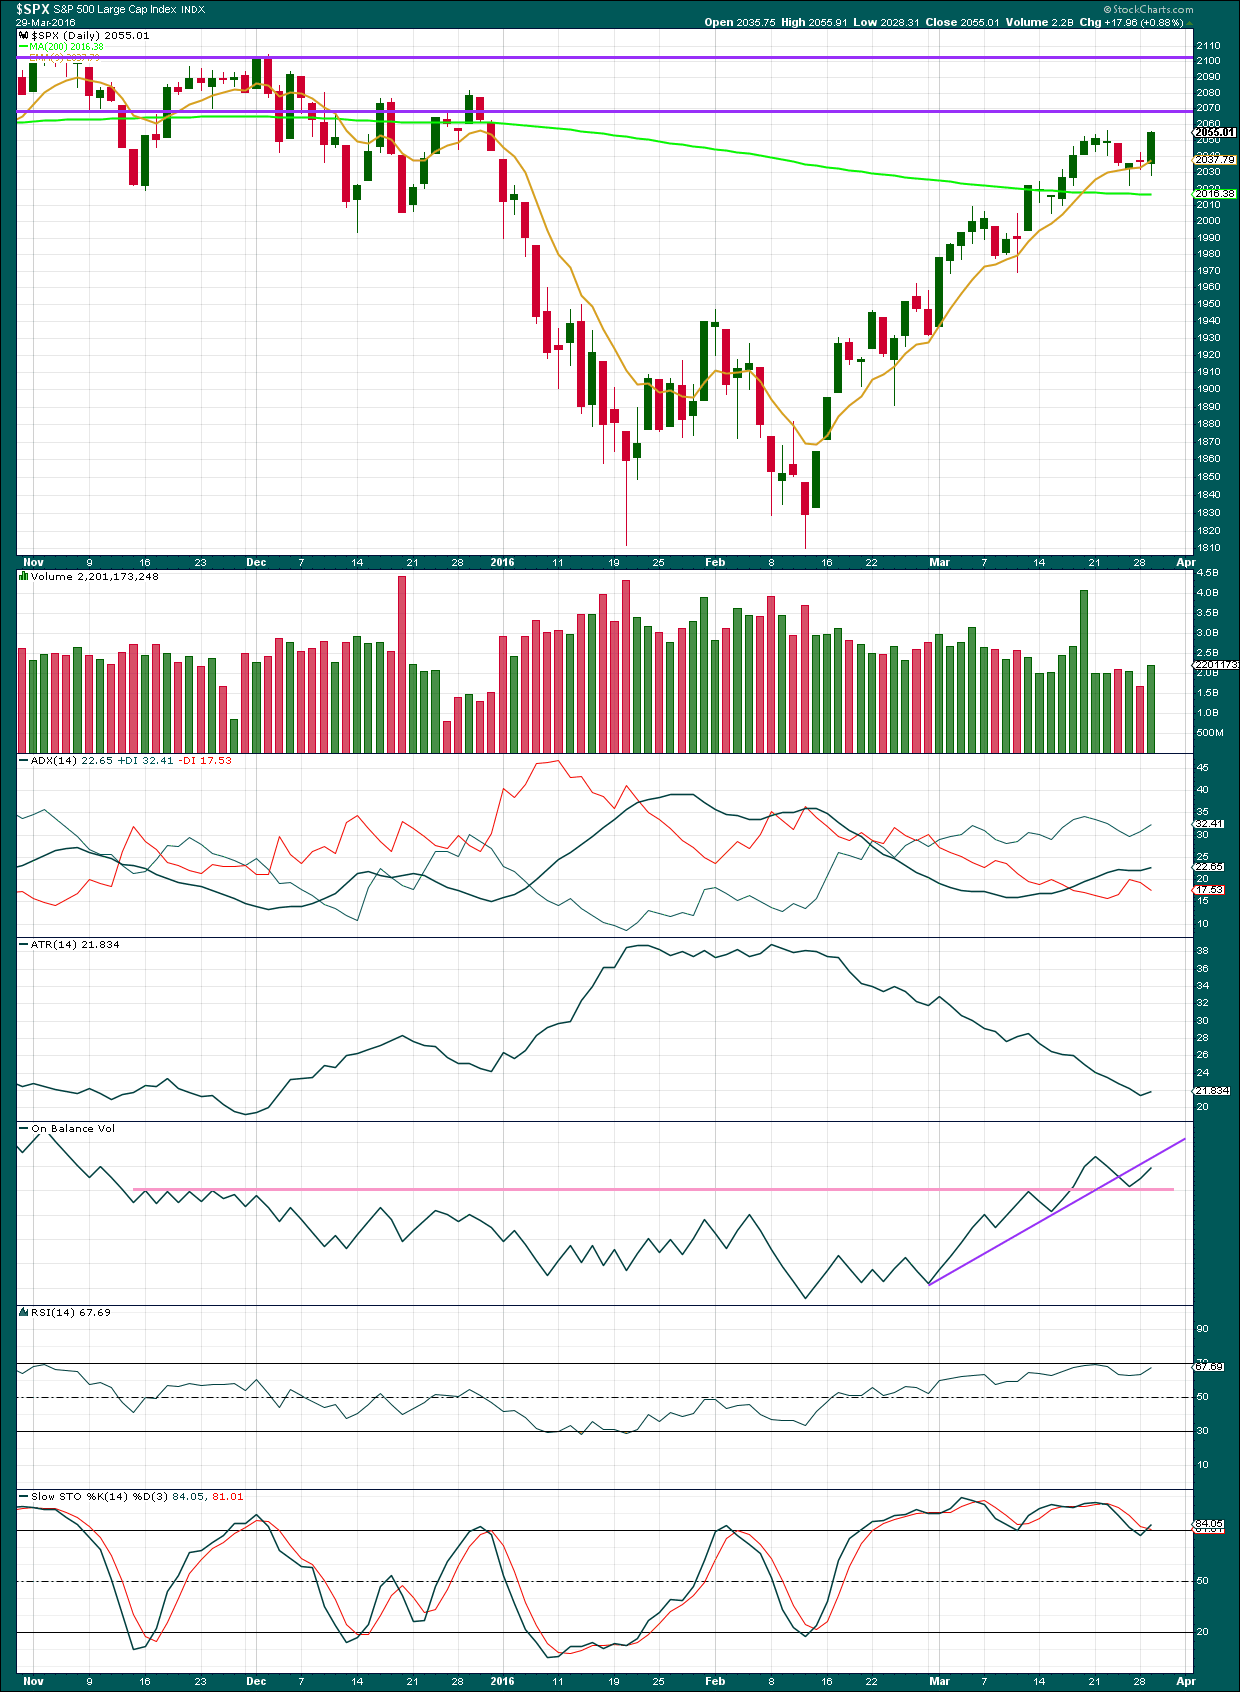
Click chart to enlarge. Chart courtesy of StockCharts.com.
Volume data on StockCharts is different to that given from NYSE, the home of this index. Comments on volume will be based on NYSE volume data when it differs from StockCharts.
A fairly strong upwards day coming with an increase in volume supports the upwards movement in price. This supports the idea that more upwards movement should unfold.
Price is finding support about the 9 day moving average.
ADX is again today increasing. This indicates that the upwards trend has resumed.
ATR has been declining strongly, but today it shows a small uptick which is not enough for ATR to be in agreement with ADX. This indicator still indicates there is something wrong with this trend; it is not normal.
On Balance Volume is still bullish while it remains above the pink trend line. Any further downwards corrections from price should be relatively shallow and short lived while this trend line for OBV holds.
RSI is not yet overbought and shows no divergence yet with price. RSI is not indicating an end to upwards movement here.
Stochastics is fluctuating in overbought territory. This oscillator may remain extreme for reasonable periods of time during a trending market, so this does not indicate that upwards movement must end here.
INVERTED VIX DAILY CHART
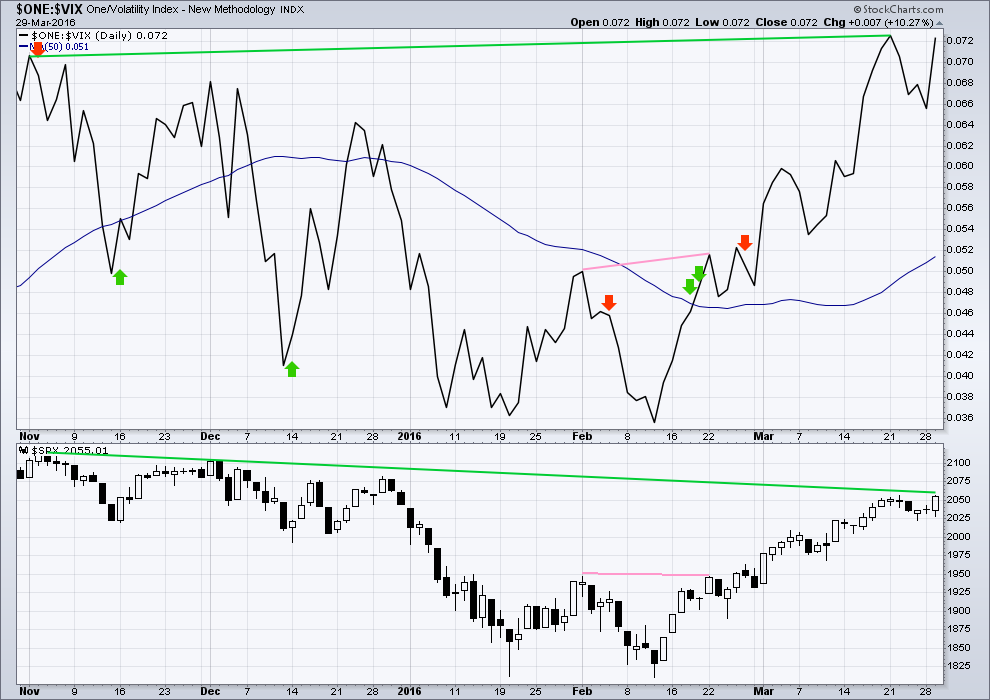
Click chart to enlarge. Chart courtesy of StockCharts.com.
Volatility declines as inverted VIX climbs. This is normal for an upwards trend.
What is not normal here is the divergence over a reasonable time period between price and inverted VIX. The decline in volatility is not translating to a corresponding increase in price. Price is weak. This divergence is bearish.
BULLISH PERCENT DAILY CHART
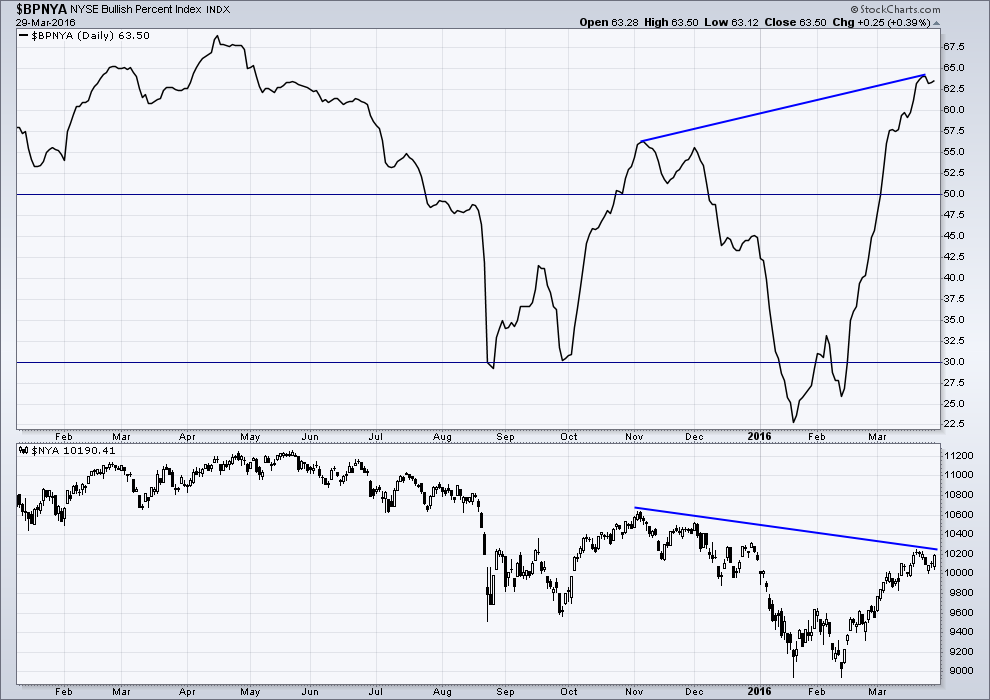
Click chart to enlarge. Chart courtesy of StockCharts.com.
There is strong hidden bearish divergence between price and the Bullish Percent Index. The increase in the percentage of bullish traders is more substantial than the last high in price. As bullish percent increases, it is not translating to a corresponding rise in price. Price is weak.
This looks like an overabundance of optimism which is not supported by price.
ADVANCE DECLINE LINE
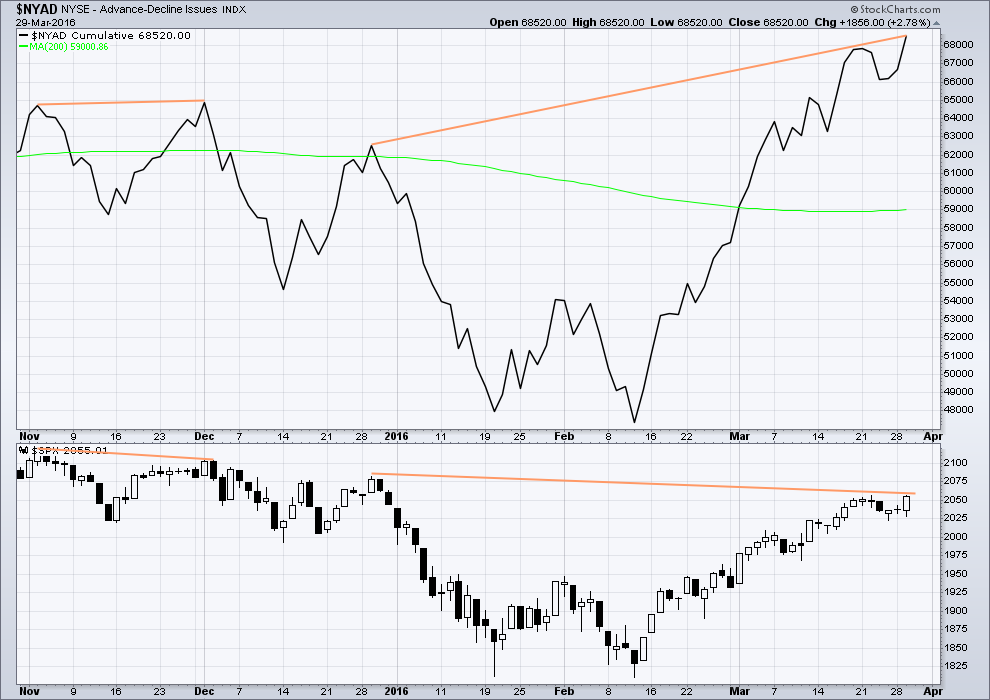
Click chart to enlarge. Chart courtesy of StockCharts.com.
The Advance Decline line shows no short term (day to day basis) divergence with price. With the AD line increasing, this indicates the number of advancing stocks exceeds the number of declining stocks. This indicates that there is breadth to this upwards movement.
Longer term, looking back over the last five months, there are two cases of hidden bearish divergence between price and the AD line.
From November 2015 to December 2015 the AD line made a new high while price failed to make a corresponding high. This indicated weakness in price and preceded new lows for price.
Now again from 29th December, 2015, to now the AD line is making new highs but price has so far failed to also make corresponding new highs. This again is an indication of weakness in price. Despite price rising with market breadth increasing, the breadth increase is not translating to substantial rises in price.
It remains to be seen if price can make new highs beyond the prior highs of 29th December, 2015. If price can manage to do that, then this hidden bearish divergence will no longer be correct, but the fact that it is so strong at this stage is significant. The AD line will be watched daily to see if this bearish divergence continues or disappears.
The 200 day moving average for the AD line is now increasing. Even if the 200 day MA points up this alone would not be enough to indicate a new bull market. During November 2015 the 200 day MA for the AD line turned upwards and yet price still made subsequent new lows.
There is now also some short term hidden bearish divergence between price and the AD line from the high in price five days ago.
DOW THEORY
I am choosing to use the S&P500, Dow Industrials, Dow Transportation, Nasdaq and the Russell 2000 index. Major swing lows are noted below. So far the Industrials, Transportation and Russell 2000 have made new major swing lows. None of these indices have made new highs.
I am aware that this approach is extremely conservative. Original Dow Theory has already confirmed a major trend change as both the industrials and transportation indexes have made new major lows.
At this stage, if the S&P500 and Nasdaq also make new major swing lows, then my modified Dow Theory would confirm a major new bear market. At that stage, my only wave count would be the bear wave count.
The lows below are from October 2014. These lows were the last secondary correction within the primary trend which was the bull market from 2009.
These lows must be breached by a daily close below each point.
S&P500: 1,821.61
Nasdaq: 4,117.84
DJIA: 15,855.12 – close below on 25th August 2015.
DJT: 7,700.49 – close below on 24th August 2015.
Russell 2000: 1,343.51 – close below on 25th August 2015.
This analysis is published @ 11:33 p.m. EST.
Some early thoughts based on market action today. I now expect the trend to change starting tomorrow. This I know is against Lara’s projected path for this move to end. I base this on the fact that
1. Q1 for 2016 is now booked and all funds will show nice recovery to please the investors as settlement will be Monday next week (3 days).
2. Advance Decline push McClellan Oscillator to trigger a short as there were 974 declining issues (A/D 1728/974 compared to 2,253 / 447 yesterday). This pushed the chart into negative territory ( I will try to post the chart later).
3. Volatility bounced back and recovered majority of losses.
4. Earning season will start soon with pre announcements of misses and reality will hit the wall street.
Thanks for the information Ris!
Here is my wave count for Russell 2000. Taking out 1065.62 would add confidence and present a good short entry point imho. 🙂
Check out the article “To fast of a sentiment swing” here:
http://www.mcoscillator.com/market_breadth_data/
Interesting article. All the talking heads are attributing the latest bullishness to Yellen’s dovish remarks. Although we saw it coming, it really is still quite astonishing that the masses still have so much confidence in the banksters’ ability to keep the party humming along. It is another startling reminder that the power of the banksters is in their ability not manipulate markets so much as it is to manipulate sentiment. Oh, I am quite aware that both things go on, but the real influence lies with the latter. It is going to be most interesting when the masses come to a full realization that their confidence was woefully misplaced. I think the 2100 pivot is now the magnet and we should see a final burst of euphoria by this Friday after some meandering tomorrow. Still holding a very light compliment of upside hedges to be unloaded on the next pop higher. Strange times indeed!
It does appear possible that minute/minuette 3 is complete but we still need to finish 4 and 5. We can then expect a topping process and finally a breakdown from the trend channel. So we should have a lot of warning.
If the small fourth wave is over then at 2,081 minuette (v) = minuette (i).
When minute i is complete then a second wave correction may now find support at the cyan trend line, now that this line is breached. Doesn’t have to provide support, but it is fairly likely to do so.
And it looks like the fourth wave is done, now heading up for a fifth wave.
And I’ll be moving the degree of labelling within minor 5 down one degree today.
I think this five up which is almost complete looks like a first wave within minor 5, not minor 5 almost complete. My reason is if minor 5 is close to complete the truncation would be huge for intermediate (C).
I’m wondering, how much of a truncation would be acceptable? My only realistic answer is “not much”. I know that may be annoying, I think it is anyway.
DJI and Russell have broken above their bear market trend lines today. That was providing strong resistance for them. Will calculate 3% of market value above them and publish in todays analysis.
Yep. If that is only minute one of minor five, we are going to be considerably more overbought by the time this is over. Meanwhile, dire economic news continue to issue from the financial world, with Boeing announcing 4000 layoffs, and Blackrock announcing 400. I do think SPY is going to approach the 210 area.
Looking like a fourth wave developing so we should see at least one more pop to the upside. UVXY heading up from yet another 52 week low. Look for divergence on the final wave up. If the UVXY 18.50 low holds, we may escape the bankster subterfuge of the usual reverse split…
Bloomberg reporting that as volatility as plunged, outstanding shares of TVIX has gone through the roof, reflecting skyrocketing demand…the crowd is more nervous than it appears…. 🙂
Vern–you lost me, if demand for TVIX is skyrocketing why are UVXY and TVIX prices falling, falling, falling?
All those shares being issued to supply additional demand are being sold short.
Classic case of the dumb versus the smart money….
To be perfectly fair, folk holding long volatility positions that are less than convinced are of course bailing like terrified rabbits on days like today so the short sellers will make some coin to be sure; especially off folk trading using excessive leverage…the shares sold will all have to be covered… 🙂
Here’s my 2 cents with UVXY:
Most likely during minute iii of minor 5 (likely the strongest wave up), UVXY will go below its lower BB ever so briefly, and RSI will be also at its most oversold. Meanwhile, RSI is already at its most oversold this whole year…
I’ll be purchasing a big chunk of cheap UVXY calls expiring 6-8 weeks out; if this scenario does actually play out. I’m thinking that would be a spring board that will take volatility much higher…
I could be wrong about this, but I have a sneaking suspicion that we are already in minuette five up of minute five of minor five. Indicators are now so extreme it is hard to imagine the strongest upside of this correction is yet to come. Momentum and breadth have also been waning. I am not sure how this weighs against Lara’s concern about a C wave truncation but we should have an answer in the next day or two.
Very good depiction of the cycle FED and central banks around the world are caught in.
http://ei.marketwatch.com//Multimedia/2016/03/30/Photos/NS/MW-EI973_unname_20160330090402_NS.jpg?uuid=e04e17c8-f677-11e5-860e-0015c588dfa6
Lara,
Thanks for the analysis and commentary. I like that you added the inverted VIX and bullish percentage charts to your analysis for supporting data. Some other analysts are making the comments that these and especially the AD Line are indicating that price will catch up to the new highs in the indicators. I like your analysis that it rather indicates weakness in price.
I am hopeful the 2124 target or very near to it will be met next week. This would lead to a very low risk trade and a very high potential reward trade that is only seen every few years or even a decade.
I have not yet backed up the trucks to load up on these bearish trades like our friend Verne is doing. But the drivers are in and the engines are running. I will take a 1/4 position at what looks to be the top and then wait for channel breach and price confirmations for the remainder of my positions.
Today I head to the mountains for a few days of rest and relaxation. My busiest season of the year is just completed and I am up for some wilderness silence and solitude.
I hope everyone has a great day and weekend. See you next week as we top out and start our move into the 1700’s!
BTW, Daily and 4 hour MACD on the SPX should be giving a negative divergence signal today and the following few days. However, if we go much higher those signals may disappear.
Cheers Rodney.
Price could catch up to all of those indicators, and that hidden bearish divergence could disappear. I think the fact that it exists now over several indicators, and has been there for a while, and is strong, is a pretty telling sign of weakness in price.
That is an interesting take that other analysts seem to have. If they think it means price must catch up, then they’re projecting hope onto price rather than objectively analysing what price is doing. That’s my assessment of their view anyway.
I surfed until my arms were noodles and my shoulders seized up yesterday. Long clean rides on shoulder height waves. Glassy ocean. Pure bliss in the sunshine. It gave me back my Zen as I imagine your wilderness hiking does.
Thinking some more about this:
“Some other analysts are making the comments that these and especially the AD Line are indicating that price will catch up to the new highs in the indicators. ”
Telling price what it should do rarely ends well.
Looking at what price is actually doing now is more indicative.
Have a great week Rodney, don’t get eaten by bears, and we’ll all “see” you when you get back.
I will be exiting my final bullish positions at the close today.
While most traders I know are expecting some kind of correction in the near future, no one, and I mean absolutely no one I know (I read quite a bit) has even so much as hinted at the possibility of a primary two top completing. In all my years of trading, I have never, ever seen this kind of disconnect among traders, from the reality of what could possibly be developing. One would think that at least a few folk would be talking about the possibility. While that count could be incorrect and something else is developing, the absence of any discussion whatsoever of the possibility speaks volumes! Trade safe!
Vern,
UVXY is printing new low $19.19 in pre-market as the bulls are excited over the FED statement from yesterday. No care for the declining profit picture and fundamentals. Quite a few timing points of critical importance between today and April 1 given the Qtr1 end.
Yeah Ris. We are witnessing a real live display of extraordinary popular delusions and the madness of crowds. As Rodney indicated, I know I am a little early in getting positioned, but if my suspicions of what lies ahead is correct, I expect to be rolling positions just as most folk are jumping in. It is really amazing to see where the markets are when one considers what lies beneath…
I would have to agree that if you expect another two weeks of upward movement the degree of labeling would have to be moved down. Conditions are now quite overbought; I would be quite surprised to see it last more than another few days so I am partial to the current label. It is not entirely clear if we have already had a channel upside break of minute three of minor five. If not, I imagine we should see it tomorrow. 🙂
First again?! 🙂