
Again, upwards movement continues as expected.
Summary: This is still a bear market rally until proven otherwise. Tomorrow may begin a small correction to last about one to three days which should remain above 2,018.91. Thereafter, the upwards trend should resume. This rally is reasonably likely to end above 2,116.48, but it cannot make a new all time high. In the short term, the target for a larger interruption to the trend (a fourth wave which may last about five sessions) may arrive about 2,082 – 2,086. Use the new cyan line for this upwards movement for support along the way up.
To see last published monthly charts click here.
To see how each of the bull and bear wave counts fit within a larger time frame see the Grand Supercycle Analysis.
To see detail of the bull market from 2009 to the all time high on weekly charts, click here.
New updates to this analysis are in bold.
BEAR ELLIOTT WAVE COUNT
WEEKLY CHART
Click chart to enlarge.
This bear wave count fits better than the bull with the even larger picture, super cycle analysis found here. It is also well supported by regular technical analysis at the monthly chart level.
Importantly, there is no lower invalidation point for this wave count. That means there is no lower limit to this bear market.
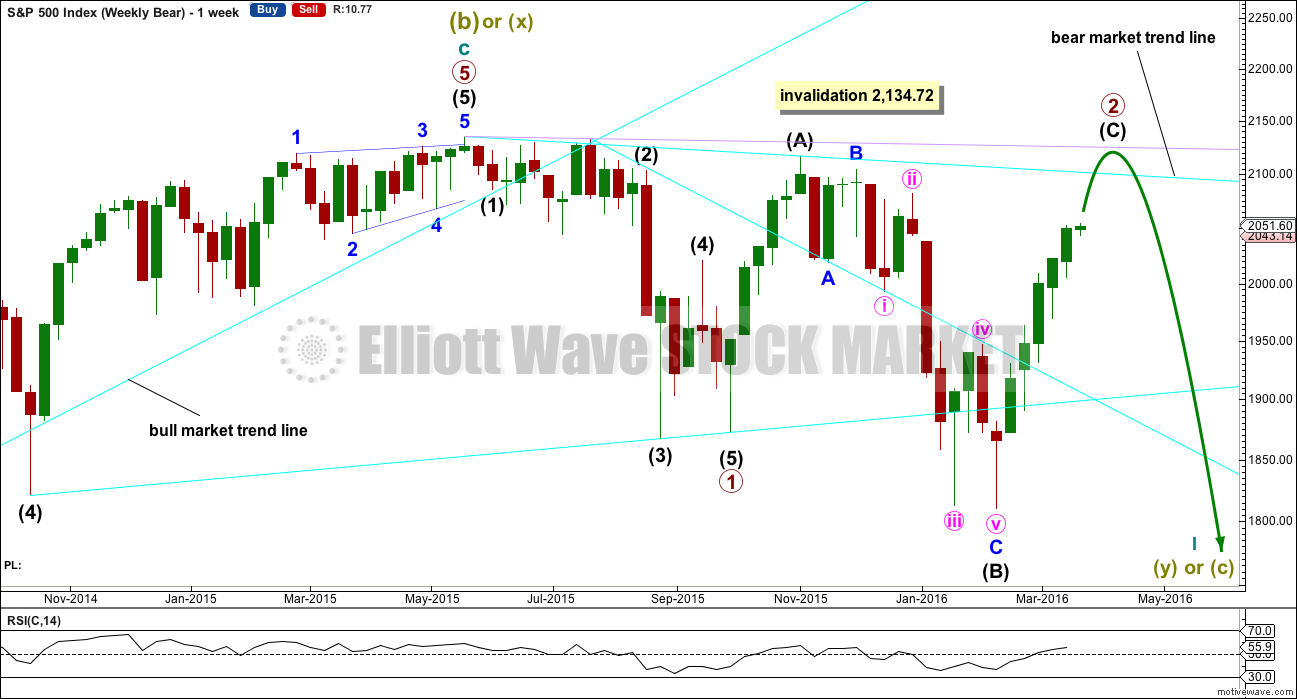
Primary wave 1 may be complete and may have lasted 19 weeks, two short of a Fibonacci 21. So far primary wave 2 is in its 24th week. It looks unlikely to continue for another 10 weeks to total a Fibonacci 34, so it may end in about two to five weeks time. This would still give reasonable proportion between primary waves 1 and 2. Corrections (particularly more time consuming flat corrections) do have a tendency to be longer lasting than impulses.
Primary wave 2 may be unfolding as an expanded or running flat. Within primary wave 2, intermediate wave (A) was a deep zigzag (which will also subdivide as a double zigzag). Intermediate wave (B) fits perfectly as a zigzag and is a 1.21 length of intermediate wave (A). This is within the normal range for a B wave of a flat of 1 to 1.38.
Intermediate wave (C) is likely to make at least a slight new high above the end of intermediate wave (A) at 2,116.48 to avoid a truncation and a very rare running flat. However, price may find very strong resistance at the final bear market trend line. This line may hold price down and it may not be able to avoid a truncation. A rare running flat may occur before a very strong third wave down.
Primary wave 2 may not move beyond the start of primary wave 1 above 2,134.72.
DAILY CHART
Click chart to enlarge.
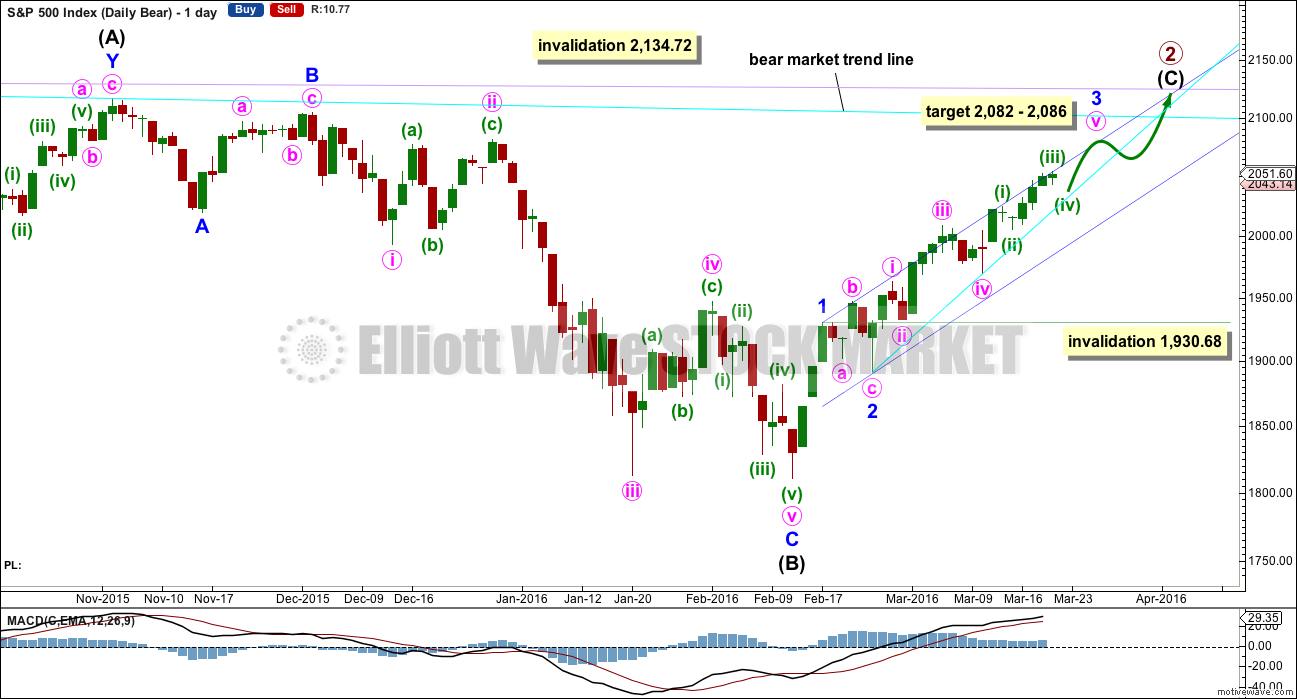
Intermediate wave (A) fits as a single or double zigzag.
Intermediate wave (B) fits perfectly as a zigzag. There is no Fibonacci ratio between minor waves A and C.
Intermediate wave (C) must subdivide as a five wave structure. It is not unfolding as an ending diagonal, so it must be unfolding as a more common impulse.
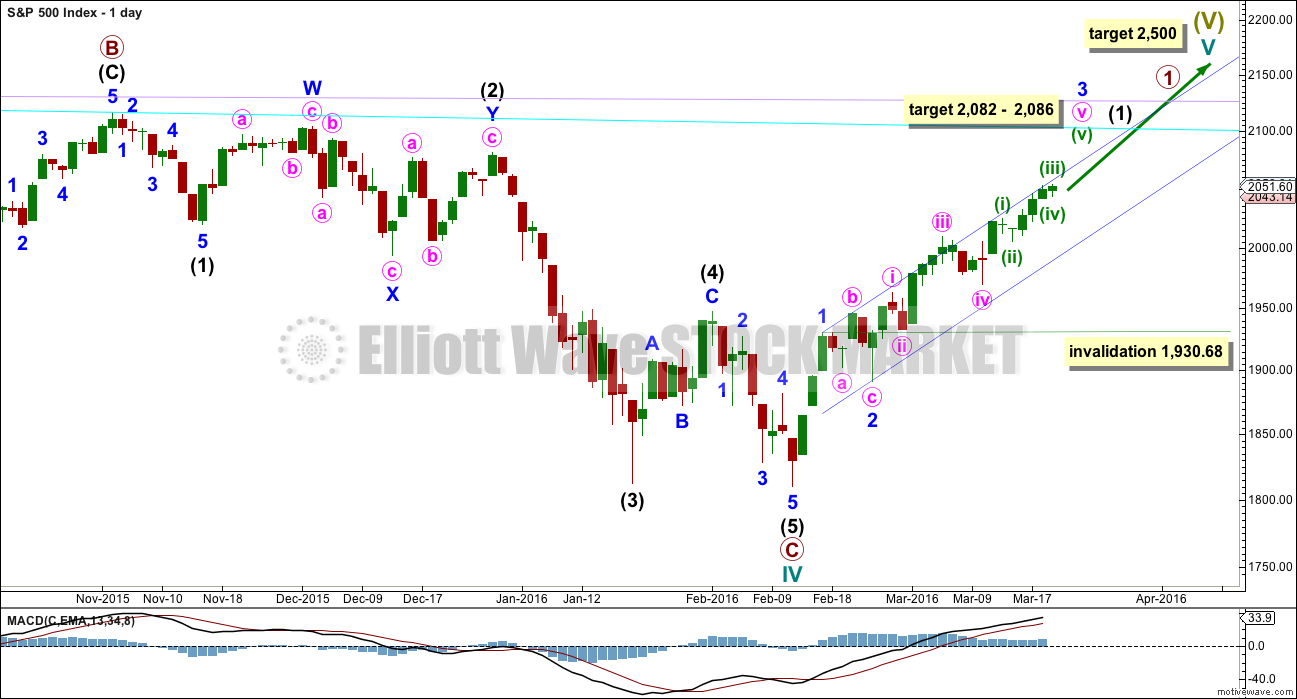
The short / mid term target for minor wave 3 is exactly the same as the short / mid term target for the bull wave count. A-B-C of a zigzag and 1-2-3 of an impulse both subdivide 5-3-5. The labelling within this upwards movement of each subdivision is the same for both wave counts.
When it arrives minor wave 4 downwards may not move into minor wave 1 price territory below 1,930.68.
Intermediate wave (C) does not have to move above the end of intermediate wave (A) at 2,116.48, but it is likely to do so to avoid a truncation. If it is truncated and primary wave 2 is a rare running flat, then the truncation is not likely to be very large. As soon as price is very close to 2,116.48 this wave count looks at the possibility of a trend change.
The next wave down for this wave count would be a strong third wave at primary wave degree.
A bull market trend line for this rally is drawn across the first two small swing lows as per the approach outlined by Magee. This upwards sloping cyan line may provide support for corrections along the way up.
A target for minor wave 3 is added. At 2,086 minor wave 3 would reach 1.618 the length of minor wave 1. At 2,082 minute wave v would reach equality in length with minute wave iii. This gives a 4 point target zone calculated at two degrees, so it has a reasonable probability.
HOURLY CHART
Click chart to enlarge.
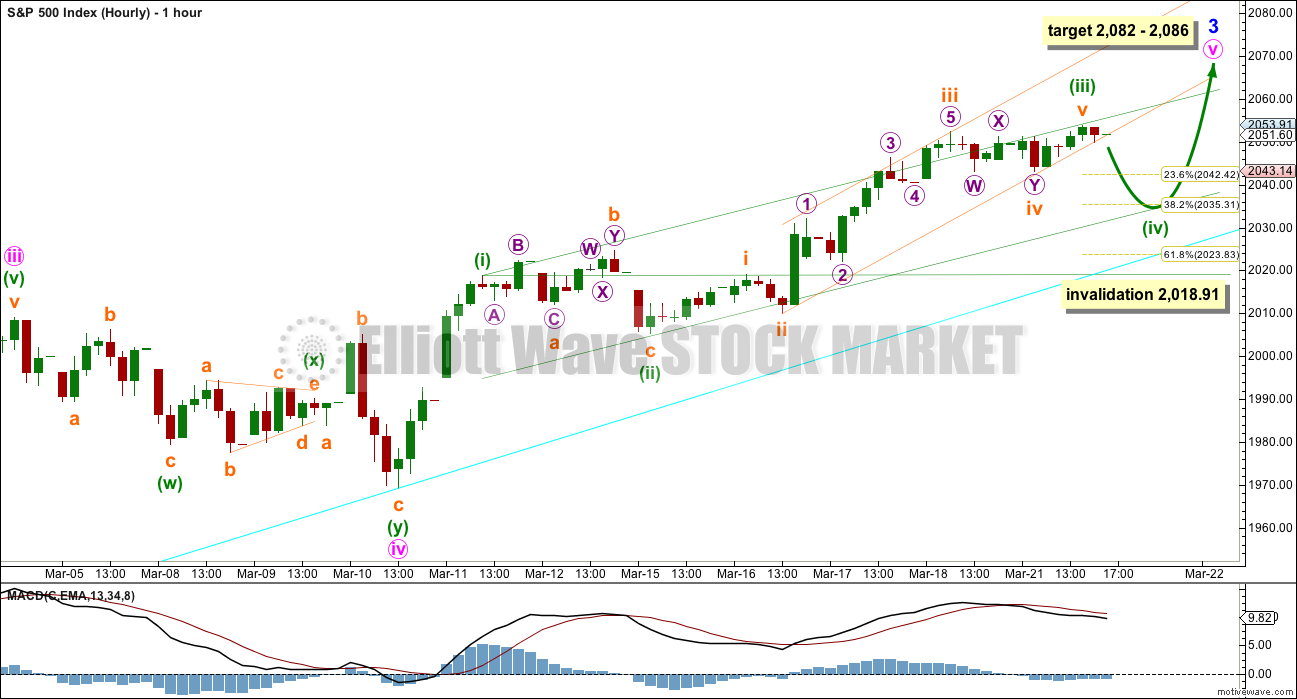
Subminuette wave iv may have begun Monday’s session by moving sideways to complete a combination. This subdivides as a zigzag – X – flat on the five minute chart, which provides alternation with the single zigzag of subminuette wave ii.
On the five minute chart, the upwards wave labelled subminuette wave v subdivides as an ending contracting diagonal. If this is a fifth wave (and not a first wave leading diagonal), then minuette wave (iii) may be over, falling short of the target for it to end at 2,057.
Ratios within minuette wave (iii) are: there is no Fibonacci ratio between subminuette waves i and iii, and subminuette wave v is 0.78 points longer than 0.236 the length of subminuette wave iii.
If minuette wave (iii) is over at Monday’s high, then it is 0.98 points short of equality with minuette wave (i). Because a third wave may never be the shortest within an impulse, this will limit minuette wave (v) to no longer than equality with minuette wave (iii) which is 48.68 points in length.
Minuette wave (ii) was a shallow 0.28 expanded flat correction. Given the guideline of alternation, minuette wave (iv) may be expected to be most likely a zigzag and most likely deeper. If it ends close to the 0.382 Fibonacci ratio, it may find support at the lower edge of the Elliott channel drawn here in green.
If minuette wave (iv) ends within the price territory of the fourth wave of one lesser degree, it would be very shallow; the 0.146 Fibonacci ratio at 2,046 lies within the range of 2,052.36 to 2,043.
This analysis expecting a correction for minuette wave (iv) relies upon the structure of an ending contracting diagonal for subminuette wave v as seen on the five minute chart. This requires some trend channel confirmation with a breach of the lower edge of the small orange channel containing minuette wave (iii) here on the hourly chart before confidence may be had that a correction to last about one to three days has begun.
Minuette wave (iv) may not move into minuette wave (i) price territory below 2,018.91.
BULL ELLIOTT WAVE COUNT
WEEKLY CHART
Click chart to enlarge.
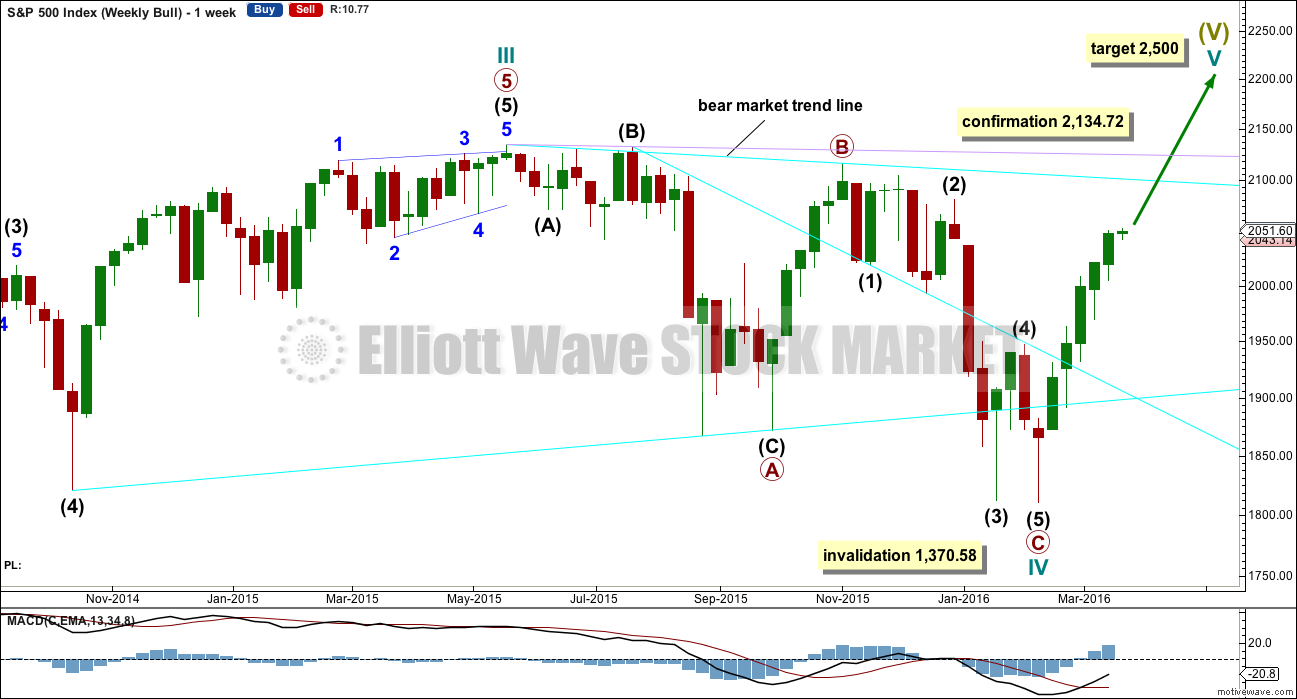
Cycle wave II was a shallow 0.41 zigzag lasting three months. Cycle wave IV may be a complete shallow 0.19 regular flat correction, exhibiting some alternation with cycle wave II.
At 2,500 cycle wave V would reach equality in length with cycle wave I.
Price remains below the final bear market trend line. This line is drawn from the all time high at 2,134.72 to the swing high labelled primary wave B at 2,116.48 on November 2015. This line is drawn using the approach outlined by Magee in the classic “Technical Analysis of Stock Trends”. To use it correctly we should assume that a bear market remains intact until this line is breached by a close of 3% or more of market value. In practice, that price point would be a new all time high which would invalidate any bear wave count.
This wave count requires price confirmation with a new all time high above 2,134.72.
While price has not made a new high, while it remains below the final bear market trend line and while technical indicators point to weakness in upwards movement, this very bullish wave count comes with a strong caveat. I do not have confidence in it.
DAILY CHART
Click chart to enlarge.
Upwards movement cannot now be a fourth wave correction for intermediate wave (4) as price is now back up in intermediate wave (1) territory above 2,019.39. This has provided some clarity.
For the bullish wave count, it means that primary wave C must be over as a complete five wave impulse.
Intermediate wave (2) is seen as an atypical double zigzag. It is atypical in that it moves sideways. Double zigzags should have a clear slope against the prior trend to have the right look. Within a double zigzag, the second zigzag exists to deepen the correction when the first zigzag does not move price deep enough. Not only does this second zigzag not deepen the correction, it fails to move at all beyond the end of the first zigzag. This structure technically meets rules, but it looks completely wrong. This gives the wave count a low probability.
If the bull market has resumed, it must begin with a five wave structure upwards at the daily and weekly chart level. So far that is incomplete.
At 2,088 minor wave 3 would reach 1.618 the length of minor wave 1. Within minor wave 3, at 2,086 minute wave v would reach 1.618 the length of minute wave iii. This gives a two point target zone calculated at two wave degrees which should have a reasonable probability.
Minor wave 4 may not move into minor wave 1 price territory below 1,930.68.
TECHNICAL ANALYSIS
DAILY CHART

Click chart to enlarge. Chart courtesy of StockCharts.com.
Volume data on StockCharts is different to that given from NYSE, the home of this index. Comments on volume will be based on NYSE volume data when it differs from StockCharts.
Volume for Monday is lower than all immediately prior upwards days. The upwards movement in price is not supported by volume, so the trend is weak.
ADX is still increasing indicating the market is trending. Price has been moving in a trend for 26 days now. ATR continues to decline, more normal of a consolidating market and not a trending market. There is something wrong with this trend; it is not normal.
RSI has not yet reached overbought. There is still room for price to rise a little further until RSI is first overbought and then exhibits some divergence with price.
Stochastics is still overbought, but this oscillator may remain extreme for some time during a trending market.
The 200 day moving average is still pointing down. This indicates that price is more likely in a bear market than a bull market. Even if the 200 day MA turns up this alone will not be enough to confirm a new bull market. In November 2015 the 200 day MA turned slightly up and yet price subsequently made new lows. The direction of the 200 day MA is given some weight, but only in conjunction with other indicators. Price is the ultimate determinator.
ADVANCE DECLINE LINE
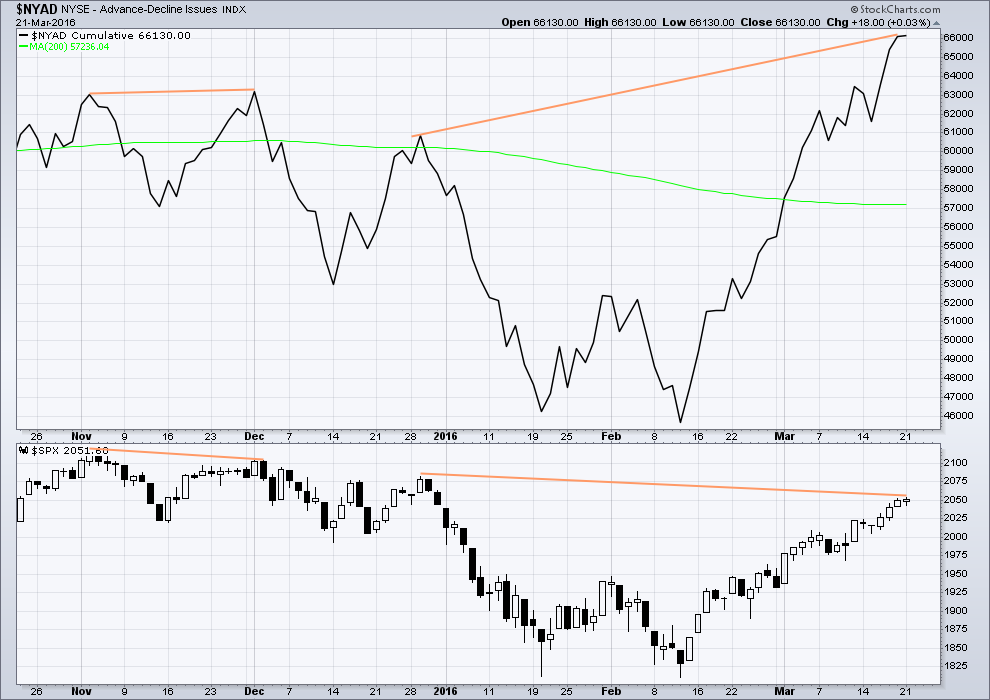
Click chart to enlarge. Chart courtesy of StockCharts.com.
The Advance Decline line shows no short term (day to day basis) divergence with price. With the AD line increasing, this indicates the number of advancing stocks exceeds the number of declining stocks. This indicates that there is breadth to this upwards movement.
Longer term, looking back over the last five months, there are two cases of hidden bearish divergence between price and the AD line.
From November 2015 to December 2015 the AD line made a new high while price failed to make a corresponding high. This indicated weakness in price and preceded new lows for price.
Now again from 29th December, 2015, to now the AD line is making new highs but price has so far failed to also make corresponding new highs. This again is an indication of weakness in price. Despite price rising with market breadth increasing, the breadth increase is not translating to substantial rises in price.
It remains to be seen if price can make new highs beyond the prior highs of 29th December, 2015. If price can manage to do that, then this hidden bearish divergence will no longer be correct, but the fact that it is so strong at this stage is significant. The AD line will be watched daily to see if this bearish divergence continues or disappears.
The 200 day moving average for the AD line is now flat. Even if the 200 day MA points up this alone would not be enough to indicate a new bull market. During November 2015 the 200 day MA for the AD line turned upwards and yet price still made subsequent new lows.
DOW THEORY
I am choosing to use the S&P500, Dow Industrials, Dow Transportation, Nasdaq and the Russell 2000 index. Major swing lows are noted below. So far the Industrials, Transportation and Russell 2000 have made new major swing lows. None of these indices have made new highs.
I am aware that this approach is extremely conservative. Original Dow Theory has already confirmed a major trend change as both the industrials and transportation indexes have made new major lows.
At this stage, if the S&P500 and Nasdaq also make new major swing lows, then my modified Dow Theory would confirm a major new bear market. At that stage, my only wave count would be the bear wave count.
The lows below are from October 2014. These lows were the last secondary correction within the primary trend which was the bull market from 2009.
These lows must be breached by a daily close below each point.
S&P500: 1,821.61
Nasdaq: 4,117.84
DJIA: 15,855.12 – close below on 25th August 2015.
DJT: 7,700.49 – close below on 24th August 2015.
Russell 2000: 1,343.51 – close below on 25th August 2015.
This analysis is published @ 10:09 p.m. EST.
Here’s a short term hourly chart.
Minuette (iv) may be completing as an expanded flat. Subminuette b = 1.19 X subminuette a, nicely within normal range of 1 – 1.38.
At 1,135 subminuette c = 1.618 X subminuette a. Also the 0.382 Fibonacci ratio of minuette (iii).
This is the target. It would see an overshoot of the Elliott channel, so if the target is wrong it may be a little low.
As soon as subminuette c is below subminuette a at 2,040.57 avoiding a truncation then look out for it to end.
Considering how extreme sentiment has become, I was trying to see if I could envision us being in the final wave up. Of course a minor four correction could alleviate some of the bullish extreme but it sure seems as if momentum has been visibly slowing. If we are not done with minor three yet UVXY will certainly go into teenage wasteland…WART Pete T. of The Who…:)
Transports also sporting double dojis…
So I’m going to update my old chart of the leading diagonal idea.
What if the main bear count is wrong? What else could be happening? What if this rally ends sooner than that count expects? What if the trend line on DJIA stops upwards movement in the indices here?
A leading diagonal would now have to be expanding. This is not a common structure, whereas the second wave expanded flat idea for the main bear count is a very common structure.
So based on probability of structure this idea would have to have a lower probability.
So far it fits. The diagonal must be expanding because 3 is longer than 1. Which means 4 must be longer than 2 to meet the rules for wave lengths of diagonals.
It fits with subdivisions; can see 3 down as a zigzag which is nice. That fits well.
4 must be longer than 2, so it must end above 2,059.57 (that is equality with 2). And the trend lines must diverge.
4 may not move beyond the end of 2. Invalidation of this idea above 2,116.48.
Leading diagonals may not have truncated fifth waves so 5 must move below 1,810.10.
I don’t think it has a very typical look though, 3 didn’t move very far below 1. But this is a valid alternate. I think I’ll have to again publish it daily. More charts to digest!
How interesting! For this count, we would again be seeing UVXY extremes during a fourth wave correction, just as we did last August. Talk about volatility signals entering a brave new world!
with this possibility,, could it perhaps explain why when we were reaching down into the lows, volatility wasnt spiking like we expected?
Yes.
But I think the main bear count does that better; a new low for a B wave should have something off. Something not right. Something unusual…
The new leading diagonal still sees that last low as a third wave. Momentum did make a slight new low below the first wave, but not by much.
Gotta say – I like this count more than the idea of Primary 2 moving sideways.
Time will tell – I’m happy to take either as the (initial) trade setups are very similar.
Thanks for your hard work sniffing out Alt’s Lara!
You’re welcome.
I kinda prefer it too. I imagine if the main bear count is right we shall have a very anxious finish to intermediate (C). If it makes a new high above (A) at 2,116.48 every man and his dog will be crying “new bull market” and “the bear is dead”.
To be bearish in the face of that would be very hard.
To be bearish so close to the all time high would be nerve wracking.
This alternate leading diagonal would avoid some of that stress.
But then, we can like it or not, the market will do what the market will do. My job is to see as many alternates as possible, discard the ones that look wrong, and rank the remainder in probability.
VIX up today so the masses are expecting a pullback. UVXY saying they expect it to be short lived. I have not seen too many instances of this sort of divergence but it certainly says no one expects a lasting trend reversal…
I think minuette wave (iv) is currently completing an expanded flat correction, now in C down.
For C to not be truncated it needs to move below A at 2,040.57.
As soon as price gets below that point then minuette wave (iv) could be over.
This is a very short term outlook for the next few hours.
Looking at the daily chart I still expect more upwards movement to complete minor 3. And the larger picture still needs intermediate (C) to get as close as possible to intermediate (A) at 2,116.48, preferably at least slightly above to avoid a truncation.
Looks to me, Prechter’s dramatic alert notwithstanding, that we are going higher. Everything about today’s action looks corrective so I am not sure what got him so excited. Of course, it would not be the first time that he was mistaken! 🙂
I didn’t really understand your discussions on Mr P.
Was his urgency a suspected top?
EDIT – I just saw Lara’s answer below!
DJIA is right up at its bear market trend line.
Will this mean that S&P can’t go higher? If DJIA has to turn here because of that line?
I’m going to have to take a close look today at the structure of this upwards wave for the bear count. But no matter how I look at the subdivisions of it I keep coming up against the truncation. I just don’t think it could be truncated by a whopping 60 points. That’s just a ridiculous suggestion.
So if my bear count is correct price must keep going up for a while yet.
What else could be happening with the bear? I’m running out of alternates!
Trying to see another idea now with only one coffee this morning 🙁
Chart
Get Cesar to pop across to the shop for a case of Red Bull 😉 LOL
LOL
No junk food for me. I’m living in Paradise on clean sea air, drinking NZ rainwater. Coffee is my major addiction and I have to keep it in check. One double shot latte a day for now.
Do houses there typically have cisterns built when they pour the foundation? That’s the way we do it in the BVI and for folk who have never enjoyed rainwater, they don’t know what they are missing .
Only rural and small towns. We don’t have a reticulated water supply in Mangawhai.
We put in huge tanks, one or two, when we build houses here. And collect rainwater from the roof.
So sounds a bit different, the tank isn’t in the foundation its normally off to the side of the house. It takes up a fair amount of space in the yard actually. Though I have seen one built into the basement. Still sitting up from the ground though.
SOP in the islands instead of a basement. Sometimes folk will even expand it off to the side as you mentioned and make a nice elevated patio!
got some Starbucks caffe verona in the pot for you all, red bull is not good for you,, especially in a bear market
Red Bull wasn’t around when I was at Uni – so we used to *eat* coffee during exam fortnight to stay awake whilst revising – true story!
Gosh – how I miss those days – Not!! 🙂 🙂
geez Olga,, eating coffee and vodka eye shots, you are a party animal
Yeah… but not always in that exact same order Doc 😉
Ah yes. I remember No Doze, caffeine pills.
They never seemed to help much though. Just made me jittery.
I remember stage III Zoology (hated it) getting stuck on the first chapter, fish, all night. Never did get past fish. Not sure how I managed to pass that exam. Maybe the No Doze did its job? Who knows. Just glad I never have to study for another exam again.
personally never had to study much,, its nice being so brilliant. hee hee. just kidding of course. if I were so brilliant I would have fiqured out this EW by now
LOL
I don’t think you need to be brilliant, just good at seeing patterns and following rules. Which actually makes me sound rather dull.
It’s easy for me. And I’m constantly amazed that the very experienced members here (more market experience than me and much better traders) pay me to do your EW analysis. I really don’t know why you don’t all do it yourselves.
That’s okay. I’m stoked to do it. I think it’s fun.
Hyuk! Hyuk!
We have the makings of an engulfing candle in the works; it remains to be seen whether bullish or bearish…
We have yet another 52 week low in UVXXY and what may be a triple bottom at around 22. The bullishness regarding future market price is remarkable. I was hoping for a final spike down toward 20 but that is looking less likely. If it clears 25 today I don’t think we’ll see it. We will still get a sharp correction after the pop but it looks like a low is in.
EDIT – just noticed you said ‘clears 25 *today*’ – yeah I agree with that. We shouldn’t get close to that today if the count is progressing as planned.
Not saying you’re wrong (as Lara’s count may have progressed further down the road than we think), but I have us currently finishing Minor 3 (approx 2082 target), which should make UVXY dip further, then we should get a deeper correction for Minor 4, which will probably make UVXY spike a little – 25 (possibly greater), before another final blast higher to finish he count.
So in conclusion it might be worth being mindful that there might be one more ‘cry wolf’ on the part of UVXY before the big one.
That said, there is no reason not to get in on the action on the off chance that Minor 4 keeps going down and enters Minor 1 territory (at which point a trend change is confirmed).
If we get another 5 up towards 2082 target, then show a reversal pattern, I’ll be taking a position for the ride down in Minor 4 with the intent of selling as close to Minor 1 as possible (albeit that would take us out of the lower trendline so I’ll be watching for completion well before those depths).
Hope that makes sense (all kinda does in my head 🙂 )
Sure does, and your reasoning mirrors mine exactly. True reversals in UVXY take no prisoners and the next reversal should print a fat green one. Would not be at all surprised to see it hit 20 with perhaps a slight penetration if Lara’s main count plays out. I just love it when those stink bids get filled and show a 50% intraday gain! 🙂
I was thinking mid teens as the market should be quite a bit higher than here by the time Minor 5 is over, albeit it makes sense that UVXY would start to see divergence with price before the turn, so it might not go as low as I am thinking.
Suppose it depends how many weak hands the MM’s want to shake out of their UVXY position
In any case, if the count is correct then UVXY downside should now be fairly limited.
Yep! I was also thinking a possible fifth wave truncation would see UVXY take off off the lows like a bat out of hell, or as you say, diverge from price at the end. (sorry Meatloaf!)
I still remember getting my hiny truncated last August…not pleasant! 🙂
I am taking the quick pop on those calls and selling for 0.88. SPX stalling after filling this morning’s gap.
OK I read that interim report and he is certainly not calling for a wave E down as much as pointing out that it is a possibility. The point of the report was that he thinks a reversal is at hand. I therefore stand corrected as regards my prior comments, at least on this point. I quite agree that this upward move is very close to termination.
All he describes is the E wave in this 8:00AM update… with the possibility that it may be a more bearish option if it occurs by mid April. Otherwise it implies that it was and E wave down.
The way it’s worded sounds like he is leaning towards E down. It is certainly an E down by his wording if the Feb low is NOT taken out by mid April according to this update. So he is putting a time limit on what this all has been. A determination one way or another.
He definitely favors the triangle, but at least he is acknowledging that a more bearish option exists. Steve seems to be finally charting his own course, so to speak, and I think has the more likely count (with a top in) in his analysis. I have been wondering about the time frame as crashes generally come in the fall. We may have a very big wave one of three down followed by a protracted, several months long intermediate two of primary three up. I expect the next move up will give the formal kiss goodbye to the 200 dma before the plunge
In his last update 3-14 if Feb low taken out… he is calling it a 3 wave down with 2 or D ending now. Today he says E down to start within hours with no mention of 3 wave down, except to say a more bearish decline is possible if Feb low taken out by mid April…. not sure where your getting 1 of 3 down??? No mention of that anywhere in this or previous reports in last several months.
I am referring to Lara’s count. I have no confidence whatsoever in Prechter’s calls. It seems to me the overwhelming weight of evidence, including sentiment, points to a high degree top right now. His comment about news and an E wave down in my opinion applies more powerfully to news and a primary wave down, which I have heard linked before.
He did explicitly state previously that taking out Feb’s lows eliminates the triangle…perhaps you missed it…
Today the SPX 200DMA is at 2017.43 on the daily charts??? so I don’t get your comment.
There is NO rule that says a big decline has to occur in the Fall.
Don’t sweat it. This is what happens when I start thinking out loud. 🙂
He also said in the previous interim report that if the wave two count was correct it should turn down in about a week. He began today’s interim report by citing his prior call for a reversal in a week and saying that time was now, but did not reiterate it being confirmatory of the wave two count. I am not sure why he omitted the prior stated connection.
Prechter is a very bright guy but he really can get obsessed once he gets an idea in his mind. He frequently ends up taking very adamant positions on matters that are really open to question, and has trouble admitting when he is wrong. The fact that he is now, after all these years of being relentlessly bearish, finally seeing a bullish triangle in DJI makes me want to run as fast as I can in the opposite direction! We will see if he is right but I for one am sticking with Lara’s main count. 🙂
That is why I made this comment…
So Lara’s comments about this changing the minds of Bears is exactly what is occurring.
FYI… EWI, the man himself, calling for a reversal within hours in an alert put out at 8:00AM today. To finish an E wave down for 1000 to 1500 pts. in DJIA. A deeper decline remains possible for now through mid April. After that the deeper decline option will diminish. Provided no charts in this update. So I am just figuring out the puzzle.
So it sounds like down in an E then up to a new all time high. But this can still be the end of 2 with 3 down next with confirmation of a 3 if Feb low is taken out by mid April.
The way it’s worded today, it sounds like he is leaning toward E down then up.
Just thought I would put this out here for comments.
So Lara’s comments about this changing the minds of Bears is exactly what is occurring.
Yeah, I can see the possibility of an expanding triangle now to move strongly in E down.
My problem with that is it is the rarest of all Elliott wave structures. In my eight years of daily EW analysis I think I have only ever seen two or three, which were definitely in hindsight expanding triangles.
An expanded flat is a very common structure. And it fits perfectly. Why consider the rarest structure when one of the most common also fits? It makes no sense to me.
But, to be fair, the outcome is the same.
It’s only the structure; an expanded flat now needs C down which subdivides as a five.
An expanding triangle now needs E down which subdivides as a three, a zigzag.
Speculative trade on SPY 204.5 calls expiring this week. Filled at 0.7 per contract.
Looking for UVXY to approach 20 and hope to roll proceeds from calls into volatility call options. GTC STC at 1.50
Lara–is it possible to estimate how low a fourth wave correction will go?
“In the short term, the target for a larger interruption to the trend (a fourth wave which may last about five sessions) may arrive about 2,082 – 2,086. “
I’ve given two estimates in the analysis.
1. To exhibit alternation with a very shallow second wave this fourth wave may be deeper, the 0.382 Fibonacci ratio is about 2,036. This would provide some alternation. This would also see the fourth wave find support at the Elliott channel.
2. To end within the fourth wave of one lesser degree this fourth wave may be very shallow, the 0.146 Fibonacci ratio is about 2,046.
I cannot tell you which target is the one that will be met.
And I’ve just realised that your question relates to minor wave 4, not this minuette (iv) which I expect to begin tomorrow.
Minor 4 may end within the fourth wave of one lesser degree, but this looks like it may be too low.
The acceleration channel is the best guide. Minor 4 should end when price finds support at the lower edge.
Thanks.
Am I first?!? You guys are slipping 🙂
I think they’re tired of watching the paint dry.