
Upwards movement continues as expected.
Summary: This is still a bear market rally until proven otherwise. A short term target for Monday is 2,057. This rally is reasonably likely to end above 2,116.48, but it cannot make a new all time high. In the short term, the target for a multi day interruption to the trend (a fourth wave which may last about five sessions) may arrive about 2,082 – 2,086. Use the new cyan line for this upwards movement for support along the way up.
To see last published monthly charts click here.
To see how each of the bull and bear wave counts fit within a larger time frame see the Grand Supercycle Analysis.
To see detail of the bull market from 2009 to the all time high on weekly charts, click here.
New updates to this analysis are in bold.
BEAR ELLIOTT WAVE COUNT
WEEKLY CHART
Click chart to enlarge.
This bear wave count fits better than the bull with the even larger picture, super cycle analysis found here. It is also well supported by regular technical analysis at the monthly chart level.
Importantly, there is no lower invalidation point for this wave count. That means there is no lower limit to this bear market.
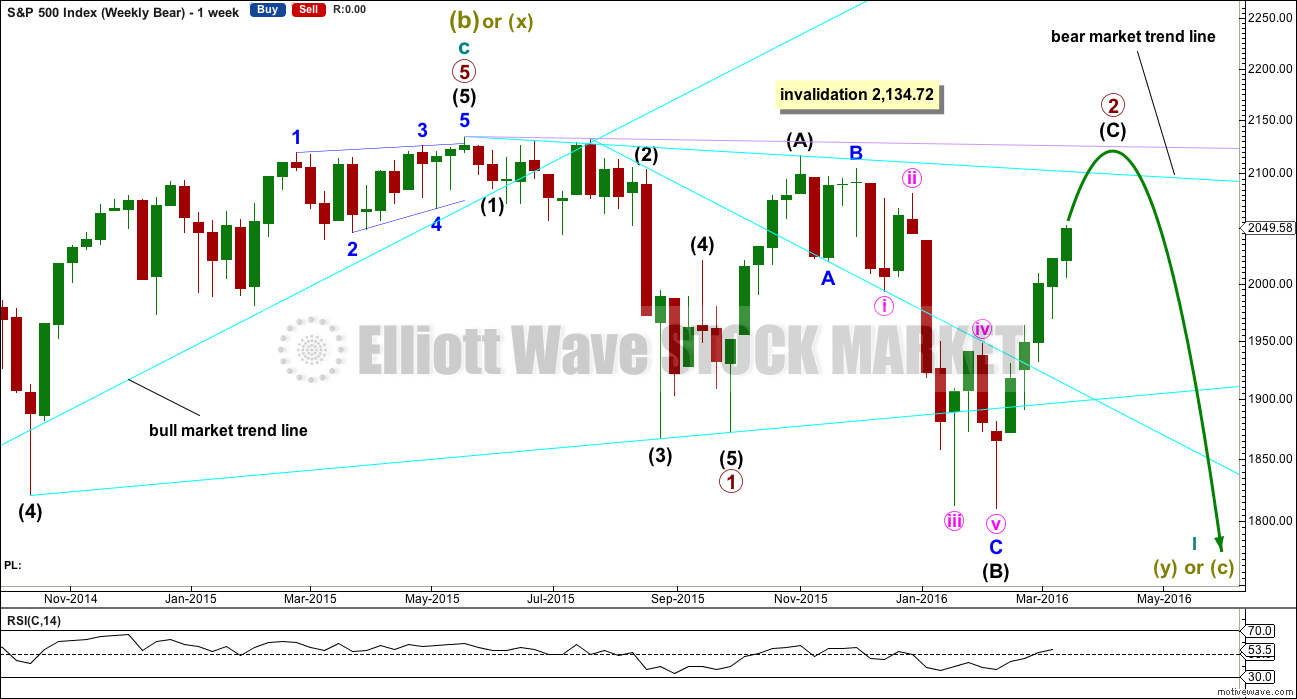
Primary wave 1 may be complete and may have lasted 19 weeks, two short of a Fibonacci 21. So far primary wave 2 is in its 23rd week. It looks unlikely to continue for another 11 weeks to total a Fibonacci 34, so it may end in about two to five weeks time. This would still give reasonable proportion between primary waves 1 and 2. Corrections (particularly more time consuming flat corrections) do have a tendency to be longer lasting than impulses.
Primary wave 2 may be unfolding as an expanded or running flat. Within primary wave 2, intermediate wave (A) was a deep zigzag (which will also subdivide as a double zigzag). Intermediate wave (B) fits perfectly as a zigzag and is a 1.21 length of intermediate wave (A). This is within the normal range for a B wave of a flat of 1 to 1.38.
Intermediate wave (C) is likely to make at least a slight new high above the end of intermediate wave (A) at 2,116.48 to avoid a truncation and a very rare running flat. However, price may find very strong resistance at the final bear market trend line. This line may hold price down and it may not be able to avoid a truncation. A rare running flat may occur before a very strong third wave down.
Primary wave 2 may not move beyond the start of primary wave 1 above 2,134.72.
DAILY CHART
Click chart to enlarge.
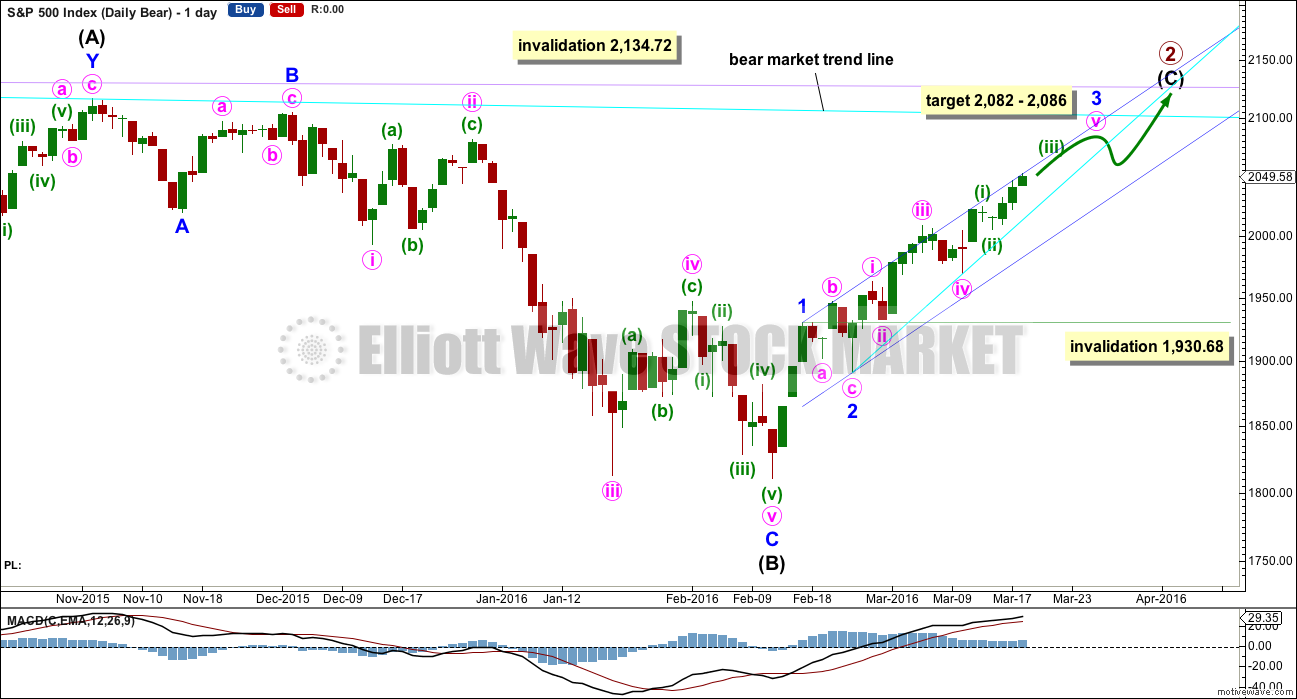
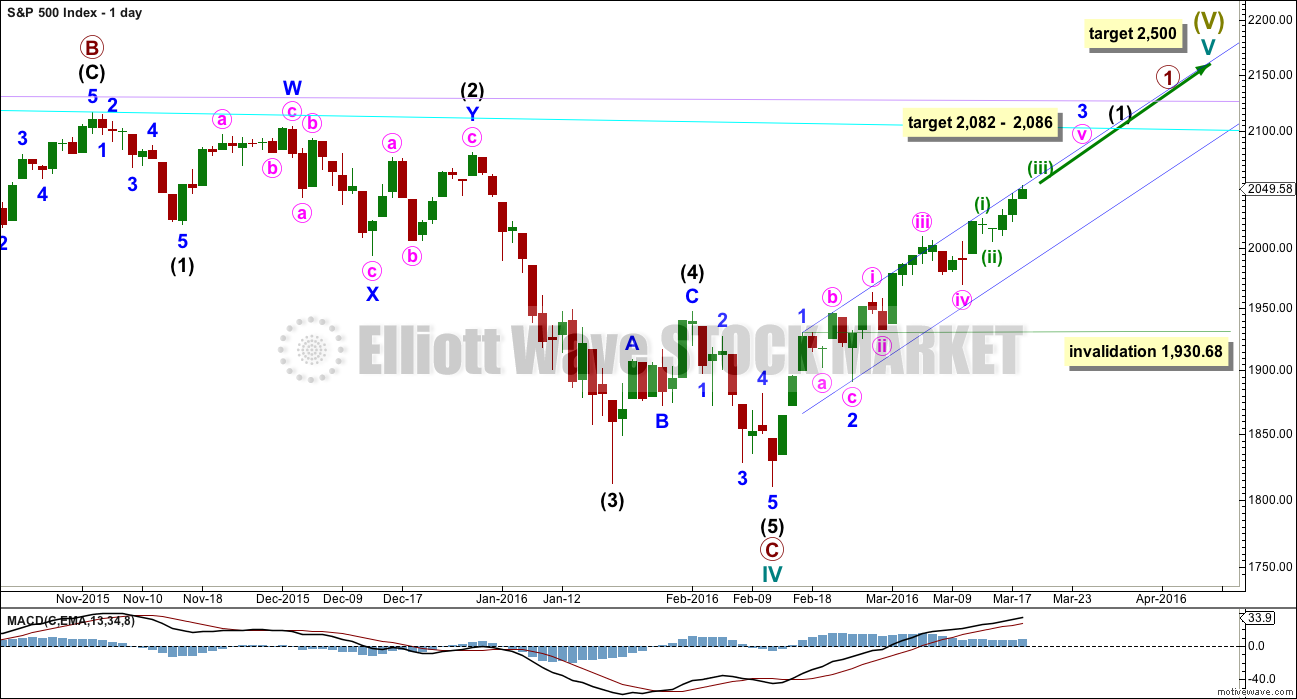
Intermediate wave (A) fits as a single or double zigzag.
Intermediate wave (B) fits perfectly as a zigzag. There is no Fibonacci ratio between minor waves A and C.
Intermediate wave (C) must subdivide as a five wave structure. It is not unfolding as an ending diagonal, so it must be unfolding as a more common impulse.
The short / mid term target for minor wave 3 is exactly the same as the short / mid term target for the bull wave count. A-B-C of a zigzag and 1-2-3 of an impulse both subdivide 5-3-5. The labelling within this upwards movement of each subdivision is the same for both wave counts.
When it arrives minor wave 4 downwards may not move into minor wave 1 price territory below 1,930.68.
Intermediate wave (C) does not have to move above the end of intermediate wave (A) at 2,116.48, but it is likely to do so to avoid a truncation. If it is truncated and primary wave 2 is a rare running flat, then the truncation is not likely to be very large. As soon as price is very close to 2,116.48 this wave count looks at the possibility of a trend change.
The next wave down for this wave count would be a strong third wave at primary wave degree.
A bull market trend line for this rally is drawn across the first two small swing lows as per the approach outlined by Magee. This upwards sloping cyan line may provide support for corrections along the way up.
A target for minor wave 3 is added. At 2,086 minor wave 3 would reach 1.618 the length of minor wave 1. At 2,082 minute wave v would reach equality in length with minute wave iii. This gives a 4 point target zone calculated at two degrees, so it has a reasonable probability.
HOURLY CHART
Click chart to enlarge.
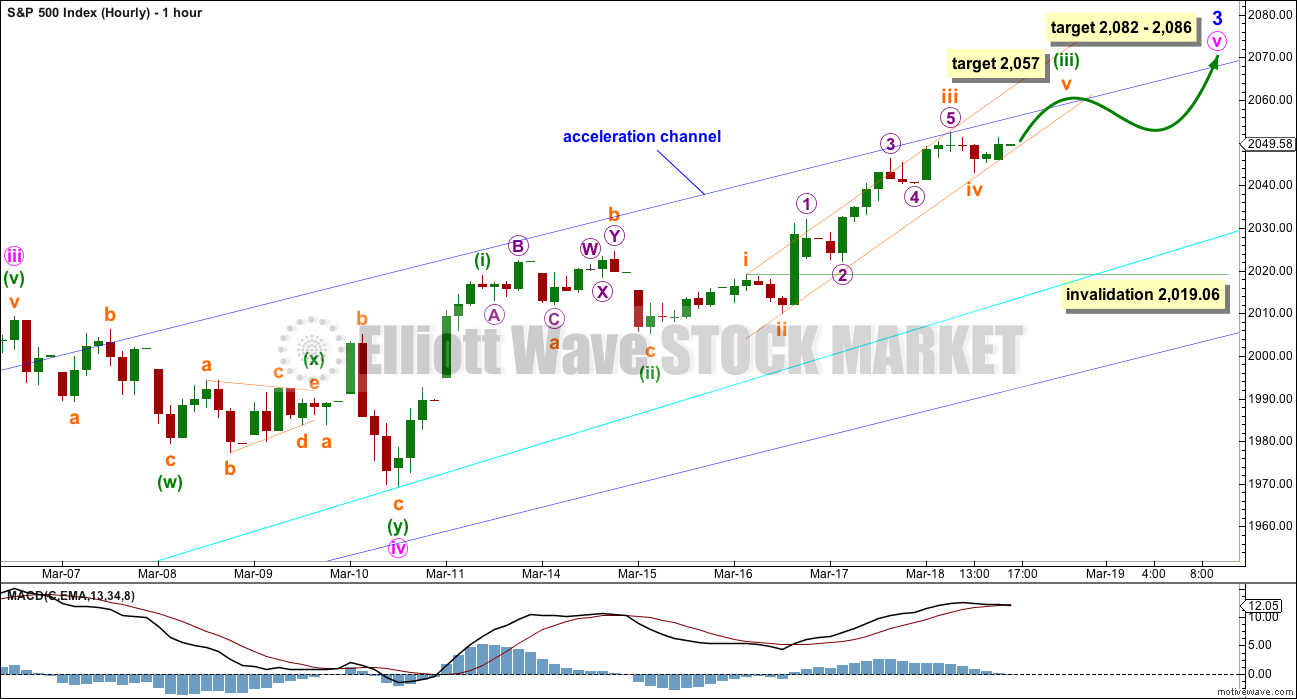
Subminuette wave iii looks complete. Ratios within it are: micro wave 3 is 2.1 points longer than equality in length with micro wave 1, and micro wave 5 has no Fibonacci ratio to either of micro waves 3 or 1.
There is no Fibonacci ratio between subminuette waves iii and i. This makes it more likely that subminuette wave v will exhibit a Fibonacci ratio to either of subminuette waves iii or i. The most common ratio is equality with subminuette wave i at 2,057.
If subminuette wave iv is not over and continues further, then it would most likely be sideways. It may not move into subminuette wave i price territory below 2,019.06.
As soon as subminuette wave v can be seen complete, then the invalidation point must move to the high of minuette wave (i) at 2,018.91. Minuette wave (iv) may not move into minuette wave (i) price territory.
Monday may print a green candlestick to complete subminuette wave v. Thereafter, minuette wave (iv) may show on the daily chart lasting one to three days of overall downwards movement.
The small orange channel about minuette wave (iii) should contain subminuette wave v which may find resistance at the upper edge. When this small channel is breached by downwards movement, that may indicate minuette wave (iii) is complete and minuette wave (iv) may have begun.
BULL ELLIOTT WAVE COUNT
WEEKLY CHART
Click chart to enlarge.
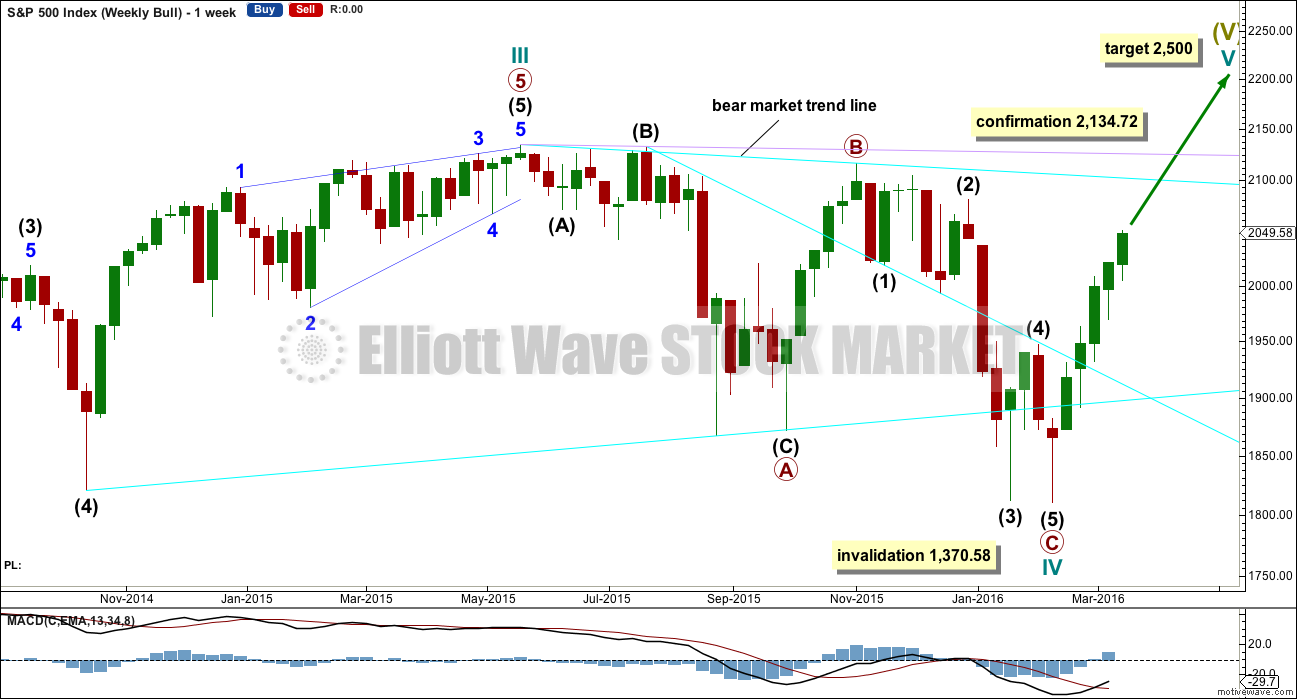
Cycle wave II was a shallow 0.41 zigzag lasting three months. Cycle wave IV may be a complete shallow 0.19 regular flat correction, exhibiting some alternation with cycle wave II.
At 2,500 cycle wave V would reach equality in length with cycle wave I.
Price remains below the final bear market trend line. This line is drawn from the all time high at 2,134.72 to the swing high labelled primary wave B at 2,116.48 on November 2015. This line is drawn using the approach outlined by Magee in the classic “Technical Analysis of Stock Trends”. To use it correctly we should assume that a bear market remains intact until this line is breached by a close of 3% or more of market value. In practice, that price point would be a new all time high which would invalidate any bear wave count.
This wave count requires price confirmation with a new all time high above 2,134.72.
While price has not made a new high, while it remains below the final bear market trend line and while technical indicators point to weakness in upwards movement, this very bullish wave count comes with a strong caveat. I do not have confidence in it.
DAILY CHART
Click chart to enlarge.
Upwards movement cannot now be a fourth wave correction for intermediate wave (4) as price is now back up in intermediate wave (1) territory above 2,019.39. This has provided some clarity.
For the bullish wave count, it means that primary wave C must be over as a complete five wave impulse.
Intermediate wave (2) is seen as an atypical double zigzag. It is atypical in that it moves sideways. Double zigzags should have a clear slope against the prior trend to have the right look. Within a double zigzag, the second zigzag exists to deepen the correction when the first zigzag does not move price deep enough. Not only does this second zigzag not deepen the correction, it fails to move at all beyond the end of the first zigzag. This structure technically meets rules, but it looks completely wrong. This gives the wave count a low probability.
If the bull market has resumed, it must begin with a five wave structure upwards at the daily and weekly chart level. So far that is incomplete.
At 2,088 minor wave 3 would reach 1.618 the length of minor wave 1. Within minor wave 3, at 2,086 minute wave v would reach 1.618 the length of minute wave iii. This gives a two point target zone calculated at two wave degrees which should have a reasonable probability.
Minor wave 4 may not move into minor wave 1 price territory below 1,930.68.
TECHNICAL ANALYSIS
DAILY CHART
Click chart to enlarge. Chart courtesy of StockCharts.com.
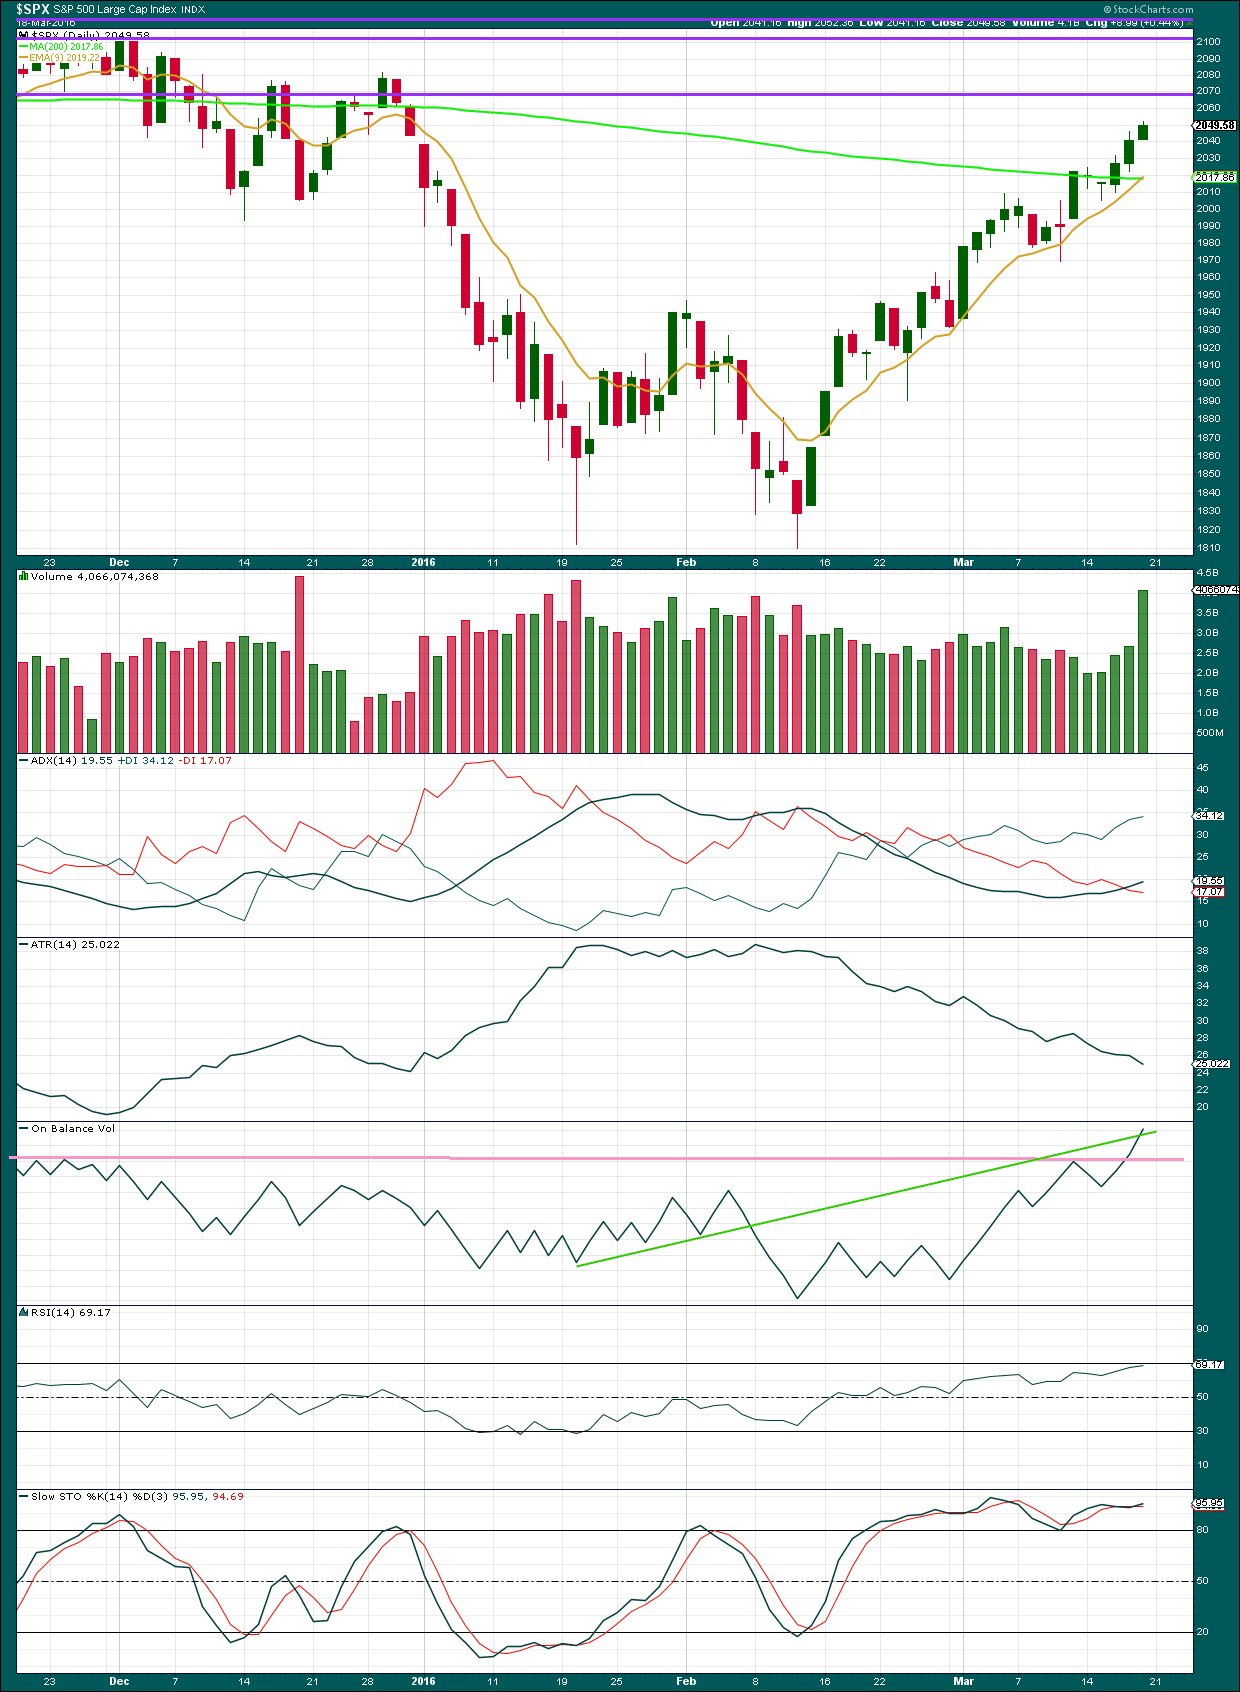
Volume data on StockCharts is different to that given from NYSE, the home of this index. Comments on volume will be based on NYSE volume data when it differs from StockCharts.
Friday was an expiration day for contracts on the S&P500, which accounts for a large portion of volume on this day. To put this into context it should be compared with other expiration dates and not with days immediately prior. Thank you to our member Joseph for pointing this out. I have used data from NYSE below.
The last three expiration dates and volumes for S&P500 from NYSE data are:
18th September 2015 – 787.23 mil (down day)
18th December 2015 – 737.83 mil (down day)
18th March 2016 – 669.42 mil (up day)
Each of these last three expiration dates have seen declining volume. Overall, this may be interpreted as a decline in interest in options. It is my judgement (and I may be wrong on this; if any members have a convincing reason why then please do share) that this is not necessarily a bearish indication, but it is also my judgement that it does not support a bullish market. If the rise in price is to be sustainable, it needs to come with an increase in activity and not a decrease.
ADX is still increasing: the +DX line is above the -DX line. There is a trend and it is up.
ATR still disagrees though. There is something wrong with this trend as it is coming with a decrease in trading range. This trend is suspicious, which supports the bear Elliott wave count.
On Balance Volume is breaking above the green trend line, another weak bullish signal. This upwards movement may be expected to continue.
RSI is nearing overbought. Only when RSI is overbought and then exhibits some divergence with price would I expect to see an end to this upwards trend. That is not the case today. There is further room for price to rise.
Stochastics is overbought, but this oscillator may remain extreme for reasonable periods of time during a trending market. It still exhibits divergence with price which is bearish, but I have learned to not rely much on divergence between price and Stochastics. It is a weak signal only. It warns that the upwards movement in price is weak but does not tell that an end must come here.
The 200 day moving average is still pointing down. This indicates that price is more likely in a bear market than a bull market.
ADVANCE DECLINE LINE
Click chart to enlarge. Chart courtesy of StockCharts.com.
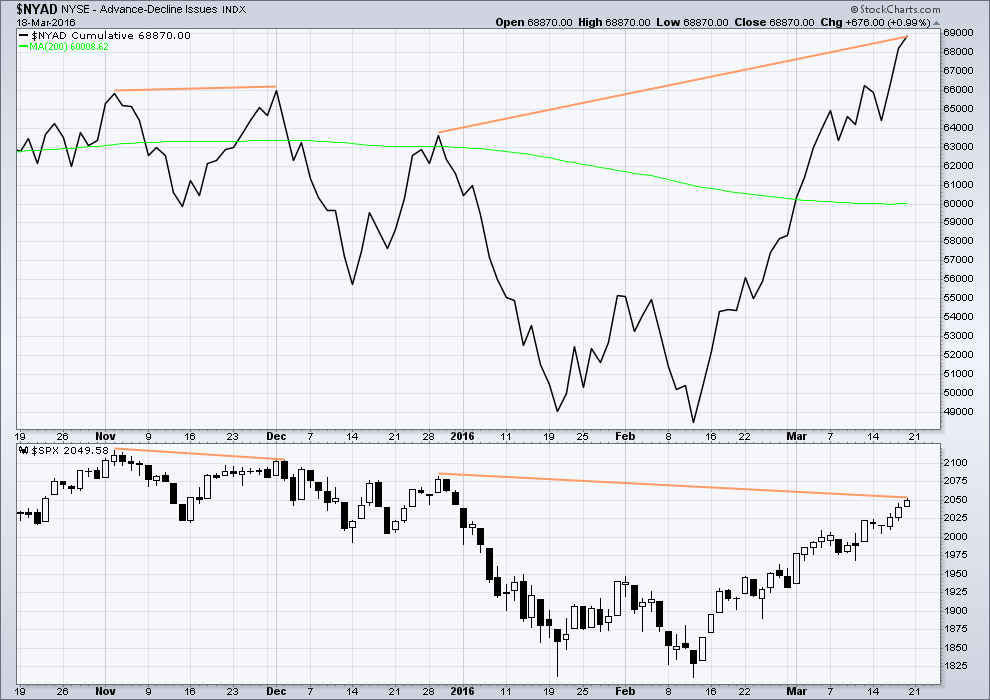
The Advance Decline line shows no short term (day to day basis) divergence with price. With the AD line increasing, this indicates the number of advancing stocks exceeds the number of declining stocks. This indicates that there is breadth to this upwards movement.
Longer term, looking back over the last five months, there are two cases of hidden bearish divergence between price and the AD line.
From November 2015 to December 2015 the AD line made a new high while price failed to make a corresponding high. This indicated weakness in price and preceded new lows for price.
Now again from 29th December, 2015, to now the AD line is making new highs but price has so far failed to also make corresponding new highs. This again is an indication of weakness in price. Despite price rising with market breadth increasing, the breadth increase is not translating to substantial rises in price.
It remains to be seen if price can make new highs beyond the prior highs of 29th December, 2015. If price can manage to do that, then this hidden bearish divergence will no longer be correct, but the fact that it is so strong at this stage is significant. The AD line will be watched daily to see if this bearish divergence continues or disappears.
The 200 day moving average for the AD line remains pointing down.
DOW THEORY
I am choosing to use the S&P500, Dow Industrials, Dow Transportation, Nasdaq and the Russell 2000 index. Major swing lows are noted below. So far the Industrials, Transportation and Russell 2000 have made new major swing lows. None of these indices have made new highs.
I am aware that this approach is extremely conservative. Original Dow Theory has already confirmed a major trend change as both the industrials and transportation indexes have made new major lows.
At this stage, if the S&P500 and Nasdaq also make new major swing lows, then my modified Dow Theory would confirm a major new bear market. At that stage, my only wave count would be the bear wave count.
The lows below are from October 2014. These lows were the last secondary correction within the primary trend which was the bull market from 2009.
These lows must be breached by a daily close below each point.
S&P500: 1,821.61
Nasdaq: 4,117.84
DJIA: 15,855.12 – close below on 25th August 2015.
DJT: 7,700.49 – close below on 24th August 2015.
Russell 2000: 1,343.51 – close below on 25th August 2015.
This analysis is published @ 05:26 p.m. EST on 19th March, 2016.
VIX sported its second close back above lower BB band after penetration last Thursday, generally a nice set-up. Look for at least one more spoof trade to drive UVXY sharply lower intra-day and dislodge the early birds, courtesy of the wily market makers. Any intra-day approach of the 20 area should provide a nice trigger; going below means back up the 18 wheeler. Stink bids locked and loaded! Now for the final jaunt higher. Keeping an eye on the action…(even when quiet ) Top O’ the evening! 🙂
This sideways movement now has subminuette iv as a flat correction. Subminuette ii was a quicker zigzag. Now there is perfect alternation. So that is an improvement to the short term wave count.
With a slight new high so far today it looks like subminuette v is underway.
The short term target remains the same at 2,057 for subminuette v = subminuette i. That is still the most likely target for minuette (iii) to end at.
No change to the analysis today effectively.
Another day watching paint dry. This market is so boring even Verne hasn’t shown up 🙂
I noticed it was a light posting day, personally I was swamped by an epidemic of “text neck”
China another issue… unpaid bills ….
http://bloom.bg/1nZwZUN
Hi Lara,
We are now at 25 days’ length for this primary 2 correction. Would you see the next fib number of 34 as a reasonable target for its completion?
I would, but a warning:
I have looked at the duration of recent waves from the all time high. Very few are exhibiting Fibonacci durations.
So we shouldn’t expect this one to.
Wave (C) has already exceeded the wave (A) high in this expanded flat correction for Dow Jones Composite Average Index.
And the DJIA is almost at its bear market trend line.
This rise and the last big multi week rise on DJIA both look very strongly like three wave moves… but then, this three up could turn into a five up to new highs. A-B-C of a zigzag looks and subdivides exactly the same way as 1-2-3 of an impulse.
RSI on DJIA only now reaching overbought. Now to see divergence.
FWIW, every single technical analysis report I have seen since mid last week is getting biased towards bull case in short term.
When they are all calling for new all time highs and the resumption of the bull market of the last 6+ years… then it will be ready to turn.
When all TA and fundamental analysts publicly and confidently state that the move down in all the indices was just a correction and its over… then we’re ready.
That should happen before a new ATH.
Yep! Bob Brinker of Money Talk was crowing this week-end about how he issued a buy alert to his subscribers at around SPX 1860, and bragging about the gains to date. 🙂
Hi Lara,
If there’s one thing I learned to hate over the many years of technical trading, it’s any government intervention related to fiscal policy. Especially all the QE injections!!
Just when you felt confident in placing the world’s best “short” trade, along comes the Federal Reserve with a pot of money to boost the market.
How does the EW sytem perform with government intervention and things like QE policy??
Thanks!
Kevin
Kevin,
In the long run these interventions don’t matter but short term will be an issue. Hence confirmations are important on the price. Eventually, all these interventions will be useless as investors will see through it.
Central bank interference in the markets. Nearly every cash injection resulted in a major move up. That’s what we are seeing now.
Full article:
Fork in the Road
http://northmantrader.com/2016/03/20/fork-in-the-road/
Government can only act with compliance of the majority of the population (when they lose our compliance that is when we tend to see revolutions). Government actions are part of social mood.
It is social mood that pushes markets up, and Government action is part of that push.
Think about this too Kevin. We have recently seen a bubble burst in the Chinese stock markets. On the way down as their market was crashing the Chinese government (effectively the Chinese Communist Party) did everything they could do to stop the fall in price. They pumped money in, they instructed regions to pump money in, they halted selling, they suspended trading, they implemented controls of money leaving the country…. and still price fell. The CCP will be as close to a God Of Markets as there ever will be. And they cannot stop the primary trend.
These markets are simply too big.
Governments or other very large players with very deep pockets can influence short term swings; they can make them move further and last longer than they otherwise would. But they simply cannot stop the primary trend.
I would like that idea (that Governments are “manipulating” the markets to do something the market would not otherwise do) to be finally put to rest with the example of the CCP and the Chinese stock markets.
Read too the examples of Jesse Livermore in “Reminiscences of a Stock Operator”. How he had deep pockets and could hold price up for a while, but as soon as his pockets were emptied price fell. If he tried to push a market against its least line of resistance every time he failed. A lesson he paid dearly for.
The markets fit nicely into Elliott wave patterns. Always have, and I have never seen price movement that doesn’t fit the highly restrictive rules for EW in a market that is big enough and liquid enough (individual equities don’t, they’re not big enough, indices do.) Government can make corrections deeper, or make an impulse extend, but they can’t change the primary structure / trend.
I’m hoping this move up from 1800 is not wave B (or X?) of Cycle Wave IV (albeit if it were then it would have the same problems as the other bullish count so is a very low probability). Not sure if this move up would even fit as a B wave (it def has some B wave personality – sneaky and dodgy (according to TA)). I cannot currently zoom out enough to see it is would still be in proportion with Cycle W II.
If it were then we could make a new high and then still crash down in wave C of Cycle IV. Maybe one for the (what if?) back burner – if we make new ATH and then start impulsing down.
Just thinking out of the box – how would Mr Market mess as many traders up as possible??
But then where does it end??? You can always make some count kinda work if you want to (which is obv where the right look comes in).
I would judge it very low prob – I can’t imagine how they could keep this circus going a few more years. Just throwing it out there on the ‘crazy’ pile – take it with a pinch of salt 🙂
But then – we’ve broken out of that very long held bull trendline.
I’ve already talked myself out of the possibility I think! 🙂
I’ll keep looking for a better bullish alternate.
It may exist.
I need to take the time to consider it.
I agree Lara. ‘What if’ so often can turn into reality. Any market can be propped up with enough QE.
True. It was propped up for over 6 years.
But then, this is another way to look at that.
The rise in price was supported overall by social mood. Everyone wanted to see a recovery after the GFC. And they didn’t care if the problems that led to the GFC weren’t fixed.
B waves. They have something wrong with them. This one fits so perfectly as a B wave. Not supported by volume at all. Highly suspicious.
I now understand the idea of government just being a part of the social mood as you mentioned in another comment today. Good point.
Here is another attempt at a wave count for the Russell 2000. I have changed the wave degree to show that primary wave 1 is complete. The triple zig zag is replaced with an abc pattern for the recent rally. What do you think?
I think it looks okay with the exception of where you have (B) within ((2)). Move it to the right, to the next swing low.
But then I’m trying to figure out what structure it would be. I think it may fit as a flat, and if A with the flat ends at the low you have currently labelled (B) then it would avoid a truncation and a rare running flat.
That looks much better. This is fun. 🙂 Thanks Lara!
Within (B) does C end below A? Or is it truncated?
Within (2) I think that the ((ii)) and ((iv)) are out of proportion. Maybe move ((i)) up to where you have ((iii)). That would mean a much deeper correction, but the proportions would look better.
But then I’ve not analysed RUT regularly. I don’t know what kind of proportions to expect for it.
If you think this is fun then you’re a life long member of The Elliott Wave Geek Club.
It’s a small but discerning membership 🙂
I like to join if you give out free EW decoder rings!
My propeller hat was spinning this morning. 🙂
Within (B), C was truncated, so I moved both (A) and (B).
Within (2), I like the look of this incomplete double zig zag.
Within Y, ((b)) looks like a triangle. With this wave count the correction is almost over. A drop below 1054.56 would provide early confirmation.
Here’s the revised chart.
Here’s the count with ((i)) within (2) moved up.
Why did you move (A) within ((2)) to the right? Move it back to the left? Was it because C was truncated?
If so then now you need to resolve how (A) subdivides. It doesn’t look right.
Both the single and double zigzag ideas work okay for your (2) so far.
What about having a double zigzag, with the first zigzag ending where you have ((i)) on this chart, and X being a triangle? I think that may have better proportions.
Sorry, just read your comment more carefully.
C wave truncated.
So now you have to resolve A.
Try it as an impulse, and the final fifth wave an ending diagonal.
check!