
A new high early in the session above 2,032.59 indicated more upwards movement was expected.
Summary: This is still a bear market rally until proven otherwise. This rally is reasonably likely to end above 2,116.48, but it cannot make a new all time high. In the short term, the target for a multi day interruption to the trend (a fourth wave which may last about five sessions) may arrive about 2,082 – 2,086. Use the new cyan line for this upwards movement for support along the way up.
To see last published monthly charts click here.
To see how each of the bull and bear wave counts fit within a larger time frame see the Grand Supercycle Analysis.
To see detail of the bull market from 2009 to the all time high on weekly charts, click here.
New updates to this analysis are in bold.
BEAR ELLIOTT WAVE COUNT
WEEKLY CHART
Click chart to enlarge.
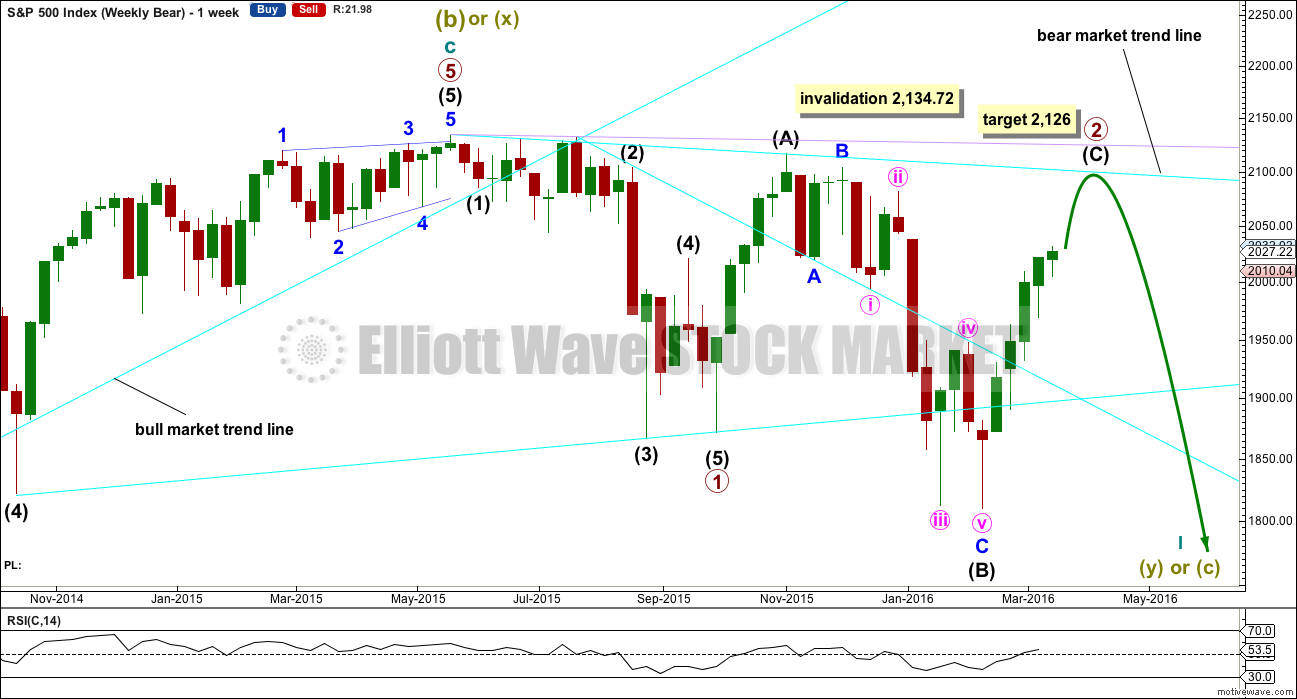
This bear wave count fits better than the bull with the even larger picture, super cycle analysis found here. It is also well supported by regular technical analysis at the monthly chart level.
Importantly, there is no lower invalidation point for this wave count. That means there is no lower limit to this bear market.
Primary wave 1 may be complete and may have lasted 19 weeks, two short of a Fibonacci 21. So far primary wave 2 is in its 23rd week. It looks unlikely to continue for another 11 weeks to total a Fibonacci 34, so it may end in about two to five weeks time. This would still give reasonable proportion between primary waves 1 and 2. Corrections (particularly more time consuming flat corrections) do have a tendency to be longer lasting than impulses.
Primary wave 2 may be unfolding as an expanded or running flat. Within primary wave 2, intermediate wave (A) was a deep zigzag (which will also subdivide as a double zigzag). Intermediate wave (B) fits perfectly as a zigzag and is a 1.21 length of intermediate wave (A). This is within the normal range for a B wave of a flat of 1 to 1.38.
Intermediate wave (C) is likely to make at least a slight new high above the end of intermediate wave (A) at 2,116.48 to avoid a truncation and a very rare running flat. However, price may find very strong resistance at the final bear market trend line. This line may hold price down and it may not be able to avoid a truncation. A rare running flat may occur before a very strong third wave down.
Primary wave 2 may not move beyond the start of primary wave 1 above 2,134.72.
DAILY CHART
Click chart to enlarge.
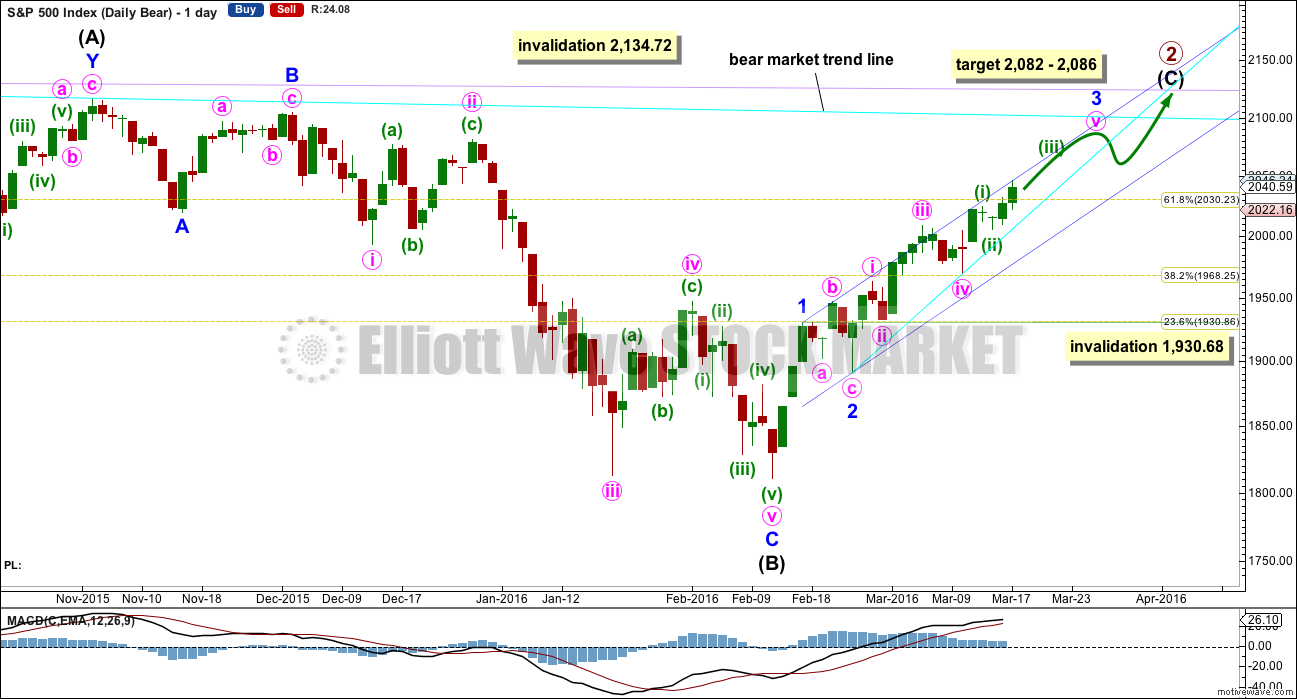
Intermediate wave (A) fits as a single or double zigzag.
Intermediate wave (B) fits perfectly as a zigzag. There is no Fibonacci ratio between minor waves A and C.
Intermediate wave (C) must subdivide as a five wave structure. It is not unfolding as an ending diagonal, so it must be unfolding as a more common impulse.
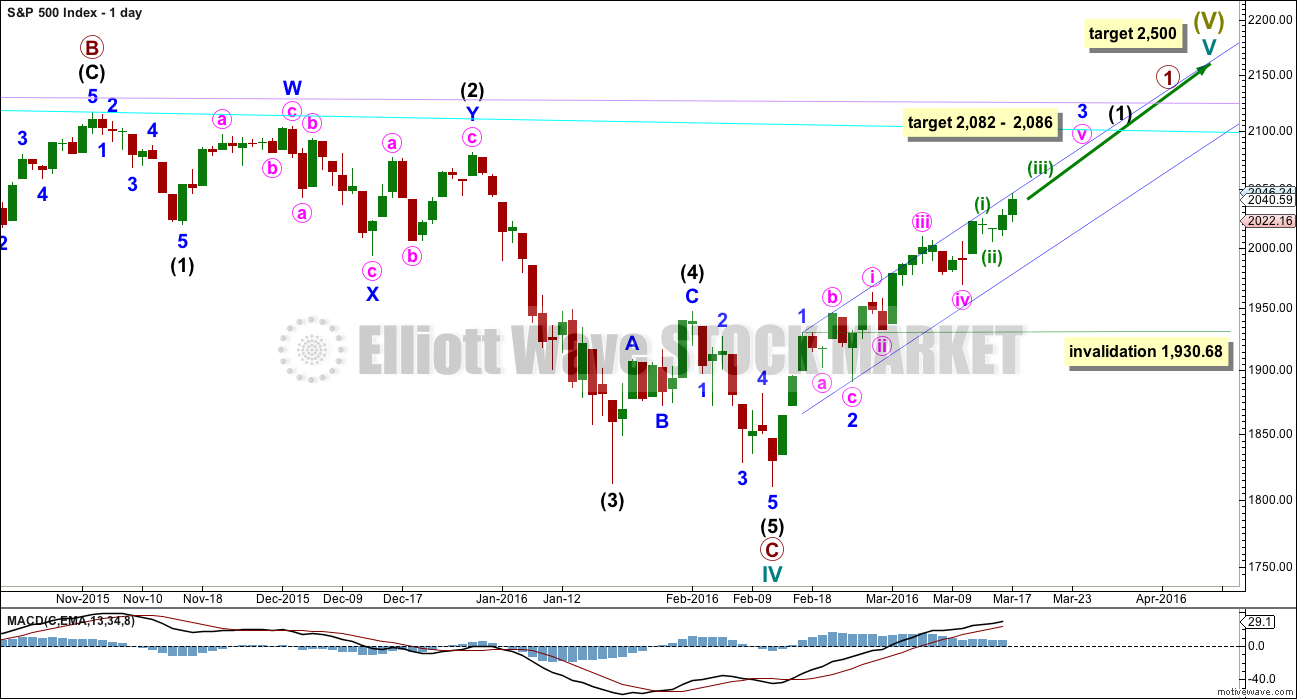
The short / mid term target for minor wave 3 is exactly the same as the short / mid term target for the bull wave count. A-B-C of a zigzag and 1-2-3 of an impulse both subdivide 5-3-5. The labelling within this upwards movement of each subdivision is the same for both wave counts.
When it arrives minor wave 4 downwards may not move into minor wave 1 price territory below 1,930.68.
Intermediate wave (C) does not have to move above the end of intermediate wave (A) at 2,116.48, but it is likely to do so to avoid a truncation. If it is truncated and primary wave 2 is a rare running flat, then the truncation is not likely to be very large. As soon as price is very close to 2,116.48 this wave count looks at the possibility of a trend change.
The next wave down for this wave count would be a strong third wave at primary wave degree.
With the short term labelling within intermediate wave (C) changed today to see minute wave v within minor 3 extending, the target for minor wave 5 can no longer be calculated. When minor wave 4 is complete, then a target will again be calculated. The expectation for now will be for price to move above 2,116.48 and to most likely end at either the cyan or lilac trend lines.
A bull market trend line for this rally is drawn across the first two small swing lows as per the approach outlined by Magee. This upwards sloping cyan line may provide support for corrections along the way up.
A target for minor wave 3 is added. At 2,086 minor wave 3 would reach 1.618 the length of minor wave 1. At 2,082 minute wave v would reach equality in length with minute wave iii. This gives a 4 point target zone calculated at two degrees, so it has a reasonable probability.
HOURLY CHART
Click chart to enlarge.
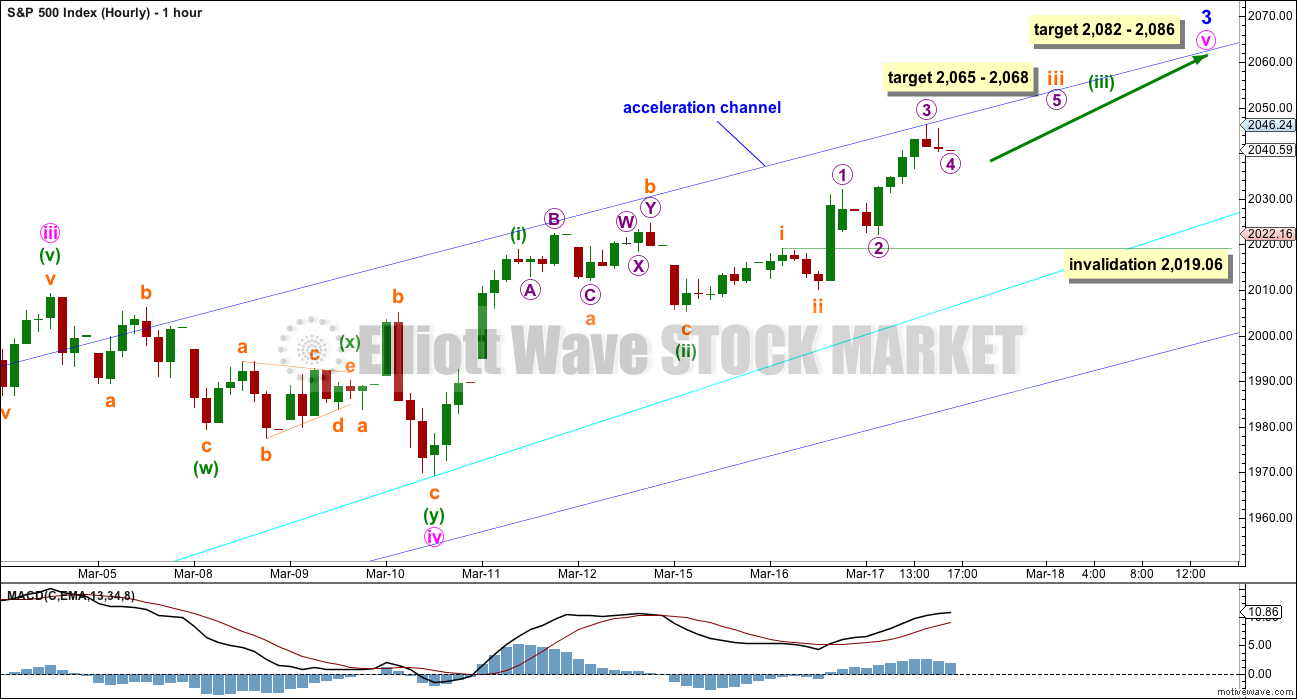
Upwards movement now fits best as an extending fifth wave for minute wave v. Minor wave 3 is incomplete.
Momentum is still weaker than within minor wave 1 (off to the left of the chart now). This third wave is weaker than the first, so when the fifth wave arrives it should be weaker still.
The acceleration channel should be redrawn as price continues higher. Draw it from the end of minor wave 1 to the last high, then place a parallel copy on the low of minor wave 2. When minor wave 4 finally arrives, it should find support at the lower edge of this channel if it gets down that low.
Within the middle of this extended fifth wave, subminuette wave iv may not move into subminuette wave i price territory below 2,019.06.
Subminuette wave iii has passed 1.618 the length of subminuette wave i. The high for Thursday at 2,046.24 is almost exactly 2.618 the length of subminuette wave i (it is just 0.01 point short). Yet the structure of subminuette wave iii is incomplete. At 2,068 subminuette wave iii would reach 4.236 the length of subminuette wave i, which is the next Fibonacci ratio in the sequence. At 2,065 micro wave 5 would reach equality in length with micro wave 3. This gives a 3 point target zone for a very short term interruption to the upwards trend.
The cyan line is copied over from the daily chart. Look for larger corrections along the way up to find support at this line.
BULL ELLIOTT WAVE COUNT
WEEKLY CHART
Click chart to enlarge.
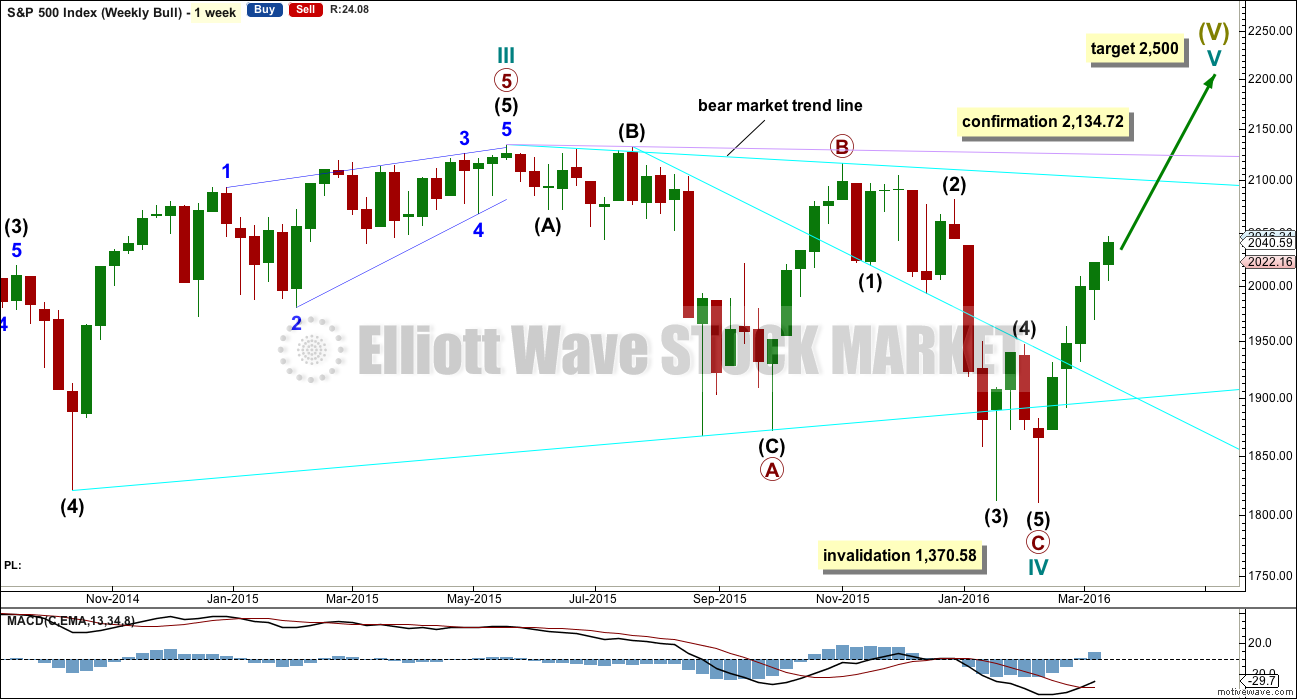
Cycle wave II was a shallow 0.41 zigzag lasting three months. Cycle wave IV may be a complete shallow 0.19 regular flat correction, exhibiting some alternation with cycle wave II.
At 2,500 cycle wave V would reach equality in length with cycle wave I.
Price remains below the final bear market trend line. This line is drawn from the all time high at 2,134.72 to the swing high labelled primary wave B at 2,116.48 on November 2015. This line is drawn using the approach outlined by Magee in the classic “Technical Analysis of Stock Trends”. To use it correctly we should assume that a bear market remains intact until this line is breached by a close of 3% or more of market value. In practice, that price point would be a new all time high which would invalidate any bear wave count.
This wave count requires price confirmation with a new all time high above 2,134.72.
While price has not made a new high, while it remains below the final bear market trend line and while technical indicators point to weakness in upwards movement, this very bullish wave count comes with a strong caveat. I do not have confidence in it.
DAILY CHART
Click chart to enlarge.
Upwards movement cannot now be a fourth wave correction for intermediate wave (4) as price is now back up in intermediate wave (1) territory above 2,019.39. This has provided some clarity.
For the bullish wave count, it means that primary wave C must be over as a complete five wave impulse.
Intermediate wave (2) is seen as an atypical double zigzag. It is atypical in that it moves sideways. Double zigzags should have a clear slope against the prior trend to have the right look. Within a double zigzag, the second zigzag exists to deepen the correction when the first zigzag does not move price deep enough. Not only does this second zigzag not deepen the correction, it fails to move at all beyond the end of the first zigzag. This structure technically meets rules, but it looks completely wrong. This gives the wave count a low probability.
If the bull market has resumed, it must begin with a five wave structure upwards at the daily and weekly chart level. So far that is incomplete.
At 2,088 minor wave 3 would reach 1.618 the length of minor wave 1. Within minor wave 3, at 2,086 minute wave v would reach 1.618 the length of minute wave iii. This gives a two point target zone calculated at two wave degrees which should have a reasonable probability.
Minor wave 4 may not move into minor wave 1 price territory below 1,930.68.
TECHNICAL ANALYSIS
DAILY CHART
Click chart to enlarge. Chart courtesy of StockCharts.com.
Volume data on StockCharts is different to that given from NYSE, the home of this index. Comments on volume will be based on NYSE volume data when it differs from StockCharts.
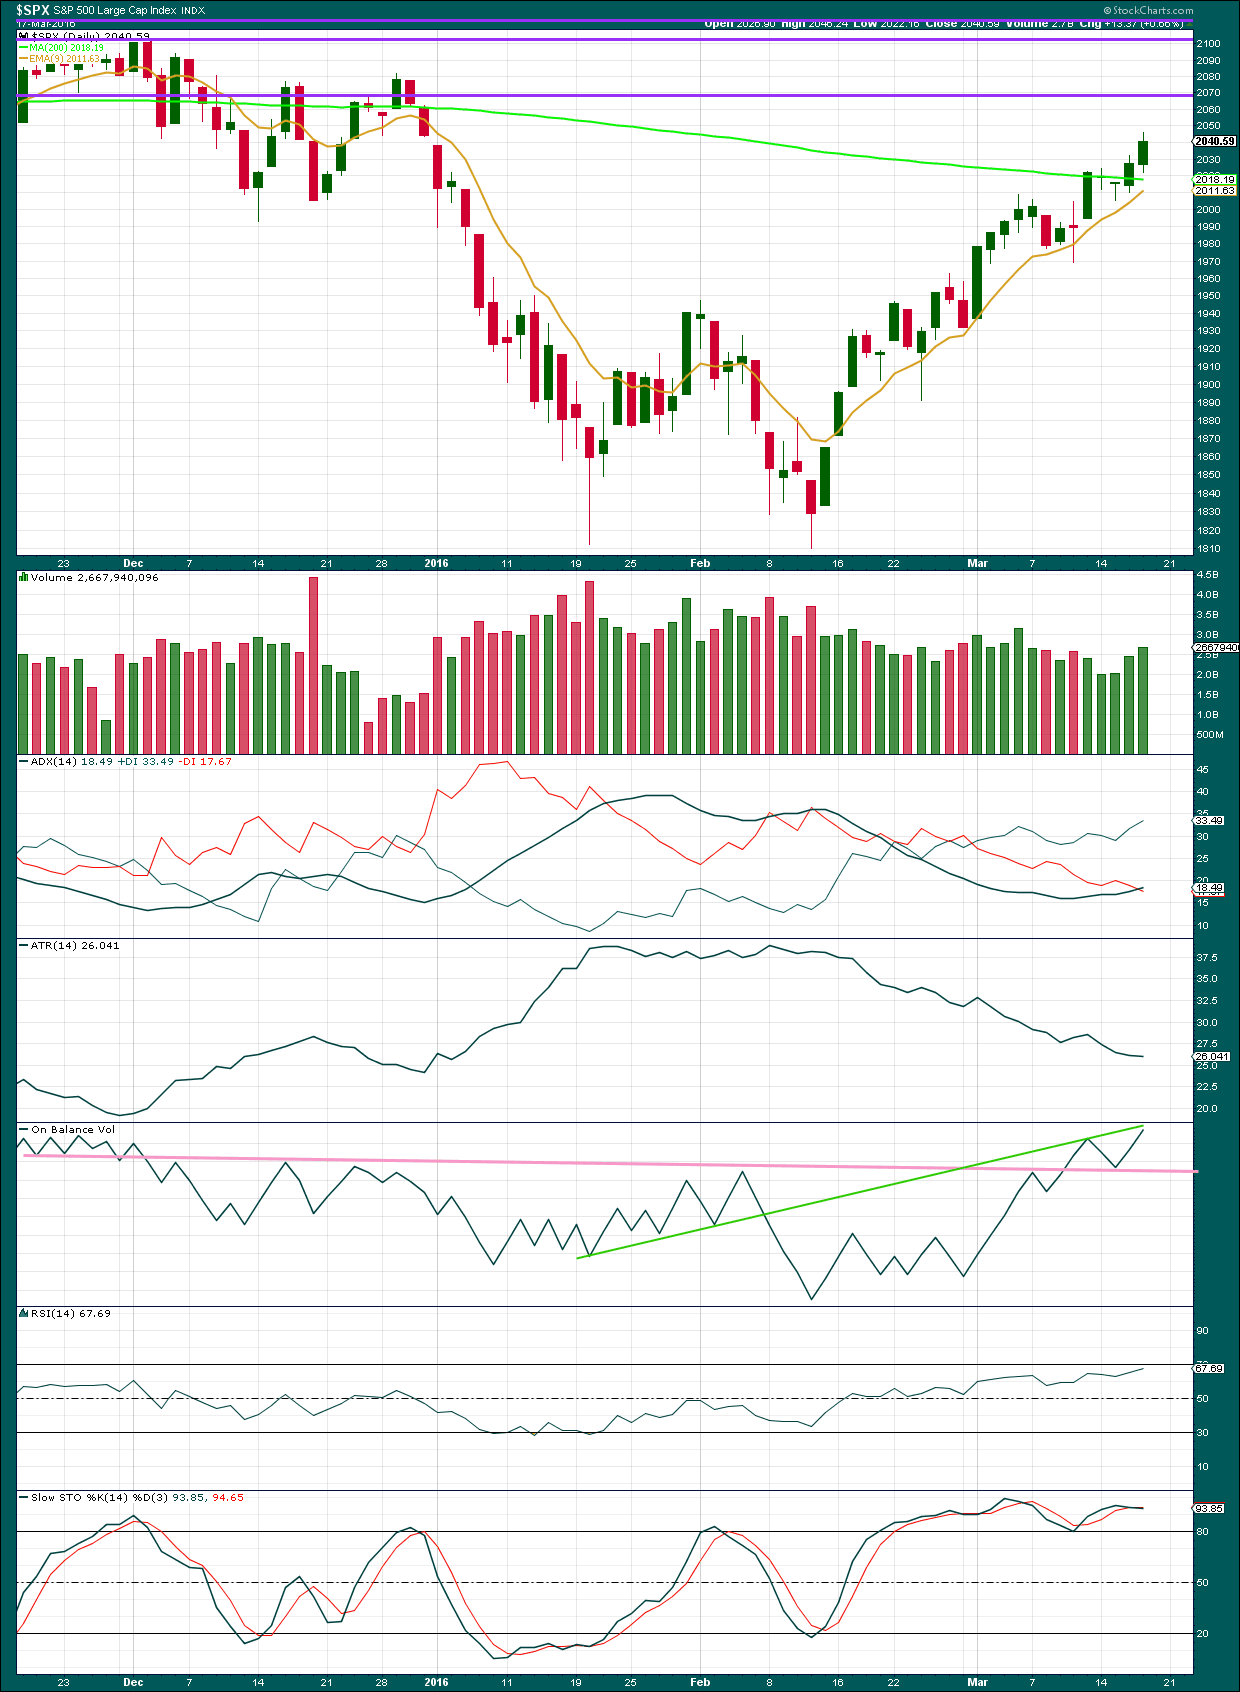
Price has now moved higher on increasing volume for two days in a row. The rise in price is supported by volume now and is again no longer suspicious at least short term. However, overall volume so far during this move upwards from the low on 11th February is coming on a decline in volume.
Along the way up, price is finding support about the 9 day EMA, with some overshoots.
The gap at 2,043 to 2,038 was closed today. This was the only gap remaining open on the way up to the all time high at 2,134.
Horizontal trend lines have been adjusted after looking left. The next line to offer reasonable resistance may be about 2,070 and thereafter about 2,100.
ADX is increasing and the +DX line is above the -DX line. There is a trend: it is up.
ATR continues to disagree though. There is something wrong with this trend. Normally a trend should see increasing range and strength. This trend is weak; range is decreasing so far.
On Balance Volume found support at the pink line and moved higher from there, strengthening that line. The next line, the green line, to offer some resistance to OBV is very close now. However, this line is somewhat steep, not very long held and has only been tested three times, so it does not offer strong technical significance. It may provide some resistance. If OBV breaks above the green line, that would be a bullish signal but not a strong one.
RSI is not yet overbought. There is room for price to rise further. I would not expect this upwards trend to be complete until RSI is extreme and then shows some divergence with price.
Stochastics is overbought, but in a trending market this oscillator may remain extreme for reasonable periods of time. It is showing some divergence with price. This is a weak bearish signal which I have found to not be very reliable.
ADVANCE DECLINE LINE
Click chart to enlarge. Chart courtesy of StockCharts.com.
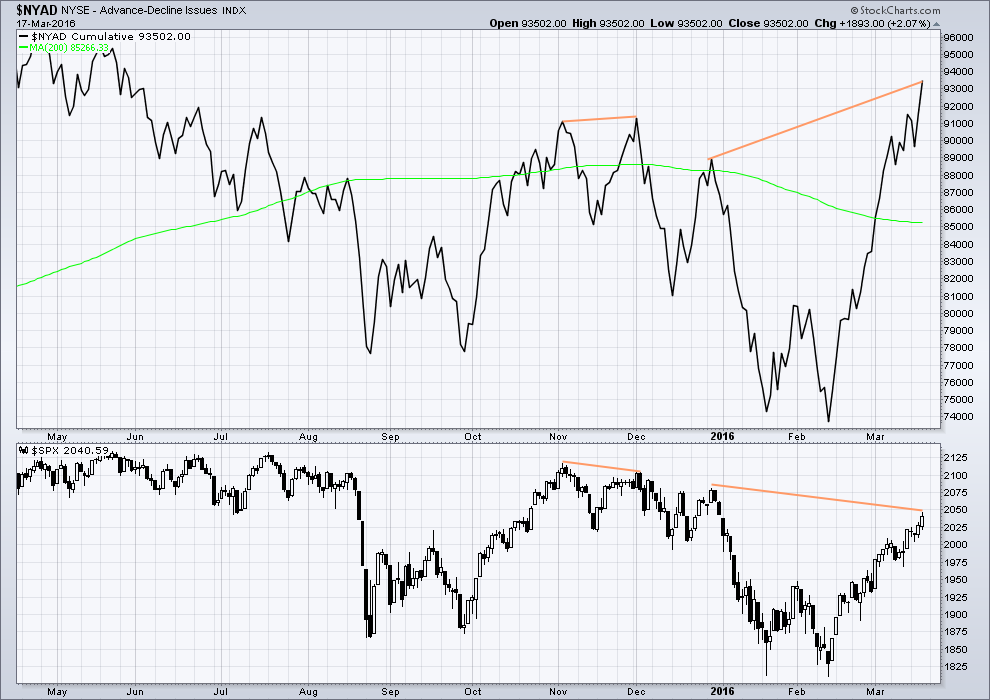
The Advance Decline line shows no short term (day to day basis) divergence with price. With the AD line increasing, this indicates the number of advancing stocks exceeds the number of declining stocks. This indicates that there is breadth to this upwards movement.
Longer term, looking back over the last five months, there are two cases of hidden bearish divergence between price and the AD line.
From November 2015 to December 2015 the AD line made a new high while price failed to make a corresponding high. This indicated weakness in price and preceded new lows for price.
Now again from 29th December, 2015, to now the AD line is making new highs but price has so far failed to also make corresponding new highs. This again is an indication of weakness in price. Despite price rising with market breadth increasing, the breadth increase is not translating to substantial rises in price.
It remains to be seen if price can make new highs beyond the prior highs of 29th December, 2015. If price can manage to do that, then this hidden bearish divergence will no longer be correct, but the fact that it is so strong at this stage is significant.
The 200 day moving average for the AD line remains pointing down.
DOW THEORY
I am choosing to use the S&P500, Dow Industrials, Dow Transportation, Nasdaq and the Russell 2000 index. Major swing lows are noted below. So far the Industrials, Transportation and Russell 2000 have made new major swing lows. None of these indices have made new highs.
I am aware that this approach is extremely conservative. Original Dow Theory has already confirmed a major trend change as both the industrials and transportation indexes have made new major lows.
At this stage, if the S&P500 and Nasdaq also make new major swing lows, then my modified Dow Theory would confirm a major new bear market. At that stage, my only wave count would be the bear wave count.
The lows below are from October 2014. These lows were the last secondary correction within the primary trend which was the bull market from 2009.
These lows must be breached by a daily close below each point.
S&P500: 1,821.61
Nasdaq: 4,117.84
DJIA: 15,855.12 – close below on 25th August 2015.
DJT: 7,700.49 – close below on 24th August 2015.
Russell 2000: 1,343.51 – close below on 25th August 2015.
This analysis is published @ 11:39 p.m. EST.
I keep discovering interesting clues to the significance of the current corrective top we are seeing. Porter Stansberry has pointed out that the latest five week decline in volatility (45%) is the greatest every recorded. In other words, the rate of decline speaks to a level of optimism regarding the future price of equities that is now at a historic high, absence of new market highs notwithstanding. The evidence for a primary two corrective top continues to mount. I expect a few more days of violent moves in volatility and will make some suggestions as to how to play it after the next update. The market makers are not stupid. They are fully aware of what’s coming and will be employing some very aggressive tactics to dislodge folk going long volatility early. They have in fact already started the assault. I personally believe we are looking at once-in-a-lifetime trading opportunities.
Thanks for the chart! We are probably going to see many more new records as this bear market progresses.
Final SPX Volume Today 1.732 Billion which is huge due to triple option expirations & rebalancing’s.
One interesting observation on the SPX volume on days like this…
Since the end of wave (3) down on the weekly bear count in August this triple expiration has the lowest volume of the last three major expirations & rebalancing’s.
9-18-2015 1.919 Billion SPX was down 32.17 this day
12-18-2015 1.804 Billion SPX was down 36.34 this day
3-18-2016 1.732 Billion SPX was up 8.97 today
Not sure what this all means technically but very interesting.
I think that technically it means there is weakness to this upwards movement.
Thanks for providing those figures Joseph. It lets me put Fridays volume in context, so I’ll use that in the analysis.
Which is being completed now.
This small retracement on the hourly looks like subminuette iv has arrived early.
That short term target 2,065 – 2,068 isn’t met.
The invalidation point remains the same at 2,019.06.
And a warning: if that invalidation point is breached by downwards movement then I’m wrong, and primary 3 arrival would increase in probability.
Along the way up looking to see this structure complete that will pretty much be what invalidation means.
Invalidation of the price point given on the daily chart will be substantial confidence that P3 is here.
For now, the wave count is unfolding pretty much as expected, with the exception of that short term target not working.
Thanks for this update… very helpful.
No worries.
And it looks like subminuette iv could possibly be over already.
Equally as likely it could continue sideways for another few hours to be a flat or triangle. That would provide better alternation with the zigzag of subminuette ii.
Subminuette ii lasted just three hours. Subminuette iv if it is over was two hours. If it continues would be maybe five or six hours.
Even probability.
The target at 2,082 – 2,086 for minor 3 to end remains the same.
Blowout Volume today… due to triple option expirations and S&P rebalancing + ETF’s rebalancing. That’s a ton of rebalancing going on.
Today’s Volume numbers will be misleading.
Okay, thanks for the heads up on that Joseph.
For example 1st 5 min trading 9:30 to 9:35AM volume was 347.333 Million in SPX and at the moment 770.739 Million.
+ Volume from 4:00 to 4:06PM will be huge.
Huge indeed! 1.732 Billion
Joseph,
Thanks, I almost forgot about the options expiration and was wondering why the volume is out of whack today.
Central Banks in SECRET pact to drive markets higher, story is gaining momentum..
http://www.marketwatch.com/story/did-central-bankers-make-a-secret-deal-to-drive-markets-this-rumor-says-yes-2016-03-18
I guess this is all part of the FED/Central Banks loosing credibility in the coming year(s)
Ris, this video nicely explains the conspiracy theories.
Now, I’m not saying there’s nothing to the idea that central banks are in agreement, and they probably are.
All I’m saying is the complaint that “the market is rigged” is such a common one and one I don’t buy. (I’m not saying that’s your complaint either, I’m only addressing it as a common refrain).
Central banks are part of the market. They can try to prop up price, and they can have an effect on the short and maybe even mid term trend, but they cannot effect the longer term trend.
When the Chinese stock markets crashed (and I don’t think they’ve finished yet) the Chinese Communist Party did all they could to stop it. They pumped in money, instructed regional authorities to pump in money, issued a ban on selling, closed the markets down… and still price fell.
The CCP will be as close to a God of Markets there ever will be. They have as much control as any authority will have over a market. And still they cannot stop a primary trend from following its course.
This is hysterically funny and illustrates the gullibility of the public at large. What on earth do they think central banks have been doing for the last seven years? Does anyone really think they ended QE just because they said so? Folks, the game is not only about manipulating markets, but more importantly, manipulating sentiment, and this is why they are ultimately doomed to failure.
Vern,
I guess it is more like a lottery for general population. If you are lucky, your time of need will coincide with times when things are on the up. But feel for folks who are retired (for last 7 years) or will retire soon and depend on fixed income. This ZERO interest rate has been a massive failure.
ZIRP has not only been a massive failure, it has been what is tantamount to financial terrorism and really qualifies in my view as financial criminality. It was absolutely stunning to hear Frau Yellen sit there and actually talk about now “exploring” NIRP. The dirty little secret is all the pension funds and annuities depending on an honest return to fulfill their future obligations that were forced into risky assets that are now going to blow up and leave them in even worse shape than a zero percent return. This is the great under-reported story of the coming great depression. Sad beyond imagining.
Here is an alternate wave count for SPX with the most recent rally a triple zig zag. Similar count for Nasdaq composite and Russell 2000 to follow. 🙂
Nasdaq Composite
Russell 2000
Thanks for the chart Thomas.
If Minor 4 (when it shows up) continues downwards without stopping then its a very valid case.
3 wave structures sit quite nicely within the trendlines from Feb lows – but it would still personally be my last resort (until Lara’s count invalidated) due to how rare they are.
You’re very welcome Olga. I am also using Lara’s bear wave count as my primary.
I don’t like it very much Thomas.
(2) has a truncated C wave.
Triple zigzags are very rare structures (I’ve only ever seen about four or five)
Those two factors reduce the probability of the count to very low.
I continue to observe volatility with great interest. A new 52 week low in UVXY was set today and it is making me smile as these don’t show up very often- almost as rare as rubies. We are now seeing extremes last seen in 2014. It seems to me the level of complacency that now exists in the markets argues for an impending wave down of very high degree. Personally, I am primed for primary three…have a restful and restorative week-end everyone! 🙂
Thanks for the feedback. I will scrap that count for SPX and find other solutions for Russell 2000 and Nasdaq Composite to replace the triple zig zag.
I like that count idea very much Thomas.
It is as viable as any other count until such times as price proves otherwise, so thanks v much for sharing, and I wouldn’t scrap it until something (like price) disproves it….
If you think about it, Elliott wave theory… well, is just a theory…
I like it, I use it, but it’s theory, and have yet to find anyone with a trading account over $(insert figure) M who has used EWT as their sole compass to get them there.
Just saying…
If you see it, trade it. If you don’t see it then you have no trade, and therefore no edge, and so then you are just being an ar*e and simply exist to provide liquidity for those who are smarter and prepared to work harder than you. Would be delighted for anyone to prove me wrong on anything I’ve said btw….
One way that traders now need to adjust their strategy is to note how the amplitude of the waves has changed. I think it is a mistake to pay too much attention to waves of lesser degree as both corrections and declines are becoming deeper. I think success going forward is going to be very much a function of recognizing the correct highest degree of the current wave and being on the right side of the trade early. If the next decline is in fact a primary wave, a lot of traders are going to get hurt trying to trade it as a wave down of lesser degree, just as those of us who mistook the current upward correction. Here’s hoping we’ve got the next impulse down pegged correctly- it would more than make up for any mis-steps with the current correction. I think it is almost over and have been steadily adding volatility calls on each pullback as of yesterday. 🙂
SPX is bumping up against major resistance, and sentiment is at an extreme. Momentum is also weak. Daneric’s wave count for this rally is almost complete.
http://danericselliottwaves.blogspot.ca
http://money.cnn.com/data/fear-and-greed/
I personally don’t have much faith in Daneric – he is basically a proxy for Mr H at EWI. I watched his counts turn out wrong for many years (probably because EWI was wrong for years).
You very rarely see him even consider alternate counts at higher degree. Notice he has no bullish alternate counts (or bearish ones) – and he won’t unless his current count is invalidated. This time you could argue that TA shows a bull count is not warranted, but previously it certainly did not.
His current gold count breaks EW ending diagonal rules (as does EWI’s – coincidence?).
Sign of a very bad / biased Elliottician imho (but he puts his (EWI’s?) counts out for free so what more can you ask for!)
BTW – I don’t have a clue about current EWI counts and don’t wish to open old wounds about these guys.
I just started following Daneric’s wave counts recently and wasn’t aware of his poor track record Olga. Thanks for sharing. I do like seeing alternate wave counts, which is one of the reasons I subscribe to Lara’s service.
I don’t think anyone (with experience) here regards EW as the only tool required to have trading success. That’s why Lara studies and comments on regular TA and often bases at least some of the probability equation on regular TA.
Personally when used with regular TA, I have not found anything that even comes close (which doesn’t mean something else is not better – I just haven’t found it).
Whatever you choose to use though, there is no such thing as the perfect trade imho. No risk no reward – albeit if I’m betting on a horse race I’d rather have as few horses running as possible (ideally one! 🙂 ).
A TOP in place at the hourly chart level with this one hour candlestick (11AM to Noon)?
We Shall See!
There are a few things that reliably signal an impending trend change. One of the most reliable is the bearish engulfing candle. With this kind of top I would not be surprised to see it engulf more than just the previous day.
Counter-intuitively, a high volume day with little upward movement can signal a distribution top. There is the well recognized doji, with its counterpart strong hammer on volatility measures like UVXY. Although not as definitive, target prices based on re-tracement fibs and/or fib relationships among waves can also be helpful and Lara’s guidelines in this regard can offer good price areas in which to look for a reversal.
There is of course the risk that this market may exhibit none of these tell-tale signs before exploding to the downside. I am happy to observe from a safe distance. 🙂
Before considering any of the foregoing, a clear five wave impulse down would of course be required as confirmation…
followed by a three up
of course 🙂
Of course…! 😉
A TOP in place at the SPX hourly chart level with these back to back one hour candlesticks (11AM to Noon & Noon to 1PM) and with this two hour candlestick (11AM to 1PM) ?
We Shall See!
This video does a good job showing the Fib time and price issues at play:
SPX caution flag is raised
http://www.fibonacciqueen.com/public/SPX-caution-flag-is-raised.cfm?utm_source=fqfreevideo&utm_medium=link&utm_campaign=mar18&inf_contact_key=a8446a622c6bdf323d0840696420cd45bc574a375f4cbebc9c2059742f2e0ba8
How long have you been following her and you thoughts on it?
If going back to April-May of last year how has this worked in conjunction with EW?
Thanks for the link. Some good observations there but she lost me when she said that the chart was still bullish (maybe she meant on a lower timeframe (from 1800 lows)??).
I’d also be interested in how accurate she is going further back in time, as some of the relationships she has pointed out can disappear just as fast as they appear (and then re-appear) imo.
If she got her members out at the 1800 low then you can’t argue with that. Using fibs and other TA with EW is crucial imho.
I’ve followed her free vids for a couple of years, and she has been pretty darn accurate.
Agreed, things can change quickly but she usually gives time frames for decisions, and is mostly looking at the market decision by decision, not into the future like EW might.
She is quite good from a traders perspective with triggers and entries. Not really my thing, but she really knows her stuff.
Daily MACD is at 28.9 and rising. The Fear Greed Index opens the day at 80! The SPX daily gap at 2045 or so has been closed. I consider that close enough to all three of my targets I posted around Feb. 22nd of 30 MACD and 80 F/G and 2050+ SPX to call them all filled.
Now what we need is a signal the turn around has begun and the top is in. Charts, classical & candlestick, along with EW will give us that signal. And of course Vernecarty and Olga will point us in the right direction.
I think it was Allison who recently wondered if EW has been beneficial to anyone here lately. I say definitely yes. It has keep me out of all shorts at the right time. It will get me back into my shorts (pun not intended) at the right time. Of course, EW with other technical analysis has been very helpful. Some of the best help is to keep us from losing principle.
Good day and weekend to all.
In considering this primary wave two correction, I have realized it may be the greatest gift ever. By that I mean, we may be able to short the market within a few points of the top, certainly within a percentage of the top.
If we make it over SPX 2100 to the 2116 target, we can short the market withing 18 points of the top and have a stop loss within 18 points. That is almost too good to be true. It is not very often traders are given such a set up and able to say, “I shorted the market right at the top and rode it down 600 SPX points” which by the way is 29% with out leverage!
That is like serving a 2″ thick porterhouse steak to the bear just as it comes out of hibernation. It will be all over that steak and devour it.
A couple of weeks or less and down we go.
Keep in mind that the EW targets are NOT always hit,
I have been following EW for a long time. Just as SPX didn’t break below 1800 like targeted… there is NO guarantee that it will go to 2086 or 2116. It just might be that it goes straight down from this 2050 level to finally break 1800 or it just might be the bull counts are alive & well (although I find the bull counts extremely hard to believe given fundamentals worldwide).
Nobody knows what is going to happen from here, including myself. Nothing in trading is easy and nothing is obvious. I have profited in the last year… but if I had traded out and in at least 4 additional times… my profits would have been very large. So that’s my plan going forward from here… to trade out more often med. term.
I agree with you Joseph that targets are just targets. I also agree it is possible to turn down at any point and that we are always dealing with probabilities. I think the probability of turning down increases the higher and more overbought the market becomes. That is partly why I was cautious of the bear count being in the middle of successive third waves because the sentiment and momentum indicators were oversold. Now being overbought, we can see a meaningful push for successive 3rd waves. In addition, if the current bear count is correct, we will be in a primary degree third wave. That means it could extend and extend gaining momentum all the way. The risk reward ratio is going to be a possible big reward indeed.
I need to wait to see more evidence, however, that we in fact are turning down. Thanks for your thoughts and comments.
Before I moved the bulk of my short positions to leaps, I had 2050 as a hard stop for my SPX mid term short positions. I think the corresponding round number level of 17500.00
will also be both a magnet, and a brick wall..
17,500.00 for DJI of course…
Hey Verne,
UVXY Jan 2017 calls with 20 strike are going for $12. What’s your thoughts? Yesterday I nibbled on some at $11. Seems too good to be true, and if we approach new ATH in the next few weeks it should only get better!
Hard to believe is it not? I continue to accumulate. VIX pierced lower BB yesterday and UVXY could go a bit lower, but I for one do not expect to see UVXY at these levels for the rest of this bear market. I am taking lots of screen shots! A monster gap up open sometime in the near future will signal time to batten down the hatches… 😀
A conservative trigger would be the first green candle after a new 52 week low. We may see a higher low above 23.31 today, even with SPX moving higher and any such divergence would also be probative…
That makes sense, thanks for all of your insight. It’s amazing how much stock market optimism has built up just in the last week. I think something big is brewing.
First! (and fast!) 🙂
what?
You heard me…! 🙂