
Upwards movement was expected.
Price made a slight new high.
Summary: The short / mid term trend remains up while price remains above 1,969.25. The target is 2,086 – 2,088. When the next impulse is over, then how low the following wave down goes will indicate which of three wave counts is correct. However, the bounce is weakening. Look out for surprises to the downside. The first presented bear wave count expects a big third wave is approaching; when it arrives, it may be explosive.
To see last published monthly charts click here.
To see how each of the bull and bear wave counts fit within a larger time frame see the Grand Supercycle Analysis.
To see detail of the bull market from 2009 to the all time high on weekly charts, click here.
If I was asked to pick a winner (which I am reluctant to do) I would say the bear wave count has a higher probability. It is better supported by regular technical analysis at the monthly chart level, it fits the Grand Supercycle analysis better, and it has overall the “right look”.
New updates to this analysis are in bold.
BULL ELLIOTT WAVE COUNT
WEEKLY CHART
Click chart to enlarge.
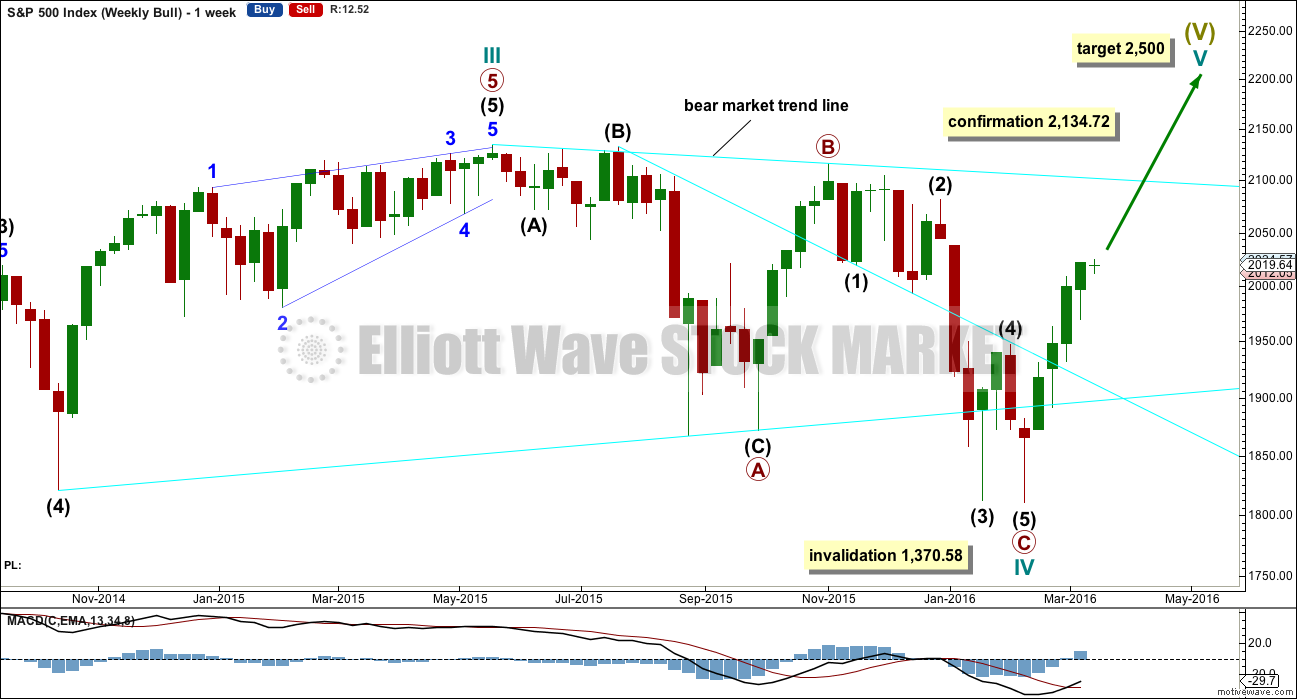
This wave count is bullish at Super Cycle degree.
If it continues any further, cycle wave IV may not move into cycle wave I price territory below 1,370.58. If this bull wave count is invalidated by downwards movement, then the bear wave count shall be fully confirmed.
Cycle wave II was a shallow 0.41 zigzag lasting three months. Cycle wave IV may be a complete shallow 0.19 regular flat correction, exhibiting some alternation with cycle wave II.
At 2,500 cycle wave V would reach equality in length with cycle wave I.
Price remains below the final bear market trend line. This line is drawn from the all time high at 2,134.72 to the swing high labelled primary wave B at 2,116.48 on November 2015. This line is drawn using the approach outlined by Magee in the classic “Technical Analysis of Stock Trends”. To use it correctly we should assume that a bear market remains intact until this line is breached by a close of 3% or more of market value. In practice, that price point would be a new all time high which would invalidate any bear wave count.
This wave count requires price confirmation with a new all time high above 2,134.72.
While price has not made a new high, while it remains below the final bear market trend line and while technical indicators point to weakness in upwards movement, this very bullish wave count comes with a strong caveat. I do not have confidence in it.
DAILY CHART
Click chart to enlarge.
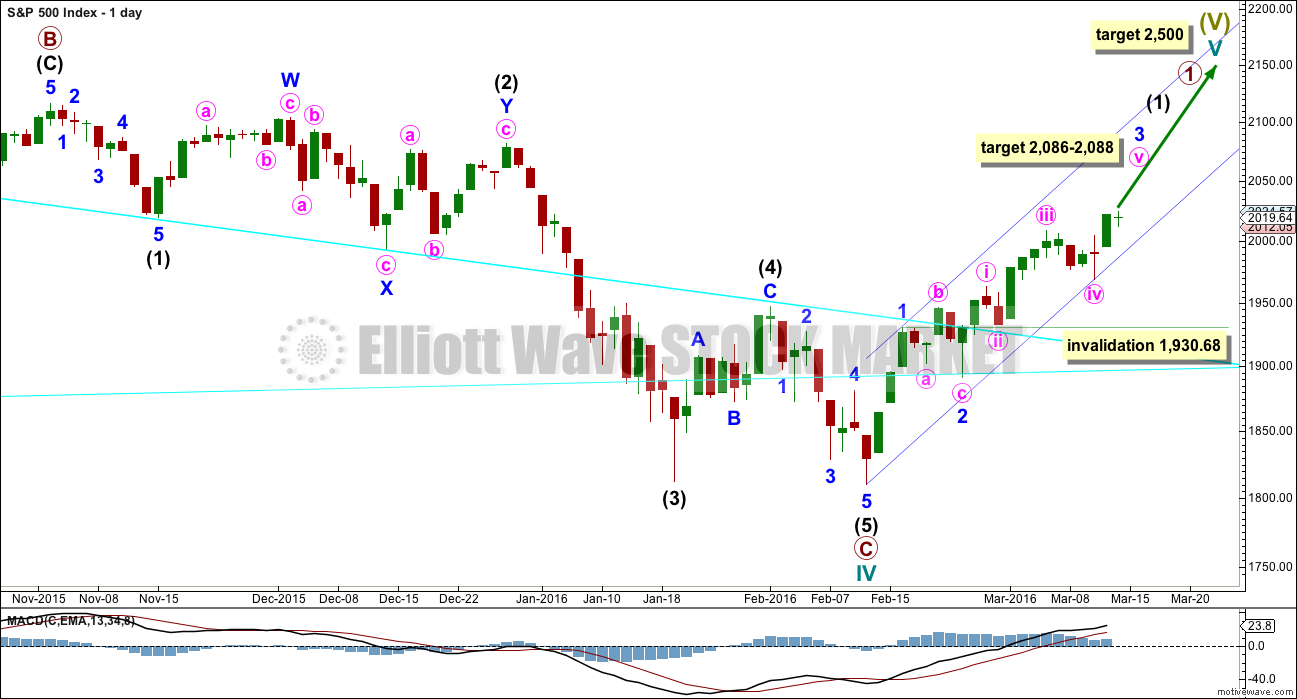
Upwards movement cannot now be a fourth wave correction for intermediate wave (4) as price is now back up in intermediate wave (1) territory above 2,019.39. This has provided some clarity.
For the bullish wave count, it means that primary wave C must be over as a complete five wave impulse.
Intermediate wave (2) is seen as an atypical double zigzag. It is atypical in that it moves sideways. Double zigzags should have a clear slope against the prior trend to have the right look. Within a double zigzag, the second zigzag exists to deepen the correction when the first zigzag does not move price deep enough. Not only does this second zigzag not deepen the correction, it fails to move at all beyond the end of the first zigzag. This structure technically meets rules, but it looks completely wrong. This gives the wave count a low probability.
If the bull market has resumed, it must begin with a five wave structure upwards at the daily and weekly chart level. So far that is incomplete.
At 2,088 minor wave 3 would reach 1.618 the length of minor wave 1. Within minor wave 3, at 2,086 minute wave v would reach 1.618 the length of minute wave iii. This gives a two point target zone calculated at two wave degrees which should have a reasonable probability.
When minor wave 3 is a complete impulse, then minor wave 4 downwards may not move into minor wave 1 price territory below 1,930.68.
HOURLY CHART
Click chart to enlarge.
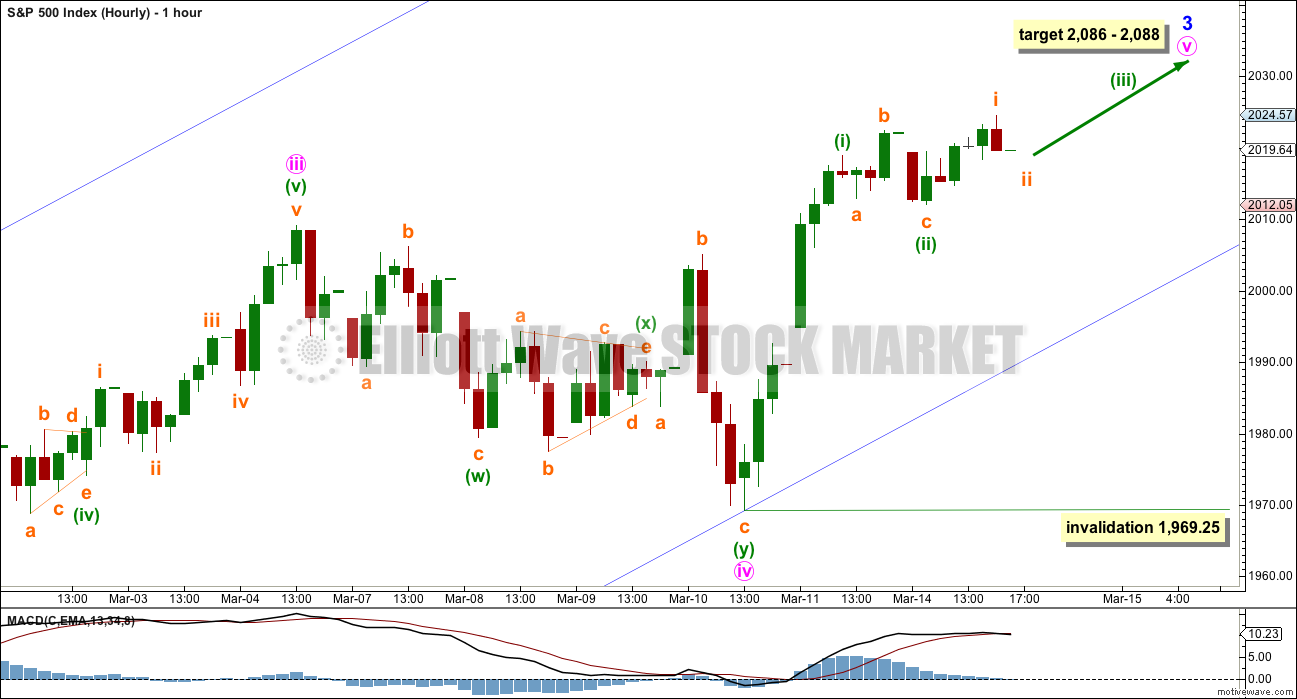
Within minute wave v, no second wave correction may move beyond the start of its first wave below 1,969.25.
It must be assumed that price is likely to still rise while price remains above 1,969.25.
BEAR ELLIOTT WAVE COUNT
MAIN WEEKLY CHART
Click chart to enlarge.
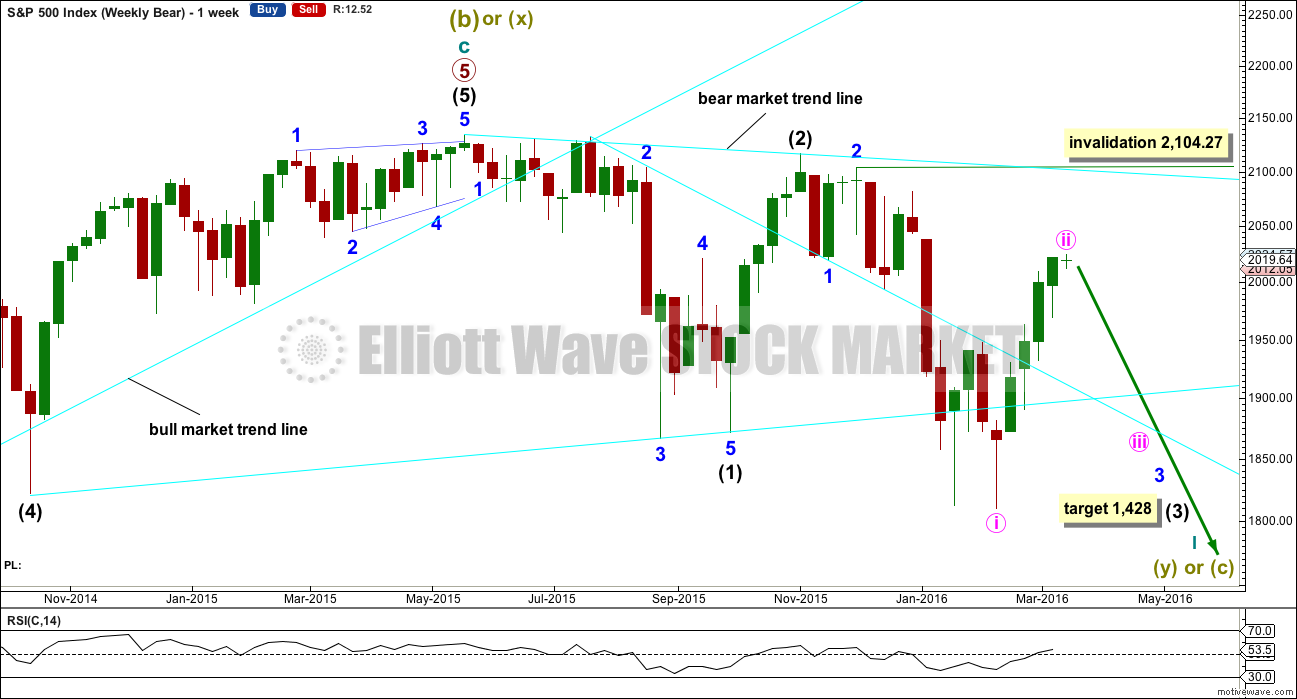
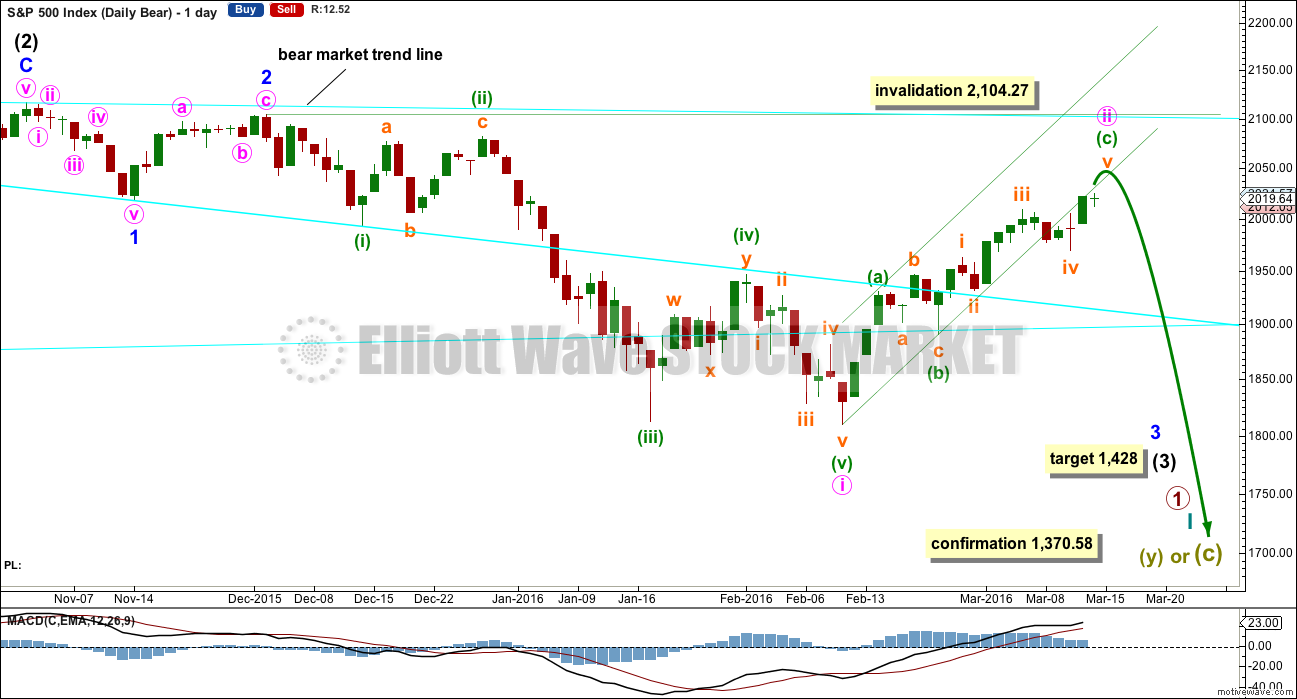
Importantly, there is no lower invalidation point for this wave count. That means there is no lower limit to this bear market.
This bear wave count now has two ways to see downwards / sideways movement from the all time high, so two weekly charts are presented below.
This third wave for intermediate wave (3) still has a long way to go. It has to move far enough below the price territory of intermediate wave (1), which has its extreme at 1,867.01, to allow room for a following fourth wave correction to unfold which must remain below intermediate wave (1) price territory.
Intermediate wave (2) was a very deep 0.93 zigzag. Because intermediate wave (2) was so deep the best Fibonacci ratio to apply for the target of intermediate wave (3) is 2.618 which gives a target at 1,428. If intermediate wave (3) ends below this target, then the degree of labelling within this downwards movement may be moved up one degree; this may be primary wave 3 now unfolding and in its early stages.
Minute wave ii is now longer in duration that minor wave 2 one degree higher. This has now reduced the probability of this wave count this week, which is why the alternate is presented.
DAILY CHART
Click chart to enlarge.
Intermediate wave (2) lasted 25 sessions (not a Fibonacci number) and minor wave 2 lasted 11 sessions (not a Fibonacci number).
Minute wave ii has now lasted 21 sessions. When minute wave ii is more than twice the duration of minor wave 2, one degree higher, then this wave count will be discarded due to an exceptionally low probability.
The channel about minute wave ii is drawn using Elliott’s technique for a correction. Price is finding resistance along the lower edge.
Minute wave ii may not move beyond the start of minute wave i above 2,104.27.
At 1,428 intermediate wave (3) would reach 2.618 the length of intermediate wave (1).
HOURLY CHART
Click chart to enlarge.
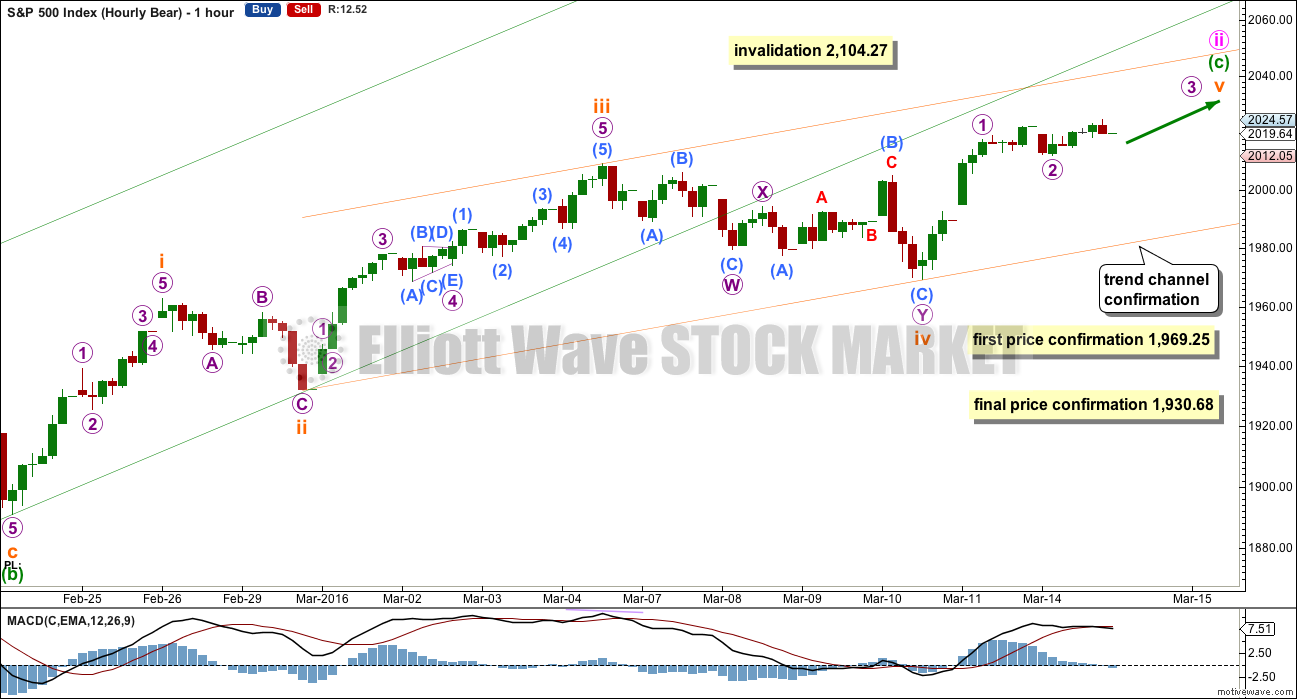
A-B-C of a zigzag and 1-2-3 of an impulse subdivide in exactly the same way: 5-3-5. Subminuette wave v is moving higher. The structure does not look complete today at the hourly chart and five minute chart levels.
The channels are redrawn today. The green channel is copied over from the daily chart. The orange channel is drawn using Elliott’s second technique. When the orange channel is breached by downwards movement, that would provide earliest confirmation that the correction is over.
Earliest price confirmation of a trend change would come with a new low below 1,969.25.
Final price confirmation would come with a new low below 1,930.68. At that stage, confidence may be had in a third wave down.
ALTERNATE WEEKLY CHART
Click chart to enlarge.
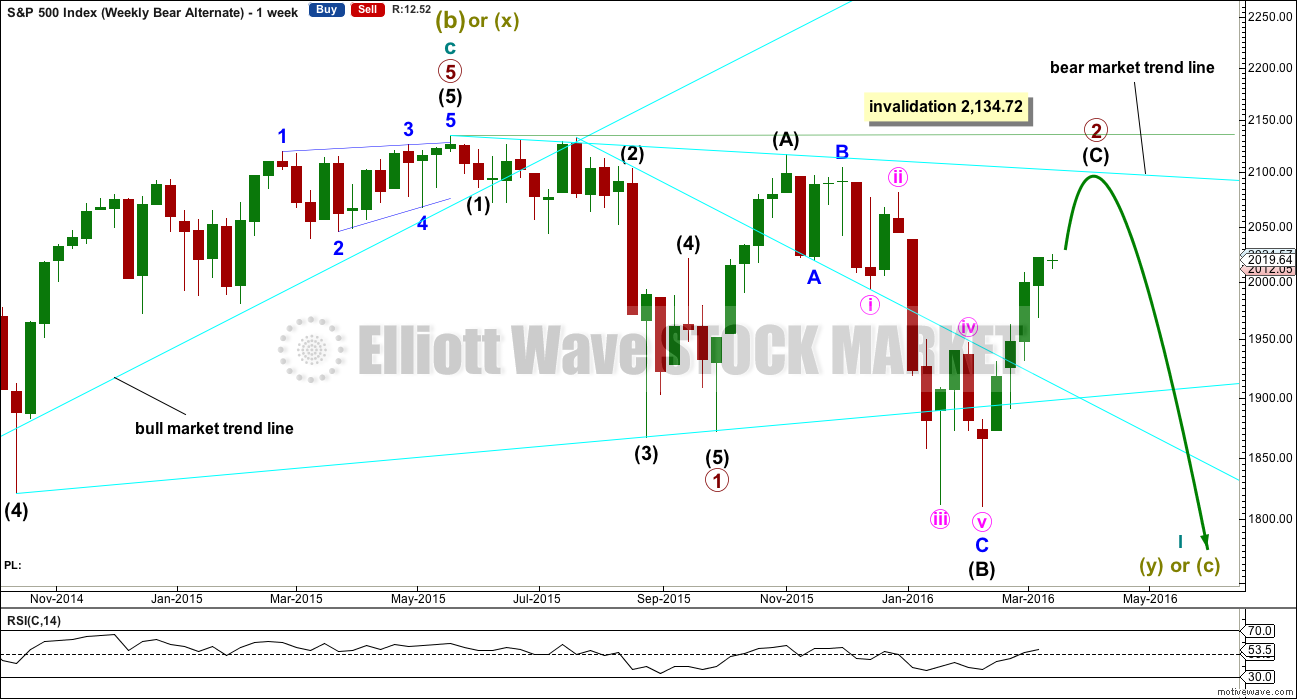
The impulse downwards for primary wave 1 is seen in the same way as the main bear wave count with the exception of degree. Here, the labelling is moved up one degree. Primary wave 1 may be complete and may have lasted 19 weeks, two short of a Fibonacci 21. So far primary wave 2 has lasted 22 weeks. It looks unlikely to continue for another 12 weeks to total a Fibonacci 34, so it may end in about two to five weeks time. This would still give reasonable proportion between primary waves 1 and 2. Corrections (particularly more time consuming flat corrections) do have a tendency to be longer lasting than impulses.
Primary wave 2 may be unfolding as an expanded or running flat. Within primary wave 2, intermediate wave (A) was a deep zigzag (which will also subdivide as a double zigzag). Intermediate wave (B) fits perfectly as a zigzag and is a 1.21 length of intermediate wave (A). This is within the normal range for a B wave of a flat of 1 to 1.38.
Intermediate wave (C) is likely to make at least a slight new high above the end of intermediate wave (A) at 2,116.48 to avoid a truncation and a very rare running flat. However, price may find very strong resistance at the final bear market trend line. This line may hold price down and it may not be able to avoid a truncation. A rare running flat may occur before a very strong third wave down.
Primary wave 2 may not move beyond the start of primary wave 1 above 2,134.72.
ALTERNATE DAILY CHART
Click chart to enlarge.
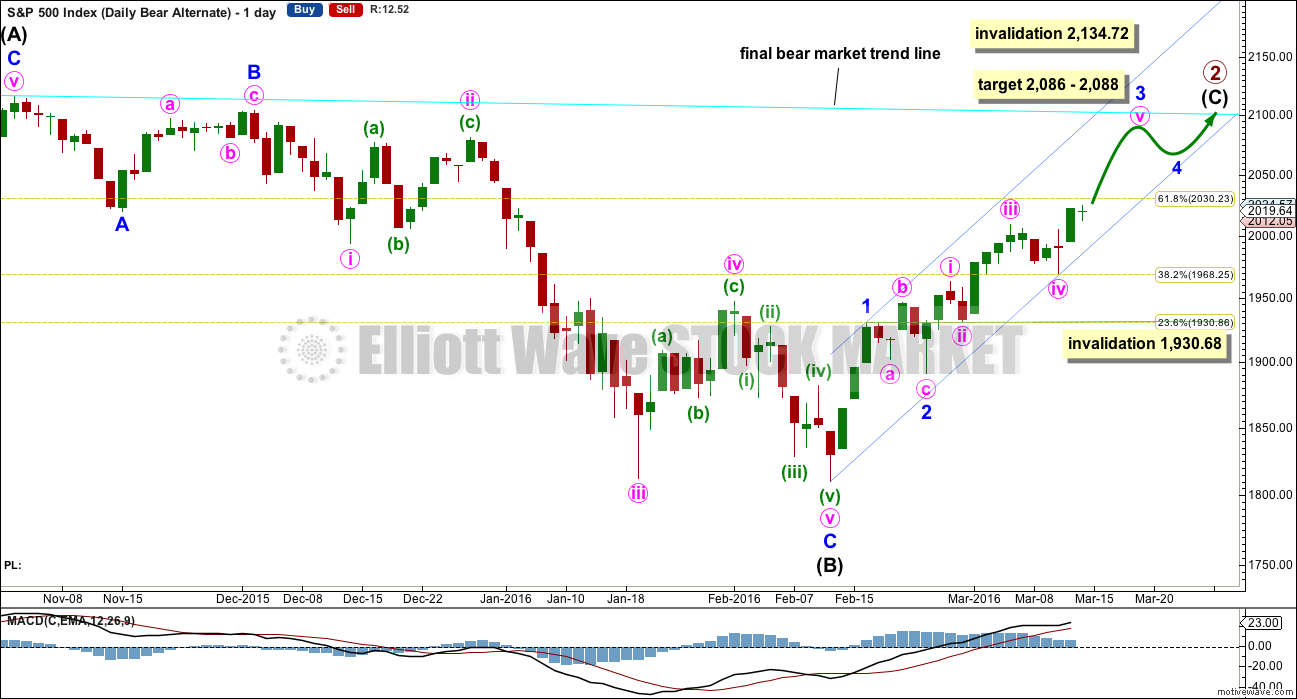
Intermediate wave (A) fits nicely as a single or double zigzag.
Intermediate wave (B) fits perfectly as a zigzag. There is no Fibonacci ratio between minor waves A and C.
Intermediate wave (C) must subdivide as a five wave structure. It is not unfolding as an ending diagonal, so it must be unfolding as a more common impulse.
The short / mid term target for minor wave 3 is exactly the same as the short / mid term target for the bull wave count. A-B-C of a zigzag and 1-2-3 of an impulse both subdivide 5-3-5. The labelling within this upwards movement of each subdivision is the same for both wave counts.
Price is approaching the 0.618 Fibonacci ratio at 2,030. It may find some resistance there.
When minor wave 3 is a complete impulse, then minor wave 4 downwards may not move into minor wave 1 price territory below 1,930.68.
Intermediate wave (C) does not have to move above the end of intermediate wave (A) at 2,116.48, but it is likely to do so to avoid a truncation. If it is truncated and primary wave 2 is a rare running flat, then the truncation is not likely to be very large. As soon as price is very close to 2,116.48 this wave count looks at the possibility of a trend change.
The next wave down for this wave count would be a strong third wave at primary wave degree.
An hourly chart is not published for this idea because it would look mostly the same as the hourly chart for the bull wave count.
If price continues any higher, this may be the only bear wave count. If price continues higher, the main bear wave count will further reduce in probability. It may be discarded before it is invalidated by price.
If this alternate bear wave count is correct, then upwards movement of the last two trading days is the start of a fifth wave within a third wave. The decline in volume is acceptable and makes sense. Further, a third wave of a C wave is sometimes weaker than the first, with the fifth wave weaker still. This wave count would fit with volume and momentum as long as the third wave of minor wave 3 within intermediate wave (C) is not the weakest.
TECHNICAL ANALYSIS
DAILY CHART
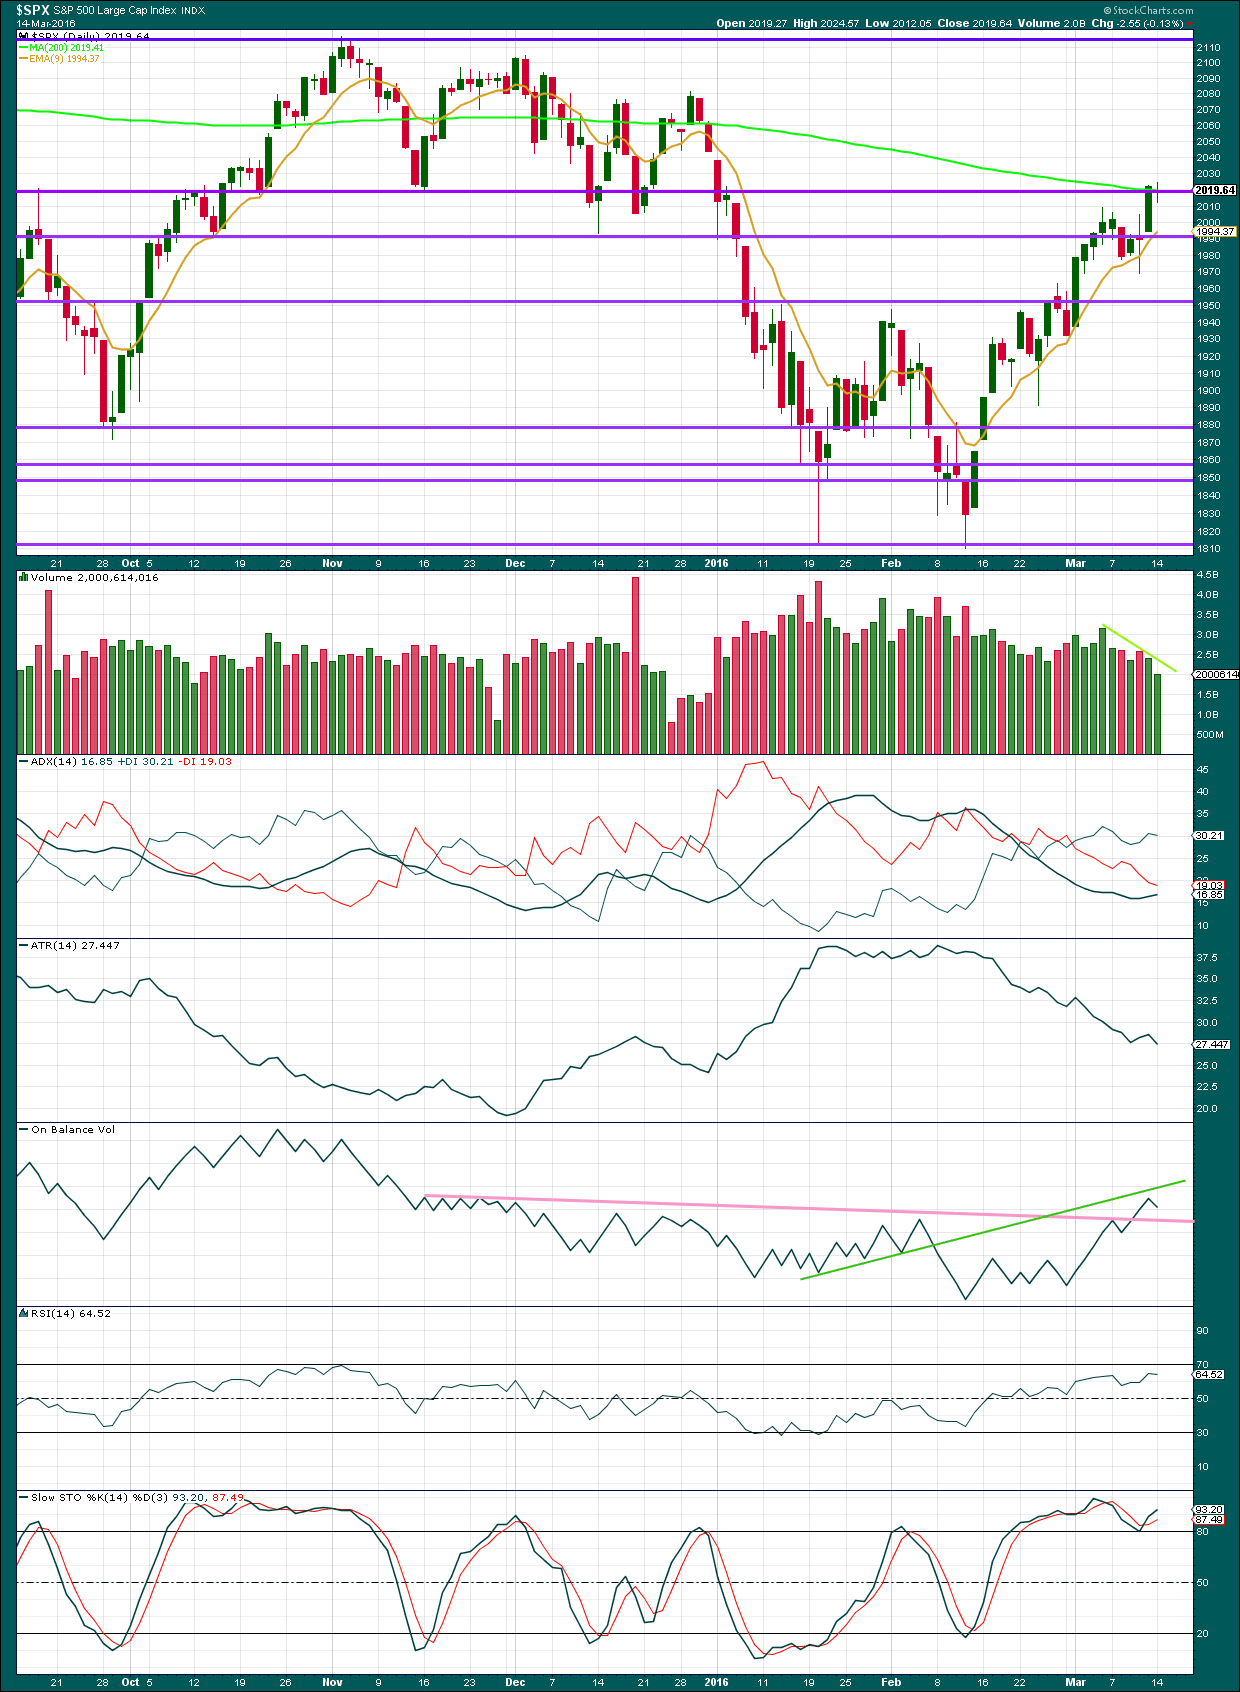
Click chart to enlarge. Chart courtesy of StockCharts.com.
Volume data on StockCharts is different to that given from NYSE, the home of this index. Comments on volume will be based on NYSE volume data when it differs from StockCharts.
A small green doji for Monday comes with lighter volume. Volume for Monday is lowest since the last major swing low on 11th February. The rise in price is absolutely not supported by volume. This suggests that the bounce is running out of steam. Any members choosing to enter long or hold long positions for this bounce are strongly advised to manage risk to those positions carefully. If a strong downwards movement begins earlier than expected, ensure your account is protected.
Price is finding resistance at the 200 day moving average and the horizontal trend line about 2,020.
ADX indicates there is a trend and it is upwards.
ATR is declining. If this upwards trend is the resumption of a bull market and if price is in a third wave of a new bull market, then ATR should be increasing or at the very least flat. The persistent decline of ATR indicates this is most likely a weak bear market rally and not a new bull market.
On Balance Volume broke above the technically significant pink trend line. The next line to provide some resistance is the green line. If OBV breaks below the pink line, it would be providing a strong bearish signal. If that happens before price moves very strongly lower, then OBV may be able to provide us with an early warning signal of the next mini market crash.
There is no divergence with price and RSI. RSI is not yet overbought.
There is divergence with price and Stochastics, but Stochastics is not a reliable indicator with divergence. This signal should be given only a little weight. Stochastics is still overbought.
DOW THEORY
For the bear wave count I am waiting for Dow Theory to confirm a market crash. I am choosing to use the S&P500, Dow Industrials, Dow Transportation, Nasdaq and I’ll add the Russell 2000 index. Major swing lows are noted below. So far the Industrials, Transportation and Russell 2000 have made new major swing lows. None of these indices have made new highs.
I am aware that this approach is extremely conservative. Original Dow Theory has already confirmed a major trend change as both the industrials and transportation indexes have made new major lows.
At this stage, if the S&P500 and Nasdaq also make new major swing lows, then my modified Dow Theory would confirm a major new bear market. At that stage, my only wave count would be the bear wave count.
The lows below are from October 2014. These lows were the last secondary correction within the primary trend which was the bull market from 2009.
These lows must be breached by a daily close below each point. So far the S&P has made a new low below 1,821.61, but it has not closed below 1,821.61.
S&P500: 1,821.61
Nasdaq: 4,117.84
DJT: 7,700.49 – this price point was breached.
DJIA: 15,855.12 – this price point was breached.
Russell 2000: 1,343.51 – this price point was breached.
This analysis is published @ 11:42 p.m. EST.
Heading back down to test upper line; will either bounce or head South, setting up another great opportunity to grab some short term calls…
Well. I’m usually not in a position to day trade, but I did get a nice 50% scalp on those calls from yesterday. Here’s to your health (clink of glasses)!
So did I, my merry partner in crime! Cheers! 🙂
UVXY break from bullish wedge; top line should provide support or we retest lows…
Verne posting a chart??!!! Steady on there old bean! 🙂 🙂 🙂
I have no idea what came over me; I generally like to keep pictures in my head!
Is that what they mean by being “Overly Cerebral?” 🙂
Double doji on deck.
I guess we will breathlessly await the FED….’nite all!
An enormous amount of capital being spent with the market going nowhere. Unless we are about to end a possible second wave correction with a final manic move up, we could be about to violently fall through round number pivots…either way I doubt the meandering is going to continue much longer so keeping my powder dry…
It looks like the final wave (5 of c of (b)) up is extending (if my count is right – and that’s a big if!), so we might reach the 1.618 reversal spot at around 2019.
Interestingly the 76.4% fib retrace of the impulse down is also around 2019 (nature eh??). So there’s a poss target at 2 degrees.
I would think the top of that gap would act like a magnet.
I think a sucker play on the bears being set up with a strong move down into the close.
Yeah – could go either way. I’m thinking maybe a ramp to close almost green (or maybe even positive) to close that gap / finish this wave, then a serious dive down tomorrow.
B of a zig zag should be fairly shallow so conflicting biases. Will be interesting to see which wins over.
Still holding my UVXY short – either way, will bail on a strong move towards 1968 (yet again!) or on new high above 2025 – whichever comes first.
Didn’t think I was gonna see this correction so Mr Market has been kind for a change 🙂
Indeed! I am hoping for one more visit to the sub 26 area, short lived though it may be. I like to get calls at least ten trading days out for under a buck, but not requiring more than a standard deviation move to hit the strike. These are rare and generally come only at 52 week lows. Here’s hoping that futures get funky! 🙂
Possible recent action – maybe one pop higher? c = a @ 2015.50, c = 1.618*a @ 2019.84
(higher target would fill todays downward gap – maybe low risk short scalp?)
BTW – the labels appear ok on my screen – it clashes with the waves as soon as I print it off 🙁
BTW – with the first move down today being impulsive (imo), this whole move down from yesterdays high will likely be a zig zag (*if* it proves corrective)
So this poss wave (b) up right now does not need to retrace 90% of wave (a) – it also cannot make a new high otherwise it is invalidated. That’s why a scalp at higher level (if it got to (c) = 1.618*(a)) might be low risk.
Next move down should also be an impulse – so the structure will look like 1,2,3.
It is at that point (whether we get the 4 & 5 (or go below 1968)) that we will know if it is the real deal or an abc. Most waves I think are 2nd waves, turn out to be B waves.
Or this…
For my bear alternate count I was looking for minor 4 to not begin for a few days, after minor 3 ended about 2,086
But todays small red candlestick looks like it is here already.
So what structure may it be?
It could be a combination as labelled here. It may also be a triangle.
So this idea sees more sideways movement for another couple of slow days, followed by the final fifth wave up at minor degree.
Thanks Lara!
Man that would really fool me (no suprises there) – that Minor 4 is seriously out of whack with Minor 2 (If I’m right in thinking how you have labelled Minor 2 – it isn’t showing on your chart).
EDIT – sorry forget that – I just realised I’m looking at a different degree W2 label.
1930.68 level is key then.
Fits the banksters perfectly! The Y portion of the double combination would be the ideal structure for drawing the bears in prematurely prior to the final wave up and which is what I thought would happen by the close today. I suspect Y will probably take us close to, or just under the the round number pivot in wave c just prior to a reversal and final wave up. Should make for a few easy quick trades the next day or two. Very sharp analysis, as usual, Lara. You have an uncanny ability to graph what I am thinking when I cannot. I like it! 🙂
I do realize Y could be a sideways triangle or something other than a simple zig-zag, but I think the zig-zag would be the most elegant trap as it would look like the beginning of an impulse down…(am I over-thinking this??!) 🙂
For anyone interested in GBP:USD – looks like the next leg lower has now started – will be confirmed with a move under 1.4117. I reckon this baby could (eventually) go near 1:1 looking at the long term EW chart. (PS – abc on chart is prob wxy (as last move up is prob a zigzag – but result same 🙂 )
Hi Olga,I’ve been monitoring this and on the longer time frames I see 1:1 too. I am currently in the alps 🙂 so I am a little out of the loop. Do you see a retrace from the highs?
If you mean the highs on my chart – yeah it’s possible. A larger corrective pattern could emerge. The important thing for me would be going below confirmation as that would give me more confidence that even if it goes higher it will come right back down again.
That said – I’m nearly all out of GBP (other than a bit tucked away for bills – I live in Isle of Man part year so need GBP there). I sold a significant amount of GBP into USD when GBP was above 1.6 – it then went to 1.7 which had me worried for a while.
I’ve since moved 70% of my USD position into CHF (physical cash) as I think that has probably now topped against USD. This is more about long term wealth preservation for me than trading (hence the physical cash).
My total wealth allocation atm (liquid – not including fixed assets) is 50% physical PMs (more silver than gold atm), 5% USD for trading, about 30% physical CHF and 14% physical USD, 0.5% physical GBP, 0.5% physical EUR (and about 0.01% GBP & USD in any bank! 🙂 )
If it goes below 1.4117 then comes back up to kiss the trendline on my chart might be a good entry for downside action?? (perhaps with a stop at the high).
Bear in mind that it might only be wave A & B (or W & X) with C or Y still to go higher. If the recent sharp move down morphs into a 3 wave structure then that is very likely the case.
Olga,
I am assuming SILVER meant coins not bars.
I only buy physical bars (for both gold and silver)… why coins?
Fungibility? 🙂
A bit too ‘tin hat’ for me.
I only have PM’s for very long term wealth preservation (keeping wealth outside the banking system and hedged against Fiat) – I don’t expect things to get so bad that I’ll need to use silver coins day to day (if so – I’ve got a hammer and chisel – will make my own silver ‘bits’ from my bars 🙂 ).
I am a bit smitten with some of the bullion coins I must admit.
Based on the drop in volume and performance of various indexes (S&P, DOW, and NASDAQ) over the last little while, it appears that there is some distribution out from risky assets (NASDAQ) and move into other less risky assets. I suspect that the drop in the volume of QQQs through this uptrend confirms that rotation.
Based on what Lara stated ‘surprises on downside’, I expect NASDAQ to lead the way when the down slide shows up.
Yesterdays top was likely either W1 or 5 (orange) or maybe all of wave 5 (orange). Looks like that final overlapping move yesterday was an ending diagonal.
We need a low below 1969 to prove this is not a W2 down.
Nice clear 5 down from the top – we might now be completing a 3 wave up, but this could all be just wave A of 2 down. Poss 61.8% fib target 1990.12 (which is also the gap fill from that gap up 😉 )
Since EW rules forbid second wave triangles (as the only structure), this triangle-like move up is probably a b wave as per your chart. I guess we will see if the next move down for a possible C is quickly re-traced. Short term bearish wedge so another move down in the works…
I’m just seeing it as a straight abc at the moment (there was a slight new higher high at 2012.33 – if it continues sideways then yeah it could morph into a triangle or something more complex.
Could still be a W2 rather than a B wave – impossible to tell atm. Both mean the same thing atm. 2012.33 could end up being the confirmation that trend is continuing upwards if that stays as the short term high after another dive lower.
We might only be in wave b of (b) with wave c of (b) up still to go (which would likely be impulsive and close some of that gap).
Atm it just looks like a lost dog just wandering around sniffin stuff 🙂
Looks like your c would equal a in just about the region of the round number pivot where we should expect strong support. The choppy action certainly argues in favor of it being an abc…
Move below 2008.02 would prove this small move up is corrective. 2008.02 is acting as support atm.
I’m guessing this is gonna be a snooze fest right the way until the Gods declare their wisdom upon the sheeple.
Perfect afternoon for Mr. Market to catch Bulls and /or Bears off their guard!
chop and slop fest today
WTI down -0.81 or -2.18%
Brent down -.62 or -1.57%
Today’s SPX 200 DMA is 2018.90 & declining
Today’s ES 200 DMA is 2012.23 & declining
Close of gap from yesterday at 2019.64 today means a very low risk quick 20% upside scalp on SPY for the adventurous (i.e. option traders)… 🙂
Filled at 1.30. Will try to buy back on last move up at .90 or less, (courtesy of the banksters); premiums will probably increase going forward, even after pullbacks…
Hey Thomas, are you holding or, taking the money and run? 🙂
Lara,
Thanks for the analysis. Helpful as always.
I noticed we have a color of candle problem again today. SPX was lower by 2.55 but you show a green candlestick. I have checked two sources I use and one is red and one is green. Strange.
If we change the color to red as it should be, it would mean we have a down day with light volume which would not be supportive of a downward trend.
Any thoughts? Anyone?
I used to be confused about this also. The color of the candle depends on where market opened and closed. If market closed higher than it opened, it will be a green candle, even if the close was lower than the day before. That’s why yesterday’s candle was green. The day closed higher than it opened, even though it closed lower than previous day.
Hope that explains it…
Thanks Ari. That explains it. I just received Nison’s book and now that you mention it, I recall reading that.
Move down today looking like it will be a fourth wave correction. As long as the round number pivots remain inviolate the bulls are in charge. Taking quick 50% pop on UVXY calls at the open and waiting to reload on demolition of pivots, or filling of open gap at 2043.94. I expect one more pop to the upside, doji notwithstanding (that’s the way the banksters roll). We barely missed an outside reversal day last Thursday and I think we will have one at the top. Have a great day everyone!
Empire State factory index has first positive reading in eight months.
FED in the corner with another positive data point. Let’s see what they say in their statement
back in the saddle again
you the man!