
Downwards movement was expected from the main Elliott wave count.
Summary: Earliest confirmation that the correction is over has come with a clear breach of the channel containing it and now a new low below 1,974.08. Final price confirmation would come with a new low below 1,962.96. The probability that a big third wave down is unfolding has increased today.
To see how each of the bull and bear wave counts fit within a larger time frame see the Grand Supercycle Analysis.
To see detail of the bull market from 2009 to the all time high on weekly charts, click here.
Last published monthly charts can be seen here.
If I was asked to pick a winner (which I am reluctant to do) I would say the bear wave count has a higher probability. It is better supported by regular technical analysis at the monthly chart level, it fits the Grand Supercycle analysis better, and it has overall the “right look”.
New updates to this analysis are in bold.
BULL ELLIOTT WAVE COUNT
WEEKLY CHART
Click chart to enlarge.
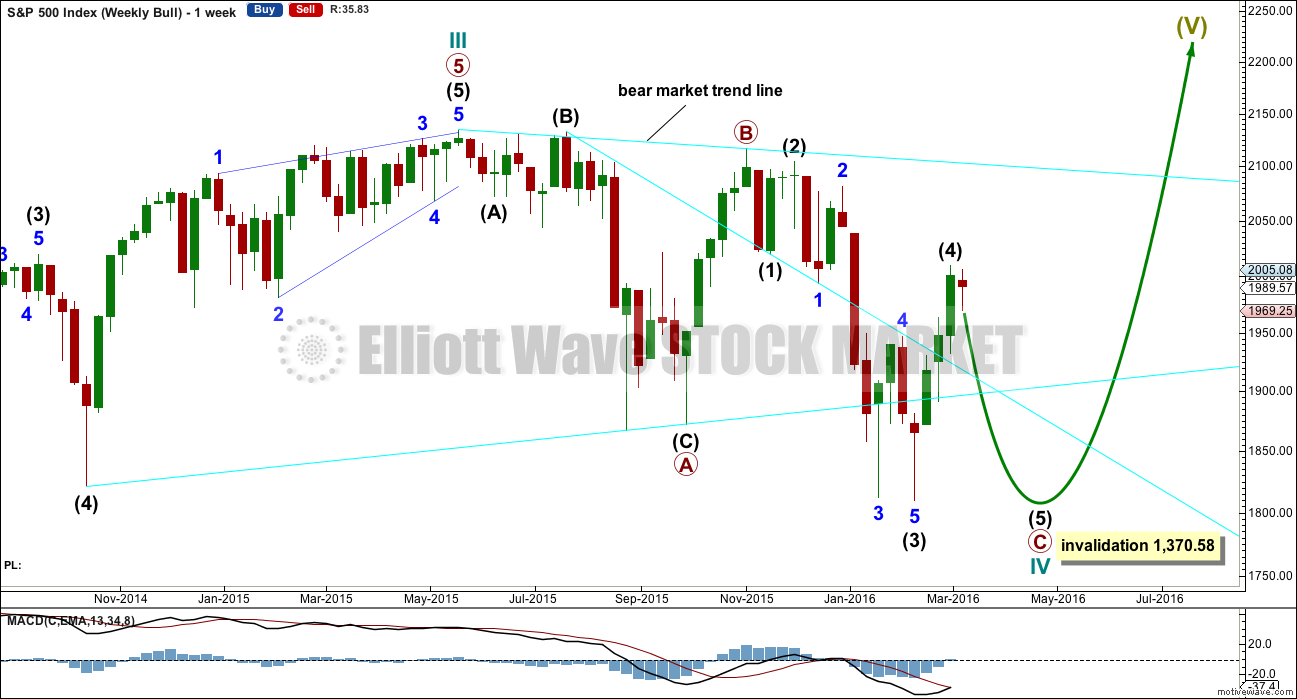
To see all movement from the all time high without squashing the daily candlesticks up too much, it is time to publish weekly charts regularly.
This wave count is bullish at Super Cycle degree.
Cycle wave IV may not move into cycle wave I price territory below 1,370.58. If this bull wave count is invalidated by downwards movement, then the bear wave count shall be fully confirmed.
Cycle wave II was a shallow 0.41 zigzag lasting three months. Cycle wave IV should exhibit alternation in structure and maybe also alternation in depth. Cycle wave IV may be a flat, or combination. This first daily chart looks at a flat correction.
Cycle wave IV may end within the price range of the fourth wave of one lesser degree. Because of the good Fibonacci ratio for primary wave 3 and the perfect subdivisions within it, I am confident that primary wave 4 has its range from 1,730 to 1,647.
Primary wave C should subdivide as a five.
DAILY CHART – FLAT
Click chart to enlarge.
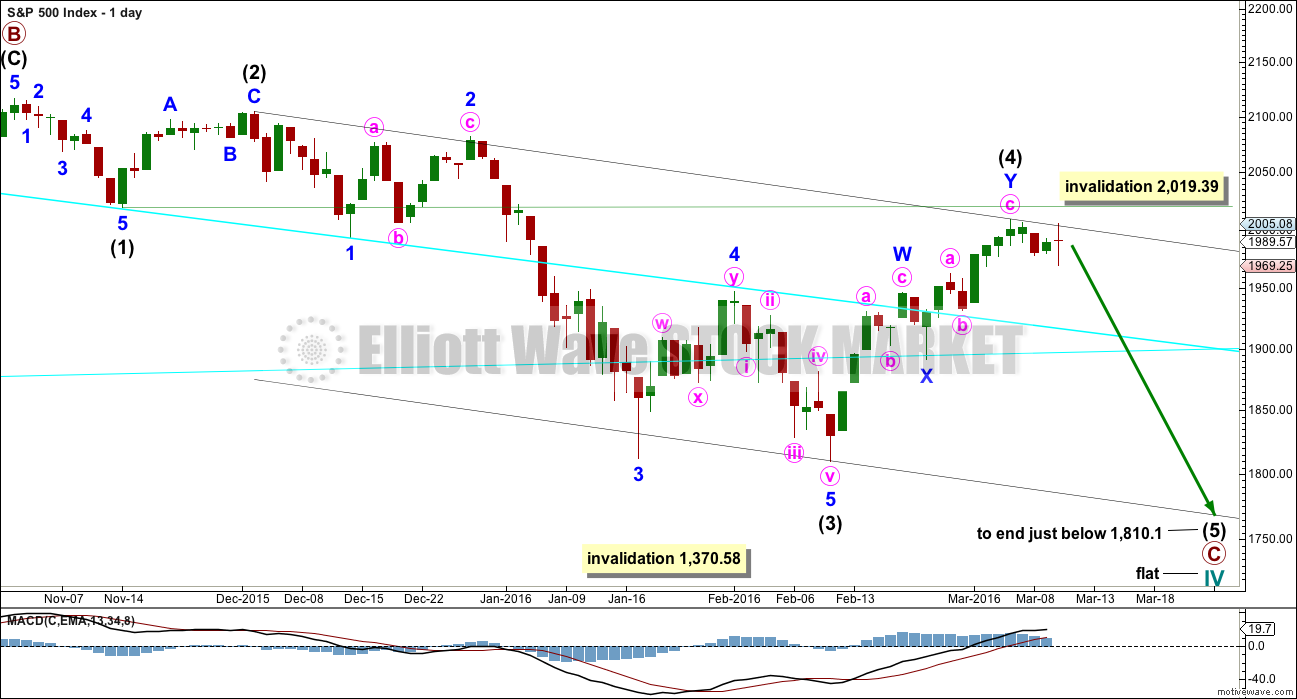
Within the new downwards wave of primary wave C, intermediate waves (1), (2) and now (3) may be complete. Intermediate wave (4) may now be over. Intermediate wave (2) will subdivide either as a single or double zigzag (as will intermediate wave (4) ). There is inadequate alternation between these two corrections, which reduces the probability that the current correction is a fourth wave.
Draw the channel about primary wave C using Elliott’s second technique. Draw the first trend line from the ends of intermediate waves (1) to (4), then a parallel copy on the end of intermediate wave (3). Expect intermediate wave (5) to find support at the lower edge. Intermediate wave (5) is highly likely to end slightly below 1,810.1.
The idea of a flat correction for cycle wave IV has the best look for the bull wave count. The structure would be nearly complete and at the monthly level cycle wave IV would be relatively in proportion to cycle wave II.
HOURLY CHART
Click chart to enlarge.
Comment on structure will be with the bear wave count today.
DAILY CHART – COMBINATION
Click chart to enlarge.
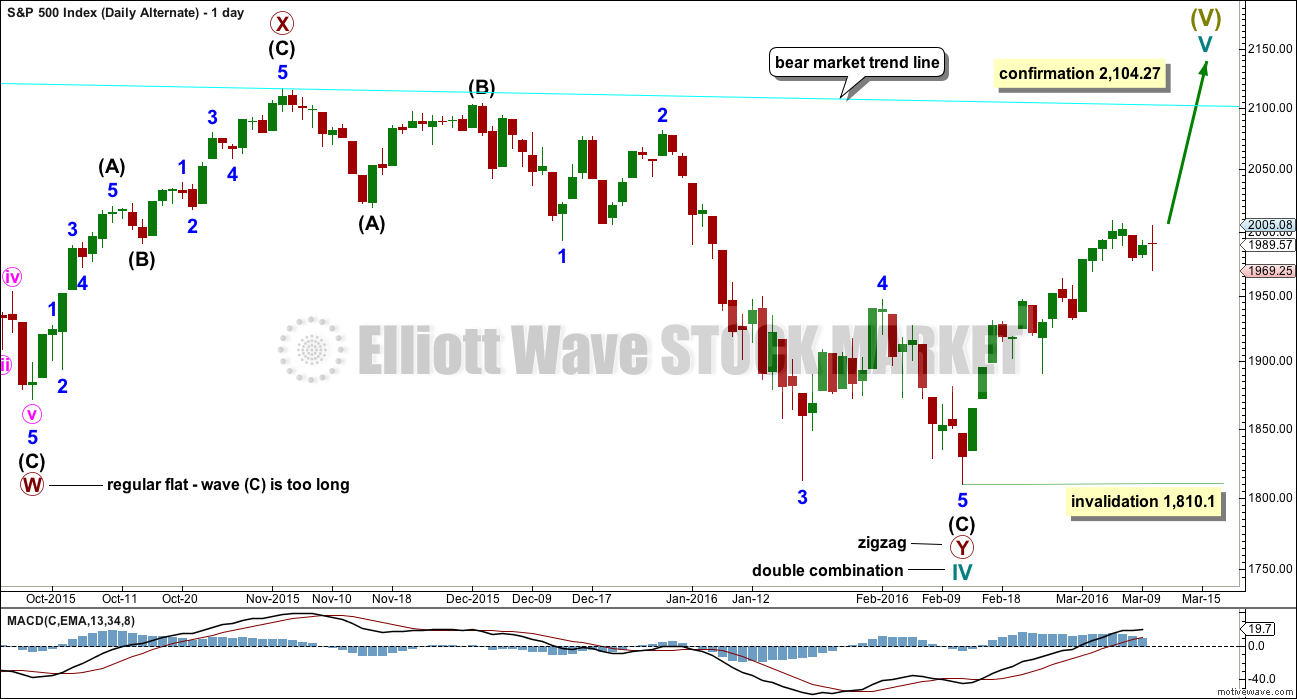
This idea is technically possible, but it does not have the right look. It is presented only to consider all possibilities.
If cycle wave IV is a combination, then the first structure may have been a flat correction. But within primary wave W, the type of flat is a regular flat because intermediate wave (B) is less than 105% of intermediate wave (A). Regular flats are sideways movements. Their C waves normally are about even in length with their A waves and normally end only a little beyond the end of the A wave. This possible regular flat has a C wave which ends well beyond the end of the A wave, which gives this possible flat correction a very atypical look.
If cycle wave IV is a combination, then the first structure must be seen as a flat, despite its problems. The second structure of primary wave Y can only be seen as a zigzag because it does not meet the rules for a flat correction.
If cycle wave IV is a combination, then it would be complete. The combination would be a flat – X – zigzag.
Within the new bull market of cycle wave V, no second wave correction may move beyond the start of its first wave below 1,810.10.
I do not have any confidence in this wave count. It should only be used if price confirms it by invalidating all other options above 2,104.27.
BEAR ELLIOTT WAVE COUNT
WEEKLY CHART
Click chart to enlarge.
This bear wave count fits better than the bull with the even larger picture, super cycle analysis found here. It is also well supported by regular technical analysis at the monthly chart level.
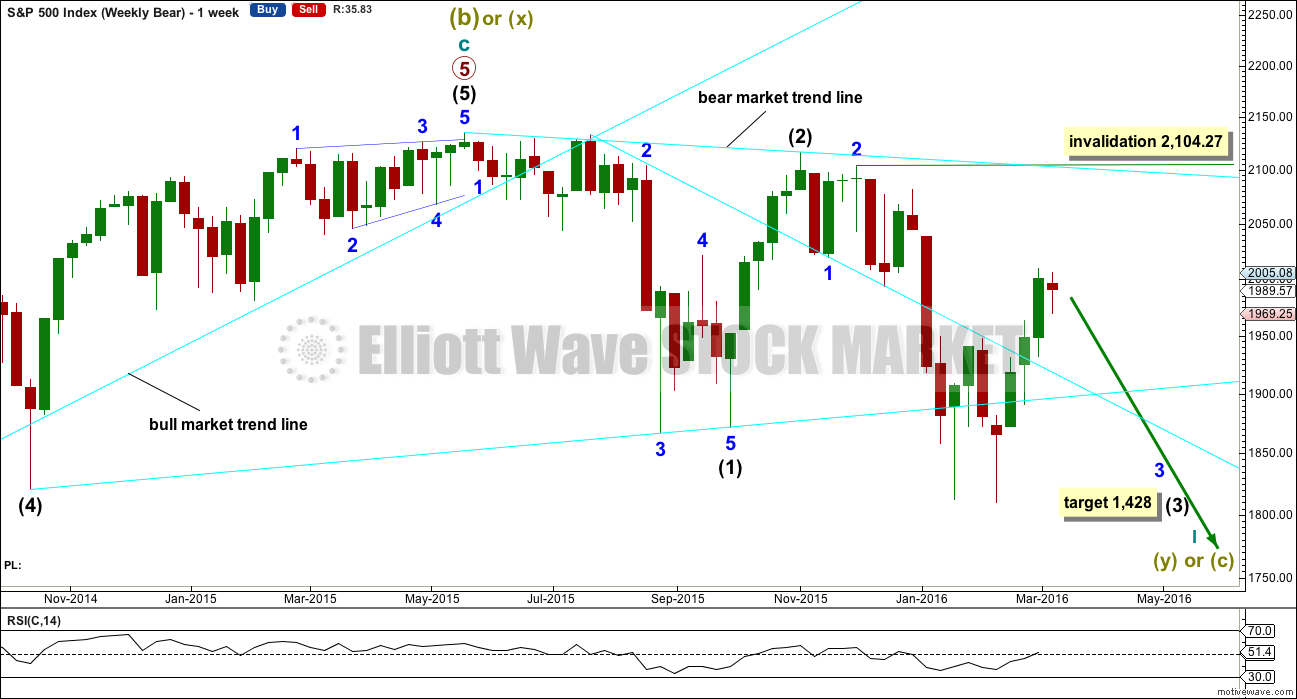
Importantly, there is no lower invalidation point for this wave count. That means there is no lower limit to this bear market.
Downwards movement so far within January still looks like a third wave. This third wave for intermediate wave (3) still has a long way to go. It has to move far enough below the price territory of intermediate wave (1), which has its extreme at 1,867.01, to allow room for a following fourth wave correction to unfold which must remain below intermediate wave (1) price territory.
Intermediate wave (2) was a very deep 0.93 zigzag. Because intermediate wave (2) was so deep the best Fibonacci ratio to apply for the target of intermediate wave (3) is 2.618 which gives a target at 1,428. If intermediate wave (3) ends below this target, then the degree of labelling within this downwards movement may be moved up one degree; this may be primary wave 3 now unfolding and in its early stages.
DAILY CHART
Click chart to enlarge.
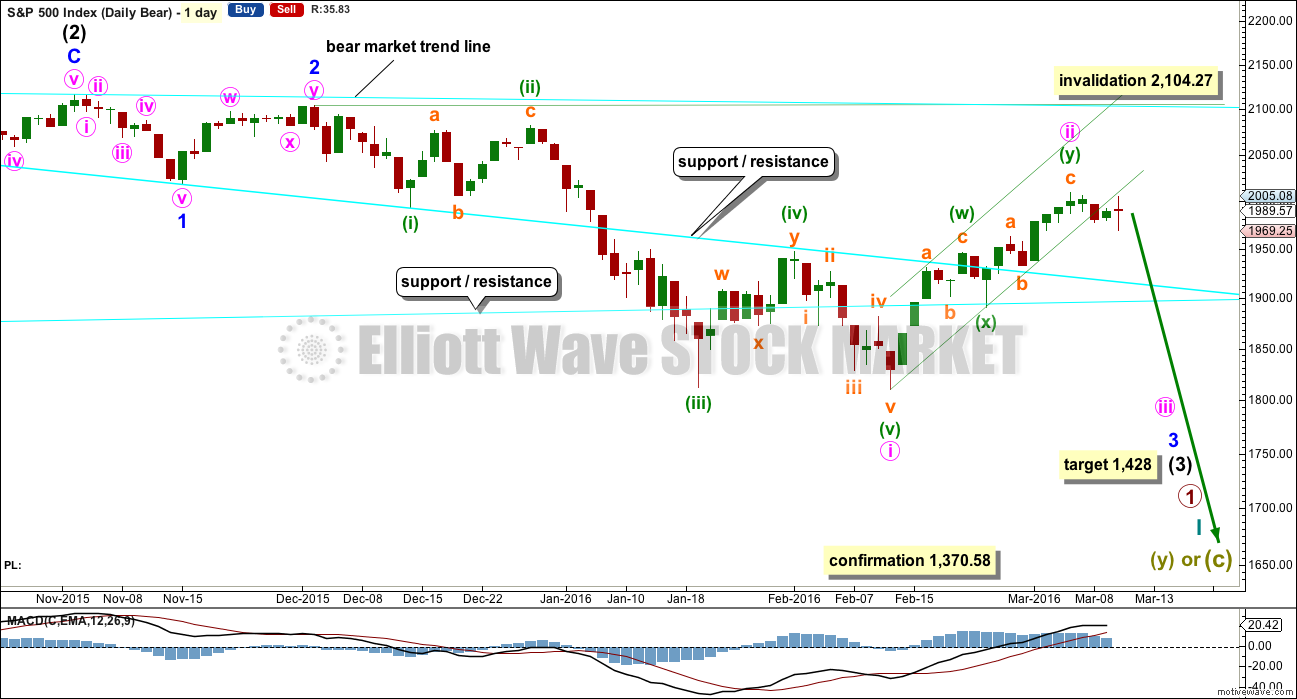
Intermediate wave (2) lasted 25 sessions (not a Fibonacci number) and minor wave 2 lasted 11 sessions (not a Fibonacci number).
Minute wave ii has now lasted fifteen sessions, four longer than minor wave 2. At this stage, the size of minute wave ii no longer gives the wave count the right look, so for this reason the alternate below is published. The S&P does not always exhibit perfect proportions, so this wave count remains entirely valid. The overall look is not too far from perfect to be somewhat acceptable for this market in my experience.
The channel about minute wave ii has been breached now by two full daily candlesticks below and not touching the lower trend line. Upwards movement for Thursday looks again like another typical throwback to the lower trend line, this time stronger.
Minute wave ii may not move beyond the start of minute wave i above 2,104.27.
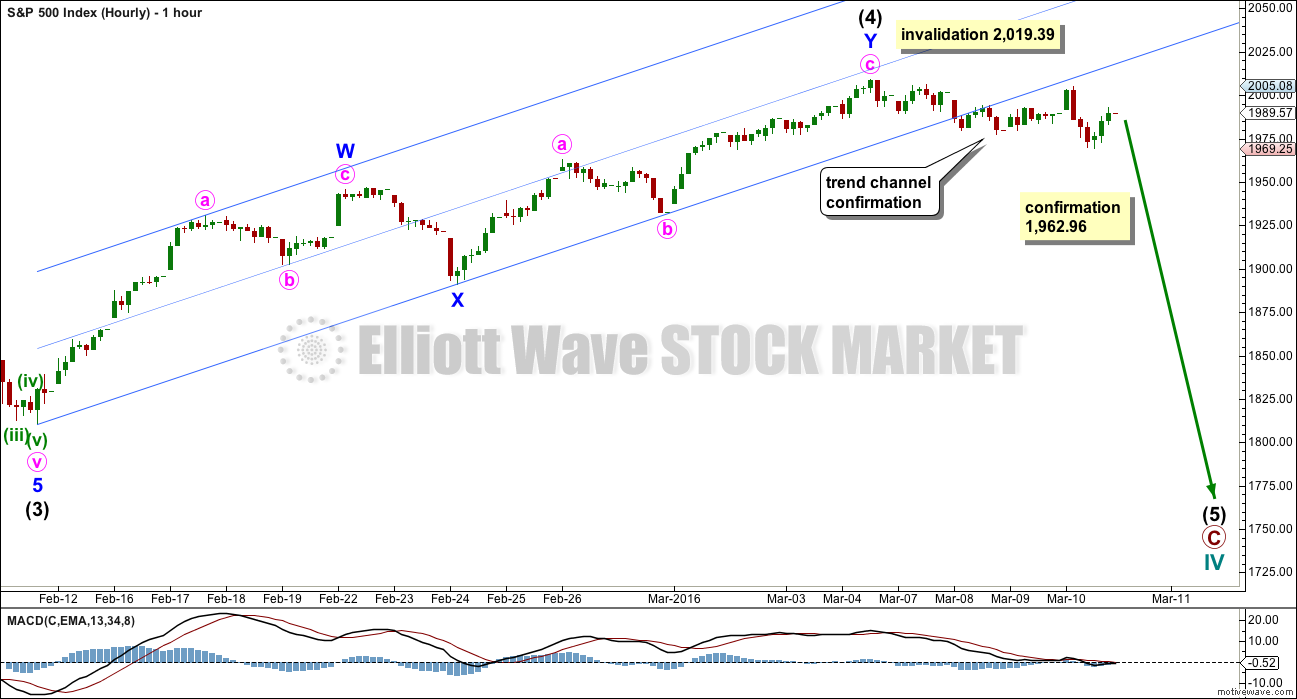
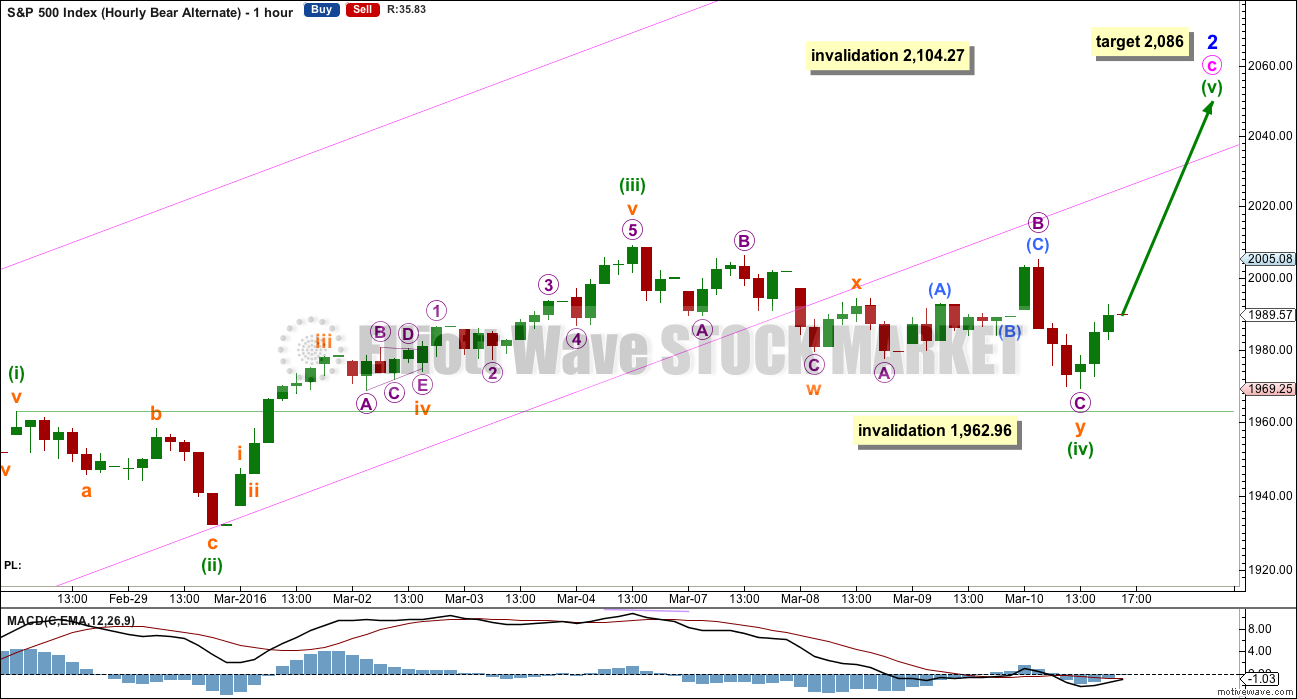
HOURLY CHART
Click chart to enlarge.
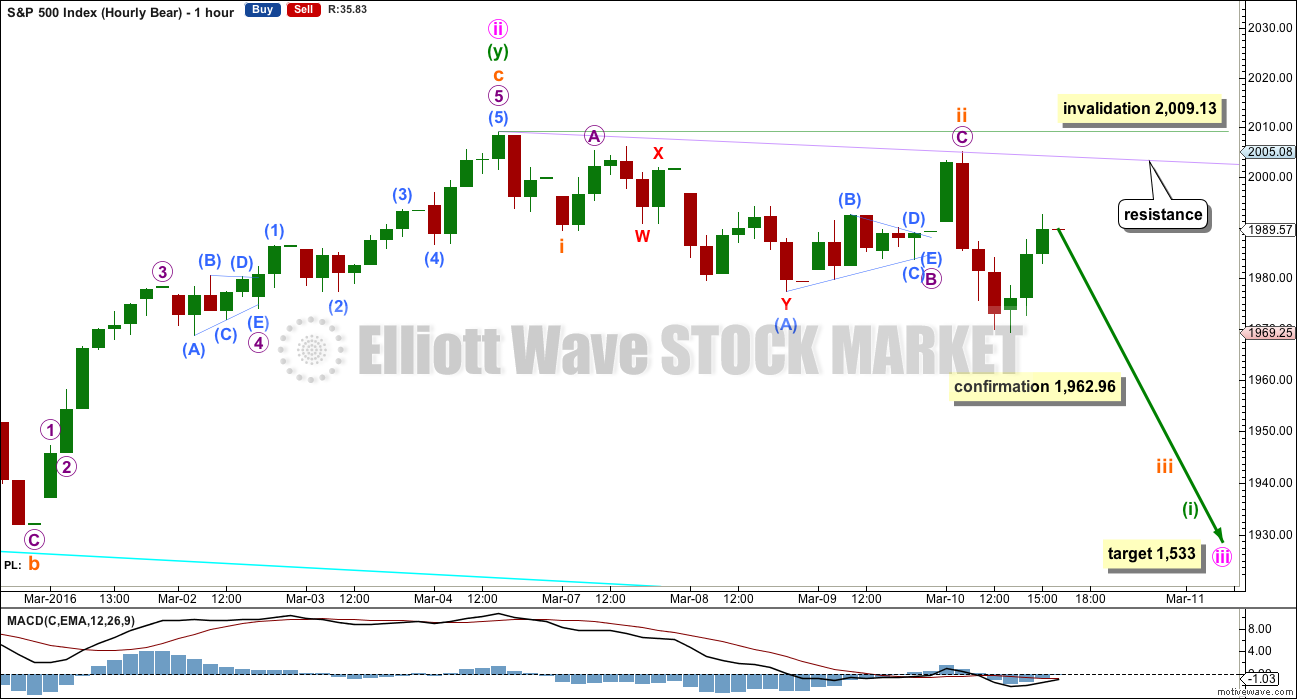
There are two ways to see this upwards movement: as a double zigzag as shown here or as a single zigzag as shown for the alternate below. Both ways to label it work in the same way for this and the alternate wave count below.
Subminuette wave i fits as a leading contracting diagonal on the five minute chart. Subminuette wave ii fits as a running flat; micro wave B is 1.25 times the length of micro wave A at its end. With micro wave A ending at 2,005.29 and micro wave C ending at 2,005.08, micro wave C is slightly truncated. This reduces the probability that this labelling is correct. With a strong third wave approaching, this is the type of situation a running flat may appear in.
Draw a trend line from the start of subminuette wave i to the end of subminuette wave ii. This lilac trend line should provide resistance to further upwards corrections.
At 1,533 minute wave iii would reach 1.618 the length of minute wave i.
A new low below 1,962.96 would add substantial confidence to this wave count.
ALTERNATE DAILY CHART
Click chart to enlarge.
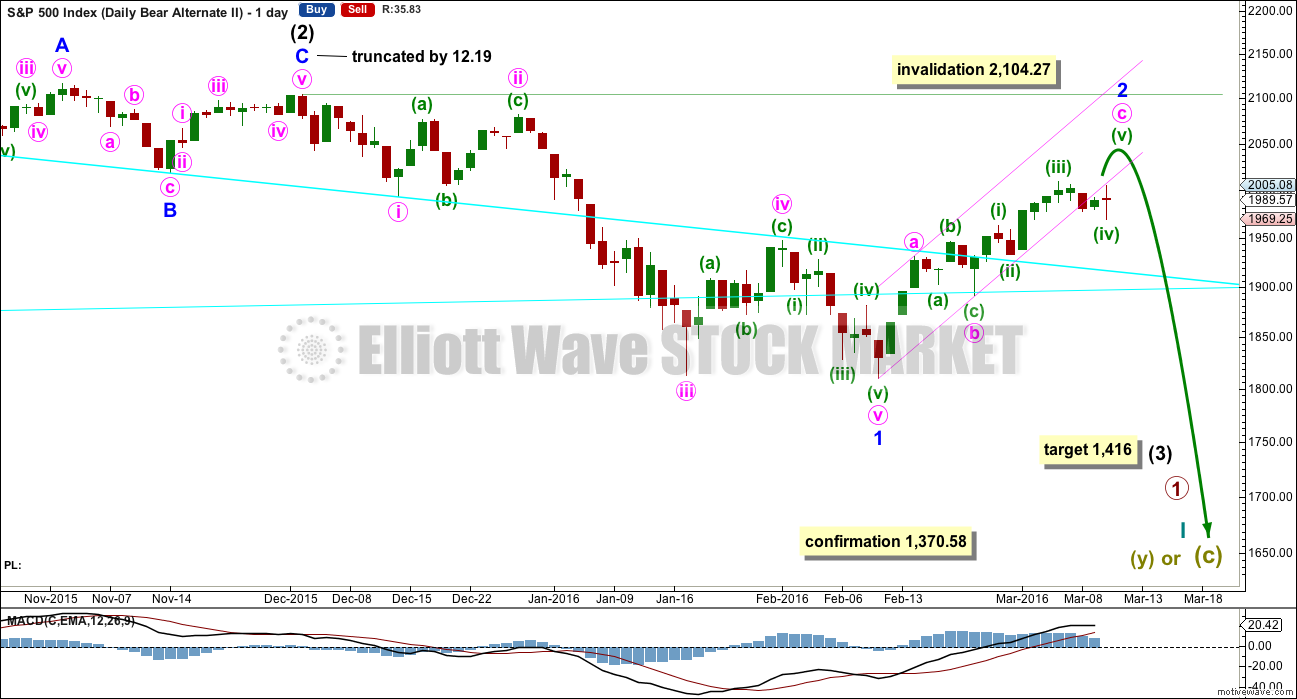
If intermediate wave (2) ends on 2nd December, 2015, then it will only fit as a zigzag with a truncated C wave. I have tried to see other ways of labelling this movement with the same end and so far I cannot find a better solution. The truncation is large at 12.19 points which gives this wave count a very low probability. But this now resolves the problem the main wave count has of proportion.
Intermediate wave (2) for this wave count is 45 days in duration. Minor wave 2 is now nineteen days in duration, so the proportions look good. It is also possible that minor wave 2 is a completed double zigzag lasting fifteen days as per labelling for this bounce with the main bear daily chart.
Minor wave 2 may not move beyond the start of minor wave 1 above 2,104.27.
This alternate makes a difference to the target. At 1,416 intermediate wave (3) would reach 2.618 the length of intermediate wave (1).
Click chart to enlarge.
Upwards movement may be an incomplete single zigzag. At 2,086 minute wave c would reach 1.618 the length of minute wave a.
The idea presented with the first hourly bear chart also works in exactly the same way for this alternate. Upwards movement may also be a complete double zigzag.
Minuette wave (iv) may now fit as a double combination: zigzag – X – expanded flat. While double combinations are very common structures this one does not have a typical look. It has a downwards slope and not sideways.
Minuette wave (iv) may not move into minuette wav (i) price territory below 1,962.96.
The breach of the trend channel is now substantial. This must reduce the probability of this wave count. It does not eliminate it though, fourth waves are not always contained within channels. However, the fourth wave within a zigzag should be.
The throwback to the trend line is of concern. If this wave count is correct, that line should not be providing resistance.
The S&P does not always fit nicely within trend channels. When it forms slow rounding tops, it breaches channels and then makes a new price extreme as the trend continues. For this reason, this alternate will continue to be published until price invalidates it.
TECHNICAL ANALYSIS
DAILY CHART
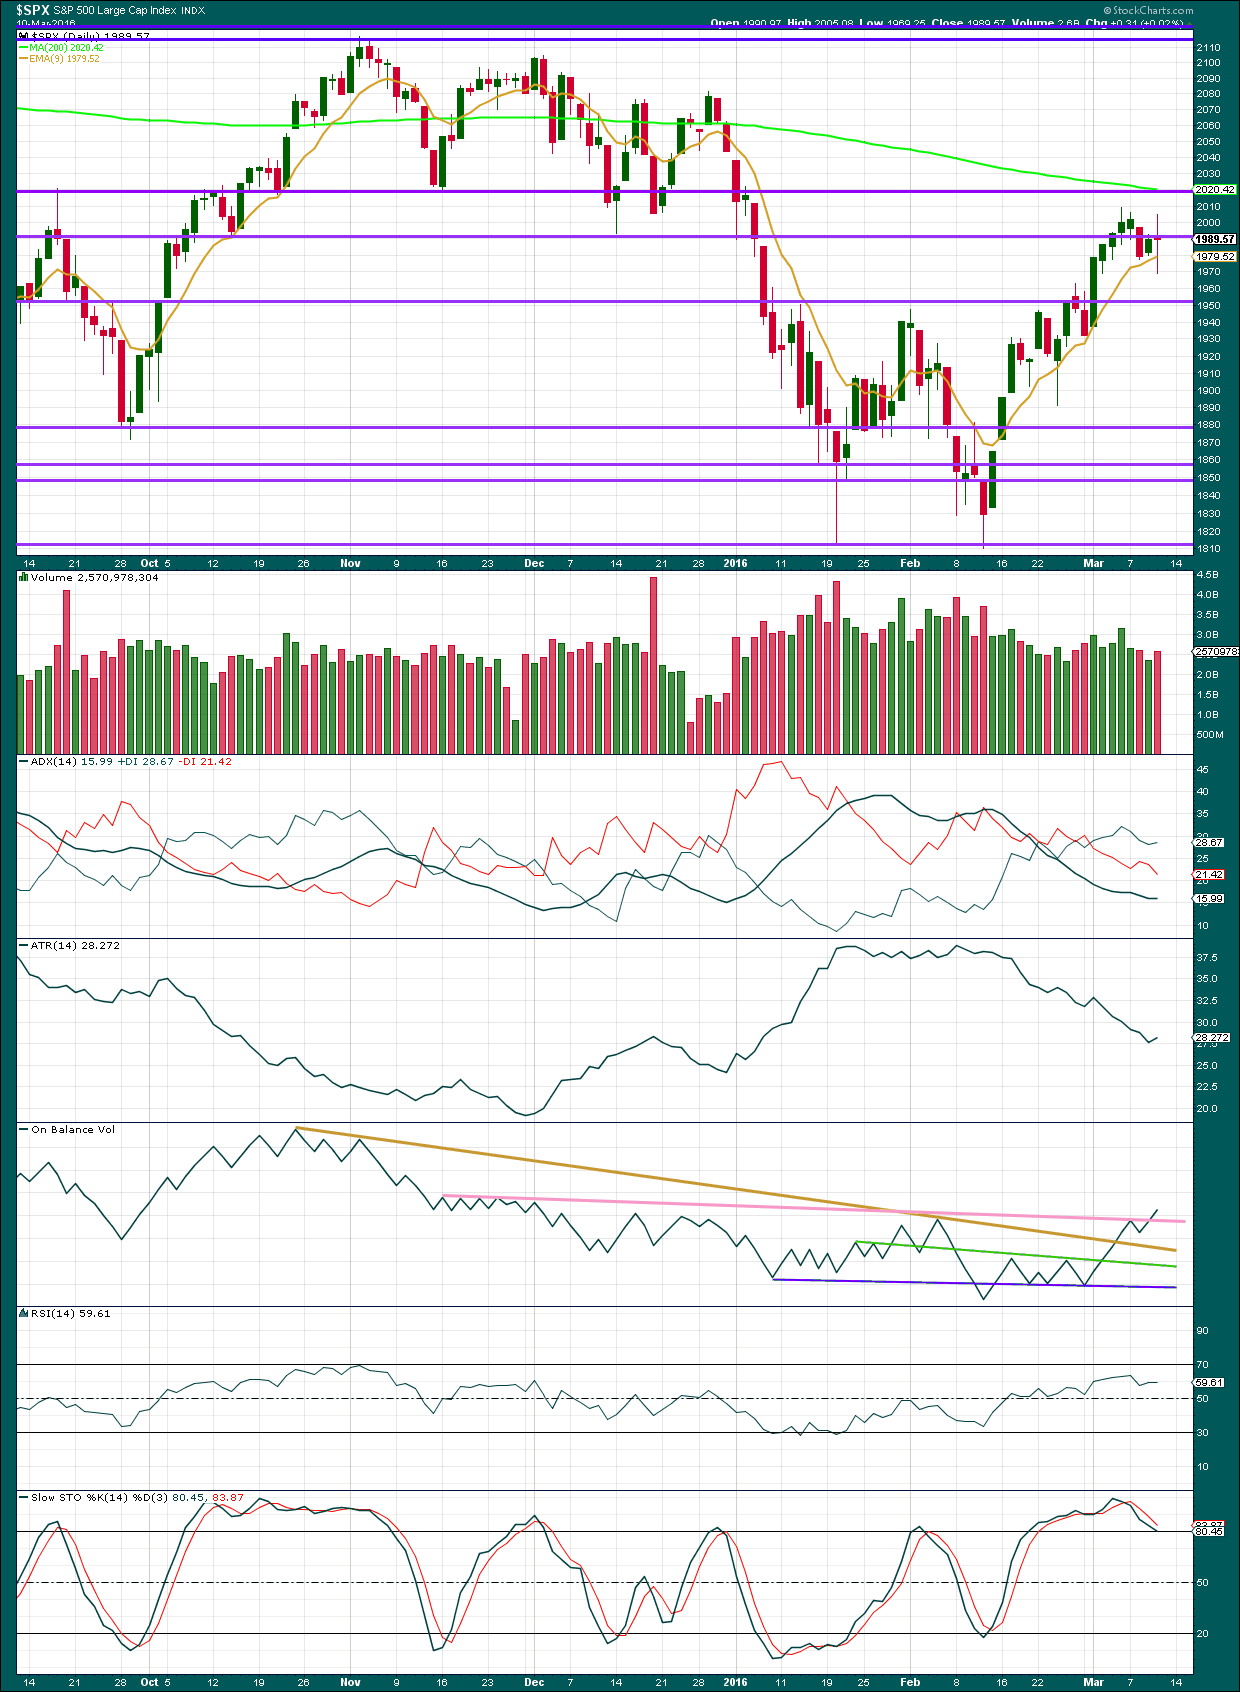
Click chart to enlarge. Chart courtesy of StockCharts.com.
Volume data on StockCharts is different to that given from NYSE, the home of this index. Comments on volume will be based on NYSE volume data when it differs from StockCharts.
The red daily candlestick for Thursday comes with an increase in volume. There was some support for the fall in price. Looking at 30 minute candlesticks from NYSE with volume, it appears that volume for downwards movement is stronger than upwards. This would support the fall in price and the bear Elliott wave count.
The doji comes in a slightly overbought market. This indicates the market is tired. A long legged doji as this is represents a confused market that is separating from its trend. This long legged doji is bearish, even though it is not appearing at the recent high.
ADX still indicates the market is consolidating, not trending. It is a lagging indicator. ATR is beginning to turn up today. This may be an early indication that the market may be beginning a new trend.
On Balance Volume has broken above the pink trend line today. This line is highly technically significant, so this is a strong bullish signal. This does not support the Elliott wave count.
RSI shows no divergence with price. Stochastics has yet to fully return from overbought, so it would expect at least a little more downwards movement from here.
DOW THEORY
For the bear wave count I am waiting for Dow Theory to confirm a market crash. I am choosing to use the S&P500, Dow Industrials, Dow Transportation, Nasdaq and I’ll add the Russell 2000 index. Major swing lows are noted below. So far the Industrials, Transportation and Russell 2000 have made new major swing lows. None of these indices have made new highs.
I am aware that this approach is extremely conservative. Original Dow Theory has already confirmed a major trend change as both the industrials and transportation indexes have made new major lows.
At this stage, if the S&P500 and Nasdaq also make new major swing lows, then my modified Dow Theory would confirm a major new bear market. At that stage, my only wave count would be the bear wave count.
The lows below are from October 2014. These lows were the last secondary correction within the primary trend which was the bull market from 2009.
These lows must be breached by a daily close below each point. So far the S&P has made a new low below 1,821.61, but it has not closed below 1,821.61.
S&P500: 1,821.61
Nasdaq: 4,117.84
DJT: 7,700.49 – this price point was breached.
DJIA: 15,855.12 – this price point was breached.
Russell 2000: 1,343.51 – this price point was breached.
This analysis is published @ 011:40 p.m. EST.
Folks,
FWIW McClellan Financial Newsletter just told that they are going bullish on the market based on the move on Friday. Wave 2 doing its job very well.
Thanks for the info Ris
Hello All,
I rarely post and have never posted anything of a technical nature. Please keep in mind that I am still “wet behind the ears” ( as a trader anyway) so this post does not rise to the level of any kind of analysis-but rather just my observations.
Here goes:
I believe that Rodney mentioned a double bottom at some point in the last few weeks (if it wasn’t you Rodney then my apologies). I had noticed the same and that post gave me confidence that perhaps this is what we are just finishing up now.
The chart shows the most recent double bottom as well as the one that I believe we saw at the last big excursion down last August. I computed the price targets for both based on information from Tom Bulkowski’s site (if interested just Google Bulkowski double bottom and you should get there).
That August/September calculated target sure came close to the actual price at the top (hats off to Mr. Bulkowski).
The interesting thing to me is the cluster of trendlines, the 200 SMA, that gap from 12/31, and the calculated Double Bottom price target. All of these observations except for the double bottom target have been made in this forum by other members at some recent time. Perhaps their proximity on the chart is more than just a cluster of coincidences?
Maybe price will top out around the 2035-2045 range?
Anyway. As I said at the top, just an observation. 🙂
Your thoughts and comments are most welcome.
200 dma is around 2020. A move past 2050 and I bail on short term positions. It would mean a failure to reverse after filling the gap at 2043.94 was inimical to the short term bearish case imo. Thanks for the chart!
Thanks Verne. I appreciate your response!
Hi rwatt62,
Imho there could be quite a few levels to watch out for including those in your chart. It is fantastic to have a chart back up a ‘hunch’ or view – thanks so much for taking the time to share that with us.
2,086 (A = 1.618*C) and 2041 (minuette (v) = minuette (i)) would also be good places for price to reverse imo. I also had a target of 2011 (where C=A) so I’m on the lookout for a reversal right now, albeit we are now a bit passed that mark.
I mark all the possible reversal points on my chart (there can be quite alot albeit some work more often than others – I put those in a different colour) and look out for a complete EW structure and reversal pattern at that point.
If I see a clear reversal pattern (5 down 3 up structure) *after a complete prior EW pattern (5 waves)) then that might give me confidence to take a *small* (not the farm!) position with a stop at the previous high. I then use EW invalidations to (hopefully) reduce my stop to a level in which I at least break even.
As tempting as (I personally know) it is, I would avoid betting the farm based on these reversal points / zones or getting close to them though. History shows that the odds of picking a top are terrible. Much better to await reversal, and have a small ‘punt’ (if you are that way inclined) and then throw everything at it once you hit confirmation points which Lara very clearly gives in her analysis.
Awaiting confirmation may cause you to miss out on counter trend rallies, though personally I think the classic ‘missing the party’ emotion will eventually get you run over. Longer term the odds are in your favour if you follow a few simple rules (though not guaranteed – a very low probability scenario could still play out).
That’s what I do anyway – and my trading account has not been negative for quite a few years (which wasn’t always the case btw!!).
BTW – it is amazing how well simple trend lines work (most of the time!! – not always unfortunately)
Thank you Olga! I really appreciate your views on trading and especially the intraday comments about current price action. I mostly follow along on the 1 and 5 minute charts and on occasion my counts are at least close to yours (on other occasions not so much and that’s when the learning happens).
Now looking forward to 2041 to see what Mr. Market does…
Yes, rwatt62, I confess to the double bottom statement. Classic patterns still work and remain one of many tools at our disposal. My rough calculation gives us a double bottom target of 2082 which is right in line with one of Lara’s bear count targets in the 3/11 analysis. There may be equal chance that we will resume the downtrend before 2080’s, however.
I have not yet decided what I will be doing Monday and next week. Options include:
1) Close short position immediately
2) Hedge short position
3) Just ride it out to 2085 or so. But this can go to 2104 as well.
I will not take a long position other than to hedge my shorts.
Thanks for the observations on volume.
Hi Rodney!
Thought that was your post on the DB pattern but I couldn’t find it… Sounds like we’re roughly on the same page. I took 66% of the difference between the lows and the high in the middle of the pattern and added it to that high to get my target. Sounds like you went with 100%? Olga has a couple of likely spots in the same neighborhood. Time and Mr Market will tell…
I’m SOH and a bit more relaxed at the moment.
BTW: Not me on volume. jbarnett11 kicked off that thread.
Thanks for your response Rodney. Much appreciated.
I’m in the same boat Rodney – I was hoping for a small W2 correction which we may or may not get now.
I’ll be watching structure on Monday – if it’s obvious that we are not going to correct anytime soon then I will probably bail at a loss rather than hedge or ride it out. I’d rather take the hit and move on if that appears the sensible thing to do.
The ‘as soon as I sell the market will turn around’ emotion can make it hard. I get over that by reminding myself that when the market turns I’ll soon make up for lost time / profit even if the turn comes sooner than expected. It’s just as likely that I’ll see a reversal pattern quite a bit higher and be able to buy back in at a better price. So it’s still only a paper loss as far as I am concerned even though I cashed it out.
There is alot to be said for position size management – that allows us to reduce potential losses and keep a cool head in these unfortunate situations.
For those asking about S&P 500 volume from the NYSE….this page has a chart which I change to a 1 month or 3 month view and then change the interval to “daily” and it allows you to see the volume trend in recent days. This site says volume yesterday was 641.71 million which was slightly lower than Thursday at 665.44.
https://www.nyse.com/quote/index/!SPX
Another interesting tidbit on SPX volume….if you look at a one day chart and change the interval to “10 min” you’ll see that the last two bars for March 11th represent 57.97 and 167.97 million in volume. That’s about 26% of the entire day’s volume occurring in the last 20 minutes. Despite this, price moved only a point or two during the last 20 minutes. The pattern is pretty consistent if you look at each day, it is not just an end of week effect.
Anyone have thoughts on how to interpret this? I ask because I know volume is significant from a technical analysis perspective, and it’s very interesting that such a large percentage of the volume occurs with very little move in price.
Yes, there is another trader, the OilandGoldGuy, who has noticed and systematized this observation. He advises that you only trade in about the first hour of the day and the last 1 1/2 hours. We tend to see major movement at the beginning of the day and then sideways action until about 2:30, when the original direction then resumes (after lunch).
Thanks jbarnett11 – really useful info (both posts).
This smells of my ‘keeping up appearances’ theory, albeit if it happens every day I guess looking at daily volume filters out those spikes. We are interested in daily / monthly volume relative to previous days / months as the basis of TA so the only way this could skew our TA would be if it is being ‘goosed’ only on certain days.
Certainly leaves one with a feeling of suspicion. It seems nothing is as it seems atm, albeit I would need to go back over data spanning at least a few years to see if this pattern is normal or not. It could just be crowd behaviour (i.e. everyone thinking the same as the trader thomas mentioned)
The failure of the bears to hold the round number pivots is definitely bullish in the short term. I agree that it really strongly suggests that we may not yet be in a third wave down. The distinguishing feature of third waves is the way they relentlessly take out previous support levels, and other pivot areas like moving averages and round numbers. I have learned (sometimes painfully!), that hesitation or protracted wrangling around these markers is a huge cautionary flag for the bearish side and will more often than not be resolved in the bulls’ favor with subsequent further upwards movement, even if in just the short term. I am still holding a few short term trades but will cut my losses if we move substantially above the 200 dma. If this is primary two up I think we are going to get back close to ATH.
I also expect the rogues to do another reverse split on UVXY to stop folk from selling calls against their position if we are in primary two up, which means we could see it plunge back to the teens. Volatility made all time lows during primary two up at the onset of the financial crisis and we may well see a repeat of that this time.
“Anyone have thoughts on how to interpret this? ”
High volume with minimal upward price movement is a classic distribution symptom. More crudely put, “smart” money selling to “dumb” money, and often heralds a top.
Makes sense (though don’t know if it is fact or not – I guess there can be lots of theories).
If smart money really is smart, then the clever thing to do is sell as much as possible without killing your marketplace (i.e. without sending prices lower due to oversupply of what you are trying to get rid off).
How they do that is anyones guess – I would imagine it would be algo based which cut off the ‘tap’ when price started getting too hot. I guess zooming into a 1min volume chart would quickly reveal that if it is going on.
On the other hand, try to dump 1 Billion all in one go in (say) UVXY with no lower price limit and I’d say you’d have a *huge* spike (down) in price compared to volume (as alot of people would be too suspicious to buy).
That’s what I would make of it anyway.
Apparently thinkorswim platform is the best in the industry
The probability of a 3rd wave down has decreased. Actually there is no 3rd wave down till may. I agree with the bear wave but the timing is not correct.
And what, may I ask, are you basing the May time frame on?
It really helps other readers when you provide some basis for your expectation of price action.
He He – you bit 🙂 🙂
(admittedly I did further down 🙂 )
Yes I did. But ever so politely, doncha think? 🙂
In the comment page, i would like to see how much money ppl have made since 2016 using elliot wave theory..
Roger,
I don’t know if you are new to the forum. If you are, welcome.
Many of us on this forum give our entry and exit points for our trades. I am very grateful that others share with me, so I can learn from them. I have learned more about trading equities here at this site, than any other place or source.
I have been a member since the beginning of 2012. I have been investing / trading since the early 1980’s. (I know, I am getting old.)
While Lara will be the first to admit, she can get it wrong, I am not looking for perfection in any analysis because it does not exist. Lara’s analysis is 2nd to no one. Her intraday commentary is invaluable. The daily analysis with graphs is exactly what I need. Having a video once a week and at special junctures is absolutely crucial in understanding. This forum is a high value added and I greatly appreciate it.
Now to answer your question, “Does anyone really make money on these analyses?” The answer is “Yes, I do.” I have seen others share their winning trades as well. Certainly 2015 was far from my best year because we had a sideways topping formation most of the year. Such a market is difficult to say the least. I have shared here a couple of times, my short term trading account is up roughly 29%. I am not counting my small paper loss of yesterday because I entered short on Thursday. I admit, I jumped the gun. But I do expect to exit this position at a profit. In fact, I most likely will be adding to it as price confirmations are hit.
That is another point, price confirmations and invalidation points are absolutely essential. Lara gives her members that information daily.
I do not share any information regarding the actual monies / amounts of my trades. That is irrelevant. I do share what instrument I am using and the percentage of a total position. For example, I might say, “I just entered a 1/3 position at such and such a price.”
One last benefit (because I could go on an on) is the help / advice of several of the members here is invaluable. It helps me to remain calm and make reasoned decisions rather than emotional ones.
I give EWSM the highest recommendation I can.
Good luck and again, welcome.
Rodney
PS – I used to subscribe to her gold / oil analysis as well. I can kick myself for allowing that subscription to lapse because I got in for a grandfathered and deeply discounted price. That was one of the biggest mistakes I have made since I started here. I was not trading gold or oil at the time and I goofed.
Seems to me you’ve taken your trading to another level these past few months Rodney – good for you mate!! 🙂
It eventually all falls into place – such a shame it takes (everybody I know – inc myself) so much pain to get to that place….
Hi Lara – that’s 2 members that used to subscribe to EW Gold (and would possibly like to again) but no longer do. Presumably there are others here also?
It is certainly highly recommended by me, as stated countless times.
I certainly would not want to tell you your business, but perhaps you could take a view / make a personalised offer (not necessarily exactly the same as was previously) based on historical subscription / personal circumstances rather than the black / white approach currently offered?
I know personally that my subscription was recently cancelled for this site so had to subscribe again – if that happens in EW Gold then I would suffer so probably not bother re-subscribing under the current conditions
(FYI – I got an email from PayPal stating payment had been cancelled by EW Stockmarket – there are tons of funds available so it cant have been due to that – I emailed you at the time, but go no response so just signed up again (as sub price was the same anyway)).
BTW – I totally understand why you have the system the way it is. Just offering what I hope is taken as a constructive point of view.
PS – I would like to change to 6 monthly payment rather than (current) monthly on EW gold (so as to avoid risk of payment being cancelled again), if I can do that without financial penalty.
Would be great if there was a members option to change sub type.
There may be others. I’ve spoken to Cesar and we will have a think about how it would work, offering a special rate to members of one site for the other.
If we do it will be a one off short term offer, probably at the same time we put prices up next week. My CMT and CFA now has to pay for itself.
Regarding your paypal cancellation, that wasn’t done by us. We almost never cancel a members payments, that wouldn’t make sense for us to do so. Paypal is random sometimes.
We did get your email, but Cesar says that because you immediately signed up again he left it because the problem was fixed and so we figured you’d sorted it out and didn’t need our help. Perhaps a quick email from him would have been a good idea.
I wish all our payments could go through SwipeHQ but we can’t synch that gateway with our website. All SwipeHQ payments must be processed to our site manually, and with a large membership thats a lot of work. I have asked them to upgrade their service to synch with our membership and payment plug ins, but I don’t think they will ever get this to happen. I’ve been waiting over two years now.
Members cancel for all kinds of reasons, and when they do we get notification of cancellation from paypal. I think the automated paypal email is the same whether we initiate cancellation or the member does; the member receives an email that we cancelled the payment profile, even if it was them who cancelled the payment profile. This causes some confusion I think.
Normally paypal tries again in five days time if a payment is skipped. A skipped payment automatically suspends a members access to analysis, prompting them to contact us and then we can sort it out. But occasionally a members payment profile is cancelled by paypal and when that happens we have absolutely no idea why. Paypal customer service is… not very good (and that is putting it very nicely). So we get no answers and no assistance. And so I cannot tell you why that happened to you. I have no idea.
Thanks for your detailed response Lara – going forward if I have any issues like that I’ll just email you.
I’m sure whatever random act Paypal decides to do in future (hopefully none!) we can work it out.
Zero from me. Lots of lost profits as I held on for the big next wave- still holding on- the profits will come……hopefully
Roger,
I use to be a subscriber in the past for both of Lara’s EW for S&P as well as Gold service. Due to some personal reasons and circumstances lost the grandfathered subscriptions advantage.
I can tell based on my activity alone from last week that I made a decent amount and on other trades (that were long term), I am better positioned.
In the regards to your question about profit or losses, these are going to be driven by the decisions that you make after considering all the information and analysis. I have said this before (and will repeat again today) that Lara does provide pretty good EW analysis based on her knowledge of EW (I find that she is more precise compared to many other services including EW folks).
Hope this helps and I personally do not consider every analysis to be perfect but as long as gives you good guidance, rest is your risk appetite and financial knowledge.
Will photocopies of my bank statements suffice Sir?
Some members have the patience of a saint 🙂
It does seem as if newcomers to the site need a period of learning proper decorum does it not? 🙂
Some fairly random comments a few minutes after each other – bit strange…
Exactly the reason my mates hide my phone when I’m out on the lash! 🙂 🙂
Serious question. Does anyone really make money on these analyses?
Looking purely at EW counts of other markets that are (currently) showing significant correlation with S&P, I would say that this market will move a bit higher early next week (but not by much), and then take a serious dive lower.
The problem with correlation is that it exists until it doesn’t, so you cannot bet the farm on it. But when there are a few balls up in the air I like to look around at what is going on in other markets (and I have no other (reasonable) choices atm – I am locked in for the ride).
Volume and RSI today made this move up look very suspicious to me so I’m gonna take a calculated risk that the correlation is still in place until price shows me that I’m wrong.
NYSE website showing todays volume at 641.7mil – that’s qute a jump from earlier comments. Is that more or less than yesterdays close vol?
Yep! That is what I am seeing -641.7 Mil. EWI has an interesting chart showing a break of the trendline in this last move up and two throw-backs to touch the underside with the line providing resistance today. The line provided support with three touches on the way up. Steve thinks the move is over or close to it. I want to watch the 200 dma and yes, those confounded pivots of 17,000.00 and 2000.00 before I decide on my next short term move… 🙂
OMG – hold the front page…. take back everything I said…
If Mr H says it’s nearly over then this puppy is headed straight for the moon!! 🙂 🙂
I told him he was the ultimate contrarian indicator so you may have a point there! This actually is the very first time I have seen him and Prechter on different sides of the argument so far as the wave count is concerned. Prechter thinks we just completed an intermediate wave four and are now in intermediate five up. If we overtake the 200 dma I will assume primary 2 up until and unless we make a new high.
Per Fidelity volume on the S&P for the last 3 days have been
Today – 575.9 mil
Thursday – 665.4 mil
Wednesday – 608.0 mil
Thanks Barry. Hopefully NYSE has followed a similar trend – can’t remember what the volume was yesterday.
Note to self… write it down!
I think it prudent to reload light hedges to the upside against another manic move up on Monday. The absence of a reversal to day favors a continued move higher. No resistance from 200 dma also very problematic for the near term bearish case imo. Have a great weekend everyone!
My advice: Don’t leave shorts on unless you have huge stop loss and you just gotta (it is your strategy). Most likely Monday gap up and end to all this nonsense next week, after which either comes the real decline or just some another retrace only- but a good one this time around! Not to be taken as any advice, anyway I am ashamed to say I was long today 😛 but made some scalping on ndx100 after yesterday loss on it as I remained short till today at 4330 and reversed there lol … Gold went best today! I am not betting on what I just said so I am closing all now, not risking till monday nothing … Have a great weekend everyone and ty all!!! 🙂
Don’t be ashamed…we’ve seen a pretty much 200 point straight up move in the S&P off of the lows….all the while i am sitting here looking for a 3rd wave…like a kid waiting for Santa to come down the chimeny on Christmas
Volume continues to be much lighter than yesterday and the margin is widening from earlier today.
392.953 Million Today at 3:40PM
487.292 Million yesterday at 3:40PM
OH… the pain… OH the carnage… I can’t take it any more!!!!!!!
HELP ME…………… HELP…………… HELP ME…………
LOL………….. Time for Johnny Walker Black on the Rocks! Have a great weekend all!
This is what second waves do, particularly at primary degree. If we blast past the 200 dma next week, I will definitely thinking P2 up.
DJI, lately the strongest. piercing the 200 dma, SPX kissing underside, NDX comp. not close….
This volume profile today is more than bizarre…of course nothing new really, but today particularly surreal….
Yep… another failed move down!
Time to re-evaluate everything! The FIX is in!
I would hardly view it as “failure” per se. The corrective wave is simply incomplete. There is no such thing as failure when it comes to third waves, particularly at primary degree…
That little pop high just invalidated this being a W4.
As per Lara’s earlier comment: “Which would tell us that the next drop down must be the middle of a big third wave.”
yeah,, looks like a set up into the fed meeting on wed.
Where did she say that exactly?
Ok, I see that posting now…. missed it .
12:55,, just after when she was cussin .
Here is another clue that will give us a heads up, ahead, so to speak, of price action. If we see a new 52 week low in UVXY below 23.83, that would be very significant. While I could not cite any technical reference for my own conviction of what it would imply, from the perspective of having watched the way it behaves for some time, that would be very powerful suasion that we are in a primary degree wave up. It would signal a level of complacency and optimism about future price action, unique to a primary two wave up. That for me, would represent the final piece in this amazing jig saw of a market.
That possible primary wave count also has me thinking about what kind of wave distortions would be observed when CB intervention was actively trying to arrest a primary degree market decline. Remember that massive volatility spike back in August? That may have been a subtle hint of the very high degree of the decline we were seeing, even if it did not travel as far as would be expected. The point is this kind of sideways meandering move at primary degree is exactly what I would expect to see happen with banksters hard at work, fighting against the trend, and trying to influence market sentiment. I like to ask my self what wave count best fits the bankster personality, and this one sure fit the bill. If we do not see a reversal today, I plan on reloading upside trades.
Well if that’s what Mr Market has in mind, then he sure is one sly old dog (no suprises there).
It’ll take him some serious convincing (price!) to get me going long tho’. I’d rather SOH and miss the party than play that game thanks very much.
Yea… agree… Go play gold instead, it more fun! 😛
Yep – certainly seems alot more predicatable atm.
You are absolutely right – if the waves aren’t clear (or favourable) in one market then trade another or stay in cash (SOH).
There is always something out there.
I know is sounds completely crazy and I don’t blame ya. You cannot underestimate these banksters…very, very, tricksy. It also goes a long way to explain our perennial frustration in looking for a third wave down that never seemed to show up. We did not see it because it simply had not yet arrived.
When primary three down starts, or if I am wrong even just the strongest portion of intermediate three, none of us are going to be scratching our heads and wondering if it really is here or not. I have had that feeling observing even the strongest declines to date. It starts out convincingly enough, but then, predictably, almost like clock-work, it peters out, and the market re-traces much of the decline. Even Prechter had to retract an interim report saying that the intensity of the January decline was consistent with a market crash, when later in the day, the steep decline was almost miraculously arrested and the a/d ratio dialed back hugely. It certainly has been a frustrating few months for us bears. because all the indications are that we should heading South and doing so big time…perhaps not just yet… 🙂
ditto
I keep asking myself, Has wave 2 or what ever correction we are in to the bear trend, has yet done its job? I can reasonably imagine at least that all over the world bearish inclinations have changed to bullish. I think the wave two has done its job. The next move down can be viscious and cruel to those who are just getting on board the bull train. And just before it derails. Too bad for them. But as Olga said yesterday, me and Mr. Market have some old scores to settle.
Still…..long! The recent correction was a type 4 wave I think (and those waves 4 almost always breach channels as some of you may know). From what I think (and now more convinced), we are in wave 1 since we bottom at ~ 1,800s. And it still pointing higher, but from now on it will have higher volatility. If that is ok, I will short the market for wave 2 in April.
Looks like you were right about that bullish call. If it is only wave one, the indices should easily overtake the 200 dma….and that would be quite bullish indeed..
Why “Dammit”? My S&P numbers show we have not broke above the 2019.36 level yet??
Thanks
Think that was just because we took out 2009. No need to panic (just yet 🙂 ).
We are just throwing around possible ideas at the moment – nothing is set in concrete and nothing has changed at this moment in time imo (other than the main count invalidated). No doubt Lara will clarify all in tonights update.
Volume continues to be much lighter than yesterday and the margin is widening from earlier today.
290.047 Million Today at 1:55PM
358.554 Million yesterday at 1:55PM
Yep – all these data points just got really important.
Awesome. Thanks.
I have an intra-day high of 2019.90 for SPX…
NO… NO… NO… 2018.91
Yep I got the same as you – poss W4 not invalidated yet so quite an important level.
ES did NOT break yesterday’s high of 2010.25 only got to 2009.75
That is very interesting!
Yet SPX broke yesterday’s high.
Which is more accurate? Well more traders use the Emini ES.
ES also has volume materially lower than yesterday.
I have looked at that data feed on multiple time frames and it does show 2019.90. However Investment.com is the only one showing that number. The other feeds are 2018.91. Strange!
Jon Bon Jovi wrote a song about this thread!
Livin on a Prayer?
Dead or Alive?…. 🙂
Now it is broken 2019.86 high… but that elimination point is ONLY for the Bull Hourly Count. All the Bear counts are still in play!
To me “dammit” expresses the frustration that all surprises from SPX 1810 have been to the upside, not a single one to the downside.
Dammit!!!
Lol. But that’s ok. I just have to add to my short positions now. But all signs point to a higher market going into the FED meeting next week. Will keep my powder dry until then… I’d be wiped out if I had short term options expiring in March. I don’t know how Verne and Olga do it. But every single time I make a short term call, I’m wrong.
Personally speaking – I stay (very) nimble….
Yesterday I sold 50% of my short into the pullback and the remaining almost at the end of the pullback with clear intention to go fully short if we went below confirmation.
I’m caught up now with a 20% UVXY position that I bought after hours. I intend to offload that on the next correction (very likely at a profit if we get a W2 correction). I didn’t panic and sell at a loss at this new high.
The important points here are confirmation and entry, exit strategy (*before* placing the trade).
Hope that does not sound like I am talking down to you – certainly not meant that way. Trading is really hard and if I can help with a few pointers then I’m very happy to.
I’m taking heat atm – as I said before, there is no such thing as a perfect trade.
Personally I think adding to your short on new highs (averaging your position), is pretty risky. I think probability is still on your side but price could change the direction of the wind. I would (personally) sit on what you have got and add all the dry powder in one lump sum when we go below confirmation (which unfortunately is now lower than it was yesterday)
I don’t feel like you’re talking down at all. I’m learning. My question is this: how could I close my short positions in a pull back like yesterday when I’m expecting the market to start its 3rd wave down? Also knowing that when it starts going down, it will go down so fast that I wouldn’t have a chance to open short positions while it’s happening?
You could have easily closed it – exactly as I did (and posted in real time).
Sell as close to confirmation as possible – if market continues through confirmation you’ve lost a few points and a bit of commission, but also gained a huge reason to throw the kitchen sink at it.
Confirmation points are by their very nature also possibly very strong supports – if they don’t get broken you can see huge rallies from them.
I agree that if we gapped down today, you could gap through that confirmation. That is the risk and the only reason I am currently underwater with UVXY.
Does that make sense? I assure you that once you have mastered this your trading account will be very happy with you.
You also need to control your emotions when trading (not as easy as it sounds!!). “Also knowing that when it starts going down, it will go down so fast that I wouldn’t have a chance to open short positions while it’s happening” is an emotion which will get you run over imho.
Got it!
Many thanks. I will definitely apply these to the 1/3 of my dry powder that’s left for me to get this down…
Impossible to do it with options… you have to use the ETF shares.
Sorry – I didn’t read that you had options.
That’s exactly why I don’t touch options.
Trading them takes a totally different skillset to what I have (and alot more intelligence than I have – price is hard to predict, but predicting both time and price??!!..).
I guess in that case my answer to your question of how I make money should have been one sentence: “I won’t touch options” 🙂
Any trades you see me make are using actual ETF shares – that’s hard enough for me.
Joseph (or anyone else that knows),
Why could you not sell your options and buy back a few points lower (after going through confirmation)? Would the pricing not allow it (i.e. disproportionately shoot higher)?
Have to admit I know very little about options – as you can clearly tell from my question above.
Not as liquid as shares… No reasonable Bid & Ask…
to get out or in you would have to hit either one or risk not getting trade executed.
In that case I would not touch options with the proverbial barge pole until (at the very least!!) price confirms. That’s unless you are a pro and playing with past profits (house money) or you just like being poor.
Seems to me you might as well burn your stack. At least that way you got a bit of heat out of it (and smoke! 🙂 ).
Really worries me that members might be playing with these based on too much faith in any one EW count (without even waiting for confirmation), which could easily morph into another count making their account turn to dust (due to time – even though price is eventually right).
Is literally playing with fire imho – unless I’m missing something???
Leaps also in the red by a bit, but not at all worried! 🙂
Confirmation is now 1,930.68 and there is plenty of wave to surf if we get there so no need to throw any more powder at it now imho (unless you are scalping with a good entry / exit strategy).
Market could go alot higher than we think – you don’t want to end up mega frustrated and selling just before a crash down. Once we start falling properly, you’ll know about it.
Just my 2 cents 🙂
Great advice Olga.
Ari,
As you know I too am taking the heat here. One lesson I need to keep learning is don’t always close a position the moment it goes against you because it so often reaches a better exit price. If the wave counts stand, we should see some sort of a correction to unload short positions.
If we move up to 2040-2050 range, we will fill the gap in that range on the daily charts. It would most likely drive the MACD to the +30 level and the fear greed index to 80+. I would expect a good move down would begin around that point. Just my gueses though. It is common for a bull-bear fight around the 200 day ma as well.
When my analysis gives me a better exit point, then I am willing to take the heat a bit longer. But if not and I admitt I am not sure what is happening, then I am out.
For me, not yet. Thank goodness for smaller positions.
My final comment is on the emotional or psychological side to trading. I must continually work to make unemotional decisions. That is more difficult with losing positions and even winning positions.
Lara will give us her analysis this weekend. That will clear up a lot as well as tell us what the risks are at this point. Right now I believe we can go to 2104+ without violation of the current bear counts. I won’t wait for that to unload my position but I strongly think, not feel, a better exit point will come. I must keep my feelings at bay. If I do not, I make a lot of dumb decisions and if that is true, then perhaps I should not keep trying to trade the indexes. However, be encouraged. Don’t quit now. You can do it. And I don’t beleive in jinxes or negative self talk. Neither is ever helpful.
May we all rest well this weekend.
Thank you both Olga and Rodney for your time, thoughts, and sound advice… This forum has the best learning experience for me…
For now I’m just patiently waiting for the right moment.
And yes, may everyone have a great weekend 🙂
A few weeks ago I started mulling the possibility of primary 2 up and thinking if it was it would really screw up short and possibly medium term trades. I did not want the hassle and moved 90% of my shorting capital into 2018 leaps and use 10% for occasional short and medium term trades. I may have to exit a few short term trades if this is primary 2 as I have a few April expiry positions that would not fare well were that indeed the case… 🙂
Leaps are of course better… I use those mostly for gold trade. Most of my position is for June expiration, and a little in September… If I get to add more to my position, I may in fact use leaps for peace of mind…
You mind of I ask what you moved your leaps into?
Currently I’m positioning myslef into SQQQ’s. I think they have the best return, percentage wise…
I never thought this would happen to me, but I’m staring to eerily sound like Ace!!! 🙁
I think its kinda hot when she cusses…
LOLOLOLOLOLlllll…
That just made my day…
What about this?
The 0.618 Fibonacci ratio is close…. but for this idea price should end above the end of (A) at 2,116.48 so that (C) avoids a truncation and a very rare running flat.
This would be a nerve wracking wave count. If price did manage to get above 2,116.48 it would be doing it as a five. Almost to a new high, absolutely everybody would be convinced the bull market is back, including most Ellioticians and contrarians.
This resolves the problem of proportions, the truncation in my bear alternate published with this analysis, the subdivisions all fit well.. so far it looks pretty good to me.
Are you happy with the time proportion of possible Primary 1 to Primary 2? (and P2 still not finished for a while)
I’d be suspicious about that and the fact Primary 2 went sideways (I realise that it doesn’t break any rules).
Personally I think it’s a count that must stay on the table if it is probable. Many thanks for working on it.
From a trading point of view it is a difficult one for sure!
Yeah, I’m happy enough with the proportion.
Impulses can be quicker than corrections.
Primary 2 is either a running flat or expanded flat. It can’t be a regular flat. So yeah, it would have a sideways look to it if its an expanded flat. That would look wrong.
But if it ends as a running flat it would be looking right.
So the conclusion would be that for this wave count to have the right look it would be calling for a very rare structure, a running flat.
Primary 1 lasted 91 days. Primary 2 so far 113 days and needing more. So proportions aren’t too far off even so far, and if it keeps going up would still be about right I think.
Intermediate (B) is 1.25 X intermediate (A).
Within the normal range of 1 to 1.38 for a flat correction.
Thanks Lara – I’ll be watching Minor 1 high (within C of Prim 2) like a hawk!
There might just be another W4 sniffin W1 trade on the cards 🙂
And that would be the final price confirmation that the market is crashing. A new low below 1,930.68.
Within the impulse down (which I’m seeing now in the same way for all bear counts with the exception of degree) of primary 1, both intermediate (2) and (4) lasted much longer than (1), (3) and (5).
(1) = 3 days.
(2) = 59 days.
(3) = 4 days.
(4) = 17 days
(5) = 8 days.
So I’m fine with proportions in this idea.
Also, another thing this reminds me of is that eventually when the hard drop down comes it will be not just deep but likely very fast indeed. Very fast.
And it also reminds me of some comments Verne said about the last wave down. That it was such a structured decline. We had those small regular corrections along the way that kept perfectly hitting a trend line. It appeared to be a “controlled decline” in his words.
Could that be because it was a B wave?
Anyway, this is just an alternate idea. Technicals will have to decide it.
Price would confirm it above 2,104.27.
The more I think about that chart, the more I wonder. So far as I know, I have not seen a single chartist remotely suggesting that we may be at the cusp of a primary third wave to the downside. It would have to be the absolutely stealthiest primary third wave ever observed. Just think of it! What a fitting end to the mania of the last seven years, for market participants to find themselves engulfed by a primary three down….THAT NOBDODY SAW COMING! shivers me timbers matey…!
I think that is EXACTLY what’s going on! Lara, you tha’ man! (er…”Lady”) 🙂
Another trader apparently does as well. He/She bought a monster truck-load of SPY calls this morning.
I’m not convinced that technicals / sentiment support it. But if price starts to suggest it then I’ll be taking it very seriously.
This is where Lara’s superb TA skills will separate the wheat from the chaff. EW alone is often not enough imho.
Agreed completely.
If we see light volume and divergence with RSI then this count will be an alternate.
And if I keep seeing alternates then I’m going to have too many charts to publish, this analysis is going to be way too long!
Absolutely. Thanks so much for that additional perspective. I could be wrong, but for some time now UVXY has been signalling a higher degree wave two up so I guess we will see eventually what really is going on.
Correlations are there one day gone the next, but gold seems to be setting a pretty good roadmap for S&P atm. I kinda expected us to invalidate today based on golds short term forecast, albeit I also had in the back of my mind that they don’t have to always move in (inverse) lock step.
That might provide clues as to which alternate is correct, albeit no doubt you’re already a few steps ahead there.
Yes, I have that in my mind also. Quite strongly.
But I don’t want to assume that the correlation will continue. As soon as I do that, and publish analysis of one market based on my analysis of the other… it will disappear.
Interesting observation about the rapidity of the impulses down. What is coming could end up being a market crash in every possible sense of the word- sudden, violent, utterly destructive. I can just imagine all the folk looking around in stunned amazement at the detritus of their demolished portfolios, at a complete loss to comprehend how such devastation could transpire in such a short time; this is going to end badly for a lot of folk…very sad indeed…
Thanks for finding this wave count. Now the charts presented will be easier to deal with, less turmoil.. we hope!
Looking at the bid/ask of those SPY calls I did not unload a moment too soon. It can be a useful proxy for scoping out where price is headed in the near term…it’s headed South…
As Lara just stated – this could be a ‘W4 sniffin W1 play’.
Well…… that’s one of my all time favourite trade setups – so (for richer or (probably) poorer), I added a bit to my short with a stop just above 2019.39.
Will either get stopped out, or offload it (*if* the next move down confirms corrective).
That’s the plan! 🙂 Yer don’t often get to play that trade at this degree so gotta take it when yer can!!!
You go girl! You’re my kinda trader…you gunslinger you!! 🙂
Ironically, I’m kinda hoping I’m wrong because I want this to be a wave 2, not a wave 4. But will happily take whatever scraps the market throws my way.
We’re possibly overdue a correction now anyway – I can count a complete impulse now, unless its wave 5 extends, but its wave 1 yesterday seems to have quite clearly extended already.
A high above 2,019.39 would tell us that this can’t be a fourth wave correction, it would have to be a second wave correction.
Which would tell us that the next drop down must be the middle of a big third wave.
And so I’ll be really wanting price to make at least a slight new high above 2,019.39 so we have that small clarity at least. It would reduce the number of possibilities to slightly more manageable.
Dammit.
And that’s why price confirmation is important for this market.
I’m so glad that one of my trading techniques is to pull my stop to just after my entry point as soon as the position becomes somewhat profitable. So I have no loss today, only a tiny profit. The position didn’t “stick”. That’s okay. I have all my equity to try again when I’m ready.
The S&P just does not play nicely with channels. It tends to breach them then continue in the same direction as previously, this time up. Which is why price confirmation is so important for this market.
I’ll be watching volume and RSI closely. If there’s divergence with RSI and light volume then this may be over quickly. But if volume ends heavily and RSI makes a new high then we should be going up for a while yet.
The target at 2,086 for the bear alternate for now is the most likely; A to = C is the most common ratio. If this fifth wave of minuette (v) = minuette (i) that would be at 2,041.
Thanks Lara – c’est la vie!
Was that supposed to be 2086 where C = 1.618 * A (or have I got my maths messed up??)
Oh yes, sorry. 1.618.
“Dammit.” JANET!! 🙂 🙂 🙂
Any Rocky Horror Picture Show fans?
That’s the first thing I said when I woke up this morning…
Dammit!!!
🙂
Thanks for the update…
well… Im waiting for those foot long red candles
Subway sandwich?? 🙂
Kinda crunchy no?? 🙂
waxy?
That too! 🙂
Below 2015.64 this current tiny 5th wave move is likely over – but it could still extend (below 2005.86 that possibility would be elliminated and at that point a fairly decent sized retrace should take place (at least) ). Below 2014.29 things get better.
This small wave 5 from 2005.86 counts quite nicely as an impulse so there should hopefully be no expanded flat scenario ‘(fake) 5 down’ games.
If that was the top of the current wave (still uncomfirmed) then we should retrace to at least 1994.02 (and quite possibly 1988.18) imho
+ 217 in the DOW… BUT
Volume is very light!
205.054 Million at 11:55AM Today vs 246.114 Million yesterday at this same time.
Starting at NOON will FADE away!
Just the kind of volume you need to ramp things up for as little cost as possible.
A big gap move like today should have massive volume if it was real (imho)
If anyone wants to know what I mean – just check out the volume on the next gap down 😉
Recent action – is that it for this wave?
A move below 2009.10 might be the first clue – 2005.86 would confirm it.
As you can see from the chart – RSI aint buying it atm
One thing is for sure. If this is a false break-out from the consolidation pattern of the last four sessions it will reverse immediately…not later, not Monday, but NOW. If it does not, strap in, we are going to 2075 at the least…
@ approx. 2087 C = 1.618 * A.
C=A @ around 2011 – so we are at a possible reversal zone right now.
The fear greed index has reached extreme greed at 75 for the first time in this bear market rally. In February it was at extreme fear at 7. I stated then I was looking for amove to an extreme greed figure. I am not sure anyone agreed that was possible.
The daily MACD is at 22+. In February it was at -30. I stated then I was looking for at least a positive reading but would like to see it go to +30. I am not sure anyone thought that would happen.
All along my question has been, “Has this second wave done its job in convincing the vast majority that the bull market has returned after a correction?” I am thinking it has now done its job.
I am not trying to blow my own horn so to speak. Rather I am just pointing out that we have moved from a very oversold conditon to a very over bought condition. Now the next wave down has lots of room to move. If it does so quickly, it will take time for the momentum and sentiment indicators to catch up meaning it can go a long way down before reaching oversold again. Just my opinion of course.
Tis good to know – it might go above 90 if we reach (or exceed) 2041 (W5=1) target!
Will be watching any pullbacks (for form) like a hawk..
Feel free to blow that horn. You exactly nailed it! We could still go higher…but I do see a nice rounding top on 1 minute chart…now for an impulse down, if you please! 🙂
Looks like that was a fifth up. Let’s see what kind of pull back ensues…it will be quite probative…almost at the first gap…filled! 🙂
Lara has briefly alluded to it although we have not discussed it much. She said how far the next decline extends would determine how she chose to ultimately assign degree. What about the remote possibility of our already being in primary two up??
This has been in the back of my mind as the ultimate houdini move of this crazy market. It would totally confuse the bears by how high it goes and probably dislodge 95% of them as it continues higher. Then once it turns down, just about everyone will also be expecting a brief correction in an on-going bull market as it goes on to fall by 80% without meaningful interruption. I know is sounds far fetched but that is just the kind of conclusion I would expect from a market that has been screwed with for the past seven years- a concussive, catastrophic conclusion. Bubbles don’t just subside…THEY BURST!! Any thoughts??!! 🙂
I have another possible idea forming…. will chart it and see what you think…
What if primary 1 ended where I have intermediate (1), and this upwards move is primary 2 as an expanded flat?
This may resolve the truncation with the new alternate….
Lets see what it looks like….
or could be wave 1 of 5 if the bull alternative is playing out. Let’s see if we get a 3 wave down.
The Bull Counts though still possible as Lara’s counts show… IMO will not occur.
When you factor in everything (Data, both technical and fundamental) out there… only the Bear Counts can be valid… the only question IMO is which Bear Count will play out.
Until we either get technical support for the Bull (or invalidate the Bear), I just cannot see any support for the Bull count.
The technical damage done to this market will take a miracle to put right.
Miracles are in short supply but I guess they can happen.
I also cannot see that most companies support current valuations, let alone much higher ones. Not that fundamentals matter anymore – thinking that would be seriously insane in this current climate.
People are buying based on selling to a greater fool / getting out the burning building before everyone else. That alone has historically proven to be a bad sign for the future imho.
Going below 2005.86 now likely means this wave is over – until then it can extend higher (but as W3 is shorter than W1 it cannot be longer than W3). That’s unless W3 is currently still extending…. If I see that I’ll chart it.
But this structure (when finished – it still is not confirmed finished) might only be wave 1 of 5 of C.
If pullback (after going below 2005.86) is a 3 wave structure then we should look out for this going alot higher in W3 of 5 of C
If W5 = W1 (of C), it would give a target of about 2041 – so I think this is probably only W1 of 5 of C.
Awaiting W2 of 5 of C to offload UVXY. Until then I’m gonna have to buckle up and take some heat.
Oh you were speaking of the entire up move from 1800… yea for that if for the bull count, then w3<w1 and then w5 should be like 0,618xw3 or smth like that so 2047 i calculated potential target including futures activity.
W3 is longer then W1 on the 1min chart on all indexes by a very small margin, Olga. So this small W5 can still extend even =w1+w5 or stop here at 2017 no ideea, but there should be wave ii down after a pretty big retrace i would expect….
Yeah – you’re right – W1 is 23.4 points, W3 is 25.05.
I did it with a line measure – should have measured it properly using levels.
Yep! The banksters are furiously working over-time on this last cash dump. It is always a dead give-away when they buy futures from deep in the red. It probably will continue up to at least smooch the 200 dma, and possibly even pop a bit above it….the talking heads are all attributing it to the fact that folk took a “second look” at the Draghi plan and it looks a lot better that the first look suggested….right!!! 🙂
NO need to panic… this entire move up will begin to slow and then fade. Volume to this point 10:30AM is much lighter than yesterday at this time in SPX.
The overnight move in ES in volume to 10:30AM has been an extreme fraction of yesterday’s ES volume.
In fact this looks to be a test of the trend line drawn form the SPX 1810.10 low to 1891. The SPX last kiss of that trend line from the under side?
Divergence already present on RSI – this small (poss) wave 5 pop higher seems to be running out of steam. It should be final wave, but is it the final W5 of C?? Or only W1 of C??
Tick tock…..
The under side of that trend line appears to be at 2019 SPX today. That may tell you something and this is at the hourly chart level.
Almost exactly the 200 DMA….
I have the 200 Day MA at 2019.87 today and that trend line from the low at 2019.
That would make C quite a long fellow if it were only wave 1….
If W5 = W1 (of C), it would give a target of about 2041 – so I think this is probably only W1 of 5 of C – but yer never know
There is one heckuva bullish trader out there. Somebody just bought a stadium full of SPY calls…what are they smoking? 🙂
Vern,
Quite possible that it is a hedge against something that they are short going into the Q1 end for 2016. I am assuming these are expiring next week.
It could also be that this second wave has done its job convincing the majority is it all clear to a renewed bull market.
Rodney,
Agree, I almost forgot about it as that is one of the main objective here..waters are safe to swim again 🙂
Very possibly. It does look like a hedging trade…they must be massively short if it is….
Central Bank digital money, so actual cost and risk is zero.
If that is W3 done (see idea on chart below), then it is shorter than W1 which means upcoming W5 must be shorted than W3.
This whole structure might still only be W1 of 5 – but we should get a pretty good W2 of 5 pullback in any case.
Yea exactly as I said i got a target at 1247 for now, but that’s not for today I think, today i see price in wave 5 of 1 which ends soon… no ideea where, after it ends there should be 1 good decline and after that iii-iv-v up and thats that.
Price action in volatility and index very suggestive of a higher degree than minute second wave correction. I know the C wave truncation lowers the probability but price trumps all imho. A revisit of the 200 dma is generally the prelude to a plunge…and I a’int joking…
We have five up from yesterday’s close with what looks like an extended fifth wave larger than wave three…
Oops! Looking at wrong section of chart. My five would include yesterday’s low at 1974.15
200 dma at 2019.84
A couple of weeks ago, when I mentioned we might go as high as the 200 ma, I don’t think anyone believed me. But here we are. This is a classic ‘last kiss good-bye’ pattern. You can see it mid-2008 and again at the beginning of 2001. Each time was followed by a plunge.
This could be a classic set up. If so, it is the last time to back up the truck and fill it up!
If the next decent sized move down is a 5 followed by a 3 up, I’ll certainly have the truck toppling over 🙂
Keep an eye on RUT. It will probably once again lead the way down. Bounce there looking relatively weak as no new high so far…
Indices kissing underside of 200 dma is also noteworthy…no time to be a cowboy… 🙂
UVXY saying the “rally ” is horse feathers- don’t chase it. Dumping my calls for a quick double and moving to the sidelines for now….
If UVXY turns up ahead of the market reversal, may be an early sign of termination…
Yeah – noticed (and very glad about) that. That’s why I stated my damage was not that great – yet!
Hoping for a correction to blast UVXY a bit higher so I can get out, albeit hope is never a good trading strategy. I knew the risk which is why the position was only (relatively) small.
Vern & Olga,
I rolled my UVXY exposure further along as was able to sell earlier and bought into the close (wish I had waited for better entry price) but with extra time I am now SOH and not worried as FED in on the deck next week :).
I don’t do options so have all the time in the world (well – would have but for that little matter of massive decay on UVXY!).
Not too worried atm – purposely kept the position small due to this exact scenario (yer could say I’ve been here a few times before 🙂 )
Right now i can count either 3 or 5 waves waves up completed from yesterday’s low on the sp500 futures. A wave (ii) down will follow today probably. I believe we are in last wave V up for this madness, then shall see what happens expecting either the 3rd wave down real fall or jsut another wave ii down and an extension to iii-ivi-iv…to the bull count. The whole upwards movement from the 1800 low can also be counted in a 1-2-3-4- with yesterday’s low marking 4, that is the problem. More then that, there is a nice channel now (which i dislike) but it is what it is… SO the wedge sorta turned into a channel now… Let’s see, my target if this blows up again would be 2047 where 5=0.618×1 , becoz 3<1. If this count is wrong, then my bull count would be invalidated as in if it goes above 1247 i would say the alternate bear will have a big probability to take place later! So the more the better now lol… Be carefull… I am hoping I am wrong and don't see this right coz almost cannot believe it myself :)))
I think that was likely a third wave – unless it is only 3 of 1 of 5 of C, we might not go that much higher.
I’ll be looking out for structure of potential 2 of 5 of C to unload my short and see if it is extending. W4 of C will likely end in the region of this W4 of C which unfolded over the last few days
Chart with that idea posted below
Looking to offload yesterdays after hours short on a corrective pullback. This possible W3 of the final wave up – it wave 4 should end in this W4 sideways price action over the last few days
Damage not that great (yet!)
On the bright side – another gap up to fill 🙂
Thought we might get a gap today – just need to master in which direction! As usual a lower probability ends up playing out – our time wil come Mr Market!!!
Olga,
I am not sure what you mean by W3. Are you saying that the move from 1891 to 2009 was a first wave of five up with wave 2 completing yesterday at 1970?
Hi Rodney,
Please see chart – this might only be the 1 of 5 playing out – or it might be the whole of final wave 5.
Structure of poss W2 of 5 pullback will be important in judging if wave is extending or not.
UVXY seems to be currently favouring that this might be all of final W5 so rally might be mature. But confirmation required (as usual!)
(BTW – the (A)(B)(C) in my chart should be (W)(X)(Y) but doesn’t really matter at this stage 🙂 )
Now I understand. A picture is worth a thousand words.
I hear you about the small position taken because of the risk yesterday. It is often that the channel break reverses itself. I’ve seen it over and over. I am beginning to think that it fails as often as it works. That is why I waited for the 1st real price confirmation of a break of 1974+.
Channels in S&P actually do work very well imho (I use them all the time on a daily level to provide clues of when a wave is likely over) – that’s until they don’t.
I would say they are 75% reliable – but that still leaves 25%. And the 25% always seems to be those times you really want them to stick. I think a bit ‘invisible hand’ mischief has alot to do with the rounded tops you see albeit that only works in the short term.
This is why I sold out just above confirmation yesterday (again – I’ve seen this crap today play out many times before). I was lured back in after hours by a possible gap and go down.
It is very difficult to trade gapping markets – but gaps tend to fill so every dog has its day 🙂
Battle around the pivots once again proving to be prescient. I know I probably sound like a broken record but I have learned to pay close attention to how they resolve so not too surprised by the bankster bounce. We will probably head for at leas the 2016.71 area gap and fill it today. Another gap remains open at 2043.94. Depending on how frisky Draghi has convinced the bulls to become, we may very well fill both today… hedged with some very cheap SPY 201.5 calls expiring today…
ps If you have not picked up your cheap volatility calls, hear me now and believe me later- you will never get a better opportunity, what are you waiting for??!!! 🙂
Unfortunately, yes the alternate bear and the combination bull count are the only ones i see possible right now. Yesterday I thought also this is it, aparently all we had for past week was a zigzag wave 4. This crap market is fake, the banksters or whoever are controlling it are keeping it up artificially. Just like they did starting from 2011 till 2015 when QE and ZIRP started then NIRP… Does it all make sense? Yes when you think about it, but if this will happen and we go to new highs, don’t wory the potential decline will be bigger even then anyone expects. Don’t say oo no way that can’t happen, take all possibilities into consideration, myself I am starting to coz anything is possible even if it surpasses logic! But when an anomaly is created, it will be resolved in due time. And that’s what I think this market is right now…
The more this insanity continues… the bigger the fall.
I am now convinced that a day like in 1987 will occur… 25% down in 1 day and/or more 50%+ in one to two weeks.
A little history…
Till August 1987 markets were favorable. In fact as per the records of 25th August 1987, the Dow was of a 2722.44, which was almost a record high. But after that it only started to depreciate. An 8.4% drop was recorded on September 22nd 1987. But then there was an increase of Dow again. A 5.9% increase was recorded on the 2nd of October 1987. But that was only for the time being. Once again the Dow started to fall and by October 19th the market had badly crashed; so much so that the Dow had dropped to 508. That would be almost a 22.6% drop on that single day. And if the drop had to be measured from the peak on 25th August, it was a whooping 36.7%. October 19th has since been referred to as the Black Monday.
Good morning, may I ask why you don’t see the main bear as possible?
Futures hitting 2009 this morning. Is the alternate in play?
Looking like SPY is going to have a massive gap up open 201.20 +
I must be missing something. I thought today, 3/10, the SPX was up 0.31 to 1989.57.
That would mean today was a green candlestick. But you have red. What am I missing?
I have different charting services. One shows green and one red.
I know, they really should be all the same.
I have data from NYSE via Barnhart, shows a red doji.
I have data from StockCharts shows a red doji.
But NYSE website has a green candlestick.
Why? I don’t know. They should all be the same. For the answer you’d have to ask NYSE.
yup,,won