
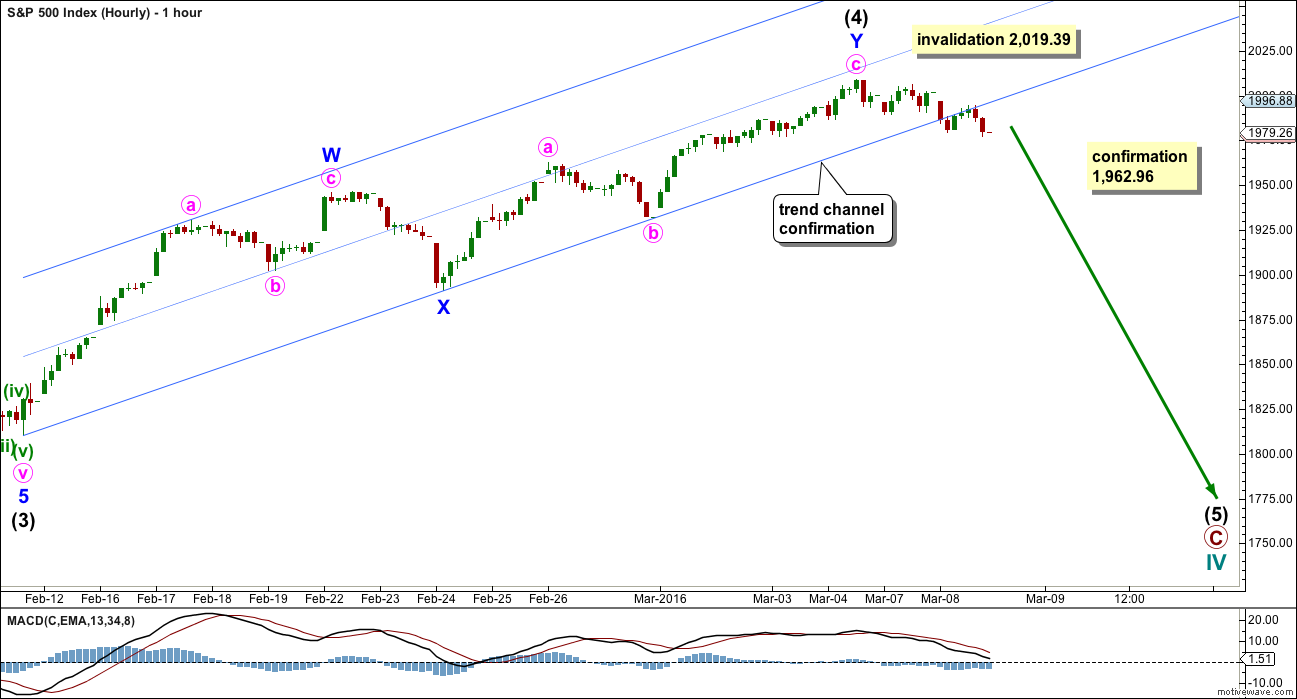
A breach of a channel on hourly chart is earliest confirmation of a trend change.
Summary: Earliest indication that the correction may be over came today with a breach of the channel on the hourly chart. This increases the probability that the correction is over. Price confirmation that the correction is over is still required with a new low below 1,962.96. Upwards movement may continue while price remains above this point. A low below 1,962.96 by any amount at any time frame would indicate a strong third wave down is most likely beginning.
To see how each of the bull and bear wave counts fit within a larger time frame see the Grand Supercycle Analysis.
To see detail of the bull market from 2009 to the all time high on weekly charts, click here.
Last published monthly charts can be seen here.
If I was asked to pick a winner (which I am reluctant to do) I would say the bear wave count has a higher probability. It is better supported by regular technical analysis at the monthly chart level, it fits the Grand Supercycle analysis better, and it has overall the “right look”.
New updates to this analysis are in bold.
BULL ELLIOTT WAVE COUNT
WEEKLY CHART
Click chart to enlarge.
To see all movement from the all time high without squashing the daily candlesticks up too much, it is time to publish weekly charts regularly.
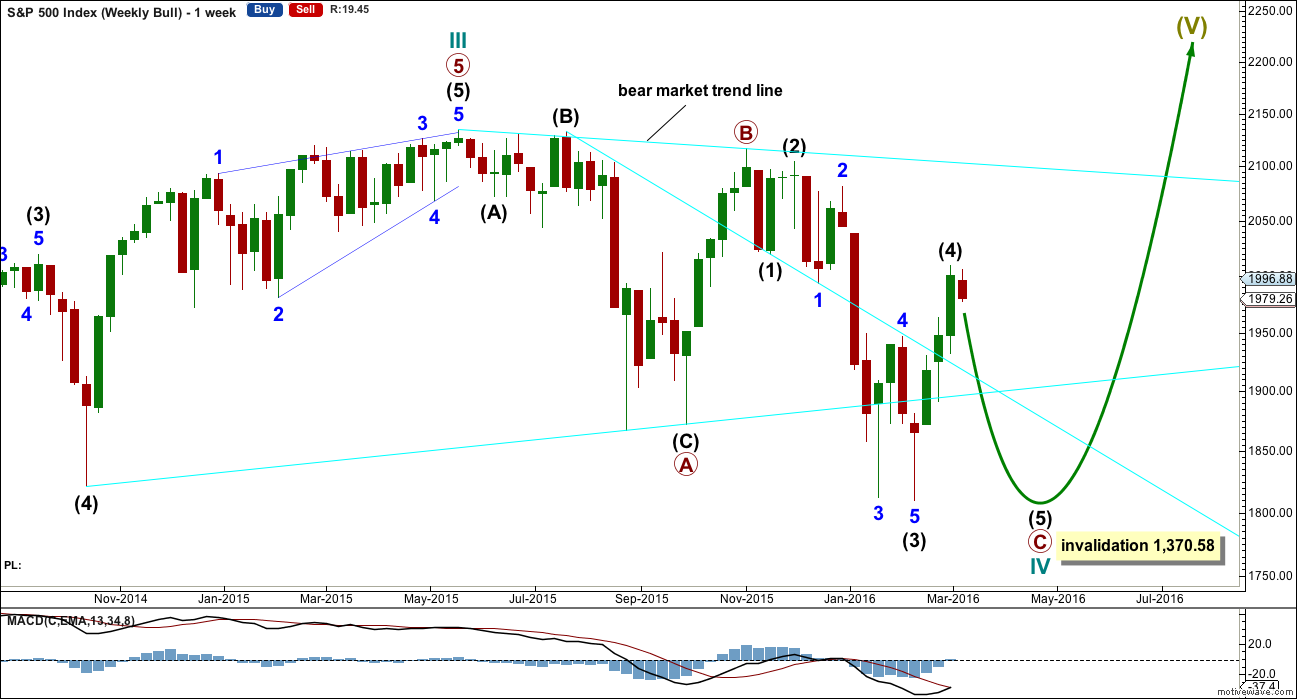
This wave count is bullish at Super Cycle degree.
Cycle wave IV may not move into cycle wave I price territory below 1,370.58. If this bull wave count is invalidated by downwards movement, then the bear wave count shall be fully confirmed.
Cycle wave II was a shallow 0.41 zigzag lasting three months. Cycle wave IV should exhibit alternation in structure and maybe also alternation in depth. Cycle wave IV may be a flat, or combination. This first daily chart looks at a flat correction.
Cycle wave IV may end within the price range of the fourth wave of one lesser degree. Because of the good Fibonacci ratio for primary wave 3 and the perfect subdivisions within it, I am confident that primary wave 4 has its range from 1,730 to 1,647.
Primary wave C should subdivide as a five.
DAILY CHART – FLAT
Click chart to enlarge.
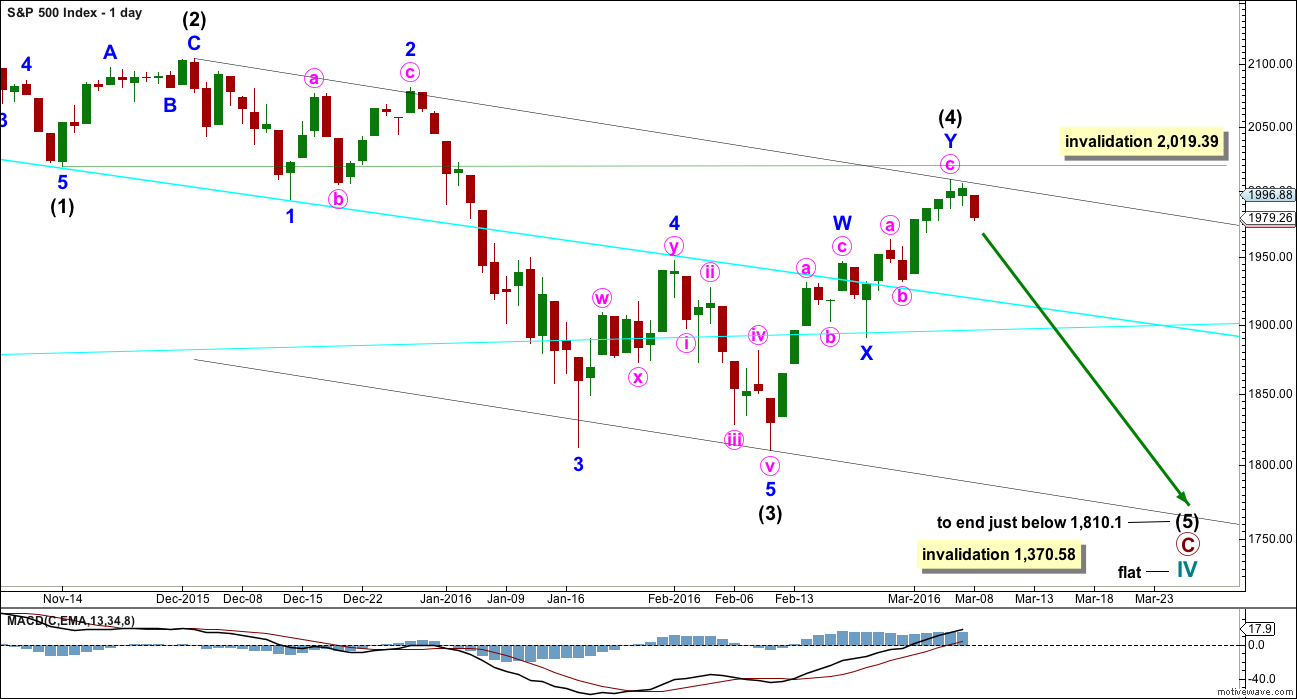
Within the new downwards wave of primary wave C, intermediate waves (1), (2) and now (3) may be complete. Intermediate wave (4) may now be over. Intermediate wave (2) will subdivide either as a single or double zigzag (as will intermediate wave (4) ). There is inadequate alternation between these two corrections, which reduces the probability that the current correction is a fourth wave.
Draw the channel about primary wave C using Elliott’s second technique. Draw the first trend line from the ends of intermediate waves (1) to (4), then a parallel copy on the end of intermediate wave (3). Expect intermediate wave (5) to find support at the lower edge. Intermediate wave (5) is highly likely to end slightly below 1,810.1.
The idea of a flat correction for cycle wave IV has the best look for the bull wave count. The structure would be nearly complete and at the monthly level cycle wave IV would be relatively in proportion to cycle wave II.
HOURLY CHART
Click chart to enlarge.
Comment on structure will be with the bear wave count today.
DAILY CHART – COMBINATION
Click chart to enlarge.
This idea is technically possible, but it does not have the right look. It is presented only to consider all possibilities.
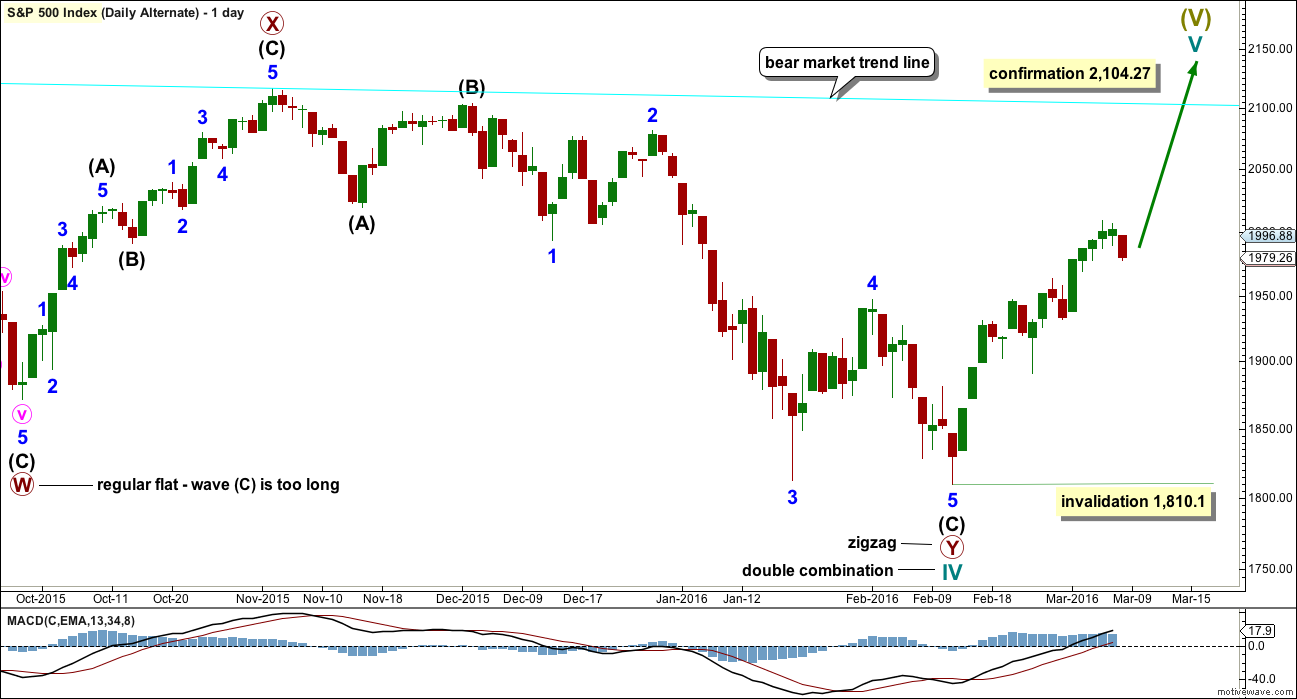
If cycle wave IV is a combination, then the first structure may have been a flat correction. But within primary wave W, the type of flat is a regular flat because intermediate wave (B) is less than 105% of intermediate wave (A). Regular flats are sideways movements. Their C waves normally are about even in length with their A waves and normally end only a little beyond the end of the A wave. This possible regular flat has a C wave which ends well beyond the end of the A wave, which gives this possible flat correction a very atypical look.
If cycle wave IV is a combination, then the first structure must be seen as a flat, despite its problems. The second structure of primary wave Y can only be seen as a zigzag because it does not meet the rules for a flat correction.
If cycle wave IV is a combination, then it would be complete. The combination would be a flat – X – zigzag.
Within the new bull market of cycle wave V, no second wave correction may move beyond the start of its first wave below 1,810.10.
I do not have any confidence in this wave count. It should only be used if price confirms it by invalidating all other options above 2,104.27.
BEAR ELLIOTT WAVE COUNT
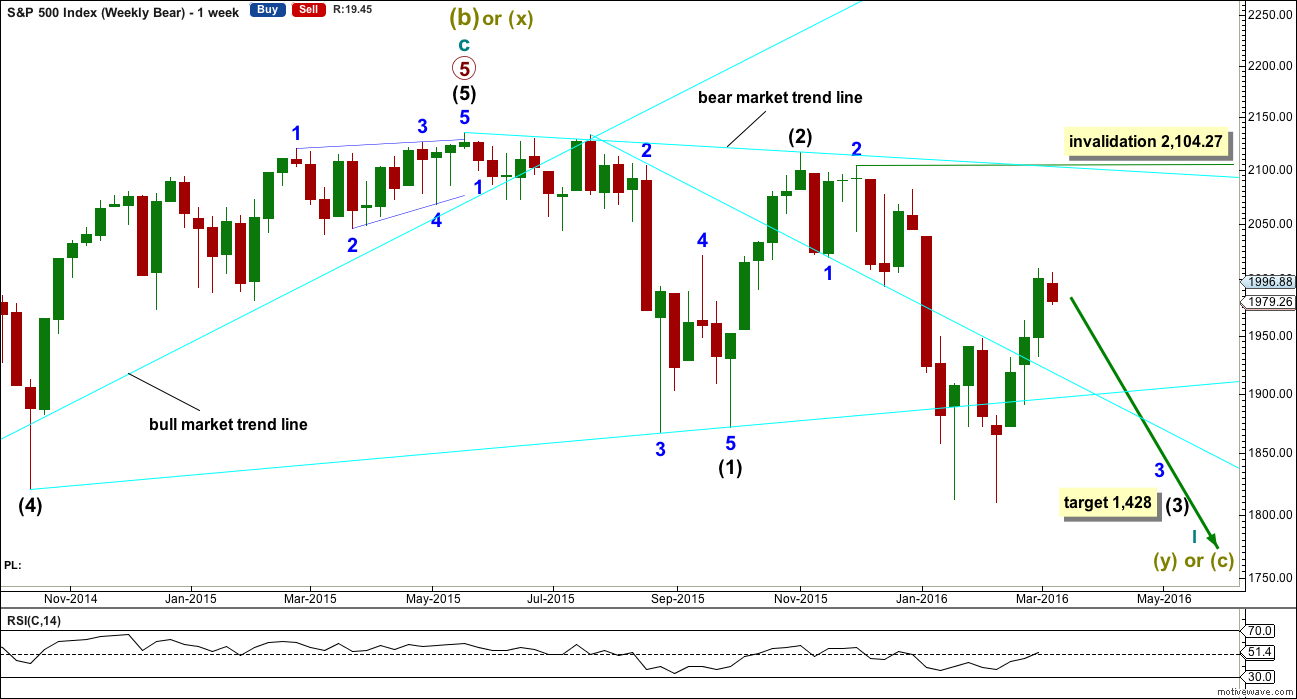
WEEKLY CHART
Click chart to enlarge.
This bear wave count fits better than the bull with the even larger picture, super cycle analysis found here. It is also well supported by regular technical analysis at the monthly chart level.
Importantly, there is no lower invalidation point for this wave count. That means there is no lower limit to this bear market.
Downwards movement so far within January still looks like a third wave. This third wave for intermediate wave (3) still has a long way to go. It has to move far enough below the price territory of intermediate wave (1), which has its extreme at 1,867.01, to allow room for a following fourth wave correction to unfold which must remain below intermediate wave (1) price territory.
Intermediate wave (2) was a very deep 0.93 zigzag. Because intermediate wave (2) was so deep the best Fibonacci ratio to apply for the target of intermediate wave (3) is 2.618 which gives a target at 1,428. If intermediate wave (3) ends below this target, then the degree of labelling within this downwards movement may be moved up one degree; this may be primary wave 3 now unfolding and in its early stages.
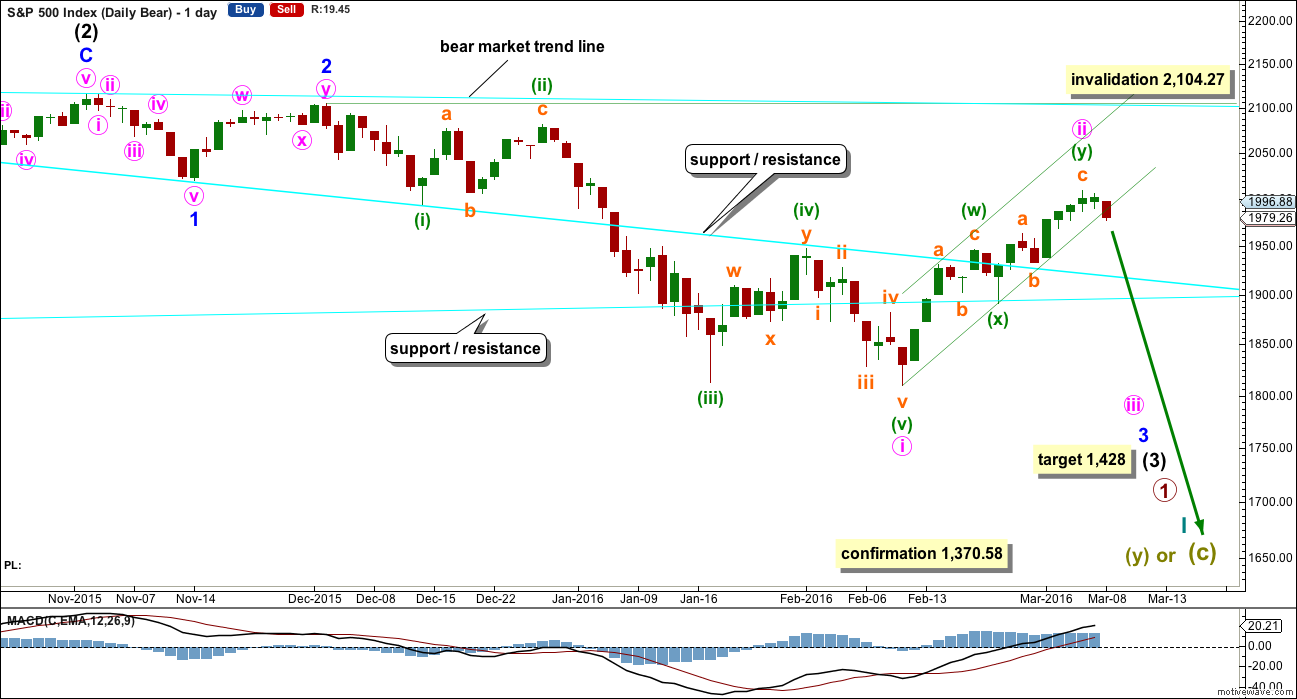
DAILY CHART
Click chart to enlarge.
Intermediate wave (2) lasted 25 sessions (not a Fibonacci number) and minor wave 2 lasted 11 sessions (not a Fibonacci number).
Minute wave ii has now lasted fifteen sessions, four longer than minor wave 2. At this stage, the size of minute wave ii no longer gives the wave count the right look, so for this reason the alternate below is published. The S&P does not always exhibit perfect proportions, so this wave count remains entirely valid. The overall look is not too far from perfect to be somewhat acceptable for this market in my experience.
Minute wave ii may not move beyond the start of minute wave i above 2,104.27.
A small channel is added to this bear market rally on the daily chart. This channel needs to be breached before confidence may be had that the rally is over. The channel is breached on the hourly chart today. Some confidence may be had today that the rally is very likely over.
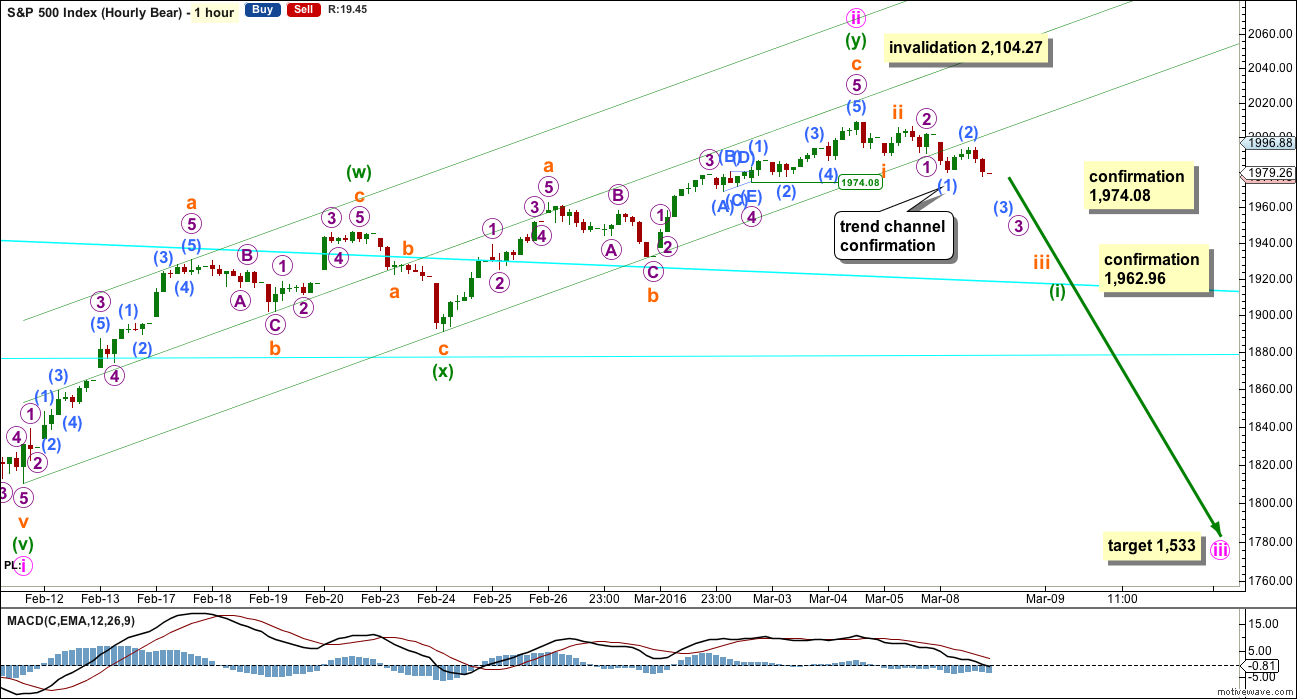
HOURLY CHART
Click chart to enlarge.
There are two ways to see this upwards movement: as a double zigzag as shown here or as a single zigzag as shown for the alternate below. Both ways to label it work in the same way for this and the alternate wave count below.
If upwards movement is a double zigzag, then the structure again looks complete.
Within the first zigzag of the double, subminuette wave c is just 2.18 points short of 0.382 the length of subminuette wave a.
Within the second zigzag of the double, subminuette wave c is now 5.36 points longer than equality in length with subminuette wave a.
There is alternation between the two zigzags: the first zigzag has a long A wave and a short C wave, while the second zigzag has A and C waves close to equality.
Earliest confirmation of a trend change has come today with a clear breach of the channel on the hourly chart, followed by a typical looking throwback to the lower edge. However, the S&P does not always fit neatly into channels as it nears the end of a trend. It tends to form rounding tops, breaching a channel before continuing further.
First price confirmation of a trend change would come with a new low below 1,974.08. At that stage, micro wave 5 within subminuette wave c would have to be over because downwards movement could not be a second wave correction within it, so micro wave 5 could not extend.
Strong price confirmation of a trend change would come with a new low below 1,962.96 which would invalidate the alternate below.
So far downwards movement subdivides best as a series of three first and second waves. This may be only within minuette wave (i). On the way down, look for price to find support at each of the two cyan trend lines which are copied over here from the daily chart. After each line is breached then look for price to throwback to the line for resistance. If price behaves like that, it may offer low risk entry opportunities to join the trend; stops may be set just above each line as it is breached.
ALTERNATE DAILY CHART

Click chart to enlarge.
If intermediate wave (2) ends on 2nd December, 2015, then it will only fit as a zigzag with a truncated C wave. I have tried to see other ways of labelling this movement with the same end and so far I cannot find a better solution. The truncation is large at 12.19 points which gives this wave count a very low probability. But this now resolves the problem the main wave count has of proportion.
Intermediate wave (2) for this wave count is 45 days in duration. Minor wave 2 is now seventeen days in duration, so the proportions look good. It is also possible that minor wave 2 is a completed double zigzag lasting fifteen days as per labelling for this bounce with the main bear daily chart.
Minor wave 2 may not move beyond the start of minor wave 1 above 2,104.27.
This alternate makes a difference to the target. At 1,416 intermediate wave (3) would reach 2.618 the length of intermediate wave (1).
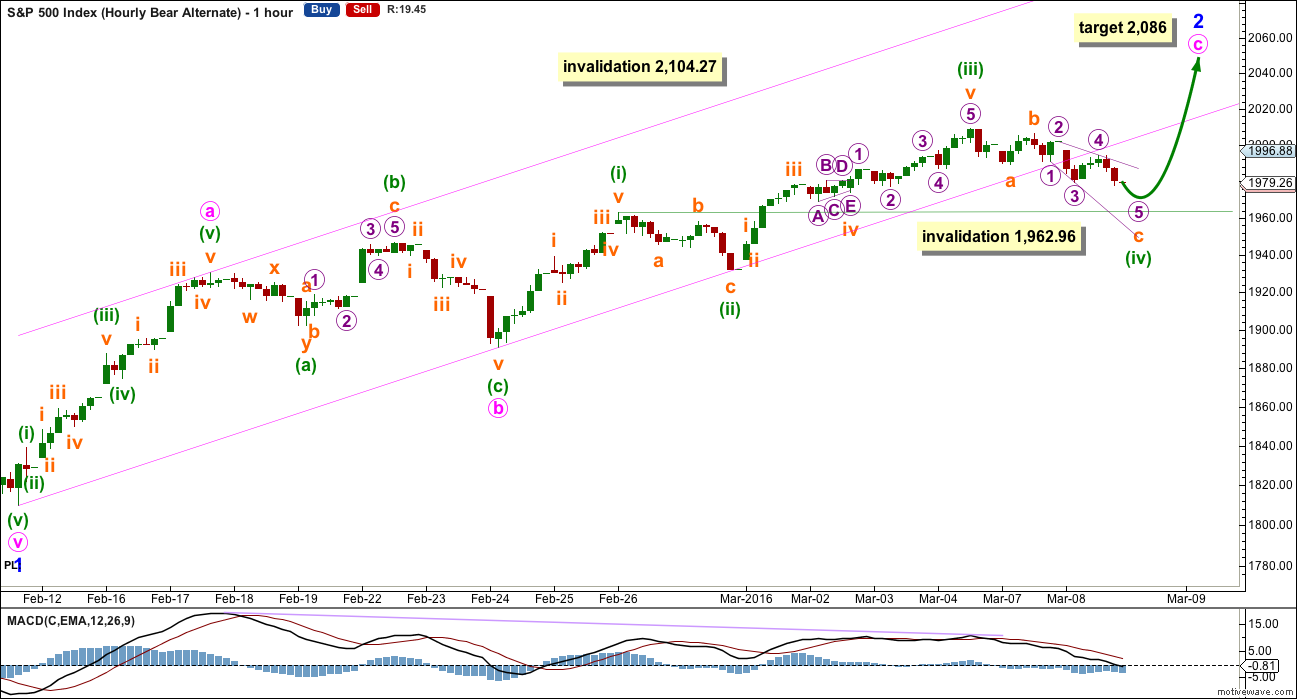
Click chart to enlarge.
Upwards movement may be an incomplete single zigzag. At 2,086 minute wave c would reach 1.618 the length of minute wave a.
Minute wave b is seen as an expanded flat correction.
The channel is drawn in the same way, so it should be used in the same way for earliest indication of a trend change.
Minuette wave (iv) has breached the channel. This has substantially reduced the probability of this wave count today. The subdivisions within it do not at all fit well on the five minute chart. If subminuette wave c is an ending expanding diagonal, then micro waves 1 and 3 within it should subdivide as zigzags but on the five minute chart they look very much like impulses. This wave count now has a low probability, but it is still presented as a what if? What if I’m wrong? What if the bounce will continue. At what point will price eliminate that possibility?
A new low below 1,962.96 would invalidate this wave count. At that stage, downwards movement could not be minuette wave (iv) because minuette wave (iv) may not move into minuette wave (i) price territory.
TECHNICAL ANALYSIS
DAILY CHART
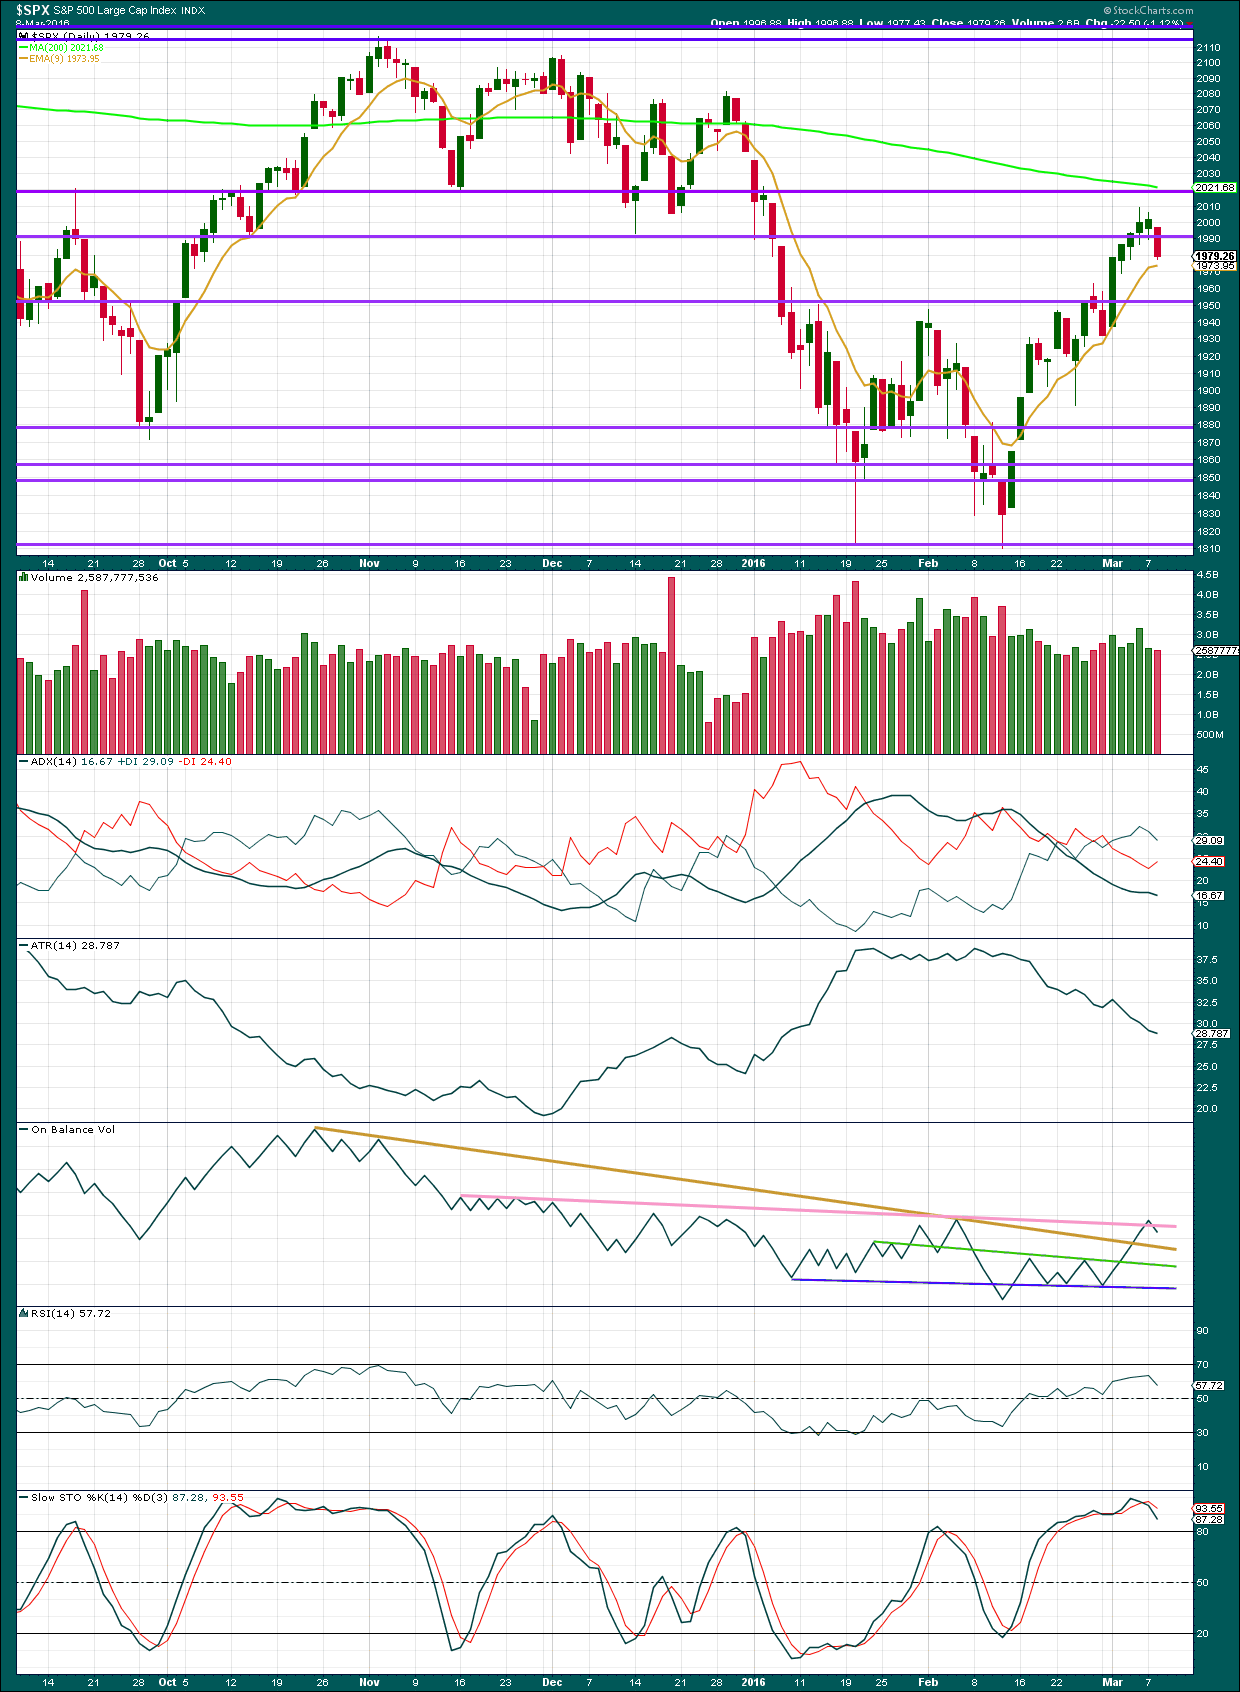
Click chart to enlarge. Chart courtesy of StockCharts.com.
Volume data on StockCharts is different to that given from NYSE, the home of this index. Comments on volume will be based on NYSE volume data when it differs from StockCharts.
The downwards day for Tuesday shows an increase in volume beyond the prior upwards day for NYSE data. There was some support for the fall in price.
Tuesday’s red candlestick completes a bearish engulfing candlestick pattern; although the candlestick does not engulf the prior real body, it is below. Price gapped lower and closed much lower. This candlestick pattern is very bearish indeed. The major criteria for a bearish engulfing candlestick pattern is that the close of the second day is below the open of the first day. In this case both the open and close of the second day are below the open of the first day.
NYSE volume data shows declining volume for rising price during this rally, and increasing volume on falling price during this rally. The short term volume profile for this rally is bearish.
ADX is flat indicating no clear trend. ATR continues to clearly decline, more typical of a correction than a trend. With both of these indicators in agreement, there may be some confidence that the upwards bounce is a correction against a trend and not the start of a new bullish trend.
On Balance Volume has turned back below the pink line. If tomorrow OBV moves lower, that would be a strong bearish signal. The strength of that line would be reinforced. The pink trend line is already highly technically significant.
The next line for price to find resistance is at 2,020 and the 200 day moving average.
DOW THEORY
For the bear wave count I am waiting for Dow Theory to confirm a market crash. I am choosing to use the S&P500, Dow Industrials, Dow Transportation, Nasdaq and I’ll add the Russell 2000 index. Major swing lows are noted below. So far the Industrials, Transportation and Russell 2000 have made new major swing lows. None of these indices have made new highs.
I am aware that this approach is extremely conservative. Original Dow Theory has already confirmed a major trend change as both the industrials and transportation indexes have made new major lows.
At this stage, if the S&P500 and Nasdaq also make new major swing lows, then my modified Dow Theory would confirm a major new bear market. At that stage, my only wave count would be the bear wave count.
The lows below are from October 2014. These lows were the last secondary correction within the primary trend which was the bull market from 2009.
These lows must be breached by a daily close below each point. So far the S&P has made a new low below 1,821.61, but it has not closed below 1,821.61.
S&P500: 1,821.61
Nasdaq: 4,117.84
DJT: 7,700.49 – this price point was breached.
DJIA: 15,855.12 – this price point was breached.
Russell 2000: 1,343.51 – this price point was breached.
This analysis is published @ 09:23 p.m. EST.
Volume Lower today than yesterday:
694.514 Million 4:06PM Yesterday
603.719 Million 4:06PM Today
Have a great night!
The downwards move to the last low for yesterday fits perfectly as a five wave impulse.
What is very clear to me is that the following upwards movement is corrective. Now that could be 1-2- with a 3 up to unfold, or it could be A-B-C. They have the same subdivisions.
Its a nice zigzag, with an expanded flat for the B wave and the B wave within the B wave is an expanded flat… nice.
This is my update on the five minute chart. Still, moves downwards are subdividing as fives and upwards as threes.
So far there is 5 (leading contracting diagonal) – 3 (will only subdivide as triple zigzag) – 5 (impulse) – 3 (but may also be a 5) – 5 – 3 (double zigzag) 5 – 3
That’s 5-3-5-3-5-3-5-3
Which at this stage if it is corrective could only be a very rare triple zigzag (I’ve seen about four now in all my years of analysis) with a truncated C wave in the first zigzag.
What a low probability that has!
I entered a small short last night (my time). I see nothing today to alter my position, I’ll hold on. When we have price confirmation I’ll add more. I’ve set my stop just above the high of 4th March at ,2009.13. If we see a new high above that point I don’t want to be short because something else would be happening…
ThanQ for the update. I have a feeling we’re about to find out which way this market is about to break… it’s the calm before the storm. And a stop above SPX 2009 is a great idea…
SPX open gaps at 2016.71 and 2043.94.
Chances of a return to those level prior to the next leg down very remote in my view. Having said that, can you think of a better way for the banksters to really rattle the bears than a final manic rally up to those levels?
Technically we can revisit them without an invalidation of either EW count so be ready… 😉
I highly doubt we’ll go above the 200 day SMA, which is at 2020 right now. But what really worries me is how many people are waiting to retest the lows at 1810. Tons of people on CNBC and Bloomberg are saying that over the last few days…
Only a handful of people are saying “buy” and everyone else saying we’re going to retest lows. Which unfortunately reminds me of The few weeks after August 24, 2015…
THAT makes me nervous :-/
I see 2016.71 reachable. It’s only 27 points from where we are. It would take one good day up to get there; but 2043 is too high…
We shall see…
What a boring day in the markets!
Time to watch NFL Network… let the free agency period begin.
See you all tomorrow.
Move up from yesterday lows is corrective imho (expanded flat ??) so likely another 1,2 or part of a larger corrective structure. The B wave of that flat was a bit impulsive for my liking but still looks corrective overall to me.
I’m always suspicious of too many nested 1,2s – can morph into another structure, but looks corrective in any case.
Seems to be still messing around sideways atm – will check back tomorrow to see if anything more interesting – still no price confirmation 🙁
Poss count from todays lows???
Yep. Thats what I came up with too.
The C wave is just a little longer, 1.3 points, than the A wave. It has a nice symmetrical look.
Hi Lara
Hope you are well?
Would be great to get a FTSE update after the ECB meeting tomorrow. Think we will get a boost and from that the decline. Charts look in limbo to me, but would be great to get your view after the meeting if possible?
Ali
I will update FTSE today, even if only a chart.
Thank you
x
UVXY 33.50 calls now trading at 1.25 as it makes bullish run out of pennant. Moved STC order to sell half @ 1.50. No need to be a little piggy. 🙂 🙂
The miners are red hot. Pullbacks are being very aggressively bought. Glad I unloaded those NUGT puts early as it has traveled seven points from today’s low at 52 to over 59! Yikes! Short at your peril! 🙂
I have Gold about only halfway through a fourth wave correction.
I’m looking for a trend change 10th March (triangle trend lines cross over). Doesn’t always work, but works often enough to be a trick to look out for.
Good! I rolled the profits from my NUGT puts and was not expecting more downside. Glad to hear that assumption was pre-mature…. 🙂
If SPX and Gold roll over about same time, miners will be destroyed. DUST would be the stock of the year.
I think Gold is in a primary B wave up and it looks like the miners are going to out-perform the metal this cycle. Precious metal miners are one of the few bright spots I see in equities markets over the next six months. DUST is the absolutely worst of the leveraged ETFs. It bears absolutely no resemblance to the Gold price the way it is supposed to. Look at how it traded at Gold’s recent low compared to is historical evaluation. It is a total and complete fraud. I am surprised Direxion did not get a visit from the SEC because of complaints about it. It is radioactive…handle with extreme care… 🙂
Not sure if you subscribe to EW gold (guessing by your comment that you probably don’t).
Lara has very kindly shared alot of clues / charts regarding gold on this blog – it’s worth giving those due considering imo or you may well end up holding DUST.
Hey Joseph:
I know you expressed a bit of frustration with UVXY so take a look at the one minute chart the last few days and you can see one of the set-ups that work 80% of the time with those pennants in an uptrend. Not that you would trade it, but just an example of how I pick my entry points. Entered sell to close GTC at 2.10 that will probably be hit today or first thing tomorrow.
Sorry, Trading the VIX is not something I am interested in doing… or UVXY as a substitute.
I will stick to what I know. The VIX in the past has sent signals that I understood… but now its not sending the same signals or at least I no longer understand the signals it is sending.
I bought some March calls on SPXS 2 weeks ago… that will likely expire worthless and this week have no bid.
I am done with short-term options… I broke my longtime rules and paid the price.
Leaps and the actual shares from now on
PLus from this day forward… I will be looking for an exit point on a big move lower to near targets on bear counts for all my shares (which I sold half of in aug & repositioned) and my old Jan 2017 leaps that I positioned in May 2015… will look to play future bounces/bear market rally and then down again, etc., etc.
No need to be sorry my friend. In your recent post you said you wondered how I did so I just thought I would illustrate! You are of course entirely right to stick with what you know. I am a bit more of an adventurer and always open to learning a few new tricks myself! 🙂
Speculative trade on UVXY 33.5 calls expiring Friday for one buck. Bought at tip of bullish pennant. We have had five in the last week or so…will try to sell for a quick double….filled at 0.94 🙂
What if today’s action is 2 additional series of 1-2 waves added to the previous 3 sets as explained in the main hourly bear count??? That would truly be a gift, with such a huge massive potential energy waiting to explode downward, unraveling the markets…
Will wait patiently for Lara’s mid-day update 🙂
I’m nervous about it, but no matter how long I look at it so far I’ve not come up with another explanation of the structure.
With the sole exception of a very rare triple zigzag.
Doesn’t mean there’s no other explanation, only that so far I can’t see it.
Thanks for the update!
The big down-turn at 10:38 eastern WAS the EIA oil inventory report:
3.9 million barrel rise vs. analyst estimate of 3 million. BUT it was less than the 4.4 million reported by the American Petroleum Institute reported yesterday…
So brushed off quickly and market jumping back up because oil is rising… I was looking for a big reversal, and what we got was a big mini crash… lol
With ECB pumping the markets tomorrow, and also FED meeting next week, it looks like we might be going higher/sideways until end of next week… but who knows really??!?
I do have a very large short position, but willing to short more if we approach SPX 2050
If the Fed is Data Driven as they keep saying and they believe the government data that is put out… and then can ONLY believe it… then the Fed will Raise the Fed Funds Rate next week to 0.75%!
They will follow their data dots that show where they expect the Fed Funds Rate to go and when!
That can be the ONLY conclusion they arrive at or risk losing whatever credibility they have left!
Its not really what the FED actually does, its how the market reacts to it. They can keep rate the same, and markets might go down for whatever reason… They can increase the rate like you mentioned, and markets can go up for whatever reason… So we’ll just have to wait and see in SOH posture 🙂
The markets are NOT expecting a rate increase and are only now expecting one or two for 2016. It will be more than that.
Joseph,
It will be interesting cause ECB move will make USD strong against Euro and if US FED indeed practise what they preach, it will get stronger with bump in the interest rates. Waiting and watching SOH 🙂 🙂
Talk about being between Scylla and Charybdis…poor FED, whatever they do, they can’t win…
Here we go again with one of those torturous triangles…man they seem to be popping up just about every other day! I suppose its going to meander around for hours before we get the sharp break to either the upside with a quick reversal, or it just keeps going South….
Whoa Nelly!! Did you guys see that???!!!!
Talk about a Momma Grizzly SMACK-DOWN!!
That is the fastest 72 point surrender on DJI I have EVER seen. I had to blink cuz I thought my screen had a mal-function…. 🙂
I wish I could say it was the EIA oil inventory that did it, but it ain’t so…
So as usual: I don’t get it!!! We might have to just chalk it up to a “mini flash crash…”
It should have… But Oil is still in short squeeze mode. That will end soon and start down again.
I have been harboring a funny feeling that we just got a little glimpse of how this thing is going to unfold. I think it is going to happen a lot faster than people expect….try getting short during a move like that! Yikes!!!
Impossible…. That’s an example of why I think the start of middle of bear three will be a lot faster down initially than people think & therefore difficult to short at a level most people think then can comfortably do it. A surprise to the downside. The market is always trying to fool the most people possible in either direction.
Actually good to see some here throwing in the towel.
Or that it was a C wave.
And that the news isn’t what’s moving the markets, its crowd psychology.
I saw it, was able to scalp a quick trade off of it as well…pure luck
This is the last kiss goodbye of the trend line up from 1810.10 – 1891 as drawn.
I just cannot believe I can STILL get April expiration UVXY 35 strike calls for less than five Lincolns.
I got a mini truck load @5.05per contract on fill.
Delta is only .53 but that is an easy double if UVXY goes to 40
One neat trick I like to use to assess what may come of market bounces is by looking at the performance of my short positions. When the market makes a move up and the bid for put contracts do as well, or remain steady, it says quite a bit about what the MMs are expecting…
Quick triple on NUGT 50.5 puts. Rolling profits into next week to maintain hedge for long gold miners position. Great spreads in IWM puts. I should have bought those instead of QID.
Hi Verne,
I think we may see the end shortly to this bullish trend like 1929 according to 4 different valuation views.
Kind Regards,
Jim
What EPS number is being used in this chart? It is silent.
How about using GAAP Earnings… the legal standard in audited Financial Statements. GAAP = Generally Accepted Accounting Principles
GAAP is standard accounting in order to place all Financial Statements on like playing field. A standard by which you can compare one company to another and how they are actually doing! Anything else is pure fiction!
I will answer my own question…
If GAAP EPS & fully diluted EPS are used… then the market is even more grossly overvalued then chart above is trying to communicate.
I heard an analyst on Bloomberg dismissing the downside of the massive stock buybacks by pointing out that it is nothing new and has been going to one degree or another since the start of the bull run. He conveniently failed to mention, nor did his hosts challenge him on this, that there is a huge difference between buying back your own stock with real earnings, and buying it back with borrowed money. Furthermore, the data shows quite conclusively that companies always buy back stock at the richest evaluations so making the practice a consistent mal-investment spurred on by cheap capital. I am not even going to mention the fraud of insiders using stock buybacks to cash out while the cashing’s good, leaving debt-bloated, hollowed-out entities facing declining top and bottom line revenues, and rising interest rates…’Nuff said
The people holding dividend paying stocks of companies who have been borrowing money to buy back shares are going to be in a rude awakening in the not too distant future when these same companies make large dividend cuts as cash flow begins to come down and debt payments become a larger share of cash flow.
All the Bullish Talking heads were out in full force this morning!
Wow! Thanks for the chart Jim. There are indeed many similarities that have been cited…
So, the market waits in breathless anticipation for Draghi-speak. Bloomberg’s battle of the charts featured a chart of the ECB balance sheet plotted against the charts for the Euro Stoxx 50 index and Euro area GDP growth. The results are quite eye-opening!
Today March 9,2016 is the ninth anniversary of the start of the bull market…what a run! 🙂
SPX up over 200%, added 14T to market evaluation!! All the talking heads are insisting…the party is not over! What do you think?
Ooops! I meant SEVENTH anniversary… 🙂
Good day to all.
I exited all short positions on Feb. 25th. I continue to be on the sidelines and 100% in cash in all my accounts short, intermediate, and long term. I am waiting for the #1 indicator, price, to indicate where the market is headed next. I have some concerns with the trend of the market. The SPX weekly MACD has crossed over to the upside. This is quite bullish. The 13 and 34 day moving averages have crossed above the 50 day. This is also bullish. The SPX moved right through both of Lara’s aqua trend lines. This is also bullish.
I have not changed my long term view from bearish to bullish. But I am cautious at this time. I am trying to let all the ‘news’ go in one ear and out the other. The news does not make the market. The market makes the news.
I know my view will most likely not be popular on this blog / forum. But it is what it is. Like many who use EW, I have been waiting for the bear market to materialize for several years. I guess I need to wait a bit longer.
Good Luck!
That’s not a bad strategy at all… Waiting for price confirmation is difficult to do if you have a bearish bias… But its the best thing to do right now… I kind of wish I was in that position, as I’ve been shorting the market more, more and more, and now I’m waiting for the big move… I’d rather be in your shoes as you can always jump in if you’re on the sidelines 100%… so kudos!
Still working on my discipline; have been trying since grade school 🙁
I completely agree with the statement that the news does not make the market, the market makes the news.
And I also completely agree with waiting for price confirmation. That is most wise.
What a great set-up it would be if markets pop for another 2nd wave, until the oil inventory hits the wires today for a big reversal…
I’m afraid if that scenario doesn’t play out, the alternate daily and hourly might be in play and we’ll see new highs…
That’s my 2 cents, until the usual suspects with more experience return…
Technically, I think yesterday’s move down favors the main count; knowing how banksters operate, that is to say psychologically, odds are we will see the alternate play out as they come with another cash dump around the time of ECB blather to try and grease the skids for the bulls and bamboozle the crowd…they are oh so predictable, and this is the way I think they distort EW waves with their interventionist policies. It is not working for the Chinese! 🙂
Yep! I think we will see the first impulse down complete today and a very deep second wave Thursday. It is remarkable how often interim tops co-incide with CB pronouncements. Would not be a bad idea to cash in some profitable short trades and get ready to reload…
I see all the excitment getting build for the ECB decision tomorrow but seriously beyond more promises and posturing little of value can be expected. Market players are going to pump it up as much as possible. The reality is that the bitter pill that is required to solve the problem is not going to be offered.
Waiting and watching the tape from far in SOH posture 🙂
Interesting that GOLDMAN is betting against EURO…that can’t be good but who can trust GOLDMAN.
PnF predicts S&P 500 to hit somewhere between 1560 to 1365.
If there is one bounce up on the way down then 1625 to 1430.
Thanks Jim!
That’s a pretty clear downwards break / bearish signal from that chart currently.
S&P 500 hits 61 Fib.
http://blog.kimblechartingsolutions.com/2016/03/sp-500-dangerous-if-weakness-takes-place-at-this-level/
Thanks Jim, nicely spotted.
That 0.618 ratio is right close to 2,000, a nice round number.
If we can move lower from here this week and next I’ll have confidence that a third wave down is underway…
But if price makes new highs above the March 4th highs that would be very concerning to the bear wave count at this stage.
Wow…i am first today?
Everyone else got tired of “watching the paint dry”…they might come back tomorrow…
Recent correction reinforces Wilshire 5000 downwards trend line.
http://danericselliottwaves.blogspot.com/
Sorry, Peter. Beat you to it 🙂