
Price moved higher to 2,009, above the target which was 2,002 or 2,004.
Summary: Confirmation that the correction is over is required with a new low below 1,962.96. Upwards movement may continue while price remains above this point. A low below 1,962.96 by any amount at any time frame would indicate a strong third wave down is most likely beginning.
To see how each of the bull and bear wave counts fit within a larger time frame see the Grand Supercycle Analysis.
To see detail of the bull market from 2009 to the all time high on weekly charts, click here.
Last published monthly charts can be seen here.
If I was asked to pick a winner (which I am reluctant to do) I would say the bear wave count has a higher probability. It is better supported by regular technical analysis at the monthly chart level, it fits the Grand Supercycle analysis better, and it has overall the “right look”.
New updates to this analysis are in bold.
BULL ELLIOTT WAVE COUNT
WEEKLY CHART
Click chart to enlarge.
To see all movement from the all time high without squashing the daily candlesticks up too much, it is time to publish weekly charts regularly.
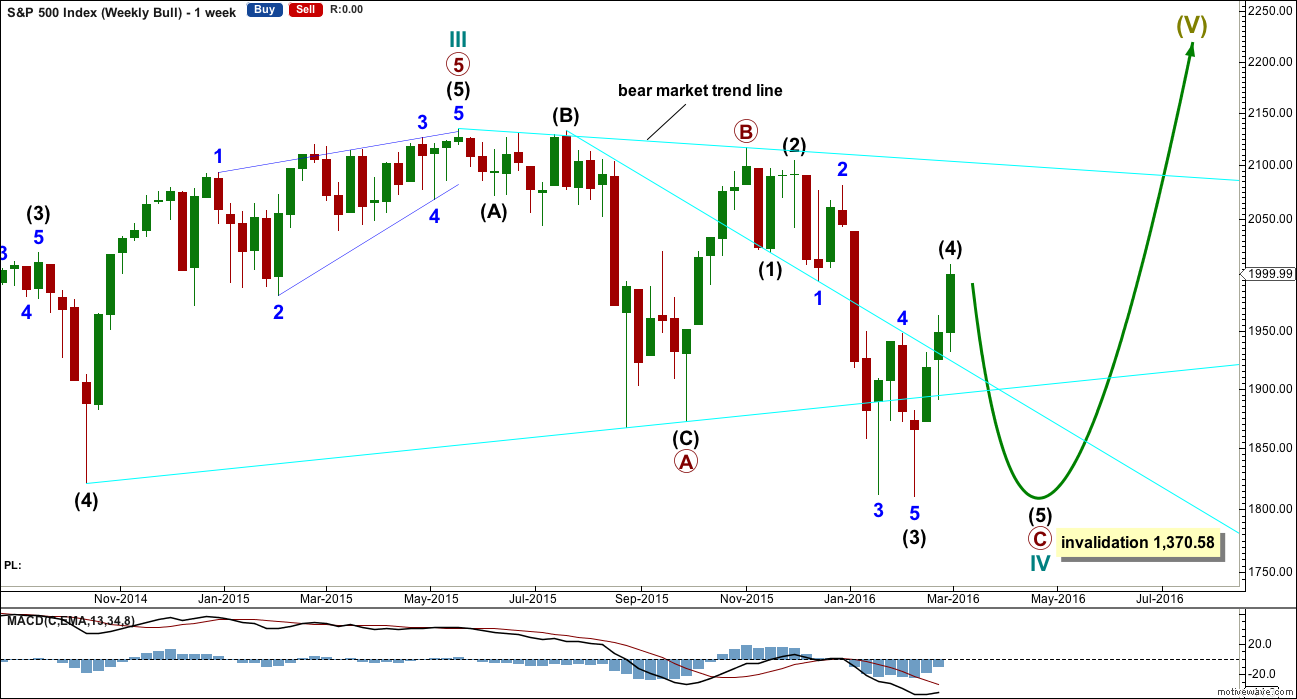
This wave count is bullish at Super Cycle degree.
Cycle wave IV may not move into cycle wave I price territory below 1,370.58. If this bull wave count is invalidated by downwards movement, then the bear wave count shall be fully confirmed.
Cycle wave II was a shallow 0.41 zigzag lasting three months. Cycle wave IV should exhibit alternation in structure and maybe also alternation in depth. Cycle wave IV may be a flat, or combination. This first daily chart looks at a flat correction.
Cycle wave IV may end within the price range of the fourth wave of one lesser degree. Because of the good Fibonacci ratio for primary wave 3 and the perfect subdivisions within it, I am confident that primary wave 4 has its range from 1,730 to 1,647.
Primary wave C should subdivide as a five.
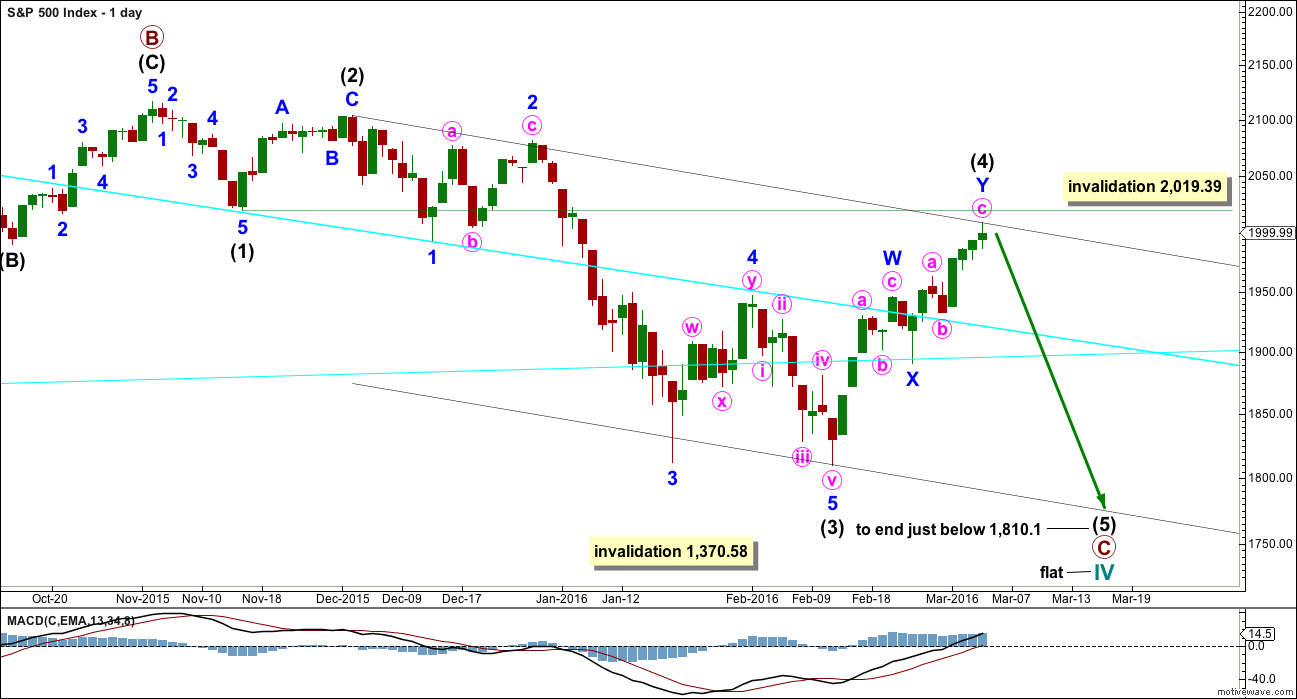
DAILY CHART – FLAT
Click chart to enlarge.
Within the new downwards wave of primary wave C, intermediate waves (1), (2) and now (3) may be complete. Intermediate wave (4) is continuing higher and may not yet be complete. Intermediate wave (2) will subdivide either as a single or double zigzag (as will intermediate wave (4) ). There is inadequate alternation between these two corrections, which reduces the probability that the current correction is a fourth wave.
For this wave count, intermediate wave (4) must be complete because there is almost no room left for it to move with the invalidation point near by. Redraw the channel about primary wave C using Elliott’s second technique. Draw the first trend line from the ends of intermediate waves (1) to (4), then a parallel copy on the end of intermediate wave (3). Expect intermediate wave (5) to find support at the lower edge. Intermediate wave (5) is highly likely to end slightly below 1,810.1.
The idea of a flat correction for cycle wave IV has the best look for the bull wave count. The structure would be nearly complete and at the monthly level cycle wave IV would be relatively in proportion to cycle wave II.
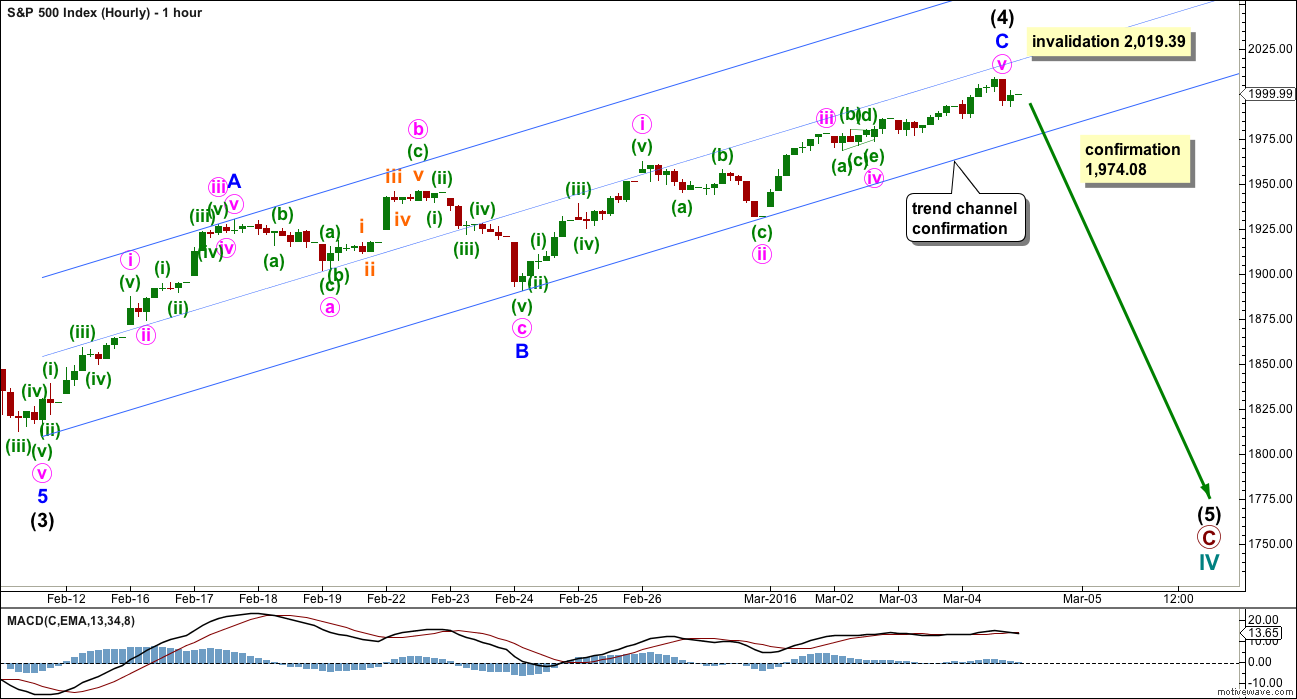
HOURLY CHART
Click chart to enlarge.
Comment on structure will be with the bear wave count today.
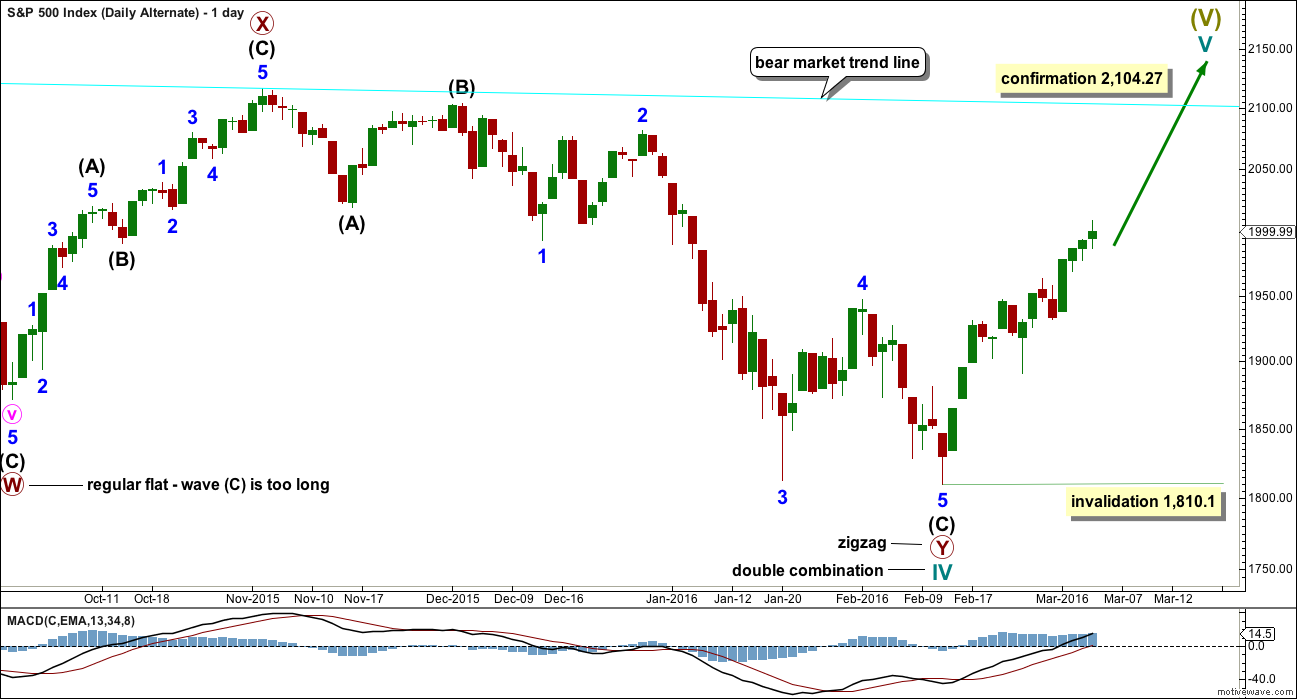
DAILY CHART – COMBINATION
Click chart to enlarge.
This idea is technically possible, but it does not have the right look. It is presented only to consider all possibilities.
If cycle wave IV is a combination, then the first structure may have been a flat correction. But within primary wave W, the type of flat is a regular flat because intermediate wave (B) is less than 105% of intermediate wave (A). Regular flats are sideways movements. Their C waves normally are about even in length with their A waves and normally end only a little beyond the end of the A wave. This possible regular flat has a C wave which ends well beyond the end of the A wave, which gives this possible flat correction a very atypical look.
If cycle wave IV is a combination, then the first structure must be seen as a flat, despite its problems. The second structure of primary wave Y can only be seen as a zigzag because it does not meet the rules for a flat correction.
If cycle wave IV is a combination, then it would be complete. The combination would be a flat – X – zigzag.
Within the new bull market of cycle wave V, no second wave correction may move beyond the start of its first wave below 1,810.10.
I do not have any confidence in this wave count. It should only be used if price confirms it by invalidating all other options above 2,104.27.
BEAR ELLIOTT WAVE COUNT
WEEKLY CHART
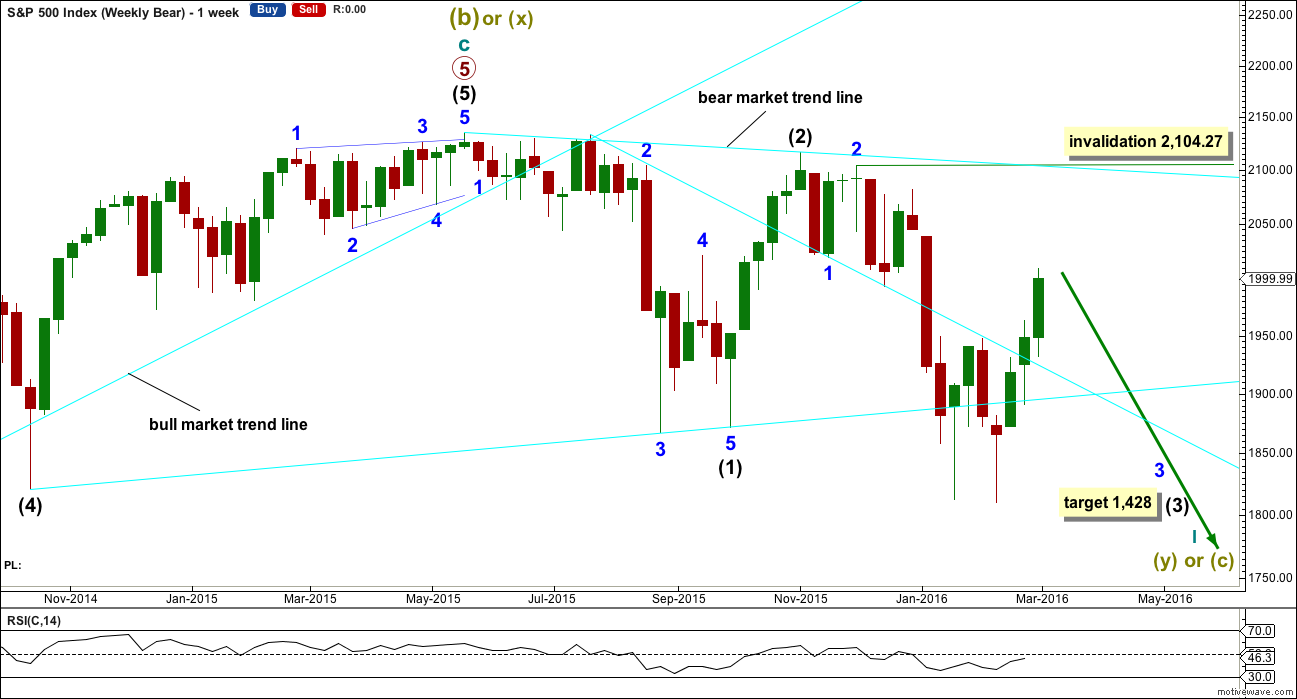
Click chart to enlarge.
This bear wave count fits better than the bull with the even larger picture, super cycle analysis found here. It is also well supported by regular technical analysis at the monthly chart level.
Importantly, there is no lower invalidation point for this wave count. That means there is no lower limit to this bear market.
Downwards movement so far within January still looks like a third wave. This third wave for intermediate wave (3) still has a long way to go. It has to move far enough below the price territory of intermediate wave (1), which has its extreme at 1,867.01, to allow room for a following fourth wave correction to unfold which must remain below intermediate wave (1) price territory.
Intermediate wave (2) was a very deep 0.93 zigzag. Because intermediate wave (2) was so deep the best Fibonacci ratio to apply for the target of intermediate wave (3) is 2.618 which gives a target at 1,428. If intermediate wave (3) ends below this target, then the degree of labelling within this downwards movement may be moved up one degree; this may be primary wave 3 now unfolding and in its early stages.
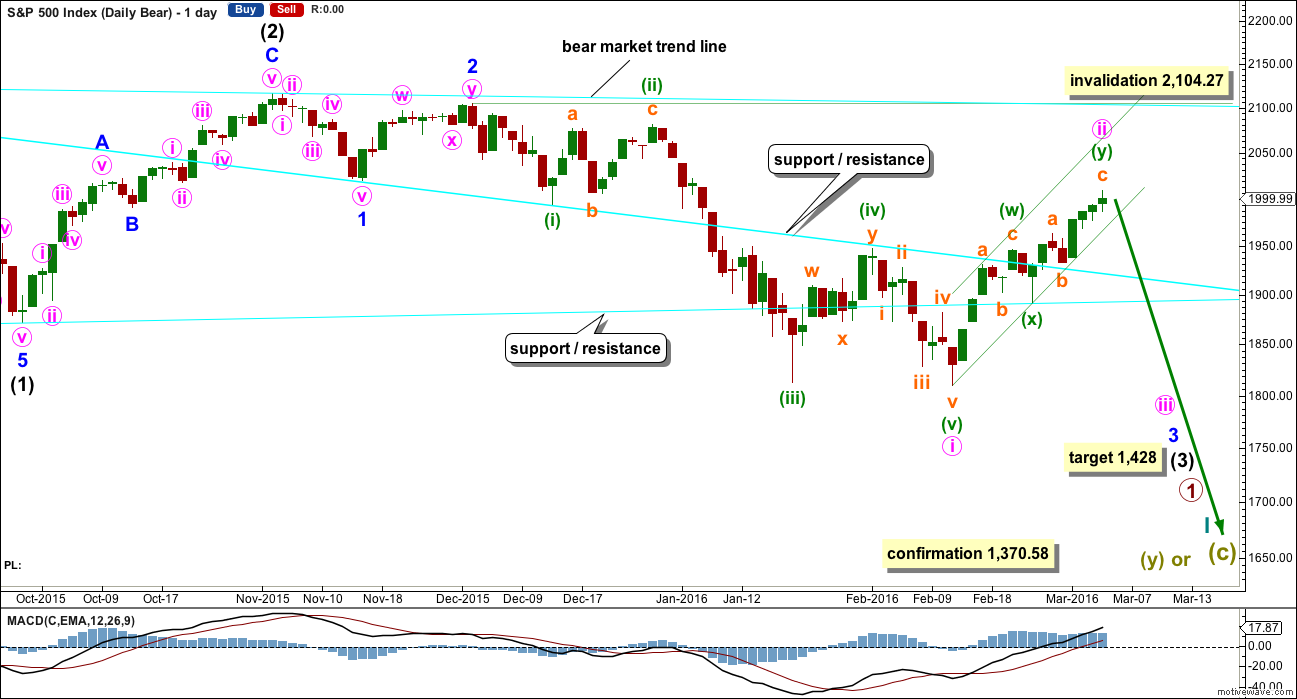
DAILY CHART
Click chart to enlarge.
Intermediate wave (2) lasted 25 sessions (not a Fibonacci number) and minor wave 2 lasted 11 sessions (not a Fibonacci number).
Minute wave ii has now lasted fifteen sessions, four longer than minor wave 2. At this stage, the size of minute wave ii no longer gives the wave count the right look, so for this reason the alternate below is published.
Minute wave ii may not move beyond the start of minute wave i above 2,104.27.
A small channel is added to this bear market rally on the daily chart. This channel needs to be breached before confidence may be had that the rally is over.
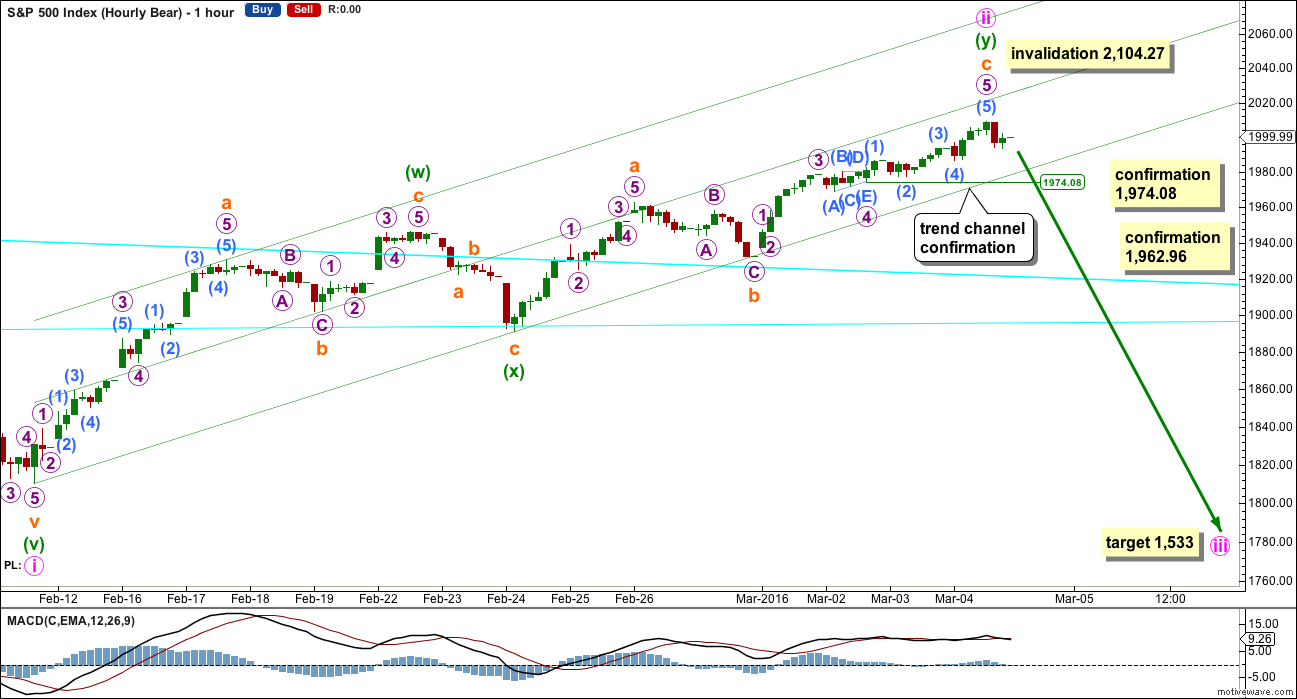
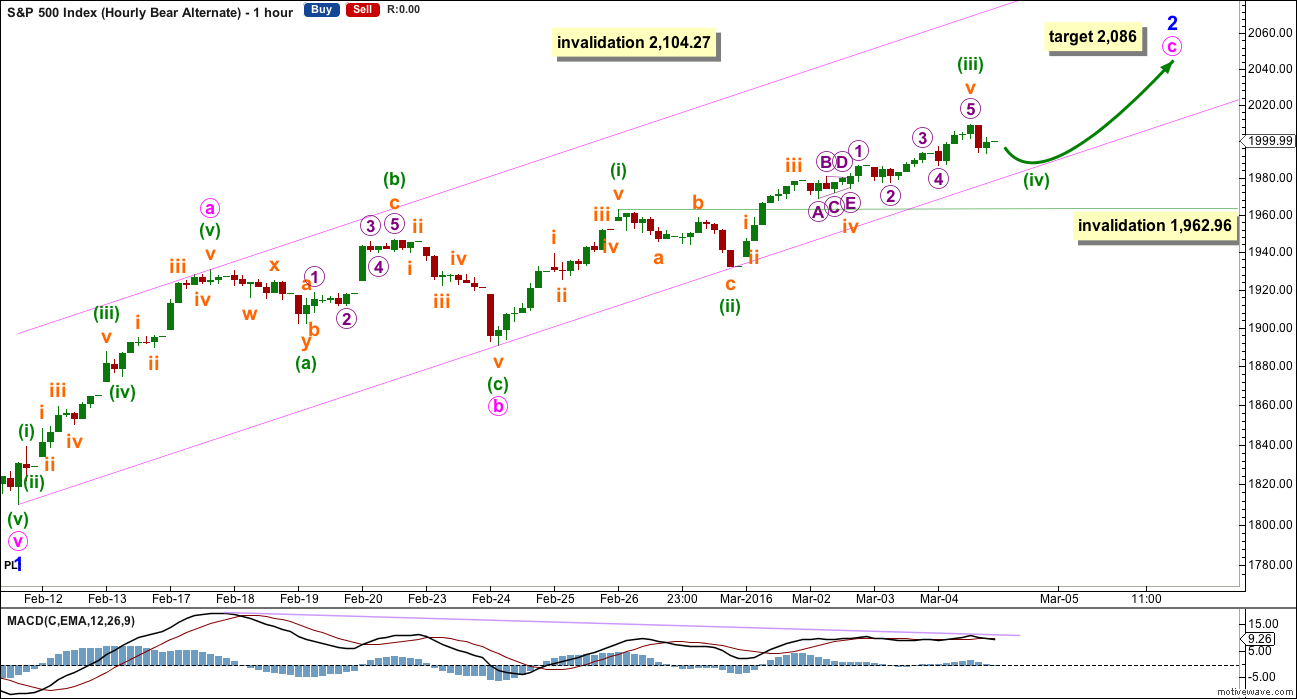
HOURLY CHART
Click chart to enlarge.
There are two ways to see this upwards movement: as a double zigzag as shown here or as a single zigzag as shown for the alternate below. Both ways to label it work in the same way for this and the alternate wave count below.
If upwards movement is a double zigzag, then the structure again looks complete.
Within the first zigzag of the double, subminuette wave c is just 2.18 points short of 0.382 the length of subminuette wave a.
Within the second zigzag of the double, subminuette wave c is now 5.36 points longer than equality in length with subminuette wave a.
There is alternation between the two zigzags: the first zigzag has a long A wave and a short C wave, while the second zigzag has A and C waves close to equality.
Earliest confirmation of a trend change would come with a breach of the channel. However, the S&P does not always fit neatly into channels as it nears the end of a trend. It tends to form rounding tops, breaching a channel before continuing further.
First price confirmation of a trend change would come with a new low below 1,974.08. At that stage, micro wave 5 within subminuette wave c would have to be over because downwards movement could not be a second wave correction within it, so micro wave 5 could not extend.
Strong price confirmation of a trend change would come with a new low below 1,962.96 which would invalidate the alternate below.
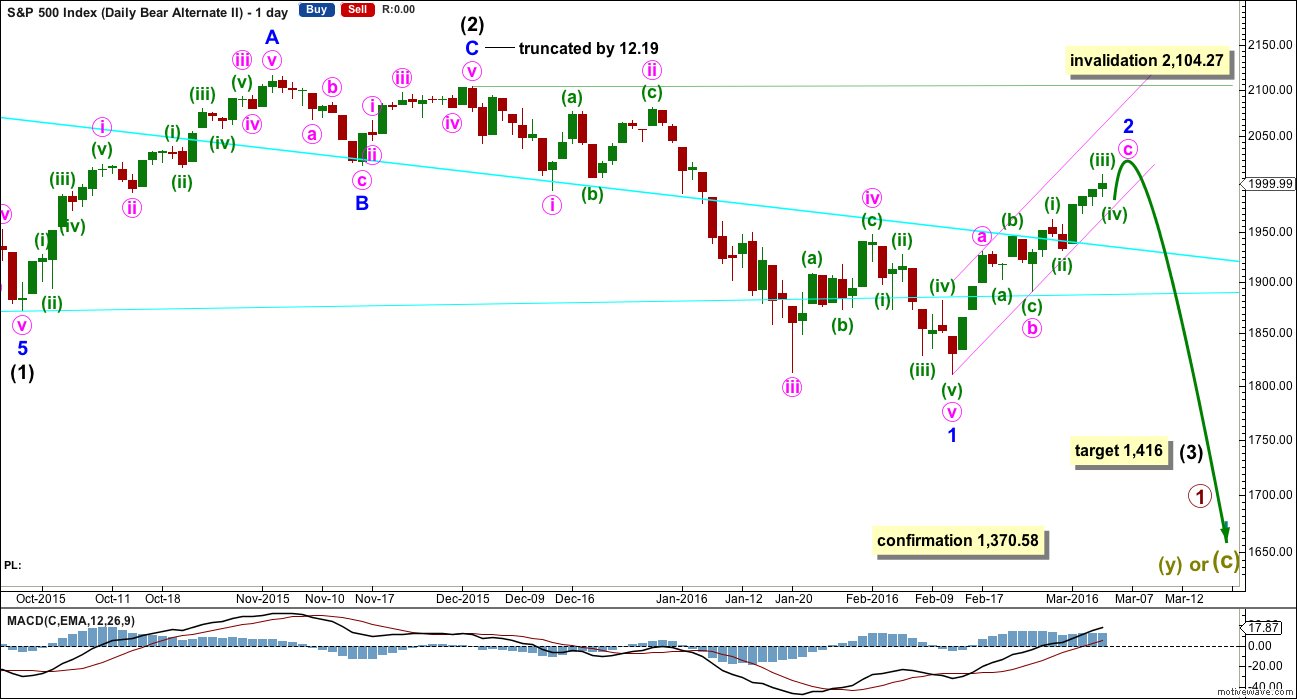
ALTERNATE DAILY CHART
Click chart to enlarge.
The last alternate is discarded. Although it was not invalidated by price, it no longer has the right look in terms of proportion.
This alternate is an attempt to find a wave count with better proportions.
If intermediate wave (2) ends on 2nd December, 2015, then it will only fit as a zigzag with a truncated C wave. I have tried to see other ways of labelling this movement with the same end and so far I cannot find a better solution. The truncation is large at 12.19 points which gives this wave count a very low probability. But this now resolves the problem the main wave count has of proportion.
Intermediate wave (2) for this wave count is 45 days in duration. Minor wave 2 is now fifteen days in duration, so the proportions look good.
Minor wave 2 may not move beyond the start of minor wave 1 above 2,104.27.
This alternate makes a difference to the target. At 1,416 intermediate wave (3) would reach 2.618 the length of intermediate wave (1).
Click chart to enlarge.
Upwards movement may be an incomplete single zigzag. At 2,086 minute wave c would reach 1.618 the length of minute wave a.
Minute wave b is seen as an expanded flat correction.
The channel is drawn in the same way, so it should be used in the same way for earliest indication of a trend change.
Minuette wave (iv) should find strong support at the lower edge of the channel. It may not move into minuette wave (i) price territory below 1,962.96.
Minute wave c shows weaker momentum than minute wave a. There is persistent divergence with price and MACD from the high of minute wave a onwards. For the end of last week, as price made new highs, MACD was essentially flat. This indicates weakness in price.
TECHNICAL ANALYSIS
DAILY CHART
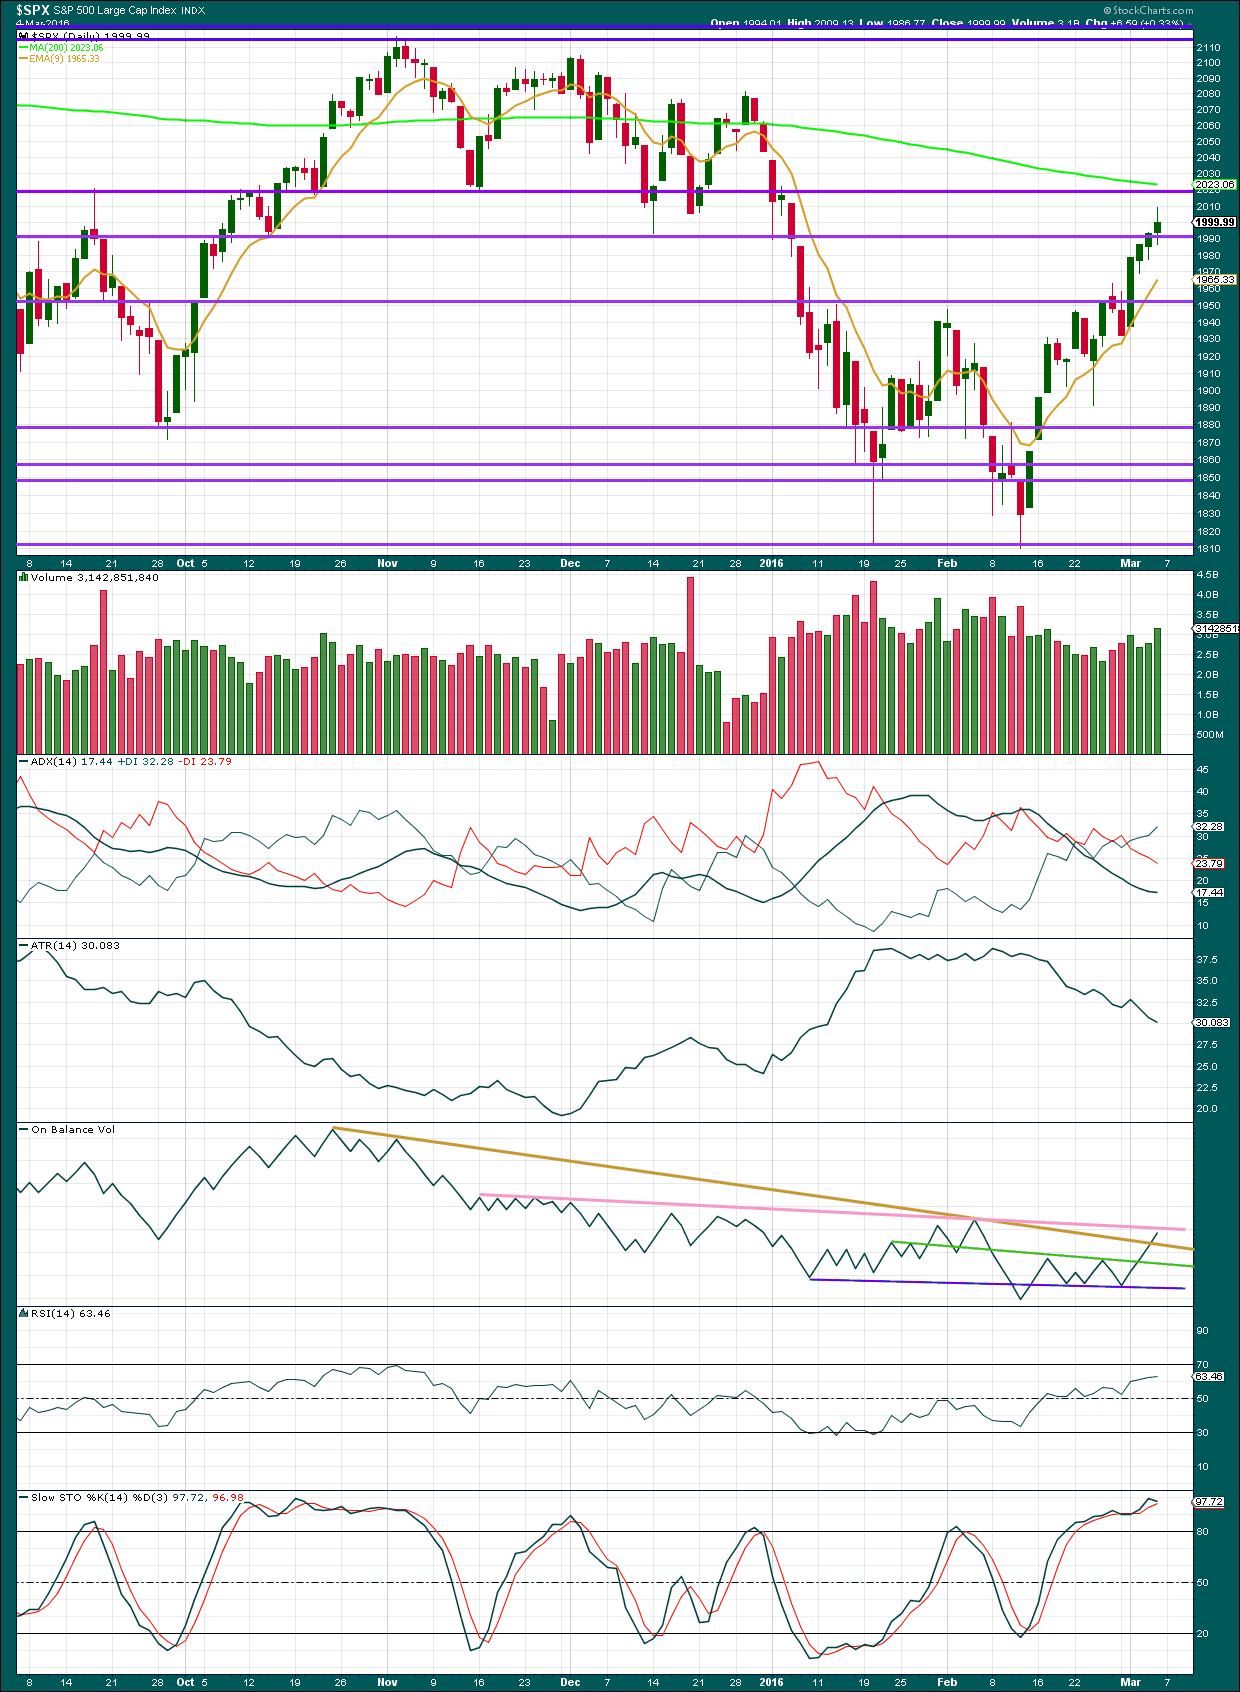
Click chart to enlarge. Chart courtesy of StockCharts.com.
Volume data on StockCharts is different to that given from NYSE, the home of this index. Comments on volume will be based on NYSE volume data when it differs from StockCharts.
Price moved higher for three days in a row on declining volume from 1st to 3rd March. Friday’s session for 4th March saw some increase in volume; the rise in price for Friday was supported by volume. However, volume for Friday remains below 29th February which was a downwards day. Overall, the volume profile remains more bearish than bullish, but it is not consistently and fully bearish.
NYSE volume data shows declining volume for rising price during this rally, and increasing volume on falling price during this rally. The short term volume profile for this rally is bearish.
ADX remains flat to declining indicating that this upwards movement of fifteen days duration is not a new trend; the market is consolidating. ATR agrees as it too is declining despite price moving higher. With these two indicators in agreement, the conclusion from them must be that it is most likely this upwards movement is a correction and not a new bull trend. With both ADX and ATR based on 14 day averages and the rally now lasting fifteen days, these indicators are no longer lagging for this movement.
On Balance Volume has broken above the brown trend line, a weak bullish signal. The next line to offer resistance for OBV is the pink line. This line is repeatedly tested, almost horizontal, and fairly long held. It offers strong technical significance. A breach of this line by OBV would be a strong bullish signal. If OBV finds resistance and turns down from that line that would be a strong bearish signal.
There is no divergence between price and RSI or Stochastics.
DOW THEORY
For the bear wave count I am waiting for Dow Theory to confirm a market crash. I am choosing to use the S&P500, Dow Industrials, Dow Transportation, Nasdaq and I’ll add the Russell 2000 index. Major swing lows are noted below. So far the Industrials, Transportation and Russell 2000 have made new major swing lows. None of these indices have made new highs.
I am aware that this approach is extremely conservative. Original Dow Theory has already confirmed a major trend change as both the industrials and transportation indexes have made new major lows.
At this stage, if the S&P500 and Nasdaq also make new major swing lows, then my modified Dow Theory would confirm a major new bear market. At that stage, my only wave count would be the bear wave count.
The lows below are from October 2014. These lows were the last secondary correction within the primary trend which was the bull market from 2009.
These lows must be breached by a daily close below each point. So far the S&P has made a new low below 1,821.61, but it has not closed below 1,821.61.
S&P500: 1,821.61
Nasdaq: 4,117.84
DJT: 7,700.49 – this price point was breached.
DJIA: 15,855.12 – this price point was breached.
Russell 2000: 1,343.51 – this price point was breached.
This analysis is published @ 03:52 p.m. EST on 5th March, 2016.
Unless the banksters throw in ten billion or so, those round number pivots are going to fall tomorrow and every trader who has been watching will be poised to pounce. If futures continue tanking, we will also definitely get a gap and go on UVXY tomorrow. There has been at least one in each of the last three months and in every case they have led to a breach of the upper B band. Those now frequent penetrations, which were rare, is a sign of something blowing in the wind. It is now quite a ways to the top…
Did I pick up some more of those cheap April 30 calls?
Naaahhhhhhh! No room in the truck!! 😀
The cash dumps in the futures market already underway so the the banksters are fighting the decline tooth and nail. They are probably trying to hold off the slide until Thursday…if they can. What are these clowns going to do when they are facing one hundred points down in SPX and a thousand down in DJI?
I bought a couple of puts yesterday on IYT which looks to have stalled right at the 62% retracement level. Am getting more tomorrow. I prefer it to the SPX because it has led the way down and is more negative.
RUT filled an open gap today and it will also probably lead to the downside once it reverses and the animal spirits of bullish sentiment dissipate. Q’s also look to be about ripe for the pickin’…they were actually down today…
My expectation of a gap up open tomorrow to end move up not at all being confirmed so far by action in SPX futures; today’s high intact with price action in a slow but steady march South…
yup,, there seems to be a significant turn,, Asia indices lookin nasty
Why…Oh why did I sell my puts?? Wussie! 😀 😀 😀
I coulda had a triple instead of a lousy double!
Mixed signals VIX UVXY in the green- bearish!
Pivots NOT surrendered- very bullish…especially this late in the correction and this overbought. On the sidelines short term…we may see a gap higher tomorrow.
I’ve also cashed out. Another day wasted watching paint dry.
Set auto buy for large position UVXY just below 1963 with auto cancel at 2009 (after going above 2009 confirmation will be a bit lower than 1963) – don’t intend to sit watching the market get there though.
Won’t be around for a few days (weeks??) – at least until this thing properly sets alight.
I also am sitting on 100% of my short term capital until we get some resolution. No point in chasing our tails…unless we want to turn ourselves into butter! 🙂
we are going to dismiss the bear case probably tomorrow. Long from 1,920. I don´t see anything bearish so far. Russell? OMG, super bullish since the bottom. 2,100 sooner rather than later (wave 1), and then, correction in April for wave 2.
Keep dreaming!
I will 🙂
Best of luck to ya! 🙂
Clearly making a alot of money to continue paying for an analyst you totally disrespect.
Your long calls would hold more weight if announced in real time. I’ve been long since 1830 😉
Best of luck! 🙂
I decided not to take the bait…I will however comment in a day or two… 😀 😀 😀
btw you are so right about folk boasting about trades after the fact…not worth the time imo…
Apart from pointing out that RUT has been moving higher, you’ve offered no technical reason for dismissing a bear wave count.
RUT also remains below its 200 day MA. It hasn’t breached its bear market trend line.
To make a very bullish statement you really do need to produce a chart with some technical evidence of bullishness.
Now, I’m not saying that there is zero bullishness in the charts. There certainly could be some to be found.
I am just asking that a statement of what you expect price to do should be backed up by technical analysis. This is after all a technical analysis website.
I’ve deleted a couple of comments here. Only because they’re borderline…. not too nice.
Lets all play nicely.
Mathius has an opinion to which he is entitled.
We may ask for evidence, and that is all.
I do not want Mathius to feel alone in his opinion nor that he is inviting any not nice comment for making it.
My standards are exceptionally high for polite interaction. It promotes sharing and collegiality.
Volume lighter today than yesterday at this time:
532.681 Million 3:45PM Friday
446.240 Million 3:45PM Today
FINAL Volume lighter today than yesterday at this time:
780.774 Million 4:06PM Friday
649.690 Million 4:06PM Today
We must be pretty close to the end of this thing. I would really like to see a nice pop up tomorrow although it may drag on until Thursday. If we get a gap up tomorrow I will dip a toe in the water with a small short position. If it ends the day solidly in the green that is usually a sign that a reversal has arrived; if not, back to the sidelines. SPX lagged DJI a bit today…signs of fatigue?
I don’t like the hesitation here. Pivots still providing support. Playing it safe and selling puts for slight profit, just about what I paid for ’em really…short term neutral…If the action around round numbers mean anything, the correction is NOT over. I think we go higher…
We have 2 lines in the sand – 2009 or 1962. Whichever one is hit first is where we are heading.
I’m short atm with a small position, because of the lower probability of the alternate bear and how close we are to 2009.
Not holding my breath either way atm. If today doesn’t resolve I’ll cash out completely and await 1962 to be breached with an auto buy. This invisible hand that keeps popping up every time we drop a few points is doing my head in / wasting my day(s).
Reminds me of an old saying regarding ‘getting off the pot’ 🙂
They seem determined to drive us batty matey!
I have seen this movie before. There are going to be some extreme moves shortly and they could be in either direction. Any extreme upside move I will view as terminal, and a license to kill…er… I mean short… denied an outside reversal day once again… *sigh* 🙂
We have a clear impulse down. Now for a corrective three up, and a runaway train to the downside. Messin’ around the pivots will be deemed nothing but a tease…i.e. bear trap… 🙂
We need a confirmation with a demolition of BOTH round number pivots. If the bears are back to work, we should see at least one hundred points below DJI 17,000.00 and an SPX CLOSE below 1980.00 You cannot underestimate the importance of action around round number control in my experience. Show me the money! 🙂
Whoa! SPY 97 puts saying that’s all she wrote. See what happens when you turn your back on this tricksy market? 🙂
Another small day with so far light volume.
This rally is running out of steam. Let us see what final volume is.
I can see a small five down, leading diagonal? on the five minute chart. Followed by a deep move up.
Perhaps a fourth wave triangle close to resolving, with one final pop to the upside? Not sure if it would count that way, but it seems like we could use one more move up to end all this.
On a day when oil is up 7% and market not moving up a whole lot gives affirmation that the correction up is indeed running out of steam…
Volume lighter today than yesterday at this time:
371.852 Million 1:50PM Friday
313.476 Million 1:50PM Today
I could also label recent action like this, which is bearish. But I think it might be a bit of a stretch. If we go below 1962.81, then this is probably correct. I’ve set an auto buy trigger just below 1962 to allow for that scenario.
A new high above Fridays high would instantly invalidate it.
If they give up the round numbers in the next hour I am definitely giving your labels a thumbs up. Watching my SPY 97 puts to see if they start popping…
Selling premium on Fridays for options expiring the following week is a low risk strategy, particularly if you use spreads to limit exposure and think the end of a short-term trend is approaching. MMS tend to jack up premiums for the next week on Fridays. The objective is not necessarily to hit a home run, but instead get positioned for the possible trend reversal on the cheap, or even better, at house expense… 🙂
Closing half of spread for 30% gain on 99 SPY puts. Will exit 97 puts with stop loss at SPX 2030 for break even.
BTO SPY 200 calls if SPY goes above 203.5…
That was clearly a fourth wave continuing a bit lower. Fifth wave up underway.
So we should be looking for new highs over 2009.13?
Yes imho – this move down from Fridays highs is a 3 wave structure so this is likely the less probable bear alternate playing out (wave 4 in progress now – we likely just finished A & B with wave C down still to go). Looking at its wave (ii) counterpart, I don’t think this move is over yet.
Below approx. 1962.81 invalidates the above view.
Near 1962.81 might be a good low risk setup for a upside trade albeit I’m not touching upside trade for a golden pig – it could easily truncate.
Olga, I can see a five down to the low. A leading contracting diagonal?
The end of the three on my data is at 1,989.52, but the low is slightly lower at 1,989.38.
Thanks Lara – I always seem to get caught out by wave 1 diagonals (of all kinds).
Must learn to identify!!!
It doesn’t look typical in that although its contracting the fifth wave didn’t overshoot the 1-3 trend line.
But it does look like a five best IMO.
For the alternate bearish count, Lara has a target of 2086. I am going to try and scalp the 2030 to 2080 run if it develops…it is looking like it is going to be a torturous rise to end this move so may not even be worth the effort.. 🙁
Must be getting near the end when you and I are getting weary 🙂
I just feel like putting everything on auto today and doing what the algos do.
Last few weeks made a bit of profit, but in terms of opportunity cost it has been a total disaster.
(BTW – I mean opportunity cost of not being more productive outside of markets – certainly not chasing / trading this bear rally).
As soon as we start triggering some downside confirmations I’ll get back into it 🙂 last few weeks has been like pulling teeth.
Looking for low under 1989.30 to confirm short-term down trend.
Now clearly a corrective structure from Fridays highs.
Cashed out Fridays trade with small profit.
Tired of watching market everyday – gonna set buy trigger at first confirmation and do something more constructive with my time 🙂
Me too! ‘Bye all!
Brent crude possible Gartley pattern – $40.028 target
Drahghi’s on deck and European markets are so far in the red; It will be interesting to see if this was a buy the rumor, sell the news scenario the last few weeks, or if Draghi can get enough lemmings to follow him and the ECB off the cliff. I expect a dramatic turn-around as the masses rejoice when he announces expanded QE, but just enough to let me cash out the sell side of my SPY bullish credit spreads and remained poised for the plunge, which is anticipated to follow…. top o’ the morning traders! 🙂
For members interested in Hurst Cycles…
David Hickson is hosting a free Hurst Trading room tomorrow Monday the 7th at 2pm CET (Rome) time, 7am Central U.S.
If you are interested in Hurst Cycles it might be worthwhile.
You will need to get an invite to attend the seminar:
https://hurstcycles.clickwebinar.com/hurst-trading-room-7-march-2016/register
or wait for the YouTube post in a day or so.
BTW, Hurst Cycles are currently showing the market peak happening around March 9 – 11 and rolling over from there, so there might be some timely info to be had 🙂
IMO, Hurst Cycles are a great extra data point to use with Lara’s EW analysis.
Interesting pattern analysis:
http://www.zerohedge.com/news/2016-03-06/bear-market-over-already
Great article Jim! You gotta love zerohedge.
The writer of the article – Lance Roberts – has a lot of good articles on his website.
Lance even quotes the legendary Northman trader – Northy has his finger on the pulse of the market like very few people do. Good stuff.
Based on my analysis with other approaches:
Monday – GAP up
Tuesday – Slightly up
Wednesday – Sideways
Thursday – Down
Friday – Down
3-14 to 18 comes Wave 3 Down Confidence
FOMC meeting scheduled for 3/15-316…great timing.
Looks like no gap until Draghi blathers…
And sp500 chart same as ndx 100 but with truncated top….
Some points on your wave count:
1. It appears to be counting a C wave as a three? A-B-C? But it’s not a C wave within a triangle, it should be a five not a three.
2. The first wave up has a truncation. That reduces the probability.
3. The first wave up needs to be followed by a second wave down, which may not move beyond the start of the first wave. The second wave does move below the start of the first wave which is invalid….. Unless….
4. The first wave up is a higher degree wave. I cannot tell because you are not showing all labelling at all degrees. If it is a big first wave impulse over at your [1] then the fifth wave is truncated and within it the fifth wave is truncated. That is a very low probability wave count.
Please when you post charts put all of your labels for all wave degrees in. Otherwise it leaves others guessing. Elliott wave is complicated enough to understand without guessing about your degrees of labelling, it needs to be clearer.
Lara, I have explained everything in the underneath post, it’s same as NDX100 top which is not truncated. Yes, that [1] is the top of whole bull market that started in 2009 and ended truncated in 2nd dec. with 5waves up not the megaexpanded ABC up that most see or think it is. But this is not my opinion nor my chart or work, it belongs to someone else who is very well known. That’s why I wanted your opinion. Here is the whole chart on sp500 then strating 2009. On 2nd december 2015 the ndx100 (ustech) made a higher high for the bull market. The Nasdaq came close to it. The sp500, djia also came close to the tops in may 2015. The multiyear sp500 chart would be an exact copy of NDX100, except sp500 ends in truncated top. That’s all….
http://stockcharts.com/public/1269446/tenpp
Oh you said: 1. It appears to be counting a C wave as a three? A-B-C? But it’s not a C wave within a triangle, it should be a five not a three.
Sorry, not sure I understand which wave C u refering to? The one down into august lows? In his labeling the primary wave IV of bull market ended there at the august lows yes… This guy is Caldaro btw…
Hello. At this point in time, I believe 3/4 wave counts have almost equal probability, while favouring the main bear. However, the main bull count i think has very little chance at this stage. If this prooves to be a wave 5 up, the combination alt count can be taken into account soon. I have little confidence in that however as the market would need make new highs so myself I am favouring the 3rd wave down soon also. However, there is 1 more possibility I think. What if the market ended in a failed 5th wave up in 2nd of december? The reason is that the NDX100 actually made a new high on that date and there is a clear 5up on that index starting with 2009. If that would be the case, sp500 also would have ended there in 2nd december 2015 and the recent low was the 1st intermediate wave down of this correction or maybe interm. A with the 2nd wave up which started at 1810 being interm or prim. 2 or maybe even wave B up. When this ends, market could go down in wave 3 or C interm. follwing either a short wave 4up and bigger 5 down to end only primary 1 or just another bigger primary B up and again an bigger C down primary to end the bear market sometimes in 2017. Lara, what do you think of this possibility of truncation on sp500 also? Or can the ndx100 started the bear market in december while the other indices started it in may? There is so much confusion and possibilities right now I think… Thank you 🙂
Lara, I have a question regarding possible counts. Could the current rally, minute wave ii, be a minuette A of a flat triangle?
I am hoping that we see the rally continue to 2080+. That would give us a significantly overbought market on virtually all sentiment and momentum indicators. It would give us an entry point with a nearby invalidation (2104). And it would give us a market that can fall for a long time and distance. Almost a perfect entry point. Almost a perfect storm!
Have a great end to your weekend and looking forward to this coming week.
I should have written “a flat or triangle?”
Yes, it could.
The problem would then be the current rally would be only about 1/3 the way through, and it has already lasted 15 days. So at its end it would be at least 30 days in duration.
Now that could work with the new bear alternate I have. There intermediate (2) lasts 45 days. A lower degree second wave correction should be more brief in time for the proportions to look right, 30 days would be more brief than 45.
But I have a big problem with that big truncation in the alternate.
It could be a triangle for a fourth wave, yes. While price remains below 1,993.26 that would remain valid.
Intermediate wave (2) ended on December 2nd for both the Russell 2000 and S&P500 alternate bear with the truncated c wave. This supports the alternate daily bear wave count imho.
That alternate count I think is right on the money. UVXY is telling us this is a higher than minute degree second wave correction. It also signaled that with the second close back below the upper B band but I was too much of chicken to heed an extremely reliable trigger I have used so often. That should have been a ten bagger trade to the downside I have made on many occasions. Anticipating the middle of that third wave down I think has all kept us a little cautious about bullish trades, which in a down trend is not at all a bad thing. Nice to see the trigger confirmed once more though. Live and learn. Next time I promise to not be a WUS! 🙂
ps This is the second time a truncation has screwed with my head so far as UVXY triggers are concerned. I am going to have to keep an eye out for that little trick!
SPX has been tricky in this bear market! I’m chalking it up to a learning experience. Here’s to catching the next wave. 🙂
I don’t know. That’s a big truncation.
I have tried to see the B wave in intermediate (2) as a triangle… but it looks weird. The trend lines don’t look right.
Still trying to find a solution… if I see one which fits nicely and avoids a big truncation I’ll publish it.
I still favour the primary daily bear wave count. It wouldn’t be the first time SPX has a lower degree wave that is longer and deeper than a higher degree wave.
Exactly. It just does not always have perfect proportions.
We need to give it flexibility… within reason of course.
If we are still in minute two, minute three is going to be impressive…
Thanks so much for your thoroughness. I think the key is that the target for the decline is not materially affected by how we ultimately label the waves.
I agree that the alternate bear which expects one more pop to the upside should be taken very seriously despite the truncation lowering its probability.
First sign from Fridays high will be a confirmed 3 wave structure to the downside. We may have only had wave A with B unfolding now and C yet to go – or it might continue sideways in a triangle or something more complex.
It should be fairly obvious which count is playing out even before we get price confirmation.
This is why I like to get in early with a small position – so I can get as close to breakeven as possible when price proves we are still going higher. I was waiting for the final pop up on Friday to get short, then I used simple trendlines and sometimes RSI (you can see them on my chart) to have good confidence that price was about to bounce – so I sold about 50% of my initial position at that point. This is really important to me, because it is that profit which will help mitigate the loss to a break even if I am wrong (or very close to break even). I can often even walk away with a small profit despite being wrong as it is usually a larger degree wave that confirms I am wrong, by which time the market is still lower than my entry point (although UVXY can diverge from market price and make this very tricky).
This kind of aggressive approach can get you into alot of trouble unless you are like a robot with stops (don’t even think about it – just take the loss and move on), and you can follow price movement as it is infolding fairly well.
You are in effect trying to pick a top – which history shows is not a good idea (albeit with TA backing you up, not just the throw of a dart). Get stopped out too many times without that bit of profit set aside and you can lose your shirt. Don’t stick to your stops and well… you can imagine. That’s why its a very good idea to trade with the larger trend not against it.
A good example of where I could easily have my backside handed to me on a plate (and have done in the past), is if we gap and go upwards on Monday – that’s why it is a small position, not betting the farm.
Needless to say I do not advocate this style of very aggressive trading unless you are at least playing with the houses money.
Important point I forgot to mention – as soon as we fall below wave b of this 3 wave bounce upwards (if that is what it is), I will buy back that 50% initially sold, so (hopefully) reducing the cost of my position – (I say hopefully because UVXY does not always play nice).
If we make new highs now without a 3 wave move to the downside, I will sell the remaining 50% (hopefully at break even due to selling 50% near the bottom of the current bounce).
If we ‘gap and go upwards’…. well. I’ll be hoping for a downards correction to offload as best I can or taking the heat!!
Hope is not one of the best trading strategies in my experience 🙂
Thanks for sharing your trading tactics Olga! Hope you are having a good weekend. 🙂
Thanks Thomas – you also 🙂
My favourite lowest risk trade is the : “Wave 4 sniffin Wave 1” trade.
The trendline “Kiss and Run” trade which Lara very kindly brought to our attention is also becoming one of my favourites and seems to present itself more often.
The key is to use EW to get positioned as close to invalidation as possible, with alot of potential wave to surf if you don’t get stopped out (using larger degree EW count context for increased odds of not being stopped out)
A little patience and the risk reward can be extremely in your favour. Mr Market doesn’t like dishing good opportunities out ‘willy nilly’ so when he does they are usually worth a bit of calculated risk imho.
Worth noting that I have (still) not found ‘the perfect trade’. That is, a trade guaranteed not to lose money if you are wrong and pay out loads if you are right. Don’t think it exists, but if any member knows of it then please do share!!
While none of us knows for sure whether this is the top, this chart from zerohedge indicates that we are likely very close:
Nice chart, thomas. I did not even think of checking short interest. This peak is significant.
As I was looking at the chart, one thing that caught my eye is that from 2005 to 2007 short interest rose from about 8,000 to nearly 19,000. Then it fell as the market fell in 2008-2009, but instead of returning to pre-2007 levels, it stabilized around 14,000 over the next several years. Then in 2014 it started rising from the 14,000 level to the 18,000 level again.
So with all that said, what does it mean that the level of short interest has only risen from 14,000 to 18,000 over the last couple of years (~30% increase), versus ~130% increase leading up to the 2008/2009 decline? Have investors remained consistently bearish throughout this entire rise from 2009-2015?
Beat all of you!
Hey Verne, you are not the only one who noticed that UVXY turned up at the end of the day Fri. Did you notice where? Its right smack on a trendline I have been following for a couple of months now, connecting the late Nov and late Dec. lows. Been looking (hoping) for it to get there. This is my entry.
good going Thomas,, I was lagging again..I feel it in my bones that we drop big next week,, and I know bones.
If only I could buy put options on your bones…
I have adjusted many more upper cervicals than sacrums this week,, which is indicative of a top in the market. grin
the spread is awful,, very thinly traded
Yep. I have been steadily accumulating since last year’s low. Just a bit under water with my last truck-load, still solidly in the green with hoard from last year and managing draw-downs with occasional covered calls. It could revisit the sub- thirty area briefly but these levels are quite amazing considering what is ahead of us. The stupendous mis-pricing continues in the leaps, very much the same as in December last year. Definitely not an instrument for everyone but if you know what to look for….as someone said, when it’s lying in a corner, you simply go over and pick it up… 🙂
BTW, UVXY is excellent at spotting wave two tops so what it does on Monday will be telling. I don’t mind getting more on the cheap but that window is probably swiftly closing…
Hey Tom;
Speaking of UVXY, there is an interesting pricing anomaly on April 21 strike calls. They are all sporting a delta of about .9 and the bid for just about every week is around 9 bucks. If we are indeed on the threshold of the middle of a third wave down, that is a potential mega-buck trade. Depending on what happens next week, I am going to try and get filled on ten for under ten for the last week of April. I’ll keep you posted.
Thanks, I’ll be watching. I’m buying a little UVXY, but holding off on the options for more confirmation.
That is wise imo. Stuart is not the only one concerned about potential bullishness in the market. Prechter, after incorrectly calling market tops just about every year for the past several years, is now pointing out the possibility the latest move could be either a zig-zag or triangle for an intermediate wave four correction, with still a fifth wave up to come. He has an unbroken tren-dline connecting the 2011 low which he labels wave two, and the recent lows. Kimble also noted what he thinks is a possible bullish reversal from the 1800 area and a support shelf that goes back to 2014. Clearly, we need a break of these levels to be fully confident of the bearish case. I do not think it is a matter of if, just when. Understanding the implications of that distinction is critical to surviving as a trader – Just because something is inevitable, does not imply its immediacy. For me personally, the key remains the DJI 17000 and SPX 2000 pivots. In times of uncertainty, I am learning the importance paying attention signals I have found to be reliable over the years. We should know more in a few hours! 🙂
Thanks for sharing that Verne. I don’t subscribe to EWI, strange as that may be to some folks, and therefore wasn’t aware of Precther’s views though i fully agree it’s very possible to count this as a wave 4 correction.
Sadly that’s the trouble with counts when things are not completely clear- alternatives can be just as valid as primary counts and nothing’s confirmed until price says so.
As i stated previously i didn’t have a shred of doubt about market direction until the close on Friday, and for all i cared price could swing about all it wanted until i took profit at 1775, but… Since then i have reconsidered my resolution in that position and will be watching price VERY closely this coming week. Below the support zone of 68-75SPX then it’s game on for the bears again if they can follow through and turn that into resistance, but if we continue upwards to complete 5 waves then all short bets are off for me I’m afraid. (I’ll still be short & hedged until then however)
Interestingly on the chart posted by Thomas above the Russell doesn’t look very bearish on the daily… wonder if it’s ahead of the game? Only time will tell i suppose… anyways i digress…
Here’s something for everyone trading futures to consider this week:
We are approaching roll week for indices futures, with roll being the Thursday of the week prior to expiry.
Therefore it would be *unlikely* that this rally just keeps storming upwards in spite of roll week, because a lot of players need to swap out positions and this is why the roll week is usually a volatile one.
So don’t be surprised by some wild swings BOTH WAYS this week, regardless of whatever count you are following. Stay safe out there 🙂
Prechter did believe the DJIA would need to go into the 17000’s again to change the sentiment… we are there now.
He uses that W4 Bull count to show that once the support shelf is broken… that Bull Count can be eliminated once & for all. IMO he is still a Bear Count believer.
Some folk are also seeing that support shelf as the neck-line of a head and shoulders pattern…