
Last Nasdaq analysis was invalidated by upwards movement.
Summary: Nasdaq is still in a bear market. A big third wave down is very close. If this current bounce continues, it may end about 4,784.
New updates to this analysis are in bold.
BULL WAVE COUNT
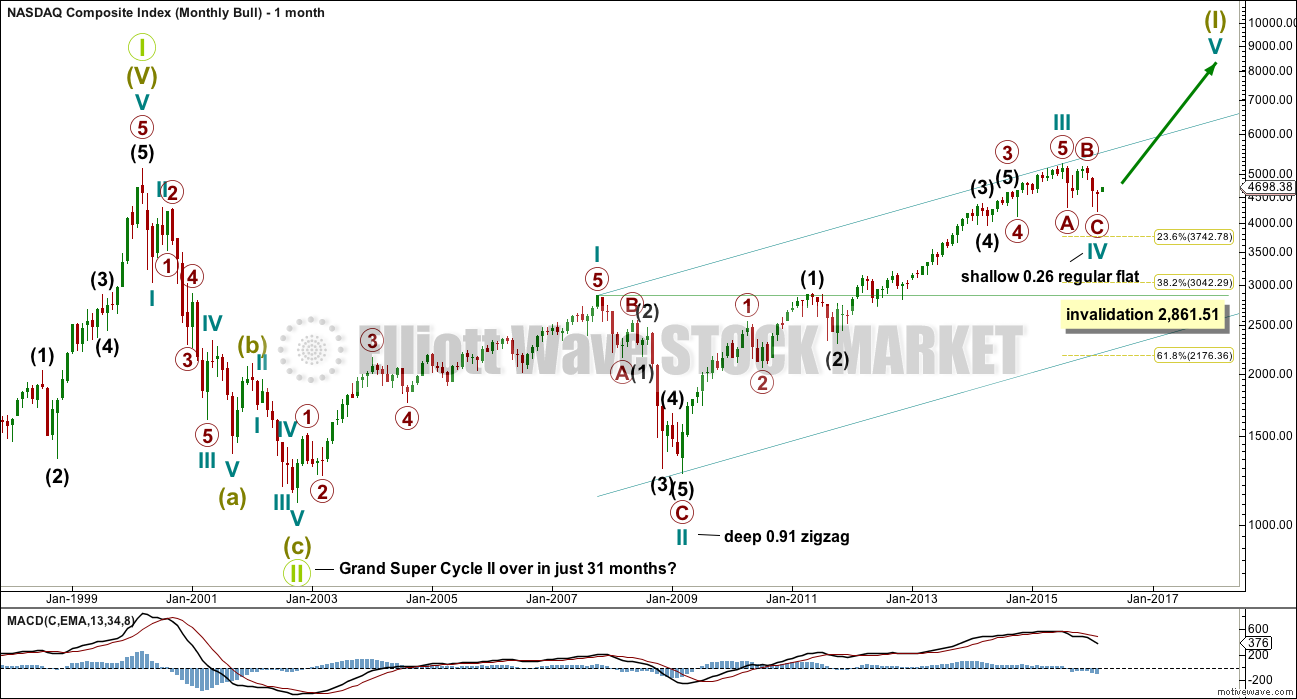
MONTHLY CHART
Click chart to enlarge.
Grand Super Cycle wave II is seen here as over in just 31 months. This is possible, but it is more likely it would last longer than this.
This wave count sees Nasdaq in a Grand Super Cycle wave III upwards.
There is no Fibonacci ratio between cycle waves I and III.
Super Cycle wave (I) is an incomplete impulse. Within Super Cycle wave (I), cycle wave IV is just now complete.
Cycle wave II was a very deep 0.91 zigzag lasting 17 months. Cycle wave IV may have exhibited alternation as a shallow flat lasting just 7 months. This is possible, but what is equally as possible is cycle wave IV may continue sideways as a double flat or double combination. Only a clear five up on the daily chart would eliminate these possibilities. A trend change at cycle degree requires confirmation with a new high above 5,176.77 (to invalidate the bear count below) and a clear five wave structure upwards on the daily chart.
Cycle wave IV may not move into cycle wave I price territory below 2,861.51.
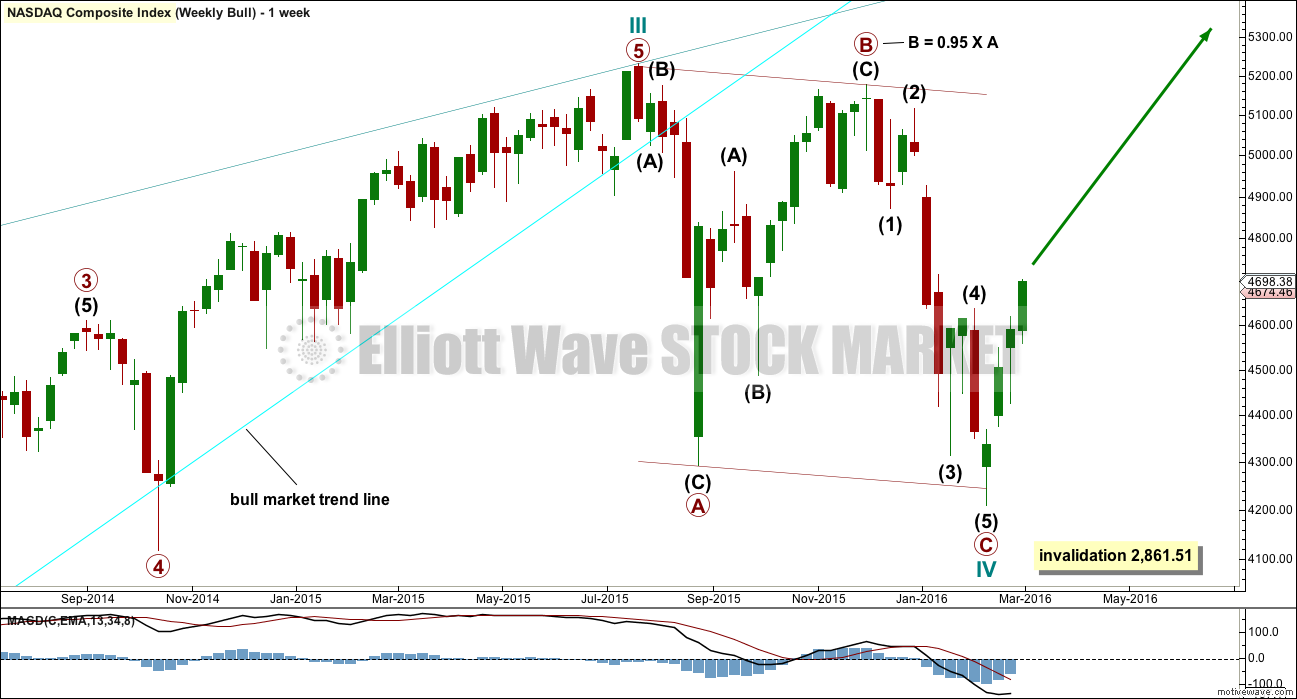
WEEKLY CHART
Click chart to enlarge.
The bull market trend line is drawn from the end of cycle wave II in March 2009, to the end of minuette wave (ii) in November 2012. This trend line has been breached by a close of more than 3% of market value indicating a market change from bull to bear.
Cycle wave IV is most likely to be a flat, combination or triangle to exhibit structural alternation with the zigzag of cycle wave II.
Regular flats fit well within trend channels. Their C waves normally are about even in length with their A waves. At 4,246 primary wave C would reach equality in length with primary wave A. Primary wave C may find support at the lower edge of the channel. Primary wave C is just 35.97 points longer than equality in length with primary wave A.
The degree of labelling within cycle wave IV may be moved down one degree. This flat correction may be only primary wave A of a larger flat, or a triangle, or primary wave W of a double flat or double combination. A clear five wave structure upwards on the daily chart is absolutely required before any confidence may be had in this wave count. A new cycle degree bull market should last one to several years. Waiting for confirmation is a wise idea.
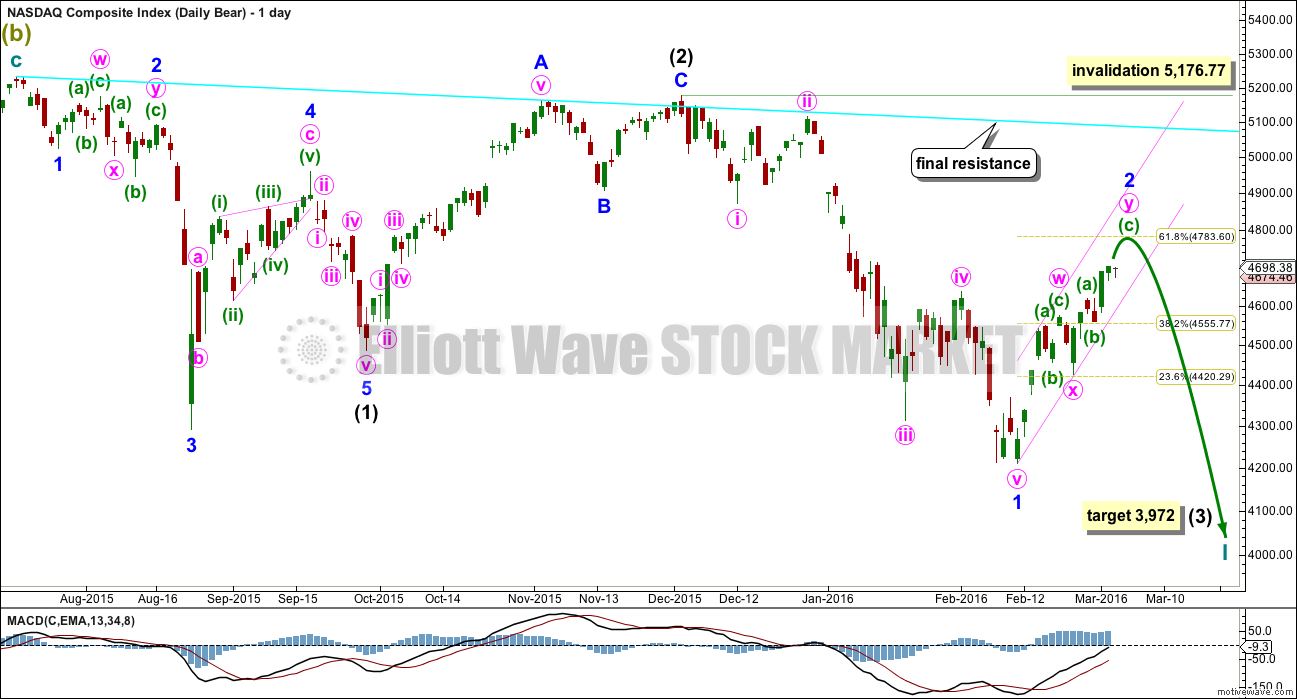
BEAR WAVE COUNT
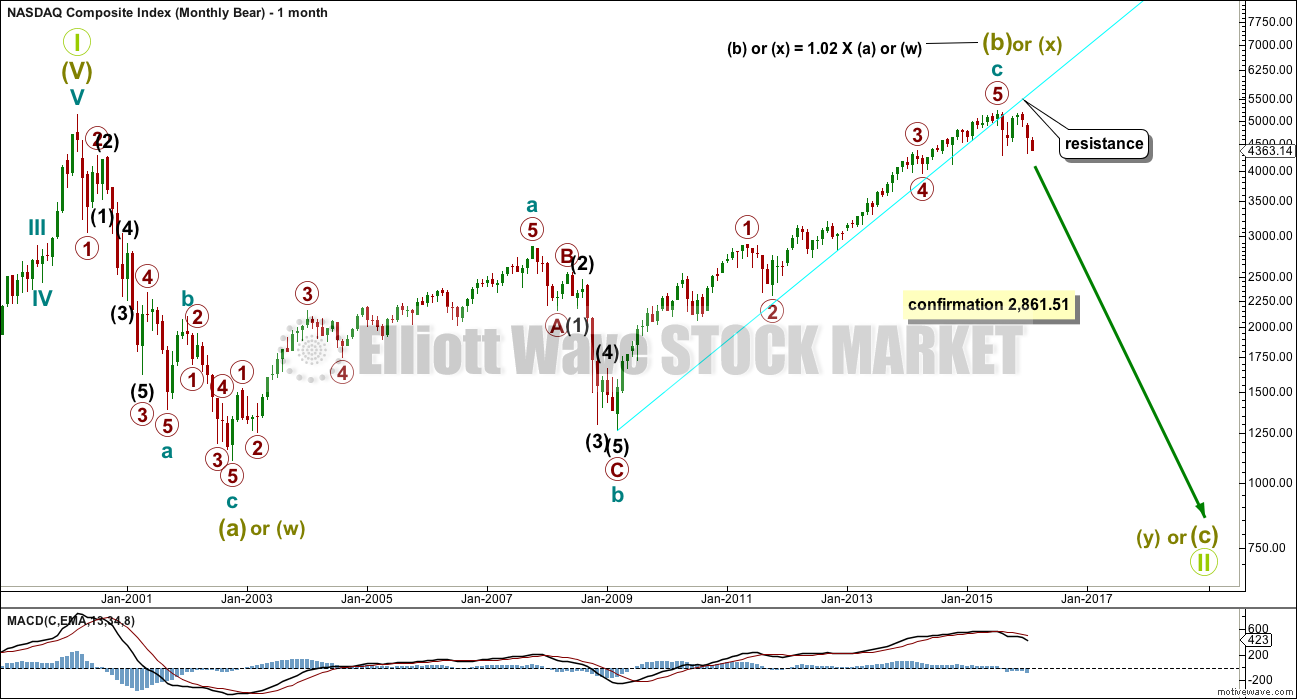
MONTHLY CHART
Click chart to enlarge.
The bear wave count just moves everything from the all time high at 5,132.52 all down one degree. Grand Super Cycle wave II may be an incomplete flat, combination or double flat.
A new low below 2,861.51 would invalidate the bull wave count and confirm a huge market crash.
All subdivisions are seen in exactly the same way, only the degree of labelling is different.
If Grand Super Cycle wave II is a combination, then super cycle wave (y) would be a zigzag or triangle.
If Grand Super Cycle wave II is a double flat, then super cycle wave (y) would be a flat correction ending about the same level as super cycle wave (w) at 1,160.
If Grand Super Cycle wave II is a regular flat, then super cycle wave (c) would be a five wave structure to end below super cycle wave (a) at 1,160 to avoid a truncation.
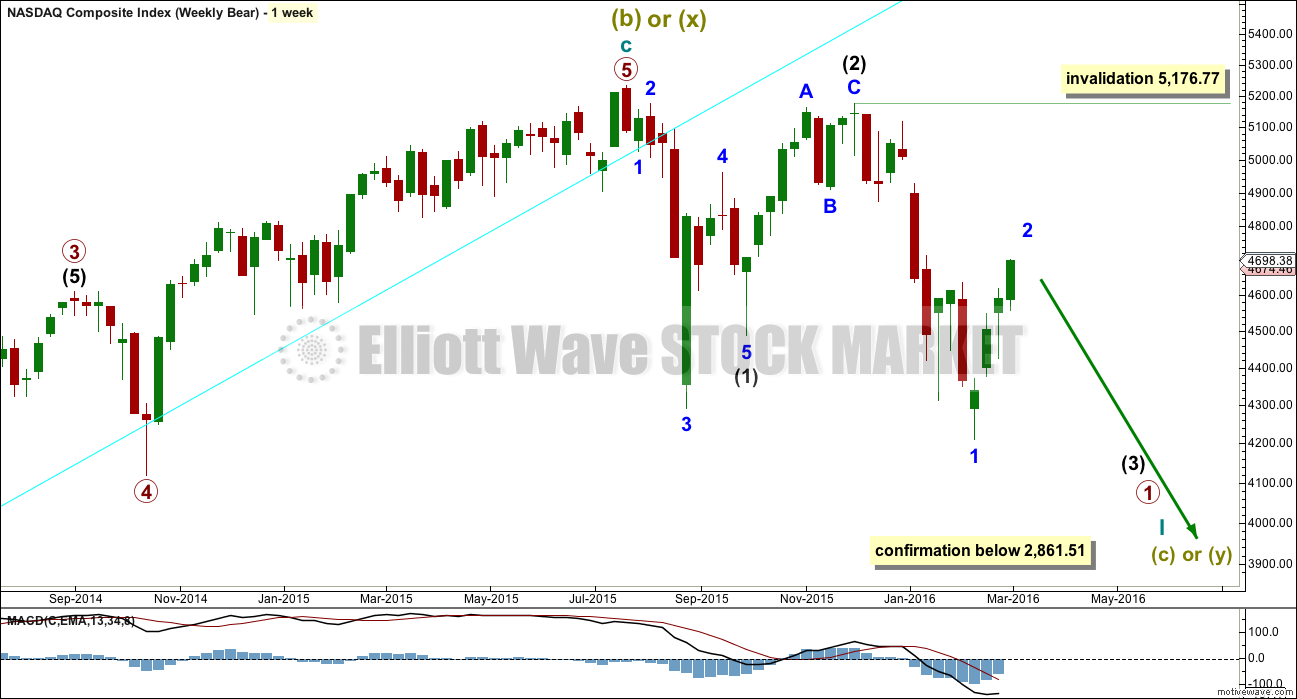
WEEKLY CHART
Click chart to enlarge.
The labelling of this upwards impulse is exactly the same as the bull wave count at the weekly chart level because 1-2-3 of an impulse subdivides 5-3-5, exactly the same as a zigzag. Here the bull market from March 2009 is seen as a zigzag for a super cycle wave (b). Super cycle wave (b) was a 101% length of super cycle wave (a).
Downwards movement from the all time high may be a first wave for intermediate wave (1), a deep second wave correction for intermediate wave (2), and now an incomplete third wave for intermediate wave (3).
Intermediate wave (1) may have ended with a truncation. This is possible after the prior move of minor wave 3 moved “too far too fast”.
With intermediate wave (1) seen as over with a truncation, the structure of intermediate wave (2) now fits as a zigzag. It looks like a three.
Intermediate wave (3) must move far enough below the price extreme of intermediate wave (1) to allow for room for the following correction of intermediate wave (4) to unfold and not move back into intermediate wave (1) price territory.
DAILY CHART
Click chart to enlarge.
Downwards movement for both bull and bear wave counts is seen in the same way as a five wave impulse. C waves and third waves will both subdivide as impulses. Third waves may only subdivide as impulses.
Within intermediate wave (3), an impulse is complete for minor wave 1. This cannot be the entirety of intermediate wave (3) because it has not moved far enough below the price territory of intermediate wave (1).
Minor wave 2 may be a complete or almost complete double zigzag. If it continues higher, it may end about the .618 Fibonacci ratio at 4,784. Minor wave 2 fits neatly into a small channel. When this channel is clearly breached by a full daily candlestick below and not touching the lower edge, that shall provide trend channel confirmation that the bounce of minor wave 2 is over and the next wave down is underway.
At 3,972 intermediate wave (3) would reach 1.618 the length of intermediate wave (1). If this target is wrong, it may not be low enough. The next target would be at 3,227 where intermediate wave (3) would reach 2.618 the length of intermediate wave (1).
Minor wave 2 may not move beyond the start of minor wave 1 above 5,176.77.
TECHNICAL ANALYSIS
MONTHLY CHART
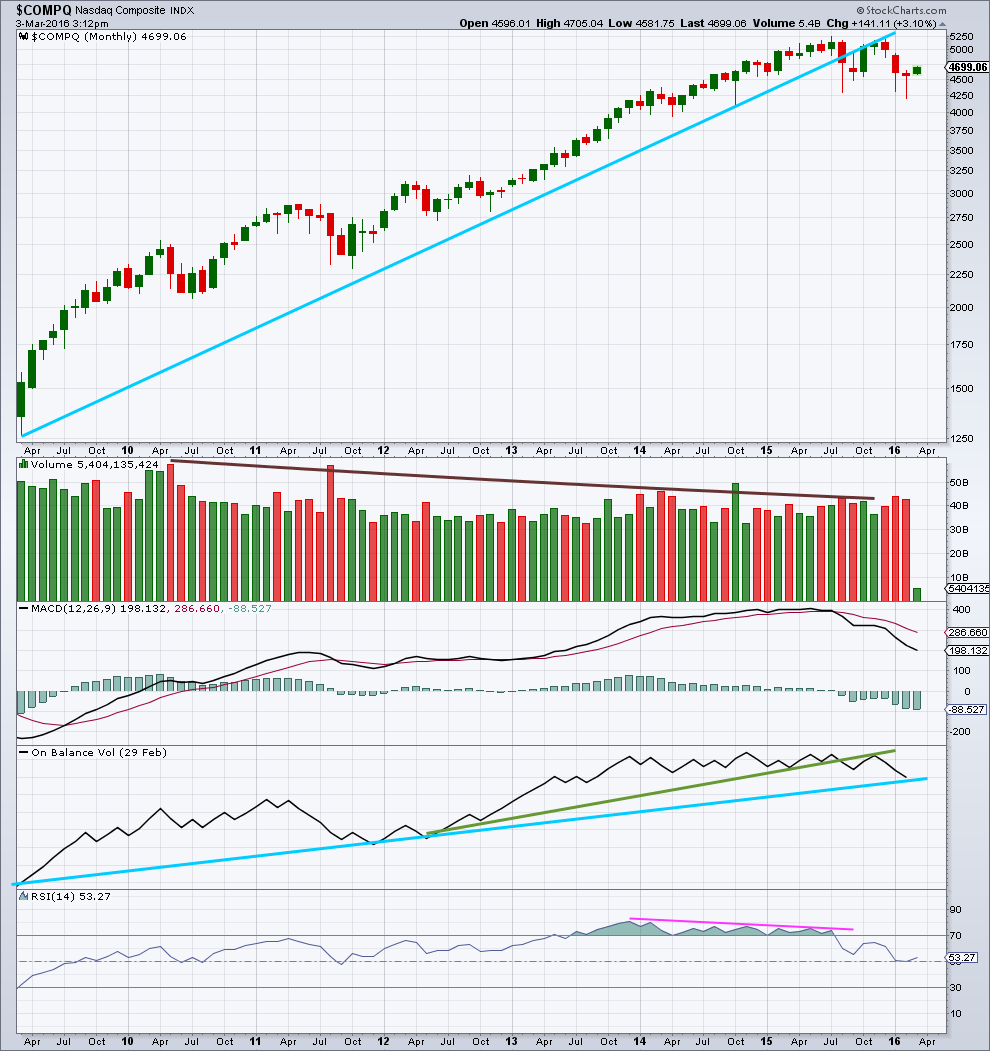
Click chart to enlarge. Chart courtesy of StockCharts.com.
A more conservatively drawn trend line from the end of March 2009 is drawn here (blue line). It was reasonably shallow, repeatedly tested, and is highly technically significant. It has been breached and provided resistance.
Since May 2010, overall, as price rose to all time highs volume declined. The bull market was not well supported by volume and is suspicious.
There was slight negative technical divergence with price and MACD at the all time high.
On Balance Volume has breached a trend line held since May 2012, (green line) which is bearish. OBV turned up and tested the green line which held. The strength of that line is reinforced. This is further bearish indication.
There is negative divergence between price and RSI going back to December 2013, as price made all time highs. This is a strong bearish indicator. This was also seen up to March 2000, and was followed by a 78% drop in market value to the low of 1,108 in October 2012. It does not mean that the market must make a similar fall at this time, but it is a strong bearish indicator.
DAILY CHART
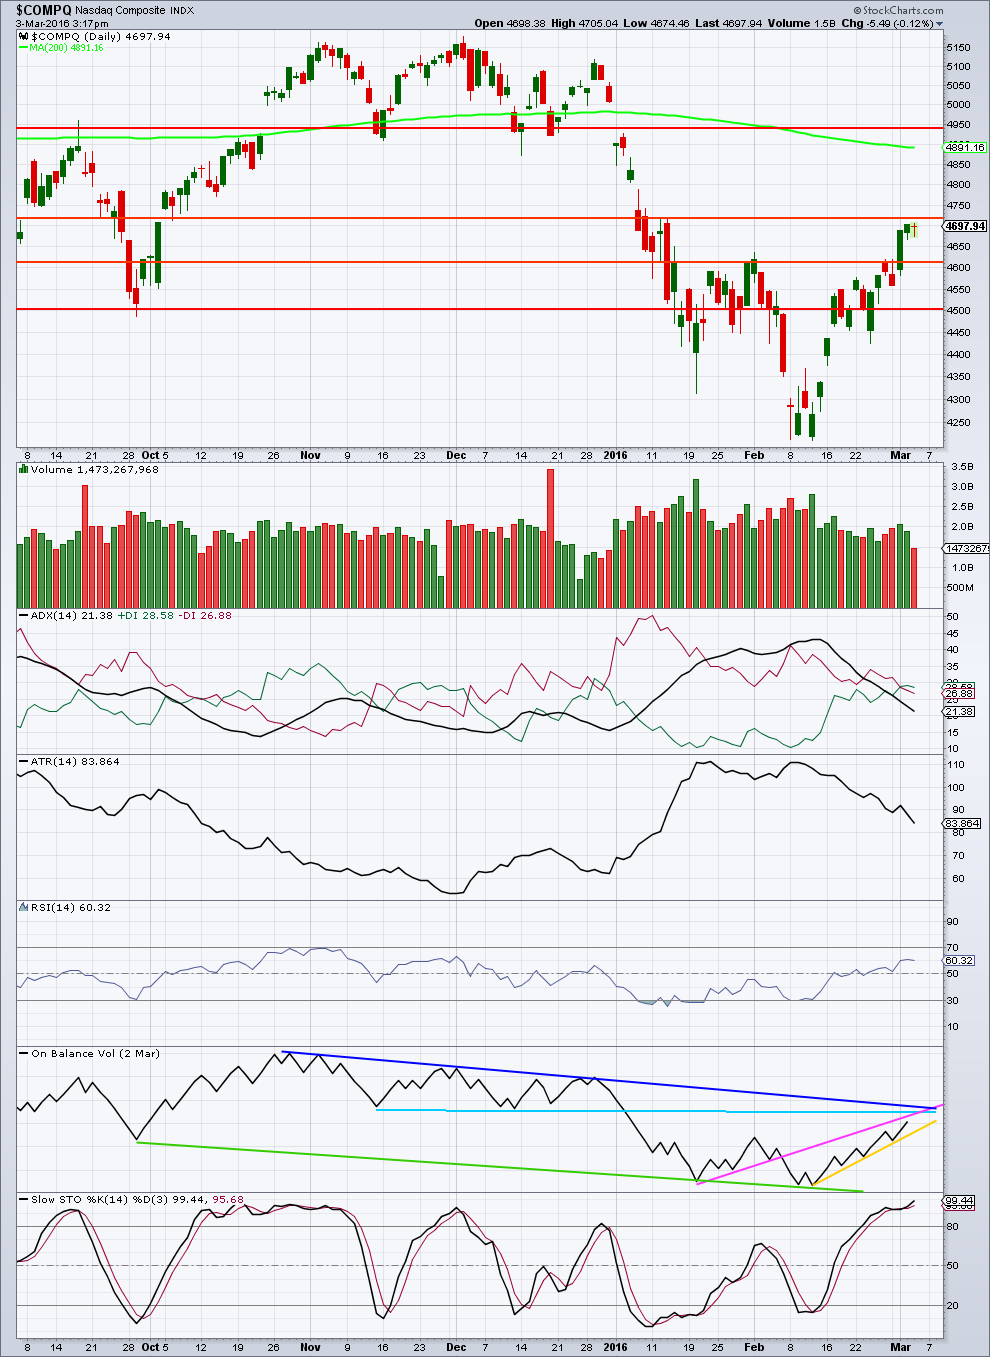
Click chart to enlarge. Chart courtesy of StockCharts.com.
For three days in a row now, as price rises there is declining volume. The upwards move in price is weak and not supported by volume, so is suspicious. This looks like a typical bear market rally and not the start of a new bull market.
ADX is declining which indicates the market is not trending; it is consolidating. ATR agrees as it too is declining.
Price is finding resistance just below the red horizontal trend line at 4,120.
This bounce has returned RSI from almost oversold to above neutral. There is again plenty of room for this bear market to fall.
On Balance Volume is finding resistance at three trend lines (almost). Any further upwards movement from OBV should be stopped by these three lines. A new yellow line is drawn for support. If that line is breached by OBV, it would be a bearish indication.
Stochastics is overbought. With price finding resistance and Stochastics overbought, an end to the upwards swing should be expected about here.
This analysis is published @ 04:32 p.m. EST.
Thanks Lara!
You’re most welcome.
I know it took a long time. I have much going on.
Now in Russell, Bay of Islands. It’s so stunning, I may post a pic of the view from my workspace tomorrow before I begin…
Lara,
I saw the picture you posted, it looks beautiful. Enjoy your time off!
woo hoo, 1st