
The alternate Elliott wave count allowing for more upwards movement was confirmed with a new high.
Summary: The bounce is continuing higher as a double zigzag. The target for it to end is 2,004. If it ends tomorrow, it would total a Fibonacci 13 daily candlesticks. Confirmation the correction is over will first come with a clear breach of the channel containing it, and thereafter a new low below 1,931.88.
To see how each of the bull and bear wave counts fit within a larger time frame see the Grand Supercycle Analysis.
To see detail of the bull market from 2009 to the all time high on weekly charts, click here.
Last published monthly charts can be seen here.
If I was asked to pick a winner (which I am reluctant to do) I would say the bear wave count has a higher probability. It is better supported by regular technical analysis at the monthly chart level, it fits the Grand Supercycle analysis better, and it has overall the “right look”.
New updates to this analysis are in bold.
BULL ELLIOTT WAVE COUNT
DAILY CHART – FLAT
Click chart to enlarge.
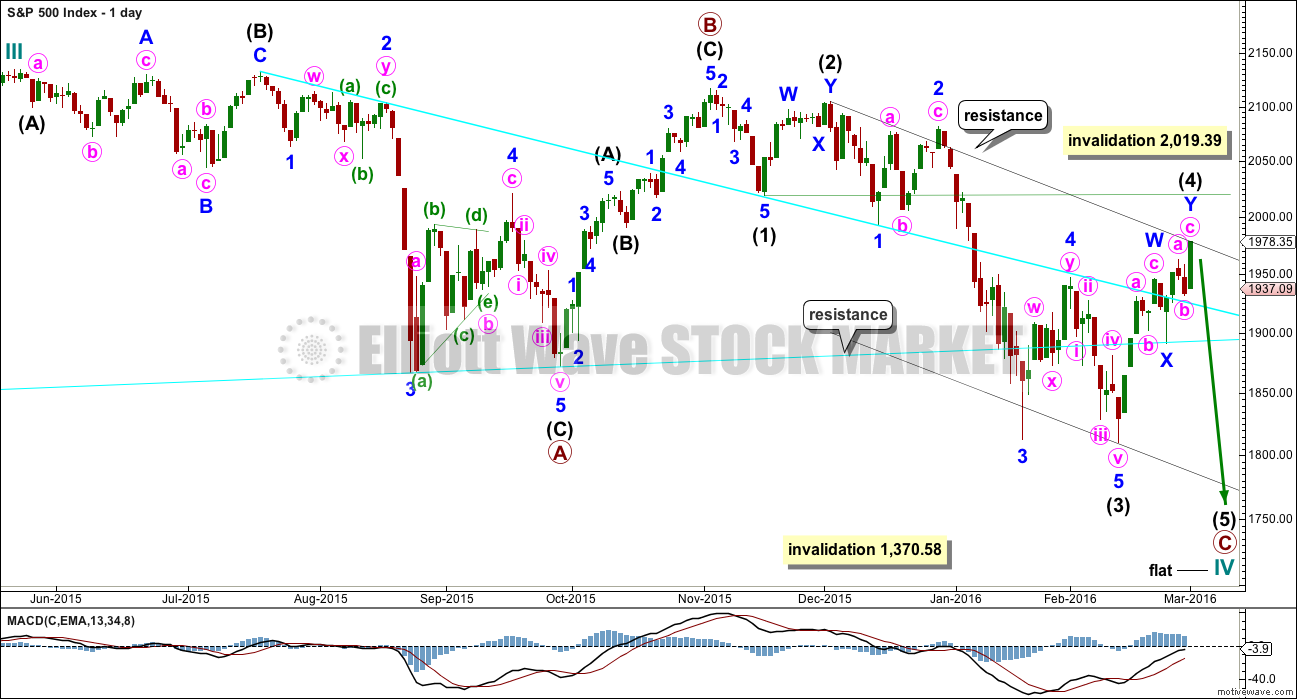
This wave count is bullish at Super Cycle degree.
Cycle wave IV may not move into cycle wave I price territory below 1,370.58. If this bull wave count is invalidated by downwards movement, then the bear wave count shall be fully confirmed.
Cycle wave II was a shallow 0.41 zigzag lasting three months. Cycle wave IV should exhibit alternation in structure and maybe also alternation in depth. Cycle wave IV may be a flat, or combination. This first daily chart looks at a flat correction.
Cycle wave IV may end within the price range of the fourth wave of one lesser degree. Because of the good Fibonacci ratio for primary wave 3 and the perfect subdivisions within it, I am confident that primary wave 4 has its range from 1,730 to 1,647.
Primary wave C should subdivide as a five.
Within the new downwards wave of primary wave C, intermediate waves (1), (2) and now (3) may be complete. Intermediate wave (4) is continuing higher and may not yet be complete. Both intermediate waves (2) and (4) subdivide as double zigzags, and both now are deep. There is no alternation between them which reduces the probability of the wave count.
When intermediate wave (4) may again be seen as complete, then a target may be calculated for intermediate wave (5) to end. It should move at least slightly below the end of intermediate wave (3) at 1,810.10 to avoid a truncation.
The idea of a flat correction for cycle wave IV has the best look for the bull wave count. The structure would be nearly complete and at the monthly level cycle wave IV would be relatively in proportion to cycle wave II.
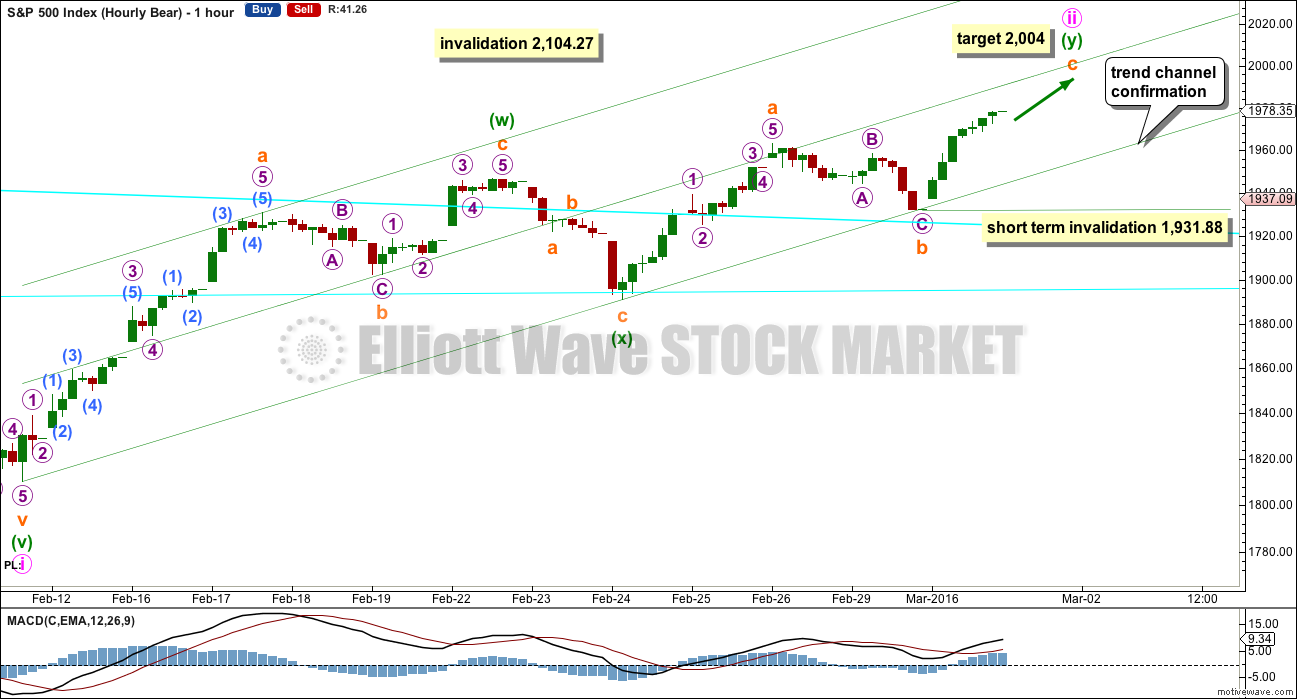
HOURLY CHART
Click chart to enlarge.
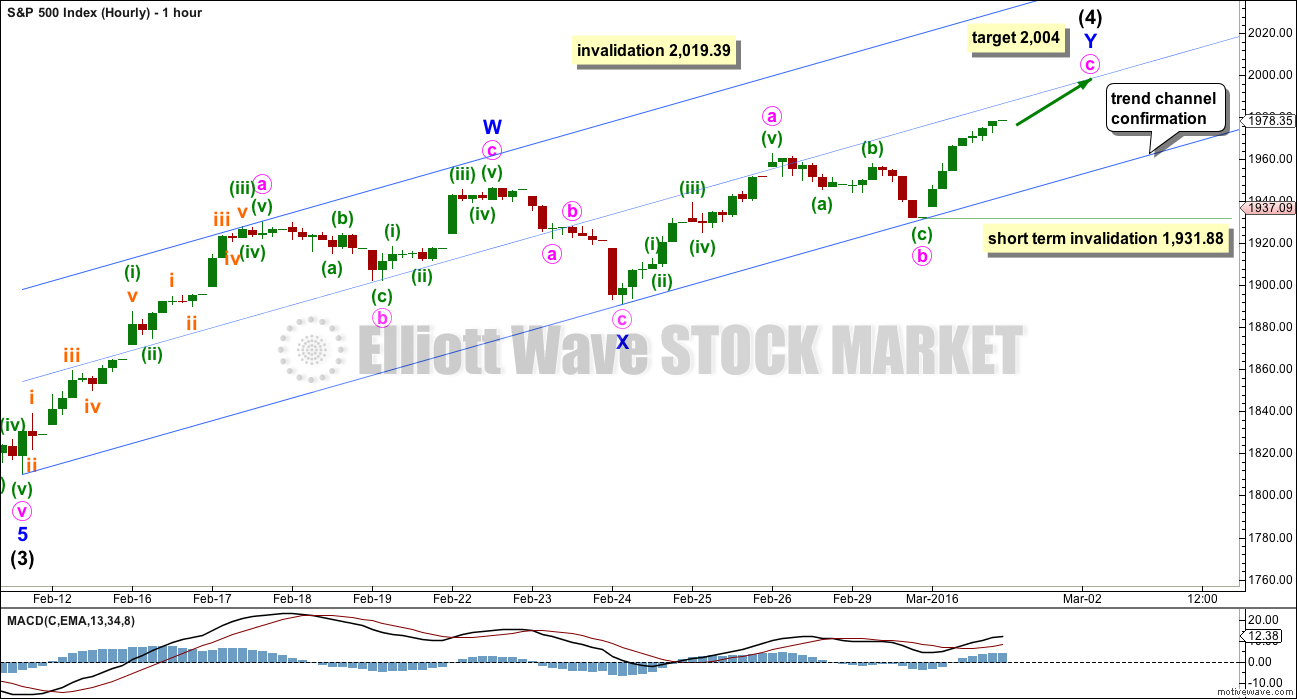
Both hourly charts are again the same. Comment will be with the preferred bear wave count.
DAILY CHART – COMBINATION
Click chart to enlarge.
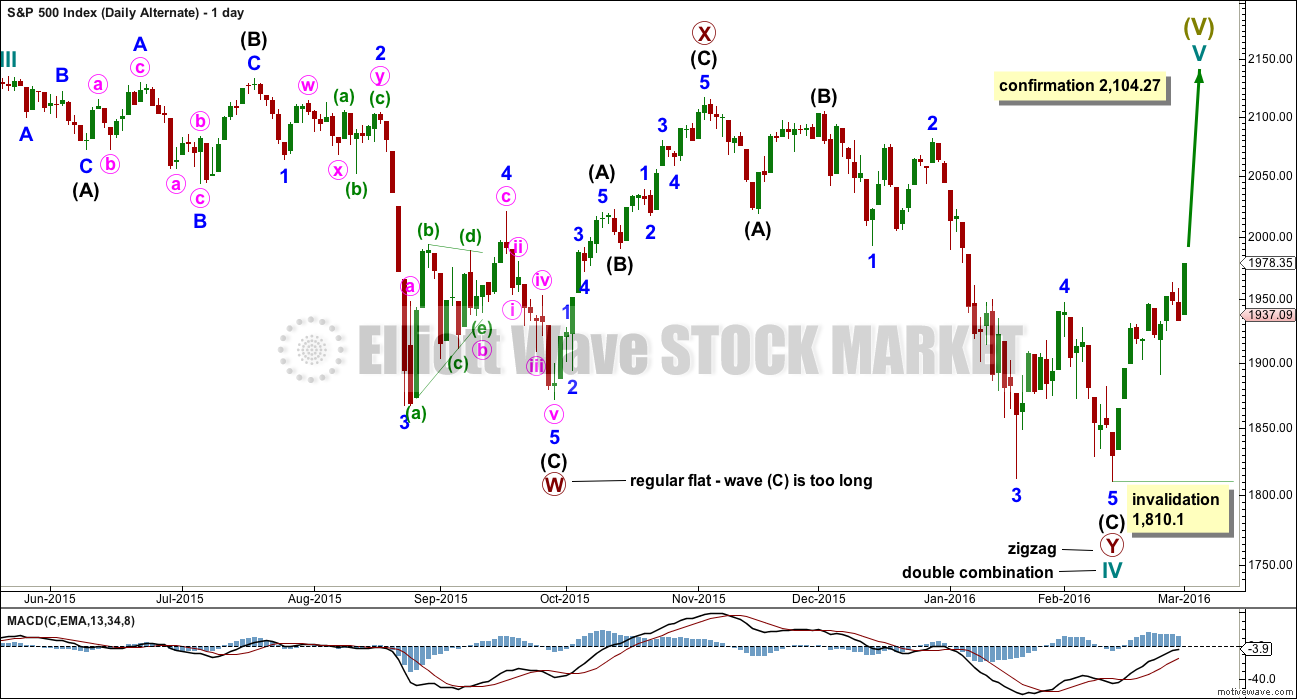
This idea is technically possible, but it does not have the right look. It is presented only to consider all possibilities.
If cycle wave IV is a combination, then the first structure may have been a flat correction. But within primary wave W, the type of flat is a regular flat because intermediate wave (B) is less than 105% of intermediate wave (A). Regular flats are sideways movements. Their C waves normally are about even in length with their A waves and normally end only a little beyond the end of the A wave. This possible regular flat has a C wave which ends well beyond the end of the A wave, which gives this possible flat correction a very atypical look.
If cycle wave IV is a combination, then the first structure must be seen as a flat, despite its problems. The second structure of primary wave Y can only be seen as a zigzag because it does not meet the rules for a flat correction.
If cycle wave IV is a combination, then it would be complete. The combination would be a flat – X – zigzag.
Within the new bull market of cycle wave V, no second wave correction may move beyond the start of its first wave below 1,810.10.
I do not have any confidence in this wave count. It should only be used if price confirms it by invalidating all other options above 2,104.27.
BEAR ELLIOTT WAVE COUNT
DAILY CHART
Click chart to enlarge.
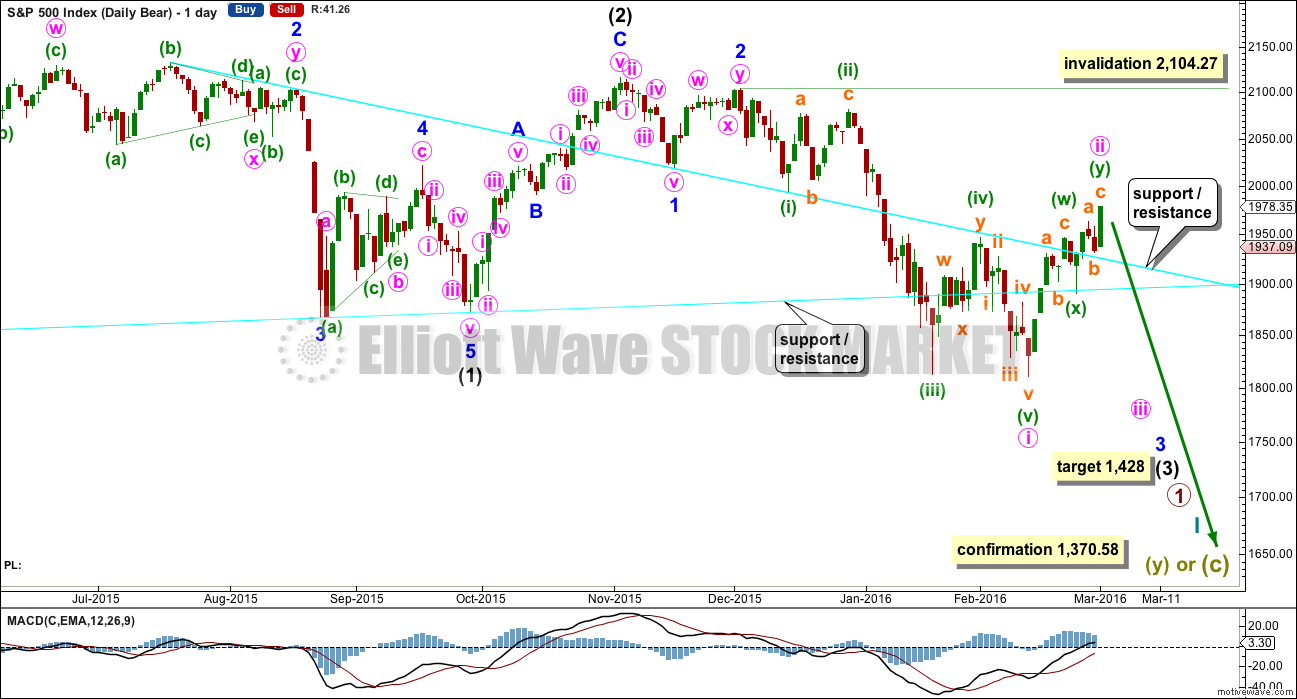
This bear wave count fits better than the bull with the even larger picture, super cycle analysis found here. It is also well supported by regular technical analysis at the monthly chart level.
Importantly, there is no lower invalidation point for this wave count. That means there is no lower limit to this bear market.
Downwards movement so far within January still looks like a third wave. This third wave for intermediate wave (3) still has a long way to go. It has to move far enough below the price territory of intermediate wave (1), which has its extreme at 1,867.01, to allow room for a following fourth wave correction to unfold which must remain below intermediate wave (1) price territory.
Intermediate wave (2) was a very deep 0.93 zigzag. Because intermediate wave (2) was so deep the best Fibonacci ratio to apply for the target of intermediate wave (3) is 2.618 which gives a target at 1,428. If intermediate wave (3) ends below this target, then the degree of labelling within this downwards movement may be moved up one degree; this may be primary wave 3 now unfolding and in its early stages.
Intermediate wave (2) lasted 25 sessions (not a Fibonacci number) and minor wave 2 lasted 11 sessions (not a Fibonacci number).
Minute wave ii has now lasted 12 sessions, one longer than minor wave 2. This still allows the wave count to have the right look even though it is not longer perfect. If it continues for one more day, it may end with a total Fibonacci 13 daily candlesticks.
Minute wave ii may not move beyond the start of minute wave i above 2,104.27.
HOURLY CHART
Click chart to enlarge.
A single zigzag was invalidated for this correction. Price continued higher as a double zigzag.
At 2,004 subminuette wave c within the second zigzag would reach equality in length with subminuette wave a.
Within subminuette wave c, no second wave correction may move beyond the start of its first wave below 1,931.88.
When the trend channel about this correction is clearly breached by at least one full hourly candlestick below and not touching the lower trend line, that shall indicate the correction may be over. A new low below 1,931.88 could not be a second wave correction within subminuette wave c, so at that stage subminuette wave c would have to be over. A new low below 1,931.88 would provide price confirmation of a trend change.
At that stage, the only way that the correction could continue would be a very rare triple zigzag. The rarity of triples (I have only ever seen three) means the probability of more upwards movement at that stage would be very low indeed.
It must be accepted that price may continue to rise while price remains within the channel.
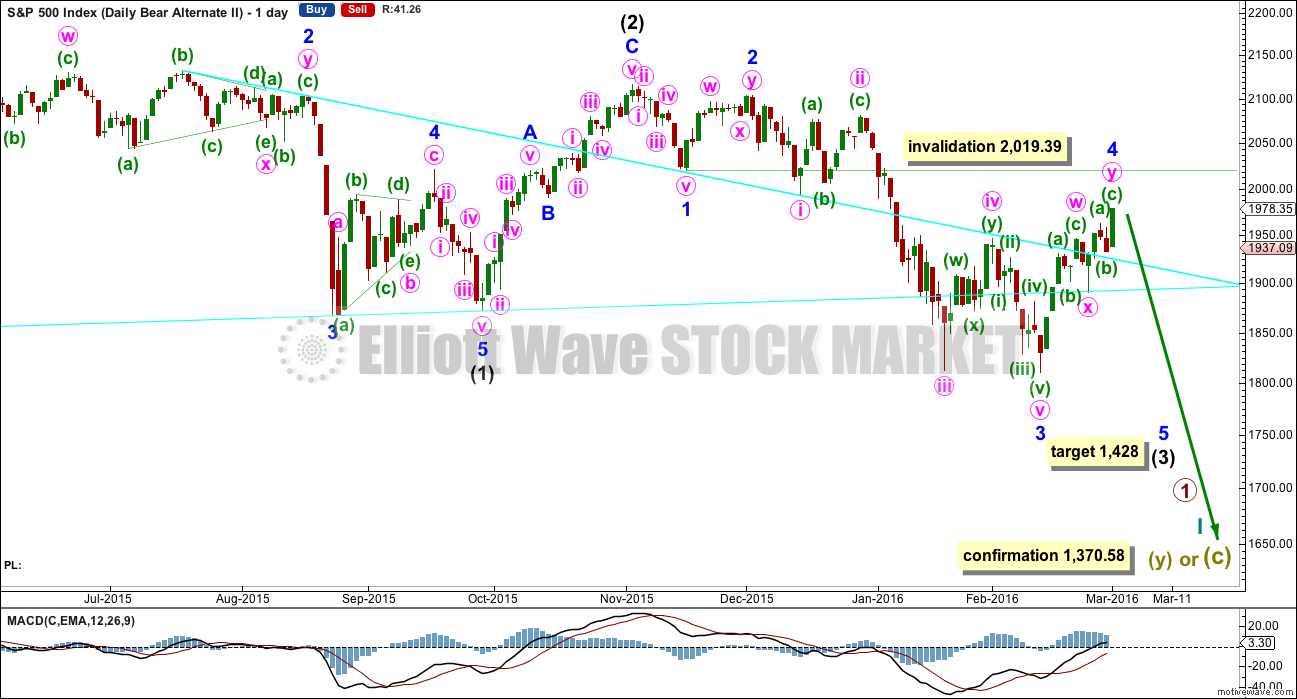
ALTERNATE DAILY CHART
Click chart to enlarge.
I have previously noted this idea in the text and now it is time to chart it, so that the implications are clear.
Within the downwards impulse unfolding, it may be that intermediate waves (1) and (2) are complete and now minor waves 1, 2 and 3 may also be complete within intermediate wave (3).
This wave count expects minor wave 5 to be extended within intermediate wave (3). Minor wave 5 should also show a strong increase in momentum, so that at its end intermediate wave (3) has clearly stronger momentum than intermediate wave (1).
There is no difference to the target for intermediate wave (3). This wave count makes a difference to the invalidation point. Minor wave 4 may not move into minor wave 1 price territory above 2,019.39.
This wave count also has a lower probability than the main bear wave count. This wave count would be more typical of commodities than the S&P.
Minor wave 2 lasted 11 days. So far minor wave 4 has lasted 12 days and it may be incomplete.
TECHNICAL ANALYSIS
DAILY CHART
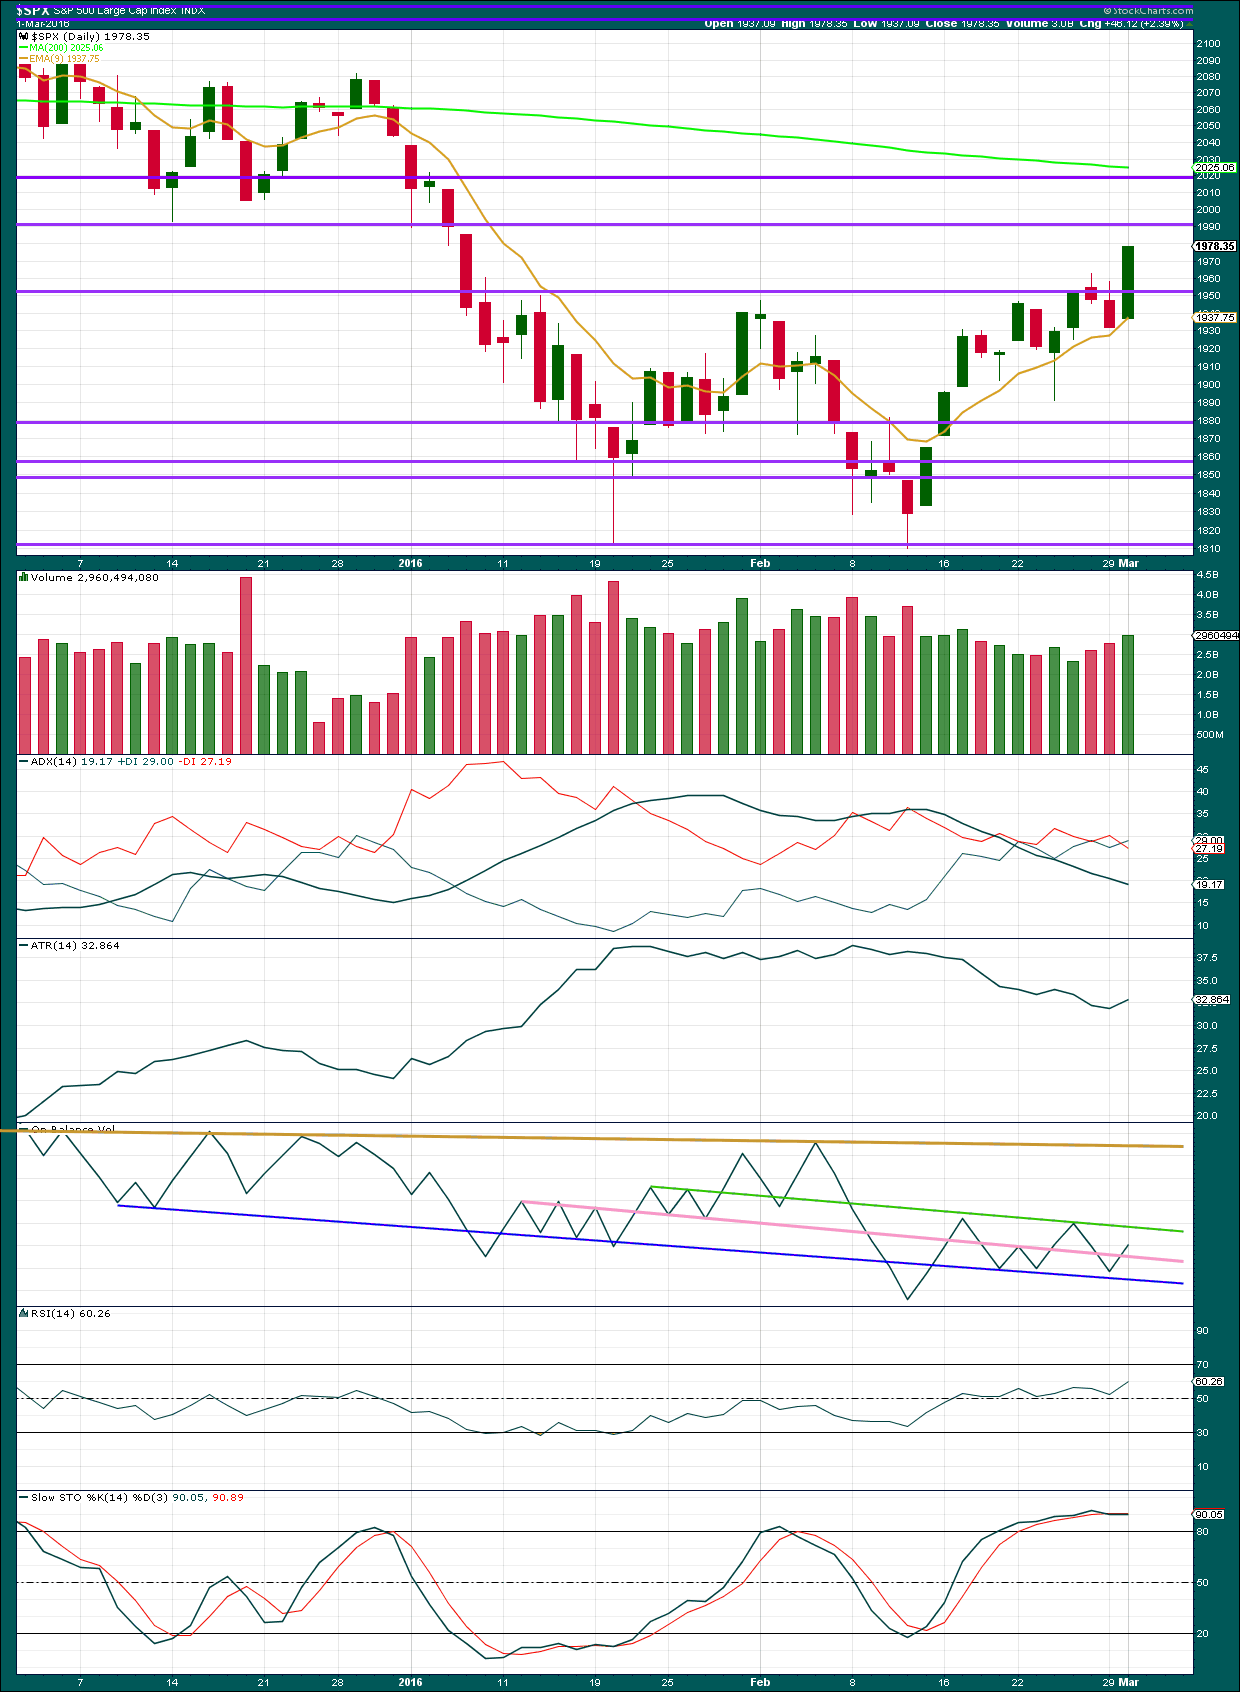
Click chart to enlarge. Chart courtesy of StockCharts.com.
Volume data for today on StockCharts is suspicious. This volume is not the same as that given from NYSE, the home of this index. Therefore, I will go with source data from NYSE.
Price moved higher today on lighter volume (as per NYSE). The rise in price was not supported by volume, so is suspicious. The prior fall in price for two days in a row came with an increase in volume. The volume profile is bearish.
ADX is still clear and indicates this market is not trending; it is consolidating. ADX is a lagging indicator as it is based on a 14 day average. With 12 days of overall upwards movement now, if the market is in a new upwards trend, then ADX should have caught up. Today the +DX line crossed over the -DX line. If the black ADX line turns upwards, it shall then indicate a new upwards trend. That has not happened.
ATR is still overall in agreement. It is flat to declining overall. This indicates the market is consolidating.
On Balance Volume breached the pink trend line today. It may find strong resistance at the green line. This may assist to hold the bounce down tomorrow.
This bounce has returned RSI to above neutral allowing plenty of room for price to fall. There is no divergence with RSI and price.
There is slight divergence today with Stochastics and price, but I have learned to give this a light weighting as it is not very reliable. This is a very weak bearish signal.
DOW THEORY
For the bear wave count I am waiting for Dow Theory to confirm a market crash. I am choosing to use the S&P500, Dow Industrials, Dow Transportation, Nasdaq and I’ll add the Russell 2000 index. Major swing lows are noted below. So far the Industrials, Transportation and Russell 2000 have made new major swing lows. None of these indices have made new highs.
I am aware that this approach is extremely conservative. Original Dow Theory has already confirmed a major trend change as both the industrials and transportation indexes have made new major lows.
At this stage, if the S&P500 and Nasdaq also make new major swing lows, then my modified Dow Theory would confirm a major new bear market. At that stage, my only wave count would be the bear wave count.
The lows below are from October 2014. These lows were the last secondary correction within the primary trend which was the bull market from 2009.
These lows must be breached by a daily close below each point. So far the S&P has made a new low below 1,821.61, but it has not closed below 1,821.61.
S&P500: 1,821.61
Nasdaq: 4,117.84
DJT: 7,700.49 – this price point was breached.
DJIA: 15,855.12 – this price point was breached.
Russell 2000: 1,343.51 – this price point was breached.
This analysis is published @ 10:27 p.m. EST.
A bit Higher today on the lowest volume of the week.
680 million on S&P?
676.9 Million is what I show.
680.82 from NYSE
Yep. Looks like the final fifth wave may be extending.
Still divergence with price and MACD on the hourly.
I’ll be using the NYSE volume data again today. Why am I subscribing to StockCharts if their volume data isn’t reliable? The entire reason in making that subscription was for their volume data.
Up and Up we go. Where we stop, nobody knows.
Somebody made a power trade of buying 135,000 SPY June 194 puts and selling 90K June 184 puts and 45K 182 puts with a debit spread cost outlay of 45 million in pure option premium. At least one heavyweight expects us to retest the lows. At or below 182 at expiration they walk away with over 100 million.
We have not heard from Olga today. That must have been her!
Now that you mention it…! Boy has she been busy!! 🙂
ps. Should we demand a cut of the action for being her buddies?
Here is what I have so far on the five minute chart.
This could be subminuette c complete, or it could be just wave 1 within subminuette c.
This is why 1,931.88 will be important. A channel breach is also important for earliest confirmation of a trend change.
The move up now has a three wave look to it on the hourly chart. But on the five minute chart it subdivides neatly as a completed five. The fourth wave is much longer in duration than the first. Sometimes the S&P does that, the proportions just aren’t always neat.
If micro 5 is continuing as an ending diagonal then there would be a nice small throw-over of the 1-3 trend line right now….
but again, this could still be a first wave completing, not the whole of subminuette c.
MACD now extremely overbought. An impulse up continuing would be a very bullish surprise I think… 🙂
On what time scale are you basing this judgment. I don’t think I’d use the word ‘extreme’. MACD on the daily charts is in positive territory around 11. At the beginning of November 2015, MACD on the daily chart registered readings over 30. It can become much more extreme than it is now. I don’t know if it will get that high this time. It is pointing up. The histogram has not peaked. Well, just my thoughts on MACD. I am thinking we may have a ways to go to the upside yet. Price is the ruler of indicators, however. It will tip its hand.
I don’t think I want to enter a position on the wedge breakout. I am willing to wait for a return to the wedge before I take a position and it will be a short position only. There is no way I would want to be long anything now, at least in equities.
Five minute chart before the end of the registered it is fantastic , thank you very much Lara. This gives a tool to think for tomorrow.
No worries, but please do always take the 5 min chart analysis with the strong caveat that it changes as the market unfolds.
I really only analyse it to see if its possible for a structure to be complete.
It is clear that the sun as well as
After the Fed beige book released at 2PM + recent data…. I still believe the Fed will Raise the Fed Funds Rate this month of March. They must normalize FF Rate no matter what kind of tantrum the little market babies throw.
Thomas,
I am putting this comment here because I want to make sure you see my comment below regarding my comments at 10:00 AM this morning. If that isn’t confusing!!
Summarized – Don’t put any weight / credence on my commentary.
I appreciate you sharing your market analysis and have learned from you today and in previous posts. I was just trying to complement you earlier. Hope I didn’t offend you. I have a trading plan and am sticking to it. I will not put any weight / credence on your commentary.
No No No. No offense Thomas, none at all. I am tickled with your compliment. Thank you very much. You are very kind.
By the way, with this wedge forming, we may not make it to 2000.
O.K. Momma Grizzly. Let’s have some SPX 1931.81 for lunch shall we? I’d even settle for a hearty breakfast platter of the same served up with diced bull and eggs…!! 🙂 🙂 🙂
You make me laugh. Thanks
I am seeing an upward sloping wedge develop on the hourly chart starting at 1810 with the apex not to far away. This is a very bearish and terminal chart pattern. It can be difficult to trade though because wedges are notorious for false breakouts. Mr. & Mrs. Market never make it easy. But a break out and return is another good trade often. Nothing is always.
I’d love to hear from any point and figure chartist on the forum.
Yep. A false breakout in this case would be a sharp move to the upside which is th en immediately reversed to the downside. That is exactly what I think we are going to get sooner or later, hopefully tomorrow. I picked up a few SPY 199 strike calls expiring this week in anticipation of just such a move. Should get a good 20% pop.
Hi Ris:
Looks like PCLN starting to crack. I like to cash in my option trades when they double so don’t forget to take profits early and often! 🙂
Vern,
Agree, I made that mistake last week as my position on PLCN was in profit of over $30k but I was expecting it to breakdown. However, I have some time on my position so will wait as this one has wild swings often.
Yep! Boy did I learn that lesson the hard way. As soon as I can continue the position with house money I scoop my original investment capital off the table, even if I stay in the trade. It also allows you to use the winnings to boost your cost basis on the inevitable pullbacks that occur even in winning trades. Live and learn huh? 🙂
By “boost” I of course mean “lower”…. 🙂
Well folks, we got that poke into the green. It looks to me like we are getting ready to head South and in a big way. Doji on Deck!! 🙂
I would have preferred a bullish engulfing candle as it would indicate the trap had been successfully sprung but apparently not enough fish are biting. Oh well! A doji is a doji is a doji….
ps All the folk that piled in yesterday ought to be getting nervous just about now…. 🙂
Absence of follow through from yesterday’s manic run very bearish. If the market is trying to print a doji today it needs to at least temporarily poke its head into green territory…
When the next wave down begins it should be impulsive… am I correct?
Waterfall!! A real key is going to be how it handles 1900 and 16000 in SPX and DJI. If they are blown out, I will move heavy trades to the short term time frame to capture the carnage…
I am fairly confident that UVXY is basing in the 28 to 32 area. Here is how I plan to capture the sweet spot of the move on the next capitulation spike which can see as much as a 30% intra-day pop at its height. You ordinarily have to be watching it like a hawk and execute the trade intra-day to get out at the top after it blows past the upper B band. I am entering a contingency order on one block, and a trailing stop order on the other. I expect UVXY to exceed its recent spike high in August at around 90 so the contingent order says sell when UVXY trades above 90. The other block will be sold when a trailing stop of ten points is triggered. A ten point decline is almost certain to happen ONLY after an intra-day spike or close to it. This is a conservative approach and I suspect these orders will be triggered well before the third wave down is done but will allow capture of nice profits and a reload of the trade with house money. As Rodney sagely points out, you don’t have to wait for the absolute top to get positioned but can instead scale into your trades in third or quarter blocks and lower your cost basis if and as the market continues up toward an eventual reversal. My assumption is that you agree with Lara’s analysis that we are in a down-trend. Good luck traders! 🙂
Thanks for the strategy and the clarity of explaining it which is vital. Now I know I must find a brokerage house permitting trailing stops and contingency orders. I could set it up and go on vacation for however long I like.
Now yer’ talking. The lazy man’s way to profit in the markets!
But seriously, some of the very best trades I have made have been structured in the exact way I described. Takes a lot of stress off… 🙂
BTW, I have learned that most traders DO NOT share their best strategies as they view other traders as the competition. You will NEVER read this stuff in any trading manual. Some of you have commented on my willingness to be generous about my own strategies. It is because of the high regard I hold for Lara and my interest in helping her members sharpen their skills if I can. ‘Nuff said! 🙂
That really is fabulous. Thank you so much for your generosity!
If any members here are less experienced, read Verne’s comment a few times, slowly. It has some excellent strategy, outlined in detail. Try to get the concept of what he’s doing.
Doesn’t mean we have to do the same, but the idea / approach is powerful.
At 10:30AM or shortly after Oil prices may begin it’s next move down as the second set of inventory information is released. Last night API reported a 9.9 million barrel increase more than the expected 3.6 million forecast.
SO in 7 min. we know the US Govt (Energy Agency) weekly data.
Also, with the ADP jobs number this morning & other recent data, the Fed IMO will raise the Fed Funds Rate in March! If they are data dependent, they must or have no remaining credibility. Now I know people don’t believe the data… if the Fed doesn’t raise, it proves that view of the data.
WTI just went from down 0.12 to down 0.53 after it was released.
10.4 million increase… much more than expected. 3 times what was expected.
Highest weekly gain since April 2015
WTI now down 0.73 or 2.12%
positive now
That makes no sense… Oil will be going sub $20 in order to clear out that inventory and it will take 18 to 24 months to accomplish.
Completely agree storage could be filled by summer,what’s going happen then? ???
Joseph,
Bang on with FED credibility comment and that is the biggest risk for this market. If they are don’t act on the data, data will be considered as lagging or suspect. This is going to be a nasty problem for FED as they are in fact behind the curve on the interest rates.
Stockman thinks that when the feuding at the FED over policy spills into the public domain, as it is certain to eventually, it will spook the markets and act as a catalyst for the next plunge; he is a very insightful guy and the theory is very interesting to say the least…
Good morning, Good day to all.
The bear market should resume with a vengeance very soon. Why do I say that? i say it because Bloomberg news announced today that we are all safe and should be invested. They note that the market is almost back where it started for the year. It has erased almost all the losses of January. Hooray. Happy times are just around the corner.
Finally the mood has changed from one of fear and gloom to one of greed and optimism. The third wave down can now be introduced by Mr. & Mrs. Market and sustain a waterfall. The fear greed Index starts today at 65. The higher the number the more greed and lower for fear. One month ago it was at 27!
MACD on the daily chart is in positive territory. When I first mentioned it some weeks ago it was about -47. Now it is at a +10.
It looks to me like this wave 2 correction has done its job well. Personally, I am salivating at all the good deals on the boards. TVIX was at 13.6 just a couple of days ago. Now it is being sold for a measly 7.3, half price fire sale. In the upcoming 3rd wave, it could move over 20 which is the September 2015 high. SQQQ was at 29 just a few days ago. now it is at 21. That is a day after Christmas sale of 33% off. In September 2015 SQQQ had a spike up to 44!
I do not think I will wait for 1931 price confirmation to purchase my first set of shorts (1/3 of planned total). As Vernecarty has told us, the round number levels often act as support and resistance. SPX 2000 is about as round as you can get. My second third of shorts will come on a price confirmation of 1931. The third set will come on a break of 1890.
Good luck and I hope everyone has a great day.
By the way Lara, you go surfing to help relax and unwind. I go backpacking into the wilderness. I am currently planning a trek into Hell’s Canyon on the border of Oregon and Idaho in the western states. It is aptly named because of the summer temps well over 110* F. There are rattle snakes, scorpions, and poison oak and ivy. Sounds just like trying to catch this third wave. it has been Hell’s Canyon for some. One must be prepared for what the wilderness / market throws at one. If you go into Hell’s Canyon unprepared and not knowing what you are doing, you could die! Same with trading accounts.
Rodney is ready to short this market again. This adds support to the bear wave count. :). Smart to phase into your position. Thanks for sharing!
I enjoy hiking as well, but my excursions are more like a casual stroll compared to your trips. There are some nice spots near my place with beautiful elevated views along the Niagara Escarpment.
I definitely warn you against using my thoughts and strategies much less lending support to any market analysis or even wave. I won’t use all caps to shout. But take this as a pleasant shout.
Also, I have been bearish all along and continue to be bearish. I’ve waited many years for this and I am not going to miss it. I’ve had many false start losses because of greed and/or fear. But it is now upon us. This bear market has a very long way to go on the downside and I will not rush it. Thus, my strategy; channel confirmation then price confirmation twice.
My trek is scheduled for the end of April, market permitting. I should experience relatively mild temperatures from 85* F during the day and 45*F at night. As always I bring mt trusted companion, my yellow Labrador Retriever, named Hunter. I send him in front of me as we hike as a sort of warning system to clear the trail. Better he get bit than me! Right? Any animal rights people here? (all in good fun) I do love Hunter.
Crikey. Your hiking sounds positively dangerous! And absolutely fabulous.
Gotta love nature. It soothes our souls.
Thank you for sharing your strategy Rodney. It looks to be well thought out and a sound strategy to add to your position at logical points. Nice.
Have a great hike Rodney! Watch out for the cobras! (Nothing a trusty walking stick cannot dispatch with!) 🙂
Again, keeping the big picture in mind, here is a useful chart by Sam Collins outlining the areas in which we can reasonably expect to see the down-trend resume. Have a great (and calm!) day everyone! 🙂
Thanks for the chart! Looks like we are close to a reversal.
Anytime! Market gathering strength for one more push to the upside. I would really like to see a bearish engulfing candle this week. It would signal that the big boys on the sidelines have returned to work.
We will probably have at least one more day of upward movement. Look out of another upward spike if we are in a higher degree correction- it could go higher than we are expecting and really rattle even the most committed bears. I am keeping a close eye on UVXY (a hammer bottom)and expect an outside reversal day to signal an end to the move up…. 🙂
I was under the impression that drop in volatility when the market has been in dropping indicates a likely bottom. Based on yesterday’s market action, we saw market continuing to go up and drop in volatility. It appears to me that quite a few bears bailed out into the close yesterday.
Is it safe to consider the possibility that given the overall downtrend market, drop in volatility in a correctional bounce might be a leading indicator for a top or close to the top?
Yep. The action in UVXY is classic for a second wave move up, usually of higher than minute degree though. If it takes out the January low, that would be for me pretty strong confirmation this is a higher than minute degree second wave, so under the minute two scenario it really does not have a lot of room to move much lower.
Is it unusual for a second wave of lower degree to be larger than one of higher degree? I am of course looking at minute two and comparing it with minor two. In my experience, the action in UVXY may also be signaling a second wave correction of higher degree. Just thinking out loud here. Clearly it would affect how high the correction could continue.
For the S&P no, this is not unusual at all.
It just does not have perfect proportions always.
In that third wave example I posted a couple of days ago all the second waves have perfect proportion, but the fourth waves don’t. There are lower degree fourth waves which were longer than higher degree fourth waves; minuette (iv) at 16 days, minute iv at 10 days and minor 4 at 7 days. While you could understand the length of minuette (iv) (it was a triangle) both minute iv and minor 4 were zigzags but minor 4 was clearly more brief.
However… there is the alternate wave count which sees this as minor 4 ending shortly. That could explain the duration.
Maybe the S&P is about to behave like a commodity?
Depending on what happens in the next day or so… I am thinking I may set an order to open a short slightly below 1,931.88.
My reasoning is that if price breaks below that point it is most unlikely to be a continuation of this bounce. It should be the next wave down. And I’d rather open my position with price confirmation than any other kind of confirmation.
And so I must wait patiently.
It’s an onshore mess here today so no surf for me for a few days 🙁 Monday is looking possible….
That looks like a great entry point. Thanks for sharing. 🙂
Too bad about the surf. I haven’t tried surfing but would like to. The ocean is far away from Toronto, Canada. We got a good dump of snow overnight, so some skiing for me today.
Feel like a nutshell raging sea. Perhaps I am a merchant from the day turn from logic says …. just …
“Tempest in a teacup”? 🙂
My wife has a shirt that says “Keep calm and study”. I think we should get one that says “Keep calm and trade your plan”. 🙂
This is my ideal setup here. We have around a 60% re-tracement of a probable wave 1 decline. I like to initiate the trade at this point and place a stop at the beginning of wave 1. I added to my short position on SPX at the end of today. When I get stopped out on a trade with this setup, and I did with the FTSE this week, I deal with it by rewarding myself for sticking to my plan. That helps me change how I think about losses. It is my job to execute my plan.
Trading can be stressful, so here are some tips to reduce that stress that have worked for me. Don’t watch the market during the day unless you are a short term trader. Instead hit the gym and get some exercise. Check out the book “Body by Science”. This method delivers exceptional results with one trip to the gym per week. Another thing that I do is use hypnosis apps to relax. Check out Joseph Clough’s (JC) 15 minute deep relaxation session for free. I know, this sounds weird, but this stuff works! Most people think the Elliott Wave Principle is weird, but we know it works.
Take care and trade safe!
There is good reason that analysts are shielded from their customers. How incredibly lucky we are (imho) that we not only have direct access to our analyst but she is not swayed by our noise and (sometimes) petty disagreements.
Personally I do not underestimate how difficult that is to achieve.
I do not want to dwell on the subject so this is the last time I will comment on it.
I get slightly annoyed sometimes, and I think I’m too laid back sometimes, but generally I’m not often swayed. *Edit: my analysis is almost never swayed, but my trading… has been twice now. To my detriment. Lesson learned.
I have my rules, my notebook and my plan. And if I get too annoyed I go surfing 🙂
I do put a lot of weight on what yourself and Verne say about your trades; where you put your stops and where you enter your positions. I watch what you’re doing and try to learn from it.
So thank you. You are both much more experienced traders than I am and I am learning from you.
Keep up the good work lara. You can really sense the emotions here at times, manage your risk correctly and you won’t have any issues or worries.
I sense the time is coming, crude showing weakness,I expect imo a breakout on gold very shortly, imo everything is lining up together.i would be interested on how the option markets are looking any divvy there at all?good luck everyone.
Traders who do what you outline clearly take occasional losses even when sticking with their plan. The big difference is that staying disciplined and consistent will over time give you more wins than losses when compared to those who make random trades based on emotion or what the market is doing on any particular day. Thanks for sharing your approach.
Where’s the doc?
Lagging 🙂