
Downwards movement was expected as most likely. This is what happened.
However, downwards movement has not yet passed the confirmation point below which confidence may be had in the Elliott wave count.
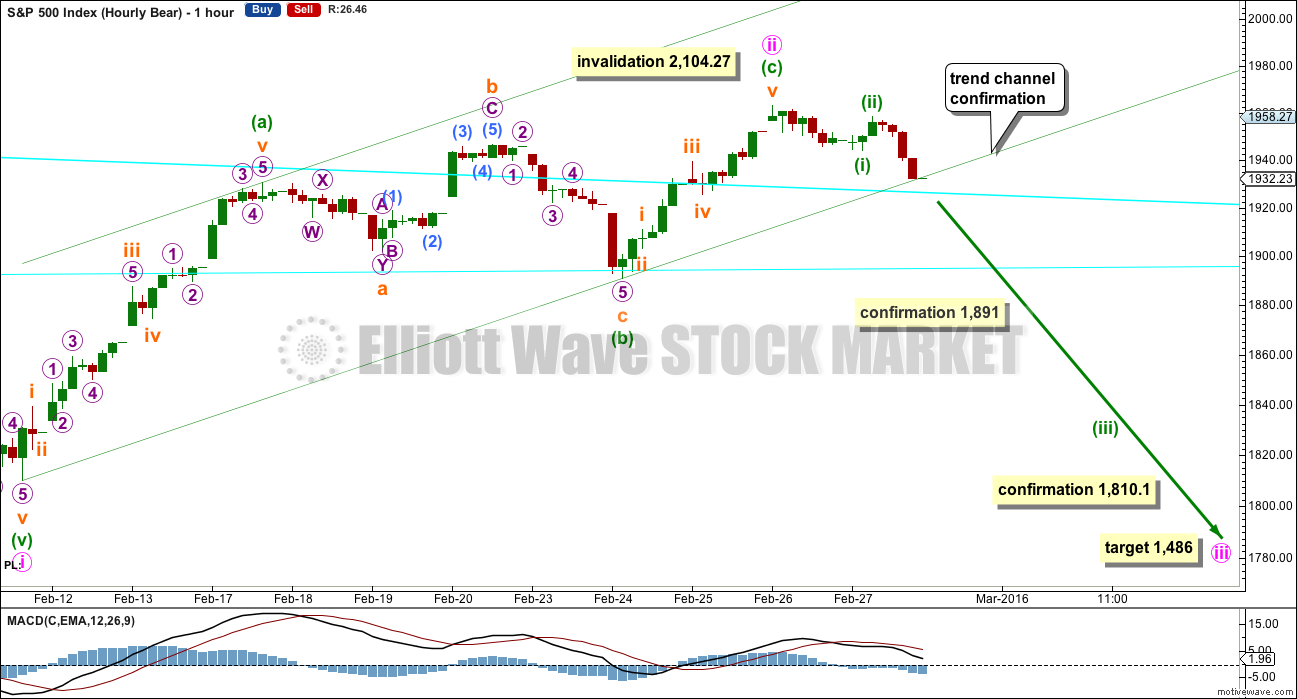
Summary: More downwards movement is still most likely from here, but the end of the Dead Cat Bounce is still unconfirmed. A new low below 1,891 and below the channel on the hourly chart would provide confidence the bounce is over. The invalidation point for the preferred wave count remains at 2,104.27. A big third wave should still be approaching, so look out for surprises to the downside.
To see how each of the bull and bear wave counts fit within a larger time frame see the Grand Supercycle Analysis.
To see detail of the bull market from 2009 to the all time high on weekly charts, click here.
Last published monthly charts can be seen here.
If I was asked to pick a winner (which I am reluctant to do) I would say the bear wave count has a higher probability. It is better supported by regular technical analysis at the monthly chart level, it fits the Grand Supercycle analysis better, and it has overall the “right look”.
New updates to this analysis are in bold.
BULL ELLIOTT WAVE COUNT
DAILY CHART – FLAT
Click chart to enlarge.
This wave count is bullish at Super Cycle degree.
Cycle wave IV may not move into cycle wave I price territory below 1,370.58. If this bull wave count is invalidated by downwards movement, then the bear wave count shall be fully confirmed.
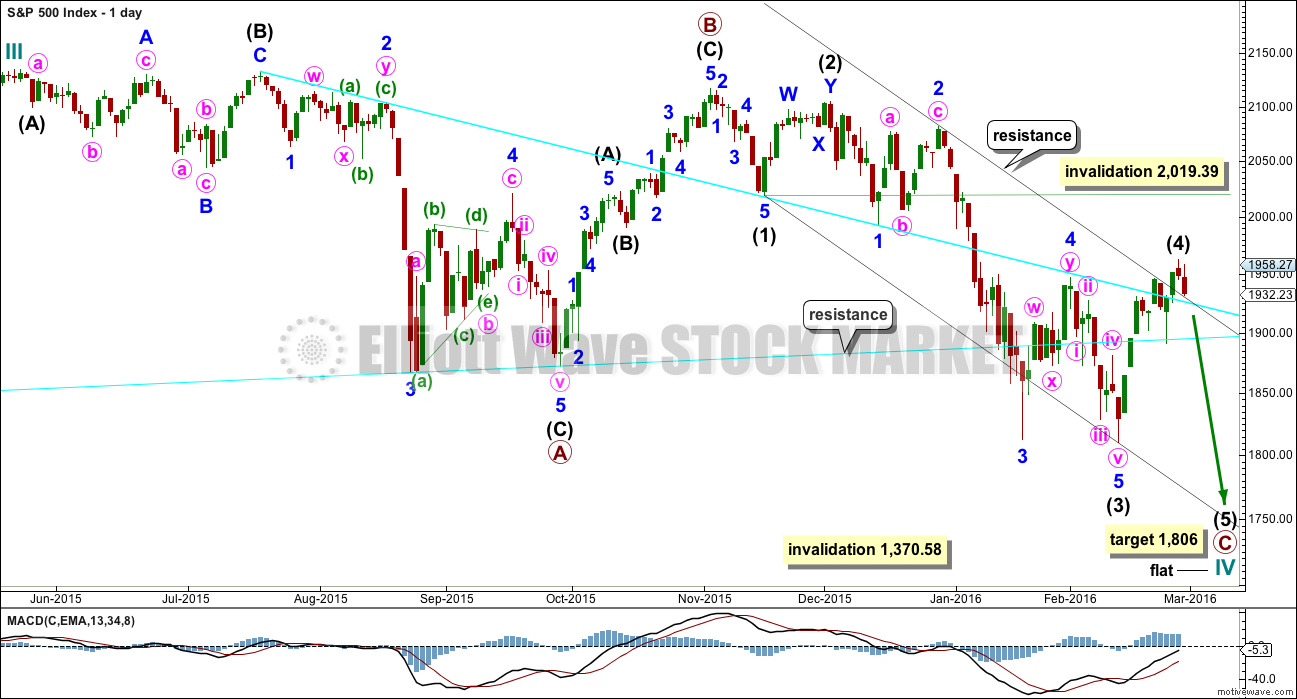
Cycle wave II was a shallow 0.41 zigzag lasting three months. Cycle wave IV should exhibit alternation in structure and maybe also alternation in depth. Cycle wave IV may be a flat, or combination. This first daily chart looks at a flat correction.
Cycle wave IV may end within the price range of the fourth wave of one lesser degree. Because of the good Fibonacci ratio for primary wave 3 and the perfect subdivisions within it, I am confident that primary wave 4 has its range from 1,730 to 1,647.
Primary wave C should subdivide as a five.
Within the new downwards wave of primary wave C, intermediate waves (1), (2) and now (3) may be complete. Intermediate wave (4) may now be over, finding resistance at the upper edge of the black channel. It is just within the fourth wave of one lesser degree still, which is a common place for a fourth wave to end.
Intermediate wave (2) was a deep double zigzag. Intermediate wave (4) may be a complete shallow 0.46 zigzag. There is alternation in depth and a little in structure.
At 1,806 intermediate wave (5) would reach 1.618 the length of intermediate wave (1). This would see intermediate wave (5) move below the end of intermediate wave (3) at 1,847 avoiding a truncation. Primary wave C would end below the end of primary wave A but not too far. Cycle wave IV would have a reasonable regular flat look.
The idea of a flat correction for cycle wave IV has the best look for the bull wave count. The structure would be nearly complete and at the monthly level cycle wave IV would be relatively in proportion to cycle wave II.
HOURLY CHART
Click chart to enlarge.
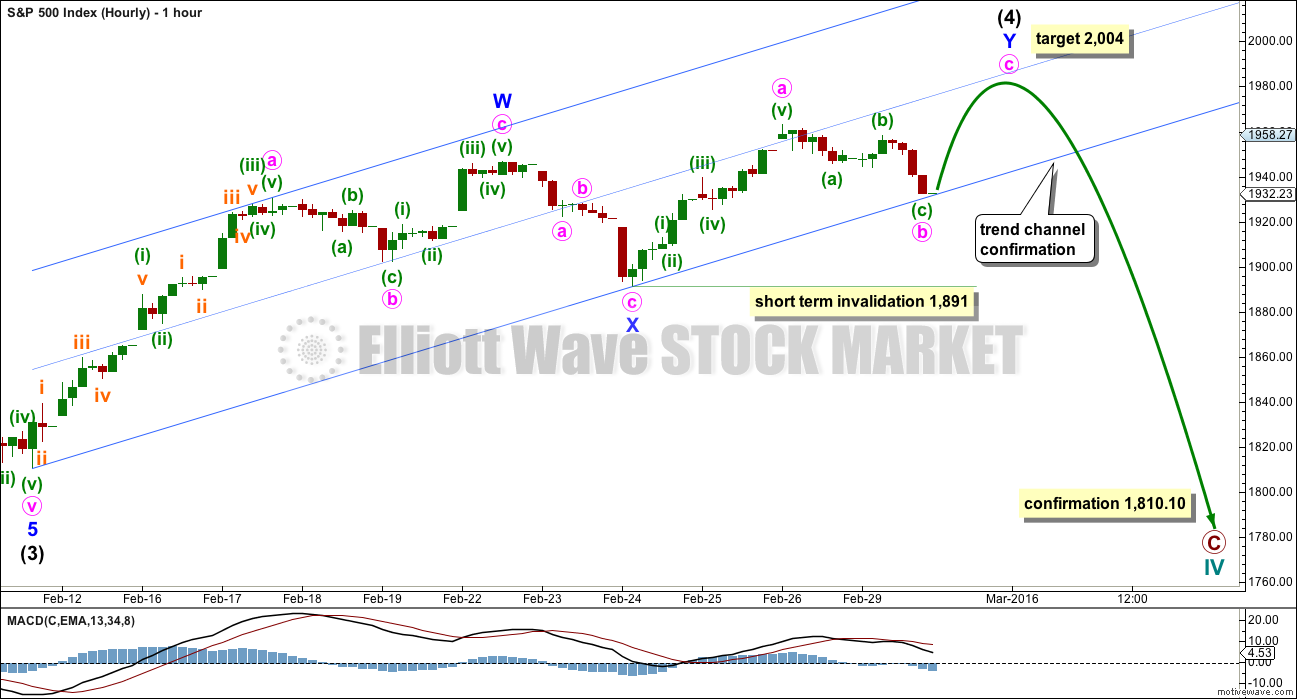
I will use the two hourly charts today, for bull and bear, to see this Dead Cat Bounce in two different ways.
Both ways of labelling this upwards movement work in the same way for both wave counts.
If the upwards movement is a double zigzag, then it may be incomplete. This first way of labelling the upwards wave of intermediate wave (4) (which is the same as minute ii for the bear) looks best if the structure is incomplete.
At 2,004 minute wave c within minor wave Y would reach equality in length with minute wave a.
If the channel is breached by downwards movement, at least one full hourly candlestick below the lower blue trend line and not touching it, then this idea may be discarded. If intermediate wave (4) is incomplete as a double zigzag, then price should remain in the channel while the structure completes.
Within the second zigzag in the double, minor wave Y, minute wave b may not move below the start of minute wave a at 1,891.
DAILY CHART – COMBINATION
Click chart to enlarge.
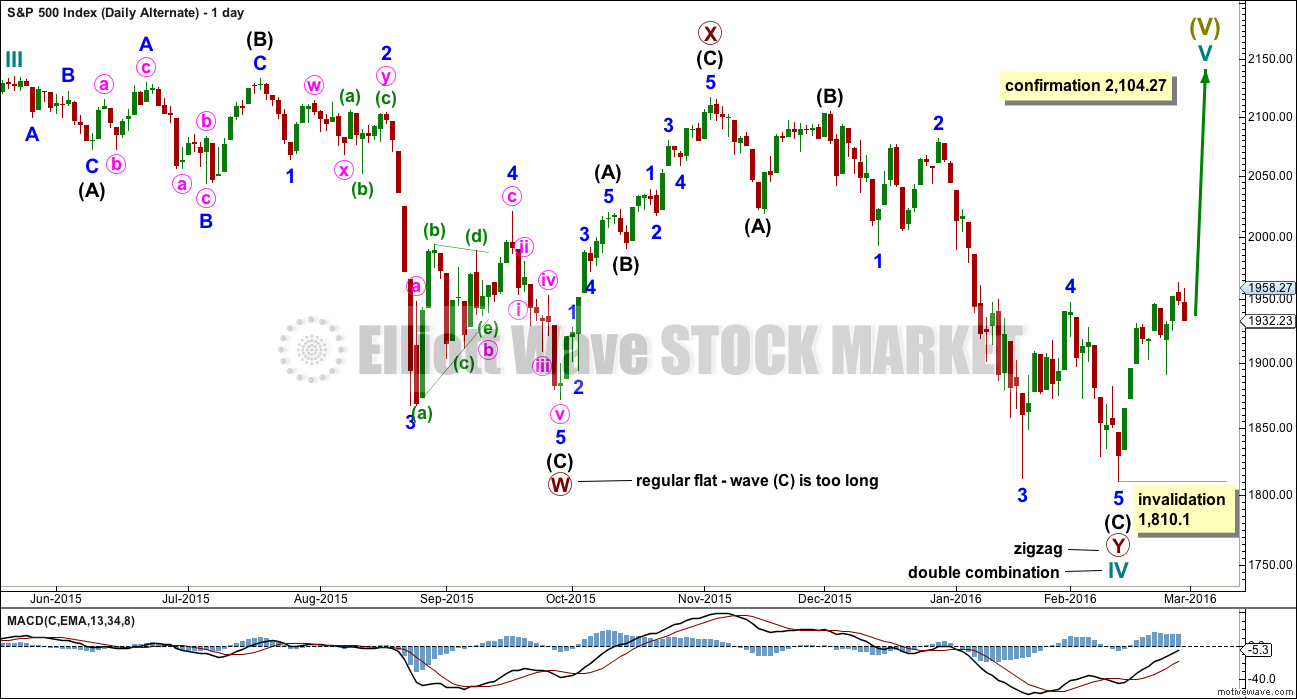
This idea is technically possible, but it does not have the right look. It is presented only to consider all possibilities.
If cycle wave IV is a combination, then the first structure may have been a flat correction. But within primary wave W, the type of flat is a regular flat because intermediate wave (B) is less than 105% of intermediate wave (A). Regular flats are sideways movements. Their C waves normally are about even in length with their A waves and normally end only a little beyond the end of the A wave. This possible regular flat has a C wave which ends well beyond the end of the A wave, which gives this possible flat correction a very atypical look.
If cycle wave IV is a combination, then the first structure must be seen as a flat, despite its problems. The second structure of primary wave Y can only be seen as a zigzag because it does not meet the rules for a flat correction.
If cycle wave IV is a combination, then it would be complete. The combination would be a flat – X – zigzag.
Within the new bull market of cycle wave V, no second wave correction may move beyond the start of its first wave below 1,810.10.
I do not have any confidence in this wave count. It should only be used if price confirms it by invalidating all other options above 2,104.27.
BEAR ELLIOTT WAVE COUNT
DAILY CHART
Click chart to enlarge.
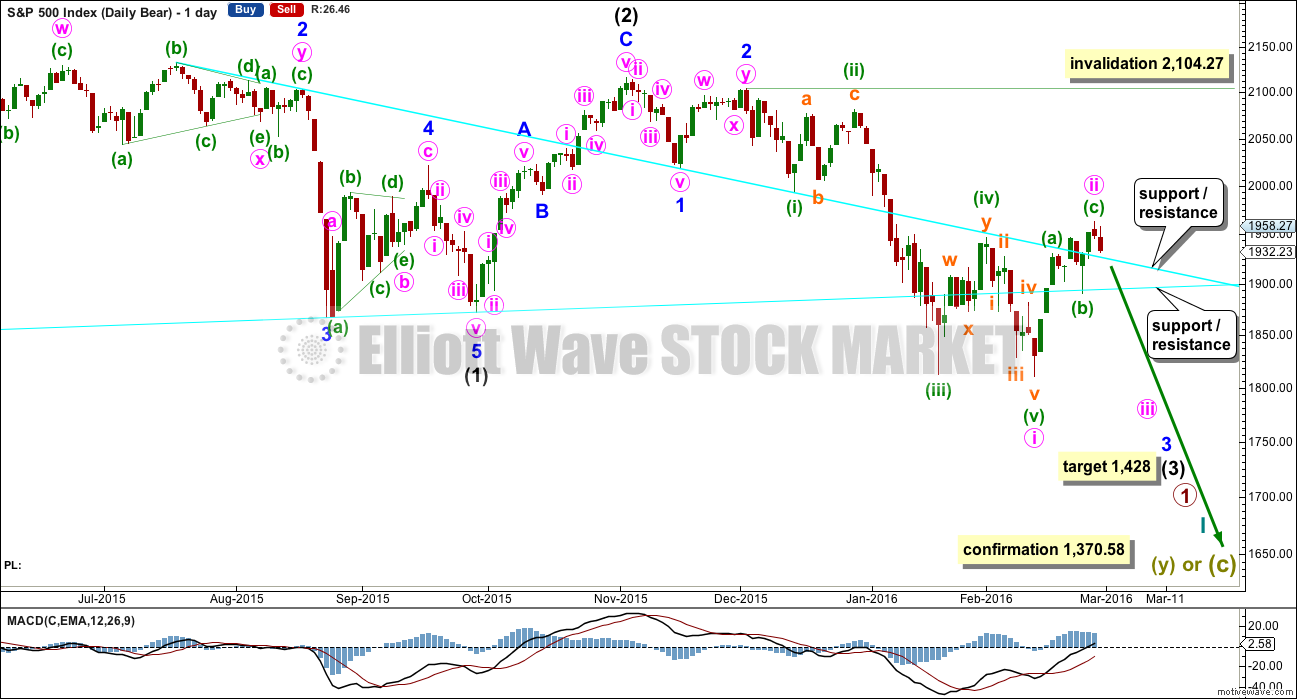
This bear wave count fits better than the bull with the even larger picture, super cycle analysis found here. It is also well supported by regular technical analysis at the monthly chart level.
Importantly, there is no lower invalidation point for this wave count. That means there is no lower limit to this bear market.
Downwards movement so far within January still looks like a third wave. This third wave for intermediate wave (3) still has a long way to go. It has to move far enough below the price territory of intermediate wave (1), which has its extreme at 1,867.01, to allow room for a following fourth wave correction to unfold which must remain below intermediate wave (1) price territory.
Intermediate wave (2) was a very deep 0.93 zigzag. Because intermediate wave (2) was so deep the best Fibonacci ratio to apply for the target of intermediate wave (3) is 2.618 which gives a target at 1,428. If intermediate wave (3) ends below this target, then the degree of labelling within this downwards movement may be moved up one degree; this may be primary wave 3 now unfolding and in its early stages.
Intermediate wave (2) lasted 25 sessions (not a Fibonacci number) and minor wave 2 lasted 11 sessions (not a Fibonacci number). Minute wave ii may now be complete in ten sessions (not a Fibonacci number). Although minute wave ii is seen as a double zigzag, which fits best on the hourly chart, it has a single zigzag look at the daily chart level. This mirrors the structure for minor wave 2 earlier on in November 2015. That correction looks like a single zigzag on the daily chart, but on the hourly chart it subdivides as a double zigzag with the second zigzag in the double very brief and short.
Minute wave ii may not move beyond the start of minute wave i above 2,104.27.
HOURLY CHART
Click chart to enlarge.
This is the other possible structure for the correction, a single zigzag.
This structure has a better look at both daily and hourly chart levels. Minuette wave (c) would be just 2.56 points short of 0.618 the length of minuette wave (a).
The channel is drawn in the same way for both hourly charts. If it is breached tomorrow by a full hourly candlestick below and not touching the lower edge, that would provide trend channel confirmation of a trend change.
Thereafter, a new low below 1,891 would provide price confirmation. At that stage, the idea presented in the first hourly chart with the bull wave count would be invalidated.
Further confidence that the bounce is over would come with a new low below 1,810.10.
At 1,486 minute wave iii would reach 1.618 the length of minute wave i.
The cyan trend lines are copied over from the daily chart. They may still provide support and then resistance along the way down.
ALTERNATE DAILY CHART
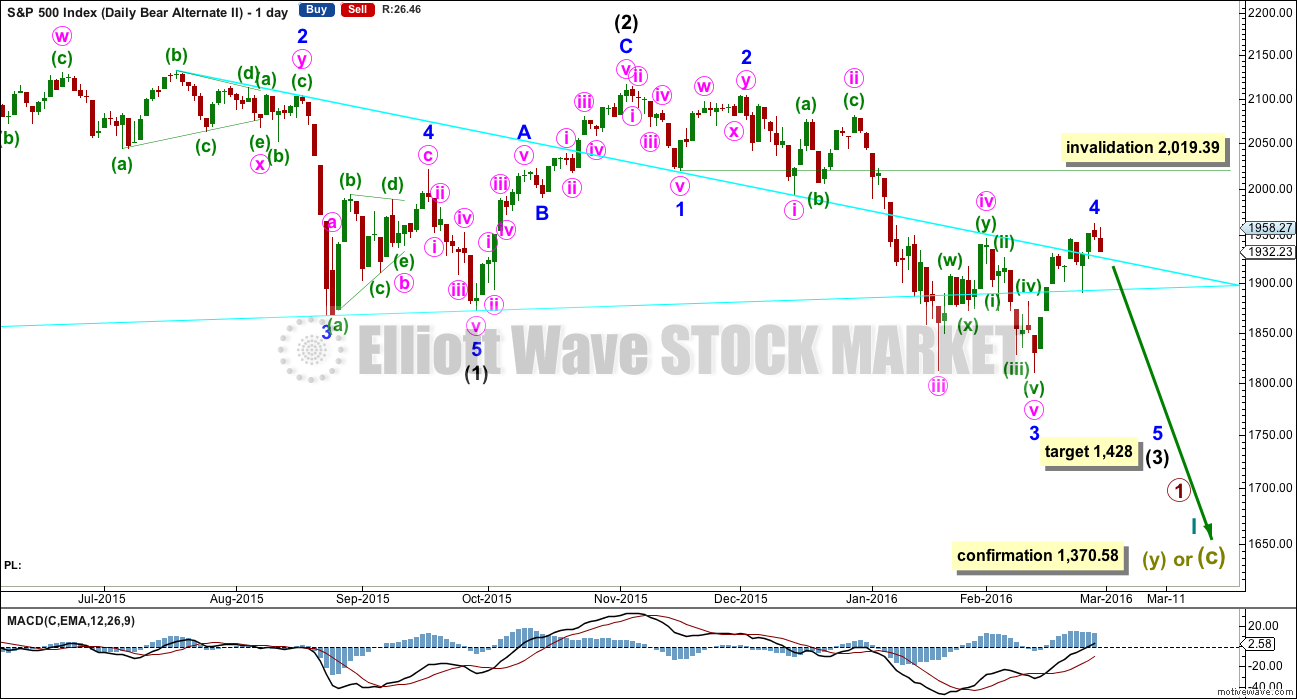
Click chart to enlarge.
I have previously noted this idea in the text and now it is time to chart it, so that the implications are clear.
Within the downwards impulse unfolding, it may be that intermediate waves (1) and (2) are complete and now minor waves 1, 2 and 3 may also be complete within intermediate wave (3).
This wave count expects minor wave 5 to be extended within intermediate wave (3). Minor wave 5 should also show a strong increase in momentum, so that at its end intermediate wave (3) has clearly stronger momentum than intermediate wave (1).
There is no difference to the target for intermediate wave (3). This wave count makes a difference to the invalidation point. Minor wave 4 may not move into minor wave 1 price territory above 2,019.39.
This wave count also has a lower probability than the main bear wave count. This wave count would be more typical of commodities than the S&P.
Minor wave 2 lasted 11 days. Minor wave 4 may be over in 10 days, which is not a Fibonacci number.
TECHNICAL ANALYSIS
DAILY CHART
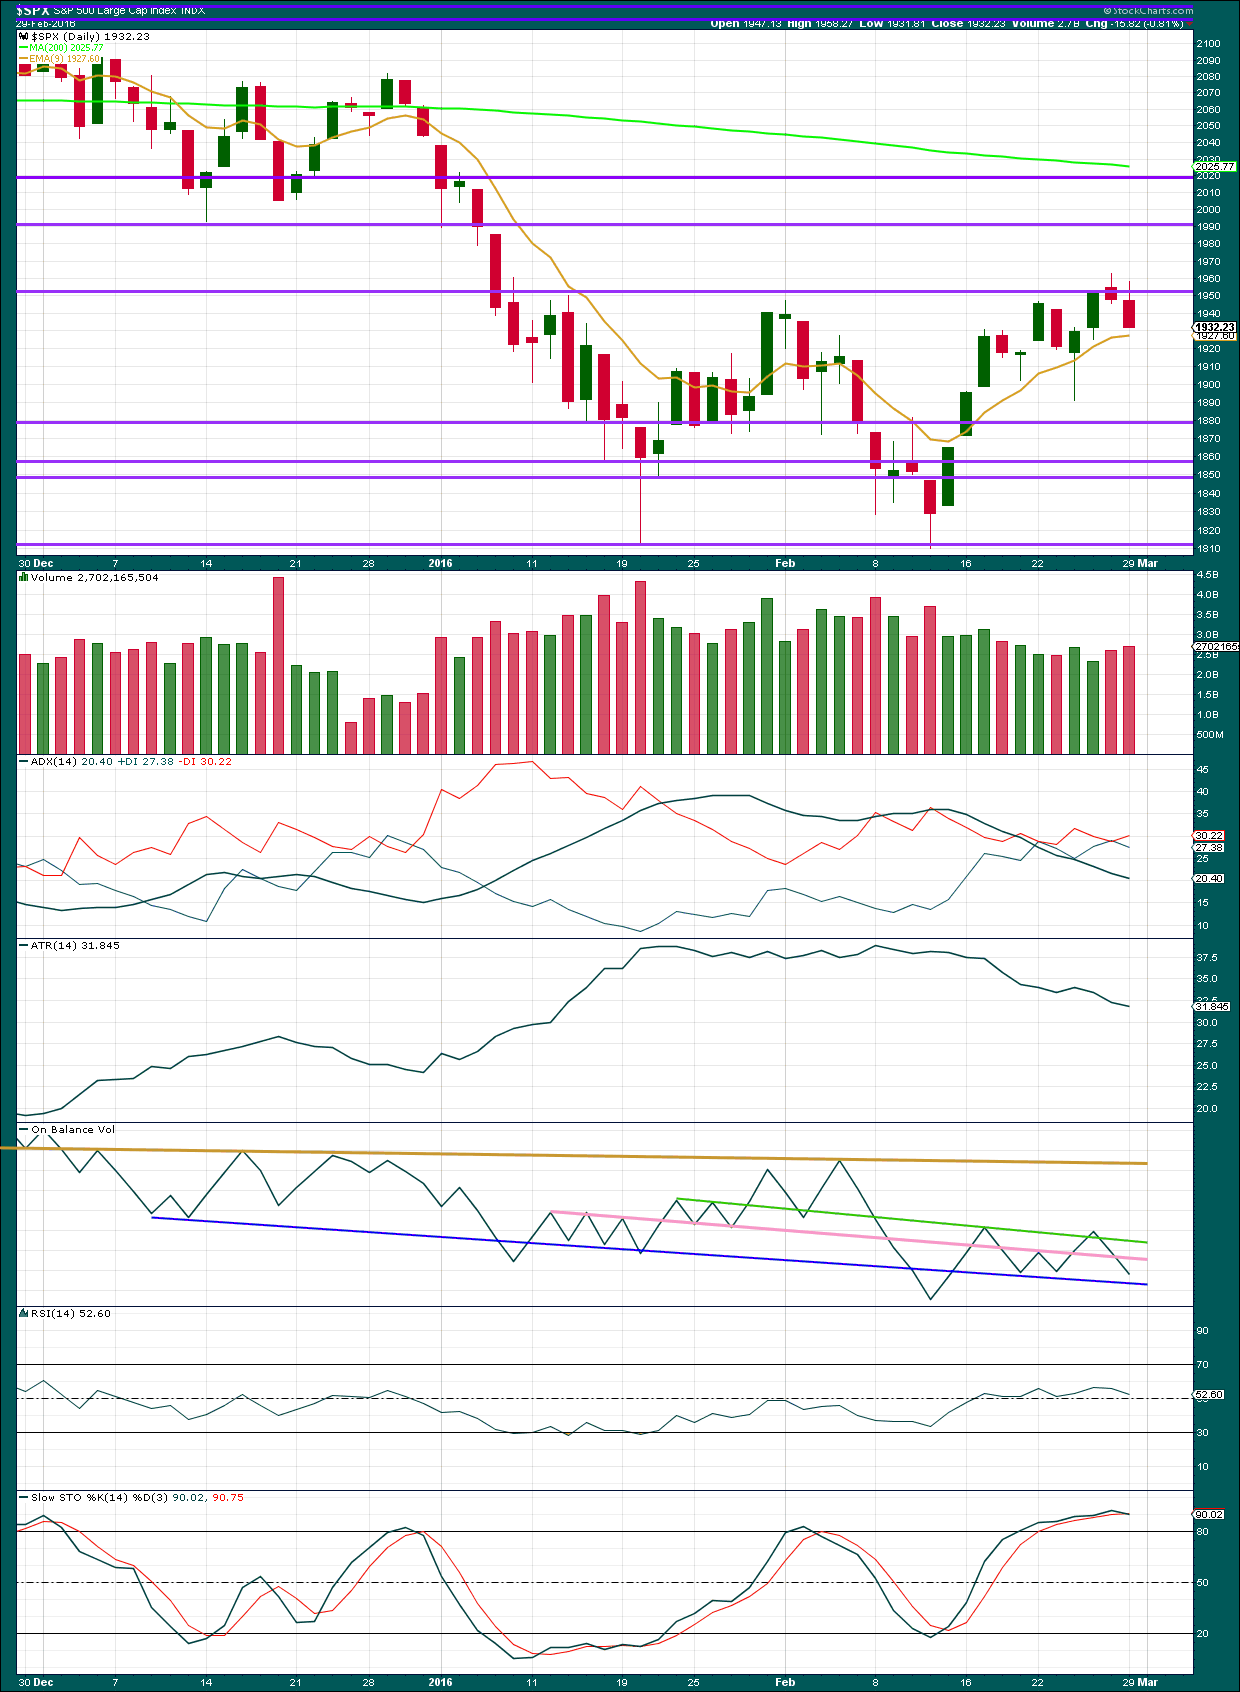
Click chart to enlarge. Chart courtesy of StockCharts.com.
Two downwards days in a row, both on increasing volume, is bearish. The fall in price is supported by volume, so is not suspicious. The prior rise in price ended on declining volume and was suspicious. Overall, the volume profile continues to be more bearish than bullish.
ADX still indicates the market is not trending. It has not indicated a trend change either: the -DX line remains above +DX line.
ATR agrees. It too indicates the market is not trending; it is consolidating.
With the market consolidating, it should be expected that price may swing from resistance to support and back again until a breakout occurs. Stochastics may be used to assist in identifying when price will turn. At this stage, price has found resistance about 1,950 and Stochastics is overbought. This approach would expect a downwards swing about here.
RSI is still just above neutral. There is plenty of room for this market to rise or fall. RSI shows weak slight bearish divergence for Friday’s session; while price made a new high RSI moved slightly lower.
On Balance Volume has found resistance and turned down at the green trend line, which was a weak bearish signal. OBV has now broken below the pink line which was more tested, and which is a slightly stronger bearish signal. A break below the dark blue line would be another bearish signal.
DOW THEORY
For the bear wave count I am waiting for Dow Theory to confirm a market crash. I am choosing to use the S&P500, Dow Industrials, Dow Transportation, Nasdaq and I’ll add the Russell 2000 index. Major swing lows are noted below. So far the Industrials, Transportation and Russell 2000 have made new major swing lows. None of these indices have made new highs.
I am aware that this approach is extremely conservative. Original Dow Theory has already confirmed a major trend change as both the industrials and transportation indexes have made new major lows.
At this stage, if the S&P500 and Nasdaq also make new major swing lows, then my modified Dow Theory would confirm a major new bear market. At that stage, my only wave count would be the bear wave count.
The lows below are from October 2014. These lows were the last secondary correction within the primary trend which was the bull market from 2009.
These lows must be breached by a daily close below each point. So far the S&P has made a new low below 1,821.61, but it has not closed below 1,821.61.
S&P500: 1,821.61
Nasdaq: 4,117.84
DJT: 7,700.49 – this price point was breached.
DJIA: 15,855.12 – this price point was breached.
Russell 2000: 1,343.51 – this price point was breached.
THIRD WAVE EXAMPLE
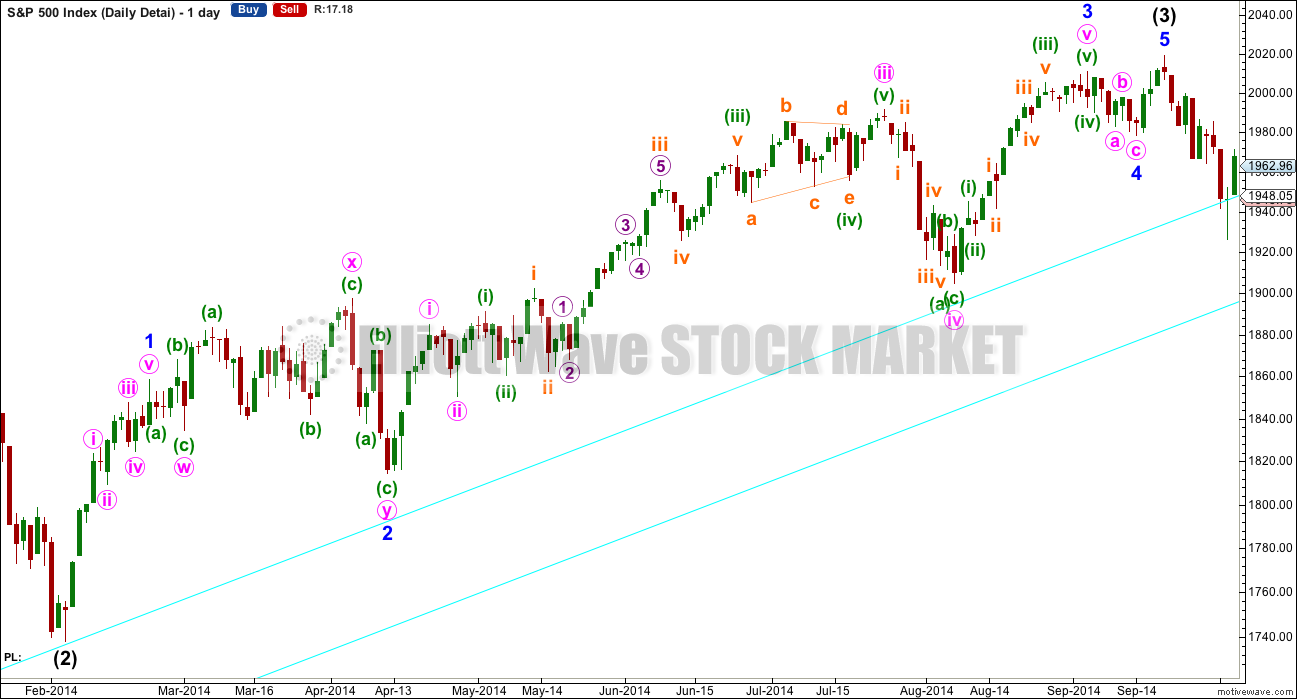
Click chart to enlarge.
This is the detail of the middle of the third wave in the last bull market. It spans February 2014 to October 2014, eight months.
The middle of intermediate wave (3) is extended.
Right down to micro degree, within each third wave it is the middle, the third wave, which is extended.
The whole structure has a stretched out middle. This makes each correction within it more time consuming than corrections at these low degrees normally are. It begins with a lot of overlapping.
For the S&P this is a very normal looking third wave. Although this is a third wave within a bull market, a third wave within a bear market most often looks the same or very similar. The only difference is bear market third waves may end more sharply with strong fifth waves.
This analysis is published @ 08:53 p.m. EST.
[Note: Analysis is public today for promotional purposes. Member comments and discussion will remain private.]
Any members feeling frustrated at this analysis, if you feel like you’ve missed out on making money in this bounce, I would recommend reading “Reminiscences of a Stock Operator” by Edwin Lefevre.
Two things to take from that book:
1. Stay with the trend.
2. Wait for confirmation.
And if you think the trend is up, and I’m wrong, then please do cancel your membership. Why would you follow my analysis if you disagree on such a large point?
But TBH, I’m not taking any comments here today personally. I have seen nothing here today which may be considered a breach of the comments guidelines.
If this site is lacking in something, and I don’t think it is, it always remains interesting. Human behavior is very interesting in general. But when it comes to money, it is really interesting to see behaviors.
Glad you pointed that out. I get more enjoyment form the camaraderie with other members of the forum than from winning trades. Don’t get me wrong. I know we are here to make winning trades, but If I had to choose between a place where I made a ton of money with a lot of acrimony and stress, and a place that did not know the difference between a condor and a collar but I could share a good laugh with the participants, I would choose the latter. I have followed the work of quite a few analysts over the years, there is none finer than Lara. It may take a while to learn to use the information to one’s best advantage and translate that into winning trades. I also had a learning curve when I first joined. I nevertheless get the impression that we sometimes take what she does for granted and I don’t want us to make that mistake.
Reminiscences of a Stock Operator is only $0.99 US for the kindle edition. Hard to beat that!
I’ve waited for StockCharts volume data to be finalised. Now it is.
Today showed an increase in volume; 2,960,494,080 compared to yesterday 2,763,041,536.
Is someone’s broker showing lighter volume for day compared to yesterday?
Doh! That kinda changes things a bit
Yes. It does rather doesn’t it 🙁
Yet MarketWatch shows a decline in volume for today…
S&P 500 Total Volume on TD Amer. Thinkorswim platform charts are almost the same as Marketwatch.
Lower volume today than yesterday. $TVOLSP
Thanks Joseph.
I think the conclusion will be that I have to go with StockCharts data, but I’ll note that it is contradicted by other sources.
The ever continuing saga over volume data. It should be simple. NYSE has the data, it should be complete and accurate and available.
“Should” and “are” though, not the same.
I am surprise the volume numbers are so different or not available.
Years ago those numbers were always available.
I’m surprised too. TBH it really shouldn’t be this hard to get accurate volume data for this market.
It greatly concerns me that it isn’t available.
BarChart data gives me price, but no volume. Hence my StockCharts account.
StockCharts is widely used and should be reliable. Should be….
Intensely frustrating it is to guess and second guess data. I rely so heavily on volume in my analysis.
Okay, I’m going to the source 🙂
NYSE.
Today had slightly lighter volume.
I expect that as it’s their index, their data should be the most accurate.
So now I need to cross check StockCharts data with NYSE data for volume… daily. Great.
So do all my brokers show a decrease in volume.
It seems all but stockcharts. SO where do they get the data?
I think it is important for folks to share their thoughts (related to markets) without a concern that someone is going to jump their a** with (at times) nervous remarks/comments… 🙂
I actually try to gauge the market sentiment amongst traders utilizing the opinions listed here (yes I am aware of the sample size)… 🙂
Lets take it easy folks… 🙂
Sharp bear market rallies are hallmark of bear markets…godspeed…
Tbf Jack – I think everyone here is incredibly polite and shares significant amounts of their experience free of charge with other members.
Personally I struggle to entertain could of, would of, should of type arguments unless they are backed with hard facts / probabilities – anything with substance.
That said, on this site there are only 2 things I totally respect – price & Lara. If Lara deems I or anyone else has jumped on anyone I’m sure she will let us know and I would certainly take that on board.
A little too strong today Olga… I hope all is well (and I mean that in the most sincere and genuine way)… No ill will here.
Not everyone is always polite. I have removed people from comments and blacklisted people from the membership forever.
Teh Internetz is mostly an uncivilised and rude space. I don’t tolerate that here.
I also sometimes find nervous comments unhelpful, and I have let it influence my trading to my detriment here. My mistake, and I’ll own it. I paid $$ for that lesson 🙂
However, the general conclusion of the comments guidelines is “if you wouldn’t say it to your Grandmother, don’t say it here” which I think sets a high standard, is still met by nervous comments.
Gotta say – I’m still very confused. It seems black and white to me, but there still seems to be a significant number of members suffering from ‘missing the party’ frustration today. I’m truly concerned whether it is me that is missing something?
I saw a quite detailed comment from David showing the same kind of frustration and now it has disappeared.
Any member that pays Lara for technical analysis because they believe that she is one of the best in the business at analysing EW and putting each alternative in most probable order with no regard to emotion / noise / news (as I do – and Lara has proven countless times) , should currently be SOH (sat on hands) without a care in the world until the most probable count is either invalidated or confirmed.
Anyone who knows better and feels they are missing the party – please go ahead.
A personal favour though – would appreciate not moaning on here about missing the party without posting evidence (TA / charts etc) as to why we should all be part of it.
If anyone needs first hand evidence what Wave 2’s job is, they have it right here unless I am mistaken.
Well said. Its easy to think you’ve missed something when the market goes against expectations. And if it moves strongly, then the angst only increases. Get used to it! Its going to happen a lot–with any analyst using any analytical system.
The kind of manic move up today did exactly what it was intended to do. Rattle inexperienced traders, and especially those without the discipline of a trading plan, or who may be over-leveraged on margin. Olga you are surely going to give yourself a headache trying to understand people who belly ache about what the market should be doing rather than simply accepting what it does- even when they have a road-map that clearly allows for today’s eventuality. It is even more contemptible to try and blame anybody else for a trade that did not go as intended or some supposed missed opportunity. We are all adults here folk. Live and learn! Some of your most valuable lessons are going to come from getting your gluteus maximus kicked every now and then. Get used to it will ya? ( I have actually had BOTH my maximus and minimus kicked on numerous occasions!) 🙂
At the same time? 🙂
That’s right, and I want you to know that it did not SIT well with me at the time.. 🙂
That is another lesson the trader needs to learn, One is 100% responsible for one’s own trades. Others can help our trading or hurt our trading. But buck stops with me. Pride causes us to need to blame others.
Want to add one more thing, especially for the more inexperienced traders out there. The market action today illustrates it very well. And that is that the most important ingredient to making money is risk control. You don’t get rich by making a big bet, but by limiting your downside if the bet doesn’t work out as planned. Strict risk control is the most important part of a trading plan.
Exactly. I completely agree.
Good risk management can turn even a poor strategy into a profitable strategy.
I just can’t emphasise strongly enough how important it is.
Your account needs to be able to withstand as much as 10 losses in a row… and leave you with enough equity to stay in the game.
Which is why risking only 3-5% of equity on any one trade is what I repeatedly advise.
And poor risk management is the hallmark of inexperience in trading. I have learned this the hard way, a lesson that cost my last few thousand dollars a few years back. Pretty sure many traders here have similar stories.
Worse! But I am not going to relive it by telling it!
I always want to remember it though, especially when I think I am so smart at trading. People like to put the first dollar earned on the wall. Why not put up all those last dollars lost. Humans forget far to quickly. So I need to remind myself. It is also why I am very grateful and hopefully humble when I have a winning trade.
This does not mean I have no confidence. That is certainly needed in this vocation. But overconfidence has bankrupted many people.
I have learned that every time someone gets upset or rattled by what the market does on any one particular day, it is very often a sign of poor risk management and/or inexperience. To be honest, it really even startles me but then I have to remind myself that I have been there. I do get the impression that some of the comments were made by some who have never traded a bear market. The frustration and confusion is entirely understandable. There is not an experienced trader alive who did not look at today’s action and say….all together now…. BEAR MARKET RALLY! You almost never see these kinds of moves in a bull market. Lots of traders are smiling at today’s action cause they know exactly what it portends. Nothing new under the sun… 🙂
Well… personally I haven’t felt left out the last few weeks anyway.
Mr Market might have given some free bubbly to the bulls, but he has also very kindly provided us alot higher confirmation points, and a possible ‘tell tale’ lower low! Now what’s not to like about that!
Also – the more Mr Market closes the gap between confirmation and invalidation – the greater the risk reward. Very generous indeed I reckon.
Enuff said! Have a great evening everyone 🙂
Mr. Market may, just may, be looking to close the gap at SPX 2050.
Yea, I agree – frustrated.
After this run I am kicking myself for not doing some simple trend trading. After all, the trend has been up, right? I look at the chart and ask myself why I didn’t hop on. After all the market is up 10% in 12 days.
I sometimes talk myself into a bearish posture and don’t play the obvious market in front of me.
Anyway – I hope to make some money on the way down. Live and learn and try to do better.
Well, I would also have liked to have made some money on the last move up. But in may case it wasn’t a missed opportunity, it was a matter of risk. Ten days ago we were looking at the probability of a very short upward correction followed by a serious downdraft. And as far as I was (and am) concerned, it wasn’t worth the risk. So I’m not sorry I missed the move. I made the right decision, even if I didn’t make any money.
Good points thomas.
I have found it is prudent to not trade against the trend especially on relatively low degree waves. But I’ve lost so much money on 2nd waves and B waves that I made myself a promise, don’t trade them! I will swallow any pride and say I am not able to be effective.
Higher degree 2nd waves and b waves can me traded if they are large enough to present a 60-90 day trend or bigger just like the major moves since 2000.
Spoken like a true trader. Not a gambler. Lots of folk who happened to be long the market today and who chase it higher are going to give it back and more if they are trading on emotion and hunches and not a well-thought out game plan. It is all about risk vs reward. Well said! 🙂
Well, agreed.
Which is of course why I didn’t jump into a trade against my greater overall game plan. While I can look at the chart and see an opportunity, my bigger concern is watching this thing unfold.
I was hesitant to share my feelings about this, I hope I haven’t given the wrong impression or offended anyone.
Overall – I am sticking to my overall plan, even if I am self critical about my trading.
That is why I didn’t take any trades to the long side and used the SOH technique.
Apologies to all – and esp. Lara – I hope this wasn’t offensive. It truly wasn’t meant to be.
No offence taken. Your comment would have been removed if it did not meet the guidelines. It met the guidelines.
I understand your frustration. I too am learning how volatile this market is to trade.
I look at this upwards move as an opportunity. One I’ll not take yet, I’ll wait for confirmation that it’s over.
I did that earlier on 19th February and suffered another loss. The lesson I’ve learned there, expect a correction to look like a three at the daily chart level also. It didn’t. Greed and impatience were my mistakes there.
Now it’s deeper and clearer. When it’s confirmed as over I’ll enter short again. And until then, I’ll wait on the sidelines patiently.
Staying out of the market for periods reduces risk too. It’s okay to SOH.
You are a good man David. No offense taken my friend. Sometimes you just gotta let it all hang out! 🙂
Olga,
I blame the expectations for some of this frustration or venting that we are all seeing. The classic investor greed and fear is played out each and everyday. It is fair to say that none of us are in this market to lose money or miss out on an opportunity to make money (I agree with you and Vern that best lessons are learnt when you are proven wrong by the market).
Personally, never thought that Lara had some crystal ball to correctly predict the markets and Lara’s EW analysis is one of the many inputs that I use to risk manage my investment and/or trades. If the risk reward is not to my liking, I simply follow the SOH principle.
If any members are currently bullish / trading long then please do post your trades / charts / TA in real time. Please do not let the fact that some of us (currently) have a bearish outlook impact on your trades. Many of us that are currently bearish were long when the risk / reward was acceptable to that trader. There will likely be a point in the not too distant future when I will want to be significantly long the market.
I personally very much welcome a balanced view from both sides of the fence, provided it is backed by technical analysis or anything other than emotion / noise / rumour etc.
I very much like to be proven wrong (learn alot from it!) 🙂
Me too! 🙂
I like the fact that many of us don’t just talk or gripe about our trading, we actually state what we are buying and selling, and why, including our losses. This I think is far more constructive and helpful.
I have alot more respect for those who post their losses than for those who post their gains tbh. As well as the obvious, I tend to learn alot more from a loss than I do from a gain.
Those that have been around long enough know I have had my fair share of wounds (some bad luck, others bad decisions). Just gotta dust yerself down and await the next opportunity.
Here’s a little known fact. Most successful traders have only about a 70% win rate, which means they are wrong in roughly one of every three trades. Steve Nison often mentions the fact that even when he was the best trader at Merrill Lynch, he actually had more losses than wins! The obvious key was that he kept his losses, frequent thought they were, small, and allowed his winning trades to play out. My most recently bought UVXY shares are now trading for exactly 0.5 cents less than it cost me to acquire them. I fully expect them to get even cheaper. I’ll panic if and when they do a reverse split! 🙂
1 in 3 pretty good imo!! 🙂
Yep – you’d better ride the winners – no leaving too much on the table.
Gotta say – when it comes to trades, I’ll be a bear or a bull depending on what price gives me, but I’m almost always a pig (against conventional wisdom I know – but the term ‘pig’ depends on your time horizon imo)
Vern,
I have been holding PCLN short for a few weeks now. Checkout the volume on Mar 04 series 1280, 1290, and 1300 options for today. I was wondering if you were picking these up..
I did. I have been looking at the action in both PCLN and WYNN for some time and decided it was time to short them both. The fact that they moved higher today has absolutely nothing to do with my opinion of the trade and in fact I expected more meandering to upward drifting in the short to mid term. As I do with every trade, there is a number that says I am wrong, and there is a number that says it is time to take some off the table. There is also a reasonable time frame in which the trade should be expected to pan out as well depending on whether it is a short, medium, or long term trade, after which time the trade should be graciously exited and capital deployed elsewhere. My expectation is the price of both of those stocks are going to be halved. I don’t really care a whole lot what they do tomorrow, or the day after that (unless of course they both make new all time highs!) … 🙂
I agree with the two of you. That is why I showed my losing trade last week.
First of all, because I learn from reflection on the trade. No matter the trade, I need to be able to analyze my trades in order to make better trades.
Secondly, I have learned a great deal by reading about trades including specifics like vehicles / instruments used. I do not need to know nor do I care how much money or how many shares etc. That is irrelevant to me.
However, if my sharing details becomes boring or tedious etc., I trust you all to let me know. No hard feelings. I want to work for what is best for the common good. I want the most members satisfied and can go along with any suggestions to achieve that goal.
Earlier today there were some comments about time frames. Something that has helped me is to define what I mean by short, medium, or long term. Then I open an account for each of the three terms not mingling the funds. I find this helps me to be honest with myself so to speak.
I was gone late morning and most of the afternoon. It is not easy to read dozens of posts and follow the thread. Just a suggestion Lara, perhaps the next infrastructure update you do can include an improved forum / board / comment section. Please understand that I am not complaining. I am pleased to be here and have this board available. But just a suggestion. I don’t even know what is possible and I have no suggestions as to help in the reading.
We have a forum plug in, but it wouldn’t be providing comments with each daily post.
Not sure if adding it would be an addition or detraction from comments with each post?
Rodney you would really be surprised at how few traders actually distinguish in their own minds what time frame they are trading in. Keeping separate accounts is one smart and convenient way to implement the idea. I have to say, and I want to do so as kindly as I can, I do get a bit startled when one considers all the information we have about the state of the markets, both internal and external, yet some folk get so completely discombobulated by a three hundred point up day in the market, as if that is going to necessarily have any bearing whatsoever on what the market does in six months, or for that matter in six hours! Strange! Whatever happened to context? 🙂
I’m only bullish on a few specific stocks and a couple of bond funds. Bonds are no safe haven either, as they have been moving opposite the indices.
Based on the comments I have no idea how you guys trade profitably. I’d love to know. What timeframe to you generally work to. As a swing trader it is a real struggle.
Some of the comments today have got me real confused (doesn’t take much!).
We confirmed no count(s) today – we invalidated no count(s) today.
So what happened today that could win or lose anyone money?
If you are a (successful) swing trader on short timeframes then you must have a much better grasp of EW (or some other TA) than I do.
Timeframe of Laras count is Cycle degree if you choose to trade that. The lower the degree the greater the number of mistakes imo
Correction – at lower degree the green (a)(b)(c) count was invalidated.
My error…
Yep. That is the count I was expecting to play out and it did not as either sub-min moved higher, or we are actually in a higher degree correction. The move higher did not invalidate the sub-min label, but the volatility price action does raise the possibility of a higher degree wave up…
Do you base your trading decision on the EW count, or some other TA method?
What do you think the trend is? Are you trading with or against the perceived trend? Do you have a plan? The way you answer those kinds of questions will pretty much determine you trade outcomes. I generally look at short, medium and long -term time frames- less than six months, six to twelve months, and a year or more. I have to take this approach as I generally trade options and have to consider premium decay of my positions over time. It sounds as if the market has you a bit frustrated but that is what markets do I am afraid…welcome to the club! 🙂
Interesting, thanks, for someone with such long timeframes for trades you post a huge amount intra day. No issue with that if it works for you. I tend to hold long term too, and yes- find this market incredibly frustrating. Happy to hold on, the trade is fine although am wishing I’d closed at 1812 rather than holding on waiting for this W3 to show up
I’m understanding your frustration now.
IMO (based on current tech. analysis – not my own ‘hunch’) – probability is in your favour, and you will likely have totally forgotten this frustration fairly soon. Of course, the problem with probability is that it is not certainty.
Buy and hold can seem like the least ‘mistake prone’ option and often it is – but as payback for you taking that privilege, Mr Market is going to make it as excruciatingly uncomfortable for you as possible.
From what I have seen, Verne appears to be very good at easing the pain using various vehicles, albeit that is well beyond my knowledge (I will not touch options again with a barge pole! 🙂 ).
I actually closed out practically all my short and medium trade positions a few days back and now have the bulk of my position in leaps. The chatter I do on the board is rarely about my main positions but mostly short term stuff I am doing for the fun of it.
It sounds to me like you are allowing a single day of market action to shake your confidence. Don’t do that! You know why you took the position you did. Until and unless you have information that clearly demonstrated you were in error in making that trade, you should have no worries…let the market come to you. Most traders chase it…
I’m not buying the volume argument. We gone up 140 S&P points on ‘low volume’. You all are more experienced than me but I’m kicking myself for not playing more of the long side. On highs at the close and after hours. Probably another gap and go tomorrow.
I guess that’s why we only use volume to determine EW alternate probability (along with other data), and price always as the final word.
To go long at anytime in the last week or so would take someone much more brave than me – but that doesn’t mean you’d be wrong.
I’m certainly not kicking myself for not being long over the last couple weeks. The emotion of ‘missing the party’ can be a dangerous one imho
As is always the case, these kinds of decisions very much depend on your time frame, risk tolerance, and of course, the indispensable trading plan. A lot of traders bought the rally today, no question. Quite a few did not…the smart ones, long or short, all traded according to their plan… just my penny…
Nothing has been invalidated.
Today… it can be said that the remaining weak and not so weak bears have been shaken out!
Today also have brought in the bulls or the TBFD bulls and the “all clear bulls”.
I guess we sometimes have to remember that after trading for awhile there are just some things you take for granted. It looks like we are going to have to get accustomed to interacting with a few folk that are trying out their wings. I don’t have any problem with that. But as Lara said, her service really does offer a bigger bang for the buck for traders with at least some experience….
That said – I would be kicking myself if I had gone short before todays significant move higher due to not waiting for Lara’s price confirmations.
(BTW – I am not suggesting that is the case with you – I’m just making a point about importance of awaiting confirmation before betting the farm 🙂 )
I know quite a few power traders who are short this market and have been for quite some time. Thy pay little or no attention to the daily gyrations of the market. They have adjusted their stops as the market has declined since last year and will take action when and if that is warranted. There is no mystery here.
Who’s selling? We all make our own trade decisions. 🙂
Well, I got into my final positions about 25 points SPX early but for me that is par for the course. It may knock on the pivot door close to 2000 but it is already looking weary. It is a long way down.
“Take the long way home…” (Supertramp of course!) Bye’ all!
A good amount of volume comes in after the close on a 5 min. chart between 4:001PM & 4:05PM… now fully closed.
As of 4:05PM… volume still lower than yesterday’s volume but slightly higher than two days ago.
On todays move in price I would have expected significantly higher volume.
From what you have posted, Lara’s WXY wave count is supported by volume imho
That is what $TVOLSP says… I would have expected the same as this was a big move.
The absence of volume has to be a signal.
Perhaps we in final W4 now with one small pop to the upside still to go?
Maybe get a final pop higher tomorrow at the open? (now wouldn’t that be a surprise…).
Poss Wave 4 of one lower degree is between 1969 and 1973.45 – could be a good place for this W4 to terminate (if that’s indeed what it is)???
CHF perking up a bit against USD – also short sale ban on UVXY back on IB.
YeeeeHaaaa – there she blows – I count that as 5 up – but we’ll see!!
They can always use options. Or are those off limits too…?
Dunno… I think it’s options also.
Bought small amount of UVXY at 33.00.
Totally an unconfirmed gamble here – not recommending it.
Playing with house money so can afford a bit of fun now and again.
Give yourself a bit of leeway. It has a tendency to spike down just before it rockets higher. The next day or two will present as cheap an entry point as we will see. I actually have an open order at around the last low of 29.75 for a silly trade. A market option purchase contingent on share price hitting there… also bought some metals today! Many happy returns! 🙂
Yeah – only did it in case of a gap lower tomorrow as I can count a completed 5 up. If we extend higher then I’ll try to unload on a wave 2 pull back for a small loss. We’re not talking any serious money here in the scheme of things.
I can usually make up the small losses by scalping wave 4 price swings and the like. My account has not been too badly dented by this crazy wave 2 so I’m in a pretty good position (though not pushing my luck).
The closer we get to invalidation, the better the risk reward will become. The price points have already become much clearer for those who have been patient.
Chart (beware this count might not be correct – and even if it is, the final 5th can extend (alot) higher!!)
This is exactly how I would count it. The final 5th wave up could extend further, or it could be over already. Volume was not particularly impressive today, particularly since it was the first day of the month. Also, there is MACD divergence on the 5 minute chart, which suggests to me that this move is running out of gas.
In any event, a correction lower is not far off. The strength and magnitude of the next move down will clue us in as to which wave count is correct.
Yep – we’re on the same page Peter!
I took a bit of a small short position based upon that – if it extends I’ll look for best exit (wave ii of 5 or (even better) 2 of C) or maybe take the heat depending upon wave structure.
I’m thinking if it is over we could gap down tomorrow.
All things being equal I consider it a calculated risk! 🙂
BTW Peter – you’ve identified some great alternate counts in the past (some not at all obvious so you clearly have a good grasp of EW).
Please do post your EW counts more often!
Particularly interested in possible counts as they are unfolding if you like that kind of torture 😉
I understand wave ‘speak’ but most here (quite rightly) like to see a chart.
Would be great to have someone to bounce EW alternate ideas off when (or if) you have the time.
Of course it could, but the market is now trading in a range that has previously consistently provided very stiff resistance. It is such a classic shake the trees move up I guarantee it is only being traded by very experienced traders, and very in-experienced ones. Caveat Emptor 🙂
Volume as of right now is about 53% of yesterdays volume.!
AND 69% of the day prior to yesterdays volume.!
SO unless you think those gaps will be made up in the last 50 min. both will be lower!
Based on $TVOLSP CHART
Great News!!! 🙂
$TVOLSP CHART is real time.
As of 3:53PM Volume today still lower than both previous days.
It’s the lowest all of Feb.
They are all GIDDY… on CNBC & other business news BULL… BULL… BULL…. “ALL CLEAR”
NOT!!!!!!!!!!!!!!!
Dunno how you can watch those channels whilst trading – my head would literally explode (as would my account no doubt).
I keep them on as background noise while I am working.
Yes… when I can’t take listening to it, I turn it all off. Like earlier today I just had to get away from it all (including viewing the charts) for a while so I went out!
Stopped out with a very small loss – looks like price is extending higher.
Knew I shouldn’t have labelled that chart! 🙂
The higher is goes, the further…..
Think I’ll wait until we are at least below 1966.81 before attempting to burn my fingers again
Interesting that that 5th wave of W3 extended and now W5 is also extending.
Often see this in Gold – smells like panic buying to me.
Banksters shaking the trees for any and all remaining cubbies. I was hoping for a reversal today but that is not going to happen. Looking like another day or two of the market’s chasing its tail…
Or did we get 3 nested 1,2s this morning rather than 2??
(sorry about my labels – realise they are not to ‘specification’)
This is what I have on the five minute chart.
This may be micro degree as labelled, but equally as likely it may be submicro degree. Just the first wave within subminuette c.
Obviously the correction isn’t over, it’s continuing higher as a double zigzag, most likely structure.
The confirmation point that it’s over can now be moved up to 1,931.81, the low of yesterday. A new low below that point now couldn’t be a second wave correction within subminuette c and so it would have to be over.
At that stage the only way the correction could continue higher would be as a very rare triple zigzag. I’ve only ever seen three of those in my years of Elliott wave analysis. They really are very rare.
He he – I posted my chart first… copycat 🙂
(Only joking BTW boss!!!) 🙂 🙂 🙂
Well, thanks. I would not have guessed that low degree. What led you to that low of degree? I am guessing the upside target for c of ii will be around 2050. I will look for that target in tonight’s analysis . There is no reason I need it during today’s market hours.
It could of course go that high; my guess is that would have been signaled by more robust volume. That is not always conclusive as low volume has not deterred upward movement for many a year…but is sure is relatively light today considering the steep rise…
Now looking like it was five three that was extended. Question is how far along in C we’ve come.
Probably should go higher to be more proportional with A but these kinds of manic runs are often short lived as they burn bright, but burn fast…
I am guessing (on the hourly chart) we are still in 3 of c with 4 & 5 to follow over the next couple of days. 3 must go high enough to make room for 4. Then 5 should put us over 2000. ??? Could we get to 2025 and the 200 day moving average?
3 of c could have just ended at 1974.
Lara will give reliable targets. I am no mathematician or engineer. Just a ball park kind of guess.
Tick… Tick… Tick… Tick… Tick…
Tick… Tick… Tick… Tick… Tick…
Tick… Tick… Tick… Tick… Tick…
Swoosh……………………………………………………………………………………….
What happened to the tocks? 🙂
He’s saving them for later… 🙂
Heard alot of mention about broken clocks – never realised they just went ‘Tock’…
Anyway – I can count 5 up for final W5 of C – is that it?! (or is that just Tocking I can hear?).
Fall below 1969.54 might seal the deal (top of pos W1 of W5 of C (of Y)).
Falling below 1966.81 in 5 waves would be even better. Patience people!
Do you have the counts on a chart you could share?
Sorry Barry – I don’t label at such low degree.
I realise verbal counts can be an issue 🙁
One sec and I’ll jot some numbers on my chart
Sorry – the numbers come out a bit squashed!
Totally convinced this will invalidate now I have numbered (jinxed!) it 🙂
So is that a 5 minute chart?
1 min
Zooming out a bit – todays move 🙂
Might be just 1 of c but if the 1975 fibs are correct it could be all over.
Confirmation is key – don’t jump the gun!! 🙂 🙂
(especially not based on my dodgy counts!)
I think that would actually be the sound of the clock falling on the heads of the bulls…! TOCK!!! ouchie! 😀
Swoosh……………………………………………………………………………………….
Swoosh……………………………………………………………………………………….
Swoosh……………………………………………………………………………………….
The last of the suckers being sucked in here.
You know, ordinarily I would concur, but when I look at the ridiculous volume, it does not seem to working as well as usual. In fact one reason its going so high is everyone is watching the run-up with few market participants, sellers included. This suggests the reversal is going to be sharp. Also sign of a last hurrah…
C waves can produce sharp spikes up or down. My experience has been when the C wave does so, it is followed by a strong move in the opposite direction erasing the spike quickly. Just look at the reversal day we had last week! We we down some 40 points for the day which was followed by a 40 point reversal to the upside.
We are getting very close to the time for me to start positioning short. Just waiting for the sentiment and momentum indicators to reach relative extremes to the bullish side. Fear Greed Index up to 60 and counting. Would love to see it go to 80. By no means, however, can this indicator be used alone. Price is always paramount.
It never ceases to amaze me. The banksters are not doing anything today different than what they have always done. How often have we seen this movie? Nonetheless, I can guarantee you there are tons of folk scrambling for cover, and joyful assertions from others that the bull is alive and well. I am also starting to think the banksters must think the vast majority of market participants are by and large completely clueless (although I must say volume remains tepid). Of course they are going to shake out folk shorting the market on margin. It looks like both indices are heading towards a few open gaps from January. I am curious as to just who, if anybody, is “buying the rally” 🙂
Still a few bucks above my UVXY entry price…I’m holdin’…they are going to have to pry them from my cold, dead…you know… 🙂
What target you got for UVXY? If this move is nearly over I’d be suprised to see much below 32? Not sure we’ll ever see 20’s again but then again…
Unless we get a final frenzy spike. I’ll be backing up the truck if we do. UVXY often goes in the same direction as the market in anticipation of such an event though.
January low was 29.53. I kinda saw this bankster frenzy coming and that is why I got out of my mid and short term options in favor of the actual shares as I did not want to take the draw-down that would come with the option contracts. I really don’t care about fluctuations in the leaps a few years out. I knew it would really tank if we happened to be in a higher degree correction and frankly that is what it seems to be indicating at this point, although I know Lara wants to keep the lower degree for now. Talk about an opportunity to pick up volatility on the cheap. I think we are going to see some heavy buying on the bottom. Already the bid/ask suggests some increase in volume as the spreads have become a bit tighter.
Scratch that – UVXY would likely go well below zero (relatively) during a Cycle W2 up 🙂
What the b——–ards would do is reverse split it and screw you…pardon the language but I don’t know how else to describe it…these derivatives are going to bankrupt a lot of folk. I just hope I don’t hold them too long 🙂
Yep – seen it a ton of times over the years on these. UVXY real original price must be well over $1000.
Update: Just had a quick look – UVXY was at $1500 in 2013 (relatively) – since then they had a 1:4 then 1:5 split – ouch!
Price should soon head north in any case.
Oh yeah! The North Star…! I suspect at some point they are going to halt trading on it. Of course, if it goes anywhere near its crisis highs nobody is going to be able to afford to trade it so it may be a moot point.
We possibly now in W4 of C? (Unless W3 of C continues to extend but if 1975 is the correct target I would expect to see W4 of C here – otherwise that target is prob too low)
W2 of C was sharp so W4 will probably move sideways.
W4 invalidation @ approx. 1947.69 (Possible W1 of C high)
Looks like the fifth up may have extended to me…
Yep. It looks like its headed for those gaps . For SPX it’s close to 2000. Probably a few more manic days….
You mean extended W5 of C? I can’t count us in W5 of C without breaking any EW rules
Maybe an extended W5 of 3 of C? Or are we going to see a series of 4th and 5th waves to mirror overlapping 1st and 2nd waves of C? Either way, it should be over soon (perhaps today, more likely tomorrow).
Yep – that’s the way I’m counting it atm
Won’t that be something if we see an outside reversal today? Yikes!
It would be a rather fitting conclusion to the mania!! 😀
It would be one heck of a bearish engulfing candle!
Keep in mind the low in ES overnight was 1920.75 ~ 1923 in SPX terms.
That’s equivalent to another 10 points on this move up if SPX traded overnight. SO up 46 off the low.
I had three shorter than five but longer than one but I don’t that is right as it continued up …
Think that was VW (Verne Wave) 🙂 🙂 🙂
Makes a change from OW 🙂
Right on Olga.
I am finding that the most reliable and lasting short term counts come from the hourly charts. I usually start there and if I have time I watch and count the five minute and even one minute. Those two are not as solid, strong, or reliable.
I can’t watch this today…. Going out!
Banksters at work. There are an awful lot of folk who are not “buying it”. I have never seen this kind of manic move on such pathetic volume, even for a typical bear market rally. They are toast! The higher they fly, the harder they fall….! 🙂
Wish I could get decent volume figures.
Crazy spikes upwards for no volume. Must be a ‘stop hit’ fest.
Can you imagine UVXY is trading nearly back in low 30s!! I sold most of my position at nearly 60 not so long ago (been burnt a little since then – but nothing too major). I know this is what it does (why I trade it), but never ceases to amaze me.
Seriously bad for your wealth if not very careful. Not exactly ‘buy and hold’! 🙂
S&P
Hour 1 – 141.4m
Hour 2 – 79.7m
Hour 3 – 41.4m
Thanks Barry – Is overall volume looking lower than yesterday atm?
Does anyone know a website I can get the same volume figures Lara gets?
today appears slightly higher…but hard to tell. Yesterday during the selloff each successive hourly candle had an increase in volume. Today during the upmove the volume decreased on each successive hourly candle. That said, we are UP 30+ S&P points off of yesterday’s low….
StockCharts.com
They have some publicly available figures
Not sure if they have volume public
Thanks Lara
Volume remarkably tepid for this big a pop. What this means is thathis particular bankster feint is not working very well. The move down in UVXY has me wondering if this is not a higher degree second wave. I suspect it’s going to be a while before we see it at these levels again. And you are right; it has not been a buy and hold instrument. These days, for those holding you have to carefully hedge your position in anticipation of what’s coming…
Confirmed in c of Y now imo – possible target:-
c = 0.618 * a @ 1976.34
Y = 0.618 * W @ 1975
So around 1975 is poss target at two degrees – might be good level to watch for a reversal pattern 🙂
Currently looking good for Rodney’s ‘5 waves up’. Possibly in W5 of 3 of Y atm.
Unless it extends, it might be over fairly swiftly.
This possible C wave would equal the size of the previous A wave at just above 2000
Not mine but Lara’s bull hourly count. In lat evening’s video she mentioned that the hourly counts are valid for several of the daily counts.
Todays low at around 1931 is now an important price confirmation to the downside imho
Taking out 1958.23 to the upside now would confirm the move down from 1962 a b wave imo (wave b of Y – with wave c of Y still to go to complete the structure)
Yep! It could run up to challenge the 2000 pivot but I don’t think it will. I think the algos are going to ambush the move…they are going to need a lot more volume that this to challenge 2000…
Already seems to be running out of steam – we fell just short of the line.
I shorted with small position – expecting to be stopped out at 1957.79 (b top of a suspected abc down from todays high).
Literally dust between last high and confirmation – would be suprised if we dive from here – but yer never know – market seems to be going to extremes atm.
Move up looks impulsive atm.
Update – took small profit – think we have more upside to go – can’t count a complete structure yet.
Masterfully dislodging the cubbies! 🙂
Vernecarty,
Both of the charts below give strong evidence we are at the beginning of a bear market. They are ominous warnings that will be heeded by the wise.
I think a few more days of upside and we will see the end of this wave c of 2. I am looking for five waves up on the hourly chart as shown on the hourly bull chart. That means a move toward 2000. I am already licking my chops so to speak.
Thanks for the charts.
It is really going to be somthin’ ain’t it??!! My own hatches are battened down my friend. I am going to grow some tomatoes! 🙂
It could get scary. The only bright side I see in the midst of such turmoil, deleveraging, and massive financial losses, is that we will be making a lot of money (if it materializes as we hope). The middle of the 3rd of a 3rd should have the famous air pockets like 1987.
Corralled covered calls sold yesterday at a nice discount. I was not looking forward to having my UVXY shares called away. I’d much rather hold ’em than heave ’em. 🙂
Close enough on SPX for me. Locked and Loaded!!! 🙂
Vern, how do you trade the options on UVXY? I just looked at the prices and they are very expensive.
Think I will stay away from those.
They are tricky little devils and for most should definitely be avoided. I cannot tell you how often I got my head handed to me trying to figure them out. Here is the key: always try and make the market PAY you to get positioned close to support and resistance pivots. For example, I used a credit spread to enter my long position for a cost of about 35, including premium from spread. Yesterday I sold calls for about 3.00 further reducing my cost to around 32, so as you can see, even with today’s decline, I am still ahead on the trade. The premiums do tend to be a bit pricey and ironically, days like today when people should be snapping up calls on sale, are when people run for cover. That’s it in a nutshell!
They are definitely not for the timid, or un-intiated. 🙂
Not for me… can you recommend any ETF’s for long VIX that are currently priced lower than UVXY?
I want to get max amount of shares for the $’s I currently have available.
I use TVIX. It has a lower price per share than UVXY. But from what I can see, the percentage moves are pretty close to identical. I chart them both because Vernecarty uses UVXY in his forum posts. He is the master on UVXY, imo.
Wow! One does not see these kinds of pitches right down the center of the plate too often. I am changing my usual “stink bids” and getting final positions in at market prices on this small second wave. 🙂
Here’s one more long term EMA chart with an interesting twist, pointed out by Sam Collins.
This is the very first time ever, that indices have made a triple pass across the 17 month EMA. We are certainly in uncharted, no pun intended, waters… 🙂
It would appear according to elevated futures we are being given another opportunity to get positioned ahead of the swan dive. I will be buying back my UVXY calls sometime today and deploying the profits in a buy stop order at SPX 1950. Jeff Clark of Stansberry research posted his favorite long term chart he believes defines bull and bear markets, which is the 20 month EPA.