
Yesterday expected to see short term sideways / downwards movement for the hourly charts.
This is what happened.
Summary: The bear market rally still looks to be incomplete. Price may move a little lower tomorrow to find support at the lower cyan trend line. However, small divergence with VIX today suggests that the downwards movement seen today is over already. Thereafter, more upwards movement to 1,987 is expected.
To see how each of the bull and bear wave counts fit within a larger time frame see the Grand Supercycle Analysis.
To see detail of the bull market from 2009 to the all time high on weekly charts, click here.
Last published monthly charts can be seen here.
If I was asked to pick a winner (which I am reluctant to do) I would say the bear wave count has a higher probability. It is better supported by regular technical analysis at the monthly chart level, it fits the Grand Supercycle analysis better, and it has overall the “right look”.
New updates to this analysis are in bold.
BULL ELLIOTT WAVE COUNT
DAILY CHART – FLAT
Click chart to enlarge.
This wave count is bullish at Super Cycle degree.
Cycle wave IV may not move into cycle wave I price territory below 1,370.58. If this bull wave count is invalidated by downwards movement, then the bear wave count shall be fully confirmed.
Cycle wave II was a shallow 0.41 zigzag lasting three months. Cycle wave IV should exhibit alternation in structure and maybe also alternation in depth. Cycle wave IV may be a flat, or combination. This first daily chart looks at a flat correction.
Cycle wave IV may end within the price range of the fourth wave of one lesser degree. Because of the good Fibonacci ratio for primary wave 3 and the perfect subdivisions within it, I am confident that primary wave 4 has its range from 1,730 to 1,647.
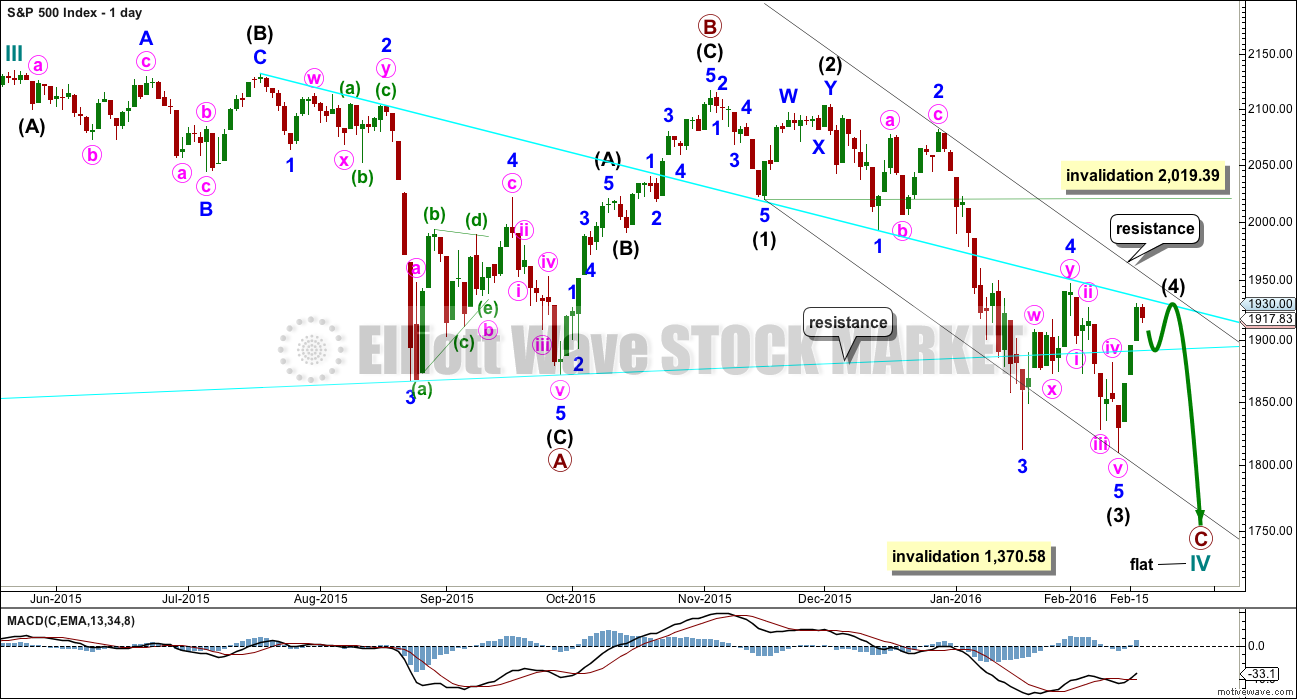
Primary wave C should subdivide as a five.
Within the new downwards wave of primary wave C, intermediate waves (1), (2) and now (3) may be complete. Intermediate wave (4) may now find resistance at the upper cyan trend line. This would see it end within the price territory of the fourth wave of one lesser degree.
Intermediate wave (2) was a deep double zigzag. Intermediate wave (4) may exhibit alternation, so it may be shallow. It would most likely be a flat, combination or triangle.
The idea of a flat correction for cycle wave IV has the best look for the bull wave count. The structure would be nearly complete and at the monthly level cycle wave IV would be relatively in proportion to cycle wave II.
HOURLY CHART
Click chart to enlarge.
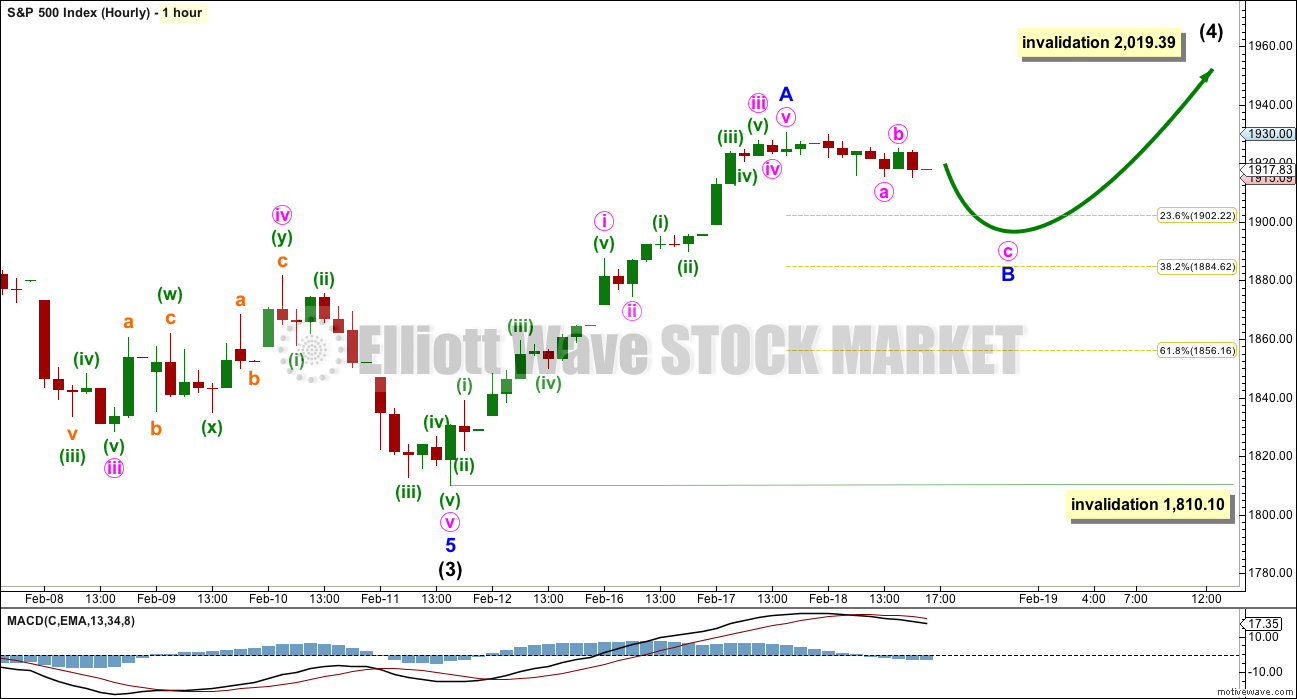
The first five up may now be complete. Minor wave B may correct to about 0.382 or 0.618 the length of minor wave A. It may not move below the start of minor wave A at 1,810.10.
It may be more shallow than the 0.382 ratio, if price finds support at the lower cyan trend line on the daily chart.
DAILY CHART – COMBINATION
Click chart to enlarge.
This idea is technically possible, but it does not have the right look. It is presented only to consider all possibilities.
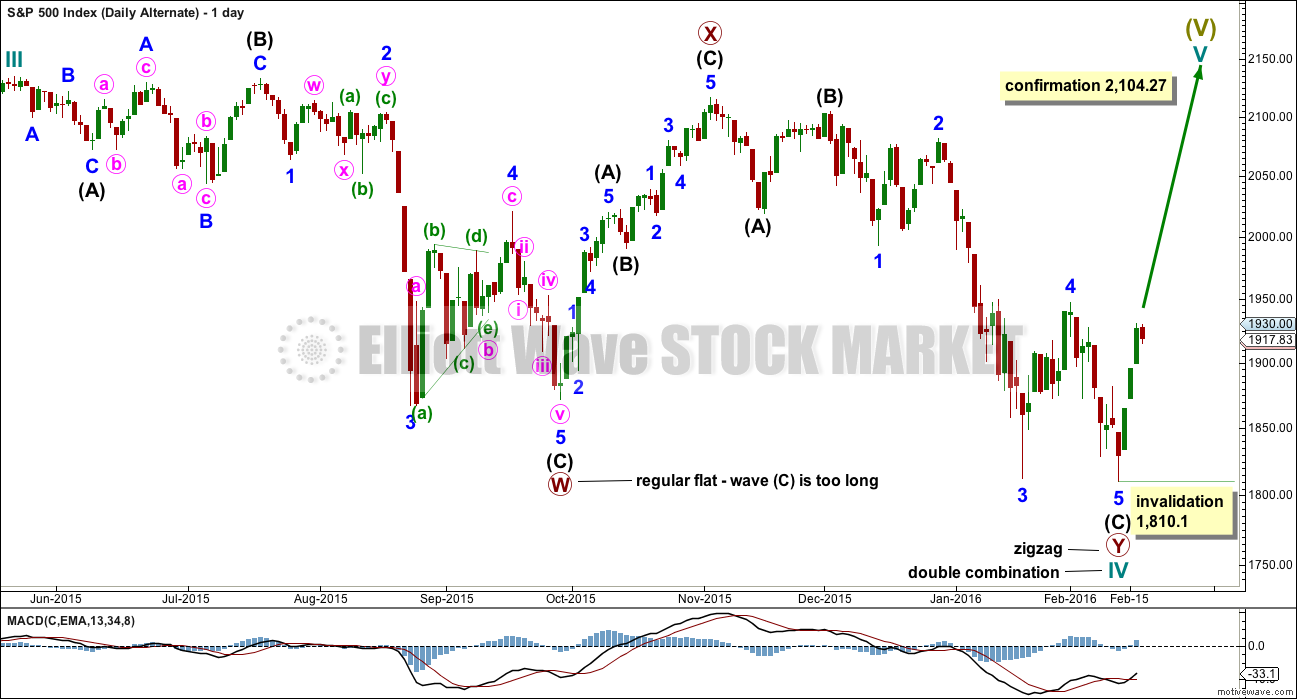
If cycle wave IV is a combination, then the first structure may have been a flat correction. But within primary wave W, the type of flat is a regular flat because intermediate wave (B) is less than 105% of intermediate wave (A). Regular flats are sideways movements. Their C waves normally are about even in length with their A waves and normally end only a little beyond the end of the A wave. This possible regular flat has a C wave which ends well beyond the end of the A wave, which gives this possible flat correction a very atypical look.
If cycle wave IV is a combination, then the first structure must be seen as a flat, despite its problems. The second structure of primary wave Y can only be seen as a zigzag because it does not meet the rules for a flat correction.
If cycle wave IV is a combination, then it would be complete. The combination would be a flat – X – zigzag.
Within the new bull market of cycle wave V, no second wave correction may move beyond the start of its first wave below 1,810.10.
I do not have any confidence in this wave count. It should only be used if price confirms it by invalidating all other options above 2,104.27.
BEAR ELLIOTT WAVE COUNT
DAILY CHART
Click chart to enlarge.
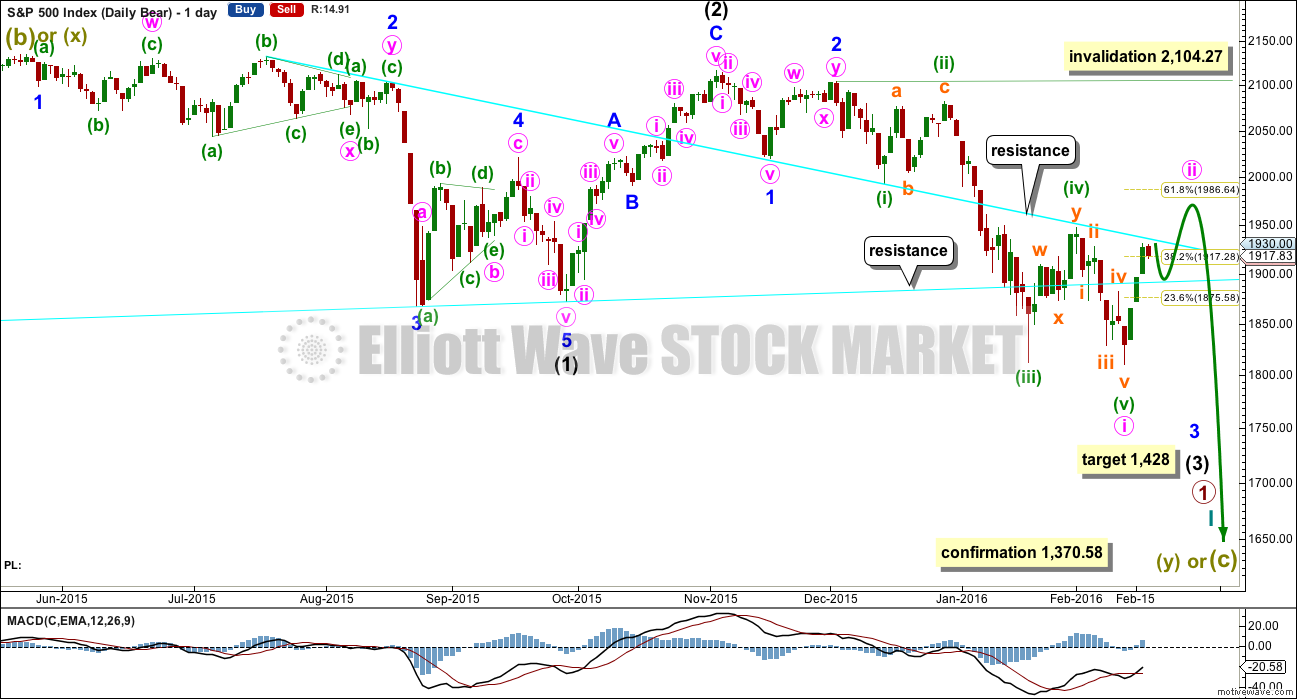
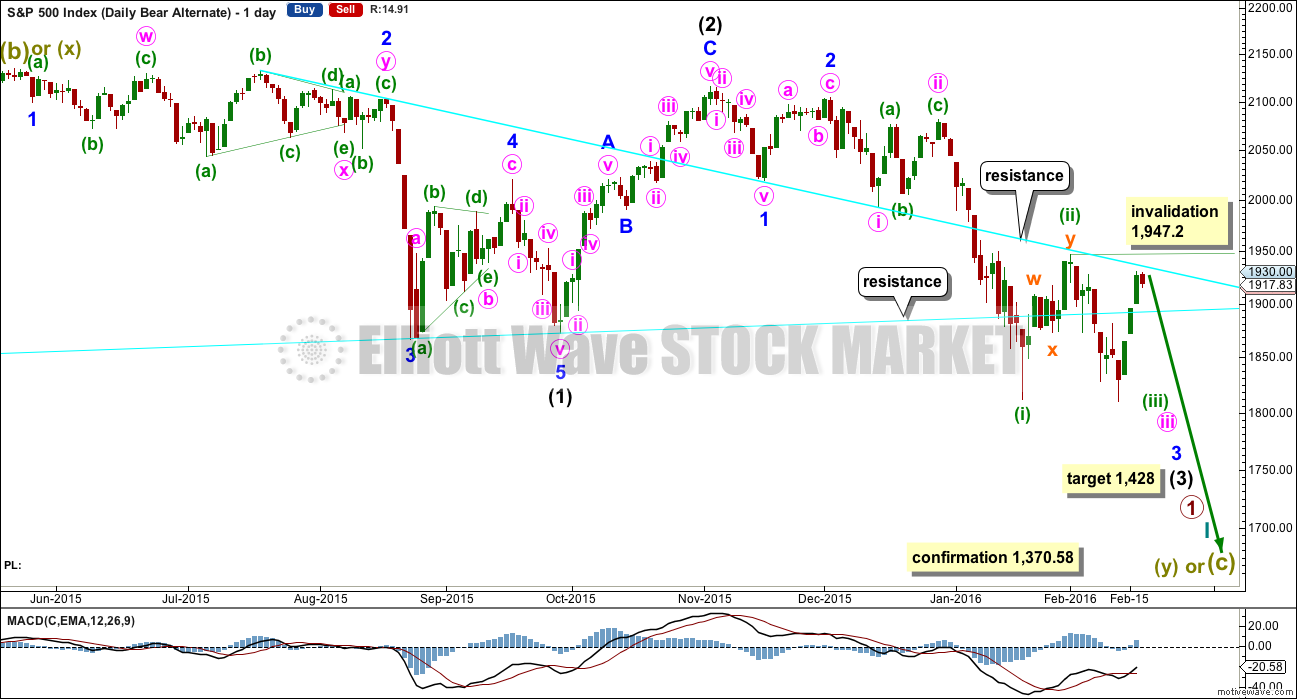
This bear wave count fits better than the bull with the even larger picture, super cycle analysis found here. It is also well supported by regular technical analysis at the monthly chart level.
Importantly, there is no lower invalidation point for this wave count. That means there is no lower limit to this bear market.
Downwards movement so far within January still looks like a third wave. This third wave for intermediate wave (3) still has a long way to go. It has to move far enough below the price territory of intermediate wave (1), which has its extreme at 1,867.01, to allow room for a following fourth wave correction to unfold which must remain below intermediate wave (1) price territory.
Intermediate wave (2) was a very deep 0.93 zigzag. Because intermediate wave (2) was so deep the best Fibonacci ratio to apply for the target of intermediate wave (3) is 2.618 which gives a target at 1,428. If intermediate wave (3) ends below this target, then the degree of labelling within this downwards movement may be moved up one degree; this may be primary wave 3 now unfolding and in its early stages.
Intermediate wave (2) lasted 25 sessions (no Fibonacci number) and minor wave 2 lasted 11 sessions (no Fibonacci number). If current upwards movement is a correction for minute wave ii, then it is likely to be more brief than minor wave 2 one degree higher. A Fibonacci 8 sessions would be most likely. So far it has lasted 4.
Minute wave ii may not move beyond the start of minute wave i above 2,104.27.
The most likely structure for minute wave ii is a zigzag, and the most likely target for it is the 0.618 Fibonacci ratio of minute wave i at 1,987.
HOURLY CHART
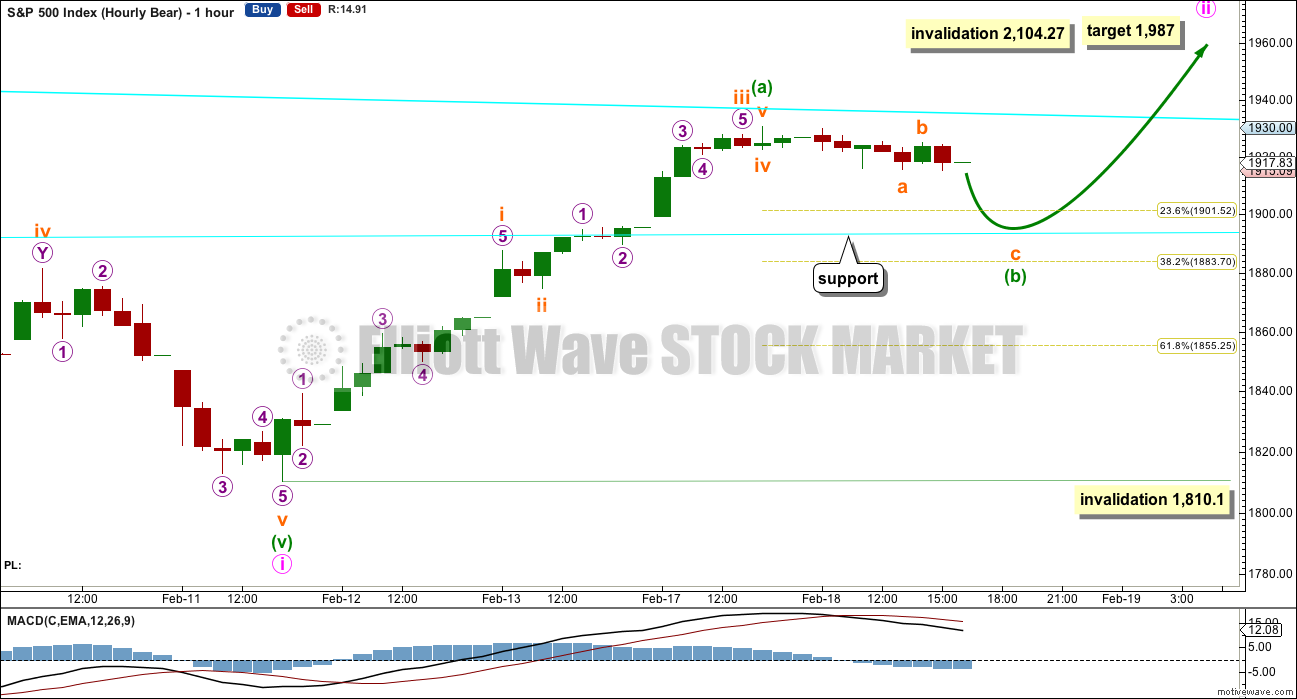
Click chart to enlarge.
Minuette wave ii is most likely to subdivide as a zigzag and most likely to end about the 0.618 Fibonacci ratio of minute wave i at 1,987.
Within the zigzag, minuette wave (b) should continue lower tomorrow. Minuette wave (b) may not move beyond its start below 1,810.10.
Minuette wave (b) may find support at the lower cyan trend line.
When minuette wave (b) is complete, then a channel may be drawn about this correction. Minuette wave (c) upwards may end at the upper edge. When the channel is breached by subsequent downwards movement, that should indicate an end to the correction of minute wave ii. The channel cannot be drawn yet.
FIRST ALTERNATE DAILY CHART
Click chart to enlarge.
This was the main bear wave count up until yesterday. With three days of upwards movement, price is no longer behaving as expected for this wave count, so it has reduced in probability.
It is still technically possible, but less likely, that the middle of the third wave of intermediate wave (3) is imminent. Subminuette wave ii may not move beyond the start of subminuete wave i above 1,947.2.
Price absolutely must find resistance at the upper cyan line. This second wave correction should end here.
SECOND ALTERNATE DAILY CHART
Click chart to enlarge.
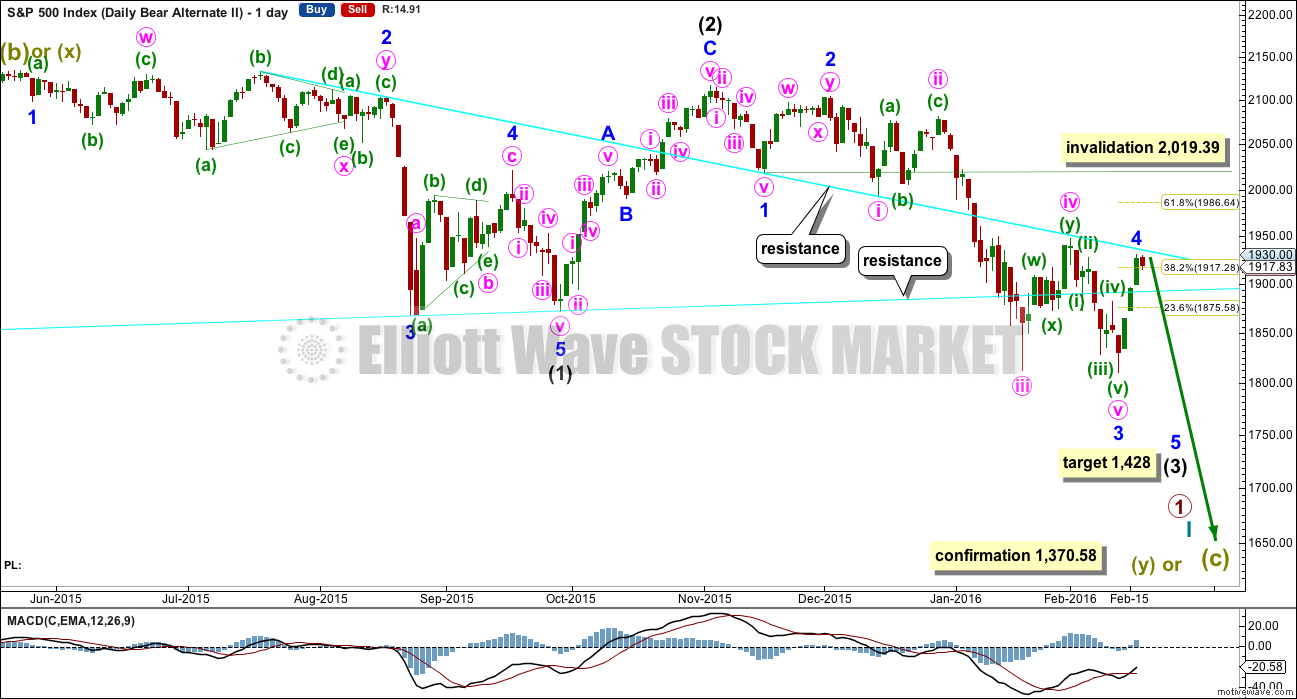
I have previously noted this idea in the text and now it is time to chart it, so that the implications are clear.
Within the downwards impulse unfolding, it may be that intermediate waves (1) and (2) are complete and now minor waves 1, 2 and 3 may also be complete within intermediate wave (3).
This wave count expects minor wave 5 to be extended within intermediate wave (3). Minor wave 5 should also show a strong increase in momentum, so that at its end intermediate wave (3) has clearly stronger momentum than intermediate wave (1).
There is no difference to the target for intermediate wave (3). This wave count makes a difference to the invalidation point. Minor wave 4 may not move into minor wave 1 price territory above 2,019.39.
This wave count also has a lower probability than the main bear wave count. This wave count would be more typical of commodities than the S&P.
Minor wave 2 lasted 11 days. Minor wave 4 may last a Fibonacci 8 or 13 days, so that the proportion between these two corrections is similar and the wave count has the right look.
Minor wave 4 would most likely be shallow and would be very likely to find strong resistance at one of the cyan trend lines.
TECHNICAL ANALYSIS
DAILY CHART
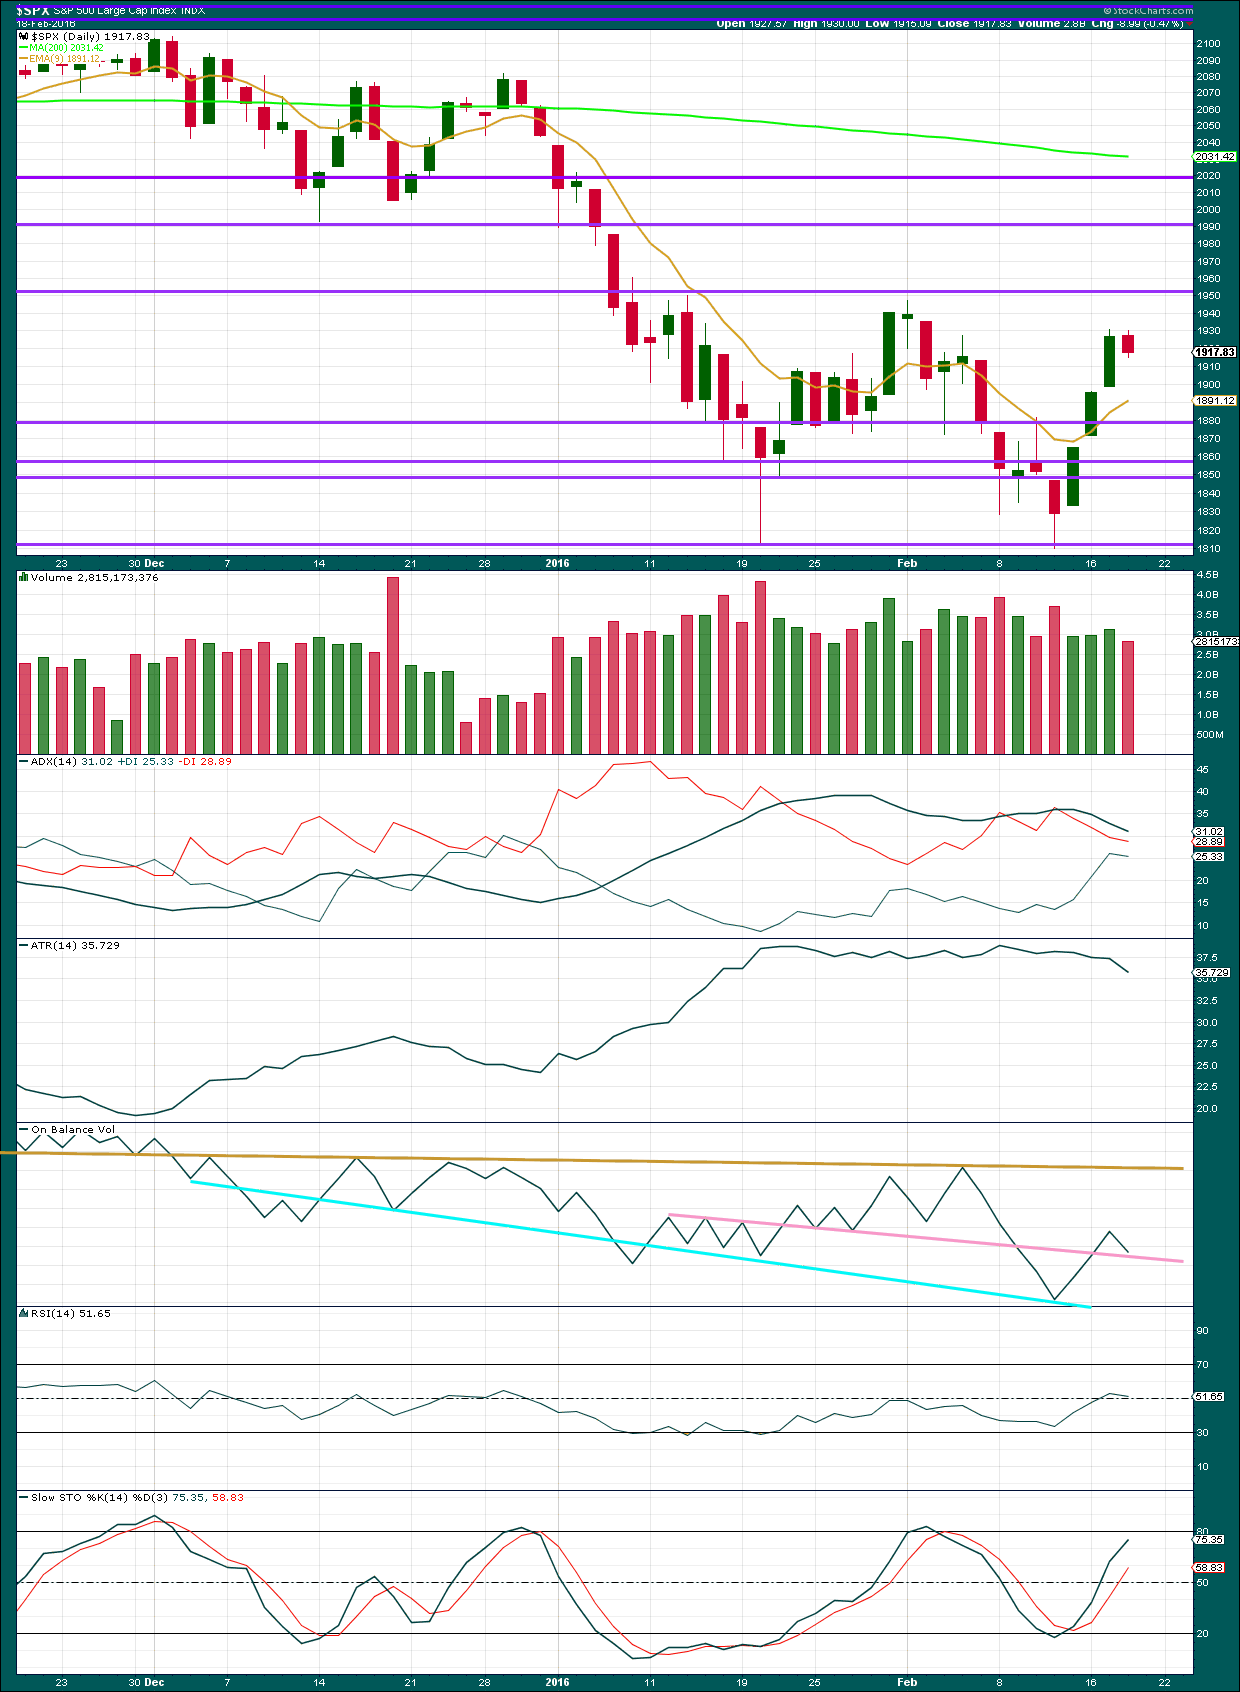
Click chart to enlarge. Chart courtesy of StockCharts.com.
Three days of strong upwards movement on increasing volume, and now a small downwards day on lighter volume, is bullish short term. It is only short term because the volume for upwards days is still less than volume for prior downwards days to the last low.
In the short term, volume suggests strongly that price is likely to continue higher. This outlook would only change if a strong downwards day with strong volume is seen.
ADX is declining indicating the market is not trending. Importantly, ADX has not yet indicated a trend change: the -DX line remains above the +DX line. While that is the case, it should be expected that this upwards movement is a correction against the main trend which remains down.
ATR is now also declining. This is clearer; the market is most likely not trending.
On Balance Volume has come down to touch the pink trend line. This line is reasonably shallow and repeatedly tested, but it is not very long held. It has reasonable technical significance, so it may offer some support. A break below this line would be only a weak bearish signal. The line may be overshot and OBV may turn up and move yet higher. The cyan trend line on price should be more reliable in this instance than this pink line on OBV.
RSI is neutral. There is plenty of room for price to move up or down.
Stochastics is not yet overbought. When it is and if it shows divergence with price, then it would indicate an end to upwards movement. It is not doing that yet.
INVERTED VIX
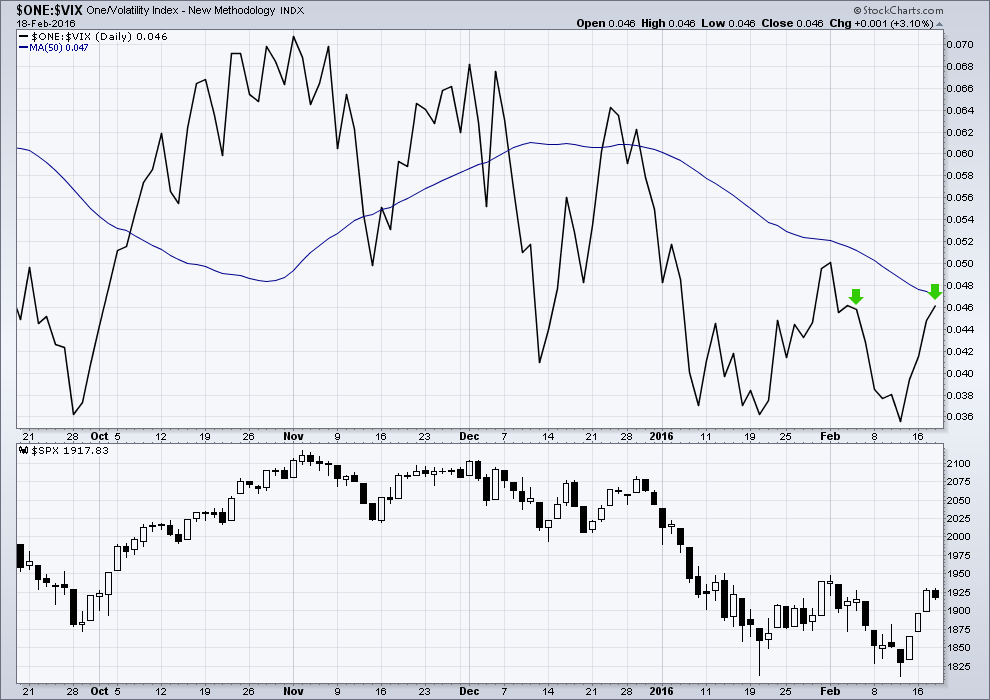
Click chart to enlarge. Chart courtesy of StockCharts.com.
I have found slight divergence between price and VIX from one day to the next a reasonably reliable indicator of an end to a movement.
Price moved lower today to complete a red candlestick, but VIX has moved higher (inverted). If the pattern observed previously with these small divergences persists here, then it indicates an end to downwards movement and price may move higher tomorrow. The Elliott wave expectation of more downwards movement for a small B wave tomorrow may not be realised.
DOW THEORY
For the bear wave count I am waiting for Dow Theory to confirm a market crash. I am choosing to use the S&P500, Dow Industrials, Dow Transportation, Nasdaq and I’ll add the Russell 2000 index. Major swing lows are noted below. So far the Industrials, Transportation and Russell 2000 have made new major swing lows. None of these indices have made new highs.
I am aware that this approach is extremely conservative. Original Dow Theory has already confirmed a major trend change as both the industrials and transportation indexes have made new major lows.
At this stage, if the S&P500 and Nasdaq also make new major swing lows, then my modified Dow Theory would confirm a major new bear market. At that stage, my only wave count would be the bear wave count.
The lows below are from October 2014. These lows were the last secondary correction within the primary trend which was the bull market from 2009.
These lows must be breached by a daily close below each point. So far the S&P has made a new low below 1,821.61, but it has not closed below 1,821.61.
S&P500: 1,821.61
Nasdaq: 4,117.84
DJT: 7,700.49 – this price point was breached.
DJIA: 15,855.12 – this price point was breached.
Russell 2000: 1,343.51 – this price point was breached.
This analysis is published @ 08:26 p.m. EST.
I have to share this,, I was reading the replies, as I was reading Laras reply that it was more than ok to share information that was the purpose of this community to share and hang out,, as I was reading it my radio here at the office was playing “We are Family”
And that we are:). I second that.
It’s growing, very nicely too.
I find myself hanging out more on my own websites 🙂
We have members with decades of market experience. Many members with not decades, but many years of experience. And many of you are kind enough to share that here.
With this depth of knowledge and experience we should all have an edge, and help each other profit. We can all learn something new every day.
I am humbled that some of you much more experienced than I choose to pay me to do your Elliott wave analysis.
Im just too lazy,, hee hee
no really, you must have studied extensively to master this analysis, I for one admire your expertise.
Count me also among the former subscribers of that “other” EW service, and I can echo what some of you have said. In my case I got burned, then gave them another shot a long time later–and got burned again. The differences between them and here, in my experience:
1) Lara gives us the alternates, with probabilities and invalidation points so we know what is happening in real time.
2) Lara never cheats on the EW rules;
3) Lara works out all the tiniest details, which really adds to the credibility of the projections.
4) Lara gives us projected wave lengths, based on the shape so far. (I’ve never seen anybody do anything like that to the degree she does.)
She’s better than some whole teams of analysts, in my view.
I fear we may have created an EWI lynch mob Verne 🙂
Oh my…. Pandora’s box!
My pitchfork is sharpened!
While I am very flattered (and I am also nervous, that’s a lot to live up to!) I’m not really that keen on running down the opposition.
I have no problem with members expressing their experience which is why I haven’t moderated anything so far out, nor with criticism of another analysts work based on technical reasons.
But please do let us all keep it respectful. Just a gentle reminder, in case this goes a little too far.
EWI have some very experienced traders in their team. Some of those guys have been making money on markets a long time, much longer than I. I respect that very much.
Oooops!! 🙂 🙂 🙂
No worries.
I simply cannot believe it. I just got what is definitely going to be my last report from those “other guys” doing EW analysis. Exactly what planet are these people living on? After all these years of being so woefully wrong about the market, while we here are just at about the point of discarding the bullish count, these jokers are doubling down on that call!!
Now I realise that some of our members may still favor that count and that’s O.K., but I think it is the ultimate irony that folk who have been trumpeting bearish noises the entire seven year run to the upside, are now screaming BULL!…after the bear market has in all likelihood arrived…what am I missin’???!!!! 🙂
In all fairness, they did opine that taking out the Feb 11 lows would finally and irrevocably put the bull count out to pasture…how nice! 🙂
Not at all suprised – they took me to the cleaners a few years back – my own fault of course – I should have fully understood what I was being told then I would have known if it was credible or not. Being EWI it should have been, but there you go – lesson(s) learned.
To be fair, their monthly newsletters analyse social mood stuff that you can’t find anywhere else, and there are some analysts within EWI who are incredibly good (their day trading services), but I imagine Mr H has to hire security nowadays. I don’t know how he still has a job (if he does – I’ve not looked at anything they publish for a couple years now).
I realise I am specifically naming them whilst others are being a bit more diplomatic, but I have been a subscriber so imo have a right to give a fair opinion about the service I received.
Olga I have to say that your bluntness is positively charming! 🙂
Also noteworthy (as probably not everyone here subscribes to Laras (superb 🙂 ) gold site).
I may be wrong (I’m sure Lara will correct me if I am), but Lara was made aware of EWI gold count by a member, which did not meet the EW rules (ending diagonal). Despite that, EWI continued to publish it (from what I understand from members on the EW Gold site).
Whilst the main outcome turned out correct (terminal move), Lara re-labelled the ending diagonal so it did not break the rules and the new labelling makes a significant difference to the way the rest of the structure may unfold in future. This is what you would expect – follow the rules and you will probably predict future moves with higher success.
Again I think Lara was baffled at the time as to why EWI would publish a count which broke their own rules.
I still am.
Completely baffled
I think you read it wrong… read it slowly again.
That is not what he is saying. Keeping both alive for now… They are on same page as Lara’s A B C main Bear Count… then down.
I agree with Joseph…the analysis actually has been pretty good lately. They called the last move down and the bounce pretty good.
Overall, I do agree that Lara’s analysis is very good, hence, the reason that I am here.
Steve’s count is similar to Lara’s, Prechter still sees a fourth wave in this month’s publication of EWT…
Yer must have money to burn Verne! 😉
he..he.. – Poetry…. 🙂
Not for long…! Those funds would be better put to use subscribing to Lara’s Gold analysis methinks! 🙂
Well…Prechter might be right. If we don’t start heading down south by the end of week next week we might start seeing 2000s. A broken clock gets to be right twice a day :).
It is possible that oil has made a major low at 26ish. We’re gonna know better next week…
I certainly understand that this is a possibility, however remote. What I find incredibly funny is that he has chosen this particular juncture to unveil his bullish side. I think the man is quite able, and really enjoy a lot of his work. I get the impression that once he gets an idea in his head about something, it takes an act of God (and seven years!) to change his mind. They have consistently been at the very bottom of Hulbert’s rankings for many years.
I have to admit I was really upset with them for a while but got over it when I saw the comic side of it and realized how much the experience taught me about using the gray matter in my own head! I use to jokingly e-mail Steve telling him what a great contrarian indicator he was. He is a great sport and took it very well. I have also recently noticed a bit more independence from his boss in his analysis which is a very good thing imo.
The way I read it is that all the possible bull counts are now complete and if the DOW sets a new Low they can all be discarded and only the Bear Count remains. That also includes at the Grand Supercycle degree which stated in 1784.
I have not been impressed with that service also! I cancelled my subscription recently. I think we get more value here!
I agree more timely value here.
They do provide me with good information overall that I have learned to put to good use.
Lara, is a much better teacher and the alternate counts give a great overview. The video is outstanding.
Quick note folks. The last five candles in SPX ending with today’s action, bear an uncanny resemblance to the five candles the index printed from December 21 to 28. We all remember what transpired after the sixth and final candle in the move, which, if the pattern holds, would be on Monday.
Stay Frosty! 🙂
That is what I was saying. It is amazing how things play out! No Jinx USA Index decline finally!
And thanks for having patience with newbie members like me 🙂
that would be groovy, however me thinks we will climb into the end of the month with that darn end of the month window dressing,, however I hope you are right,certainly weird stuff could happen over the weekend that puts the market into a tizzy, the mideast situation is precarious to say the least.
Thomas
That is great you have that background!
Question:
If you had to guess only. You think we fall hard here into march down to 1600 or sky rocket to 2000+?
If I had to guess then I think we are going a bit higher before going much lower.
Don’t you think the game of getting to SPX 2000 is getting old? Wasn’t 1 year or 6 months to much hanging around there 2040-2000?
You mean close to or near 1987? or higher like in the 2000s?
How do you think the monthly closes?
The last two days look corrective, so I think we go slightly higher and possibly just above 1947.2. I’m sure there are quite a few stops there.
I am getting a huge benefit from Lara’s guidance and this community and would like to give back. I have earned a living trading using quantitative systems that I have designed during the past 3 years. If there is interest from this group and Lara thinks this is an appropriate place to do so, then I can share some information on this topic. Have a great weekend!!
I’m interested, if you want to share
ditto – over the weekend(s) when the market it closed might be most appropriate – if it is ok with Lara?
That way it will not distract members from realtime trading setups / time sensitive advice from other members etc.
Just my 2 cents of course – and thanks for your very kind offer.
Such a kind offer Thomas. I too am always interested in learning. I like Olga’s idea of doing the bulk of it on the weekend.
I’m interested, please share!
I would be very interested!
Thanks for your generosity.
That would be awesome, if it’s ok with Lara, I’m new to the group btw..
Of course it’s okay!
That is what this community is for. Sharing, helping each other out, and hanging out here while we’re trading.
The more sharing the better.
As long as anything members share is not protected by copyright, and not coming from another membership source which is for its members only.
Then share all you like!
I posted information on quantitative systems in the comment section following Lara’s video update this weekend.
Check out how oil bounced when it was in a similar position as SPX. Just after oil took out the low of Primary wave 1, it chopped sideways. There was a rally with increasing volume during that period similar to what we experienced this week.
Thomas,
I dont know oil to be honest other than news and prices going up and down crazy. What date time frame is Primary wave 1?
Around August to November 2013.
Lara
Also, I ran the monthly here with technical percentage advancements.
Is this even a valid technical observation?
I compared the output and this 6 years from 2009 is well over +200%
Now i can see why 1550-70 is doable since that is only -26% from all time highs and it is possible within 10-11 months as we did that sort of decline back in 2008 as a guide only..
Just look at the percentage decline back down from 1550 to 666. 58%. Just wow!
Or to put it even more simply, what goes up must come down.
Try playing with some trend lines. Magee’s approach: in a bull market draw the trend line for support from the first two major swing lows. In a bear market draw the trend line for resistance from the beginning to the first major swing high.
The hardest thing is figuring out what are the major swing lows in the start of a bull market and what is the first major swing high in a bear market.
Try playing with it on a monthly chart for the last two bear markets on the S&P. Do it only on a semi log scale. Try playing with parallel lines.
See what you find.
And then try some trend lines on this current downwards movement from the all time high. See what you find.
Of all the TA methods trend lines are the simplest, easiest and often very reliable methods to figure out what may happen next. Where will a movement stop? Resistance and support. Throwbacks? They offer great low risk set ups.
Totally agree – incredibly simple but very powerful.
From a trading point of view, I rarely put EW labels on my lower degree charts as the pattern unfolds, but always put on base channels / trend lines at the very earliest opportunity. They provide much more clarity imho.
They often tell me what smaller degree count is likely playing out well before price confirms it.
Sometimes they can frustrate you (price going out then jumping back in), but that’s the nature of the game. You have to give price a bit of breathing space after the trendline has been broken to see if it’s bluffing or not. Your advice of hourly / daily candlesticks below / above but not touching has helped my success rate in that regard.
Lara,
Is this even a valid technical observation I just made below for projecting decline expectations this month and the following? As I understand the past as you said is only a guide but still it is something to reflect on.
What I am trying to further understand more as well is you had given the original 89 days fib which was just an approx estimate.
How do you pick the original start point of 89 days fib to start counting?
When I go do a 10 Months 3 major SPX declines from all times highs around -20% on average…
Ours from 2134 only at -16.8%
Is this analysis to simple and has no weight to it?
Simple is best. So no, nothing is going to be “too” simple.
What that says to me is that this bear market, if that is what it is, is moving more slowly.
And if its moving more slowly then maybe that is because it will be longer in time and price.
UVXY break of 42.50 means a low risk trade to the upside in SPX. Placing buy stop order contingent on 42.50 break to pad upside hedges. Have a great weekend everybody! ‘Bye… 🙂
10 Months 3 major SPX declines from all times highs around -20% on average…
Ours from 2134 only at -16.8%
This will be interesting month and next month candle for sure…
Trend Lines from both the 2009 low and the 2011 low… no matter how you draw them have both been beach.
The only other interesting thing. Is this market now has gone so far so fast over 6 years. Look at far it has to go do hit below 666.
How many years is this going to take.
Aren’t Bear markets faster than bull markets?
Usually.
They can still have slow consolidation periods within them.
It is the middle of their waves which are much faster and stronger.
What has happened in the past is what we should expect as most likely to happen in the future.
Except when it doesn’t.
And just because this time it’s moving more slowly does not mean that it’s not a bear market. Nor that it must speed up.
We have to apply flexibility, common sense, simple techniques and oodles of patience.
I surfed this morning and it was very frustrating. Much patience waiting for the sets to come. Waiting and waiting … and then boom! Riding the wave 🙂
Patience really is the key to many things I think.
IKR
And they’ve been breached for some time now…
Which is why I just don’t understand why so many analysts can still be bullish.
UVXY has put in a mini hammer on 1 min chart at 42.54. If we are going higher it really should take that hammer out before the close…
UVXY red SPY red 2 days in a row now
That is a bit strange, no? Maybe a new signal of some kind as I don’t think I have ever seen that happen…maybe enthusiastic bulls selling it short in anticipation of a move up? Prospectus says short interest does not matter as shares created as needed to reflect VIX futures… 🙂
Usually a short sale ban quickly appears on IB when UVXY starts falling, but nothing showed up today as yet.
Don’t know what level they limit short sales but must be quite high I would imagine. Not sure if it’s based on what levels IB users sell short or the whole market.
Alison – FTSE has retraced but not by much.
I can count a seven down. That is corrective.
It is possible that the retracement could be over for FTSE at the 0.236 Fibonacci ratio.
Draw a trend line along the top of the retracement on the hourly chart. When that line is breached by upwards movement then the probability that the retracement is over would be higher…
But remember, that also could be just wave A of a larger more time consuming retracement. As always, use this Elliott wave analysis in conjunction with your own preferred technical indicators and methods. Weigh it all up and make your own decision. I cannot advise you in this instance, there are too many variables for me to make a confident statement of what FTSE will do next…. continue its retracement down or make the next wave up from here?
Again for FTSE overall I’m expecting more upwards movement. If it breaks above 6,115.1 we would have clarity; it would be in a deep second wave correction.
It looks like minuette (b) may now be complete. It looks like a three wave structure and has reached the 0.236 Fibonacci ratio of minuette wave (a). I think today it may be forced to be very shallow due to the strong support of the lower cyan trend line.
So if early next week we have upwards movement then this wave will have a clear three wave look to it on the daily chart.
Now, the S&P fairly often has waves that look clear. But not always. It’s not as nice as Gold. So the first bear alt is still viable and still possible… which means the possibility of the S&P going into free fall on Monday / Tuesday exists. Surprises. To the downside.
What I think is more likely is another wave up. If it breaks above 1,947.2 then at least we shall have a little more clarity; one of the daily bear counts would be invalidated.
So what happens when buyers vanish for risky assets ? These tight moves are leading indicator or lack of participation … More to come
That is the spark in the room filled with volatile gases- a lack of liquidity…
Olga – Oil has broken below my short term support line. Now I wait for a throwback to enter short. It looks like it will close below the line. So the throwback may take a few days – another day down, then maybe a day or so up.
Thanks for that Lara – very much appreciated 🙂
Selling April 1 40 UVXY puts for 6.50 Willing to be assigned 1000 shares at 40.00 price. Cushion down to 33.50
You really think it will go down that far on this leg… I hope causing right now SOH for me.
It could. It tends to make a sharp move to the downside just ahead of a moon-shot. I would be comfortable holding onto the shares and selling covered calls if I get assigned. I doubt it will though…
Also picking up SPX next week expiry calls to hedge short term…
Which ones on SPX? I suspect we might not see ramp to 1987 as this market doesn’t feel ready for it.
SPY 193.50. I think you are exactly right. I expect a typical manic C wave up on Monday to conclude the correction. I already entered my STC order on those calls at a reasonable price target for Monday. I have a feeling the reversal is going to nasty, brutish, and short, with all due respect to Mr. Hobbes. Thankfully, we have seen enough of these recently to know better than be caught chasing them. I hope to bail as soon as C hits about 50-60% of A. 🙂
Well said!
It sure would be nice to see a break from yet another wedge one way or the other. I still am looking for a sharp break to the upside but it seems both sides are keeping their powder dry…smart to watch and wait I think…
I just do not see the speed of the bear rally anymore. I also see the selling being exhausted on such a short time frame – weird.
Another consolidation ?
The one thing I will note is we now have a small “double top” it looks nice.
Bollinger band is stuck right there and 50DMA is right there 1953ish.
So, not sure the kiss the moving average rules apply anymore. Something I am looking at.
If we goto 2000+ or 2030 in 3 weeks and the MACD goes to the 0 line – I will be convinced that was the clue this whole time..
Discard. I just got clarification on B wave speed.
Joseph
So at this point as I understand the other EW analysis you have also favors a huge decline just weeks away.
If we recapture 2000+ does all that analysis change for another long term date in 2016? Which means we are in a longer term slow bear market?
Not necessarily… made change same as Lara. But I have been reading them so long I make my own probability decision on weather to follow that change or not. A lot of other factors going into my gut feeling.
In my view there are two things to trade…
1. Trade the noise.
2. Trade two degrees of longer term moves.
If you trade the noise… you are in and out either the same day or ~ three days at max.. Next degree noise… 4 days to 3 weeks.
Most of my position is in 2. Except for March option trade I put on the other day which is a trade for the 2nd degree noise.
For 2 (bulk of capital), as long as the market doesn’t move against you immediately I stay firm. But you have to be willing to watch profits grow then shrink, grow then shrink again. You always have to evaluate your longer term view. Trying to trade this bucket of funds reading the noise at both degrees causes you to make mistakes. As long as the longer term wave holds strong the probably is for large profits.
Good Points. This could get nerve grinding slow here if they can somehow control the decline. I have to go back to 3rd waves to compare if this is even remotely possible – but I sure hope not….
I still believe the 1st Bear Alt. daily above will play out and move back to the higher probability. We shall see! Gut feeling based on all available information I have.
It is interesting even after 3 huge up days and being over bought on the small time frames with +7.8% SPX. We can’t even pull back 1% – true financial engineering. Now that is fascinating.
What is also confusing to me is I thought “Bear Market Ralies” are fast? This doesnt look fast to me here? Maybe we should wait till next week?
This is a small consolidation within the rally.
It’s a B wave.
They’re not often fast.
oh now I get it!
This is one interesting pattern circled here!
I think that is exactly what we are looking at potentially. I do think the reversal will be faster though since the magnet of the higher degree decline will be stronger…nice observation…thanks for pointing out that pattern similarity … 🙂
Thanks. I just am trying to find clues. Not sure if it means anything.
I hope you don’t mind but I went ahead and posted at the top about that pattern you identified. I think it is that important.
Very good advice.
The key to make No.2 work (imho) is getting in at the right price – otherwise if you’re wrong you will likely lose your shirt if you invalidate. That is why trading with the trend is crucial – if you do so then holding firm should bring you back in line with the right count, even if you were originally wrong.
Getting in at the right price is tricky as it generally means there is less data to work from (as you are at the begining of a potential larger degree move). It is particularly tricky right now because there are still bullish alts that have not been invalidated so we do not know for sure that the trend if def down, albeit TA suggest that the probability is very high.
Getting in at the right price also means you can watch the swings without getting over emotional whilst other traders at lower degree entry points pull their hair out 🙂
Easier said than done but certainly not impossible.
Got in near the top in May… sold half in August… Then repositioned the half I sold. So Yea, I can afford to wait. Like I said before I have been planning for this move for a few years.
Had a few false starts and Lara’s service help me to avoid a big mistake over that time.
I’ve almost considered ditching the bullish wave counts. Based on original Dow Theory we’ve had a major trend change. That doesn’t support any bull wave count.
The only reason I have not is my natural extreme cautiousness. The bear wave count is an enormous call to make.
So my modified Dow Theory needs S&P and Nasdaq to confirm.
I am waiting for that MDT as well and I appreciate your natural extreme cautiousness… as that helped me avoid a big mistake when the other EW called the Bear Count had started. So I am happy that I found your service back then.
I do have a question on that… Does that MDT have to occur within a certain time period in relation to the various Bear counts above?
Thank You
Joseph – I think that’s exactly the call I mention in my message below!
You were alot luckier than I!!
Sounds like we were riding the same rollercoaster 🙂
Lara had the Bull and Bear counts then as well if I remember correctly.
The other EW called Bear Count stared & I positioned short… market did go into a nice dip and then it bounced & grinded higher. I held through out. EW held to their view… I was getting worried and started looking for other EW views on the internet…. I found Lara’s service & signed up… she had alt counts all spelled out and she had a video daily back then too which was very helpful in understanding that the Bull count was not fully eliminated.
Anyway I think I got out of that with ~3% loss. That continued grind higher was very frustrating to me and what I was trying to do, position for the inevitable Bear!
So I am back here to stay.
I know history doesnt repeat and that is what I was worried about happening this time around. Just like Oct 2015 with that crazy bounce up from 1871 to 2116 until Nov 3. I shorted at 1980. I got chopped up and lost big.
That is why I searched on the internet for EW and how I came here 🙂
Another piece of data that has not been mentioned for quite some time is the aqua colored upward sloping trend line we were watching for many months going into the summer of 2015. It was from the start of the bull market back in 2008. As I recall, we were looking for a break below of 3% to mark a change in trend. That happened some time ago including a return to the trend line after the breakout below. Since then, we have been in the early stages of a bear market.
I’m rather glad you are extremely cautious to be honest Lara. At least that way we get to see all options that are on the table. Is the only way we can make informed choices and take calculated risks imo.
As an example – I used to subscribe many years ago to EWI. I lost alot of money because their bias caused them not to publish alternates until they absolutely had to – at which point my account was well in the red as I didn’t at that time understand enough about EW to see the danger.
This site is a goldmine to experienced traders, but whether they realise it or not for novice EW traders it is an absolute lifeline if only for the reason stated above. If I had found you in the early days I would have avoided alot of pain.
That said I now look back with no regrets – the lessons were expensive but they are valuable in any case and caused me to make it my business to understand what the analyst is saying so I can make informed decisions myself.
Me too! The guys “over there” finally taught me how to make money by doing the exact OPPOSITE of what their analysis recommended. And then, I too, discovered the very level-headed Lara…what a difference…! 🙂 🙂 🙂
Very sad as from what I understand they kind of brought EW to the masses.
Just shows how strong emotion can be – they *should* be the masters at this – they spout on, day in , day out about emotion, bias and the like.
Wonder where they went wrong? My guess is they made too many wrong calls so didn’t dare swap around the counts too much – put more value on number of subscribers (i.e. saying what members wanted to hear), than actual quality of service.
I’d be very surprised if anyone within EWI was actually putting their own money where their mouth was (or is) – I don’t follow them anymore so have no clue what they are saying now – though if my experience is anything to go by I would guess they probably only have one count right now – one that makes new highs and goes to the moon 🙂
Of course as the saying goes – even a broken clock is right twice a day.
They get a lot right as well (I won’t list it here)… But I like to have two different sources for counts.
EW counting is not easy to do as it is unfolding. Yea… it looks easy looking back.
Lara is always giving alternate counts to think about & include in the analysis + basic techs… Is why I like this service.
I still believe the 1st Bear Alt. daily above will play out and move back to the higher probability. We shall see! Gut feeling based on all available information I have.
I will only change my view if eliminated.
That is truly inspiring!
Honestly, I admire your persistence even with all these small moves!
You kept your stance.
That is what I am learning from all you guys – I just realized I need to learn patience!
“Money is made by sitting, not trading.” – Jesse Livermore
Hopefully we can get a better clue by the end of February to see what is the price level!
Exactly – until invalidated it is the correct count. It is only an Alt. because Lara viewed it as a lower probability at the time she wrote the update.
As usual the market is keeping us guessing as we have had lower highs and lower lows so no concrete confirmation that this move down is corrective or not. Move up above 1925 would provide a little clarity in that respect.
A move now below 1907.93 would help things along. I’m SOH until we go below there.
Lara’s 1st bear alt has my vote too.
FWIW, Hurst Cycle analysis shows a crest is rolling into a trough.
After around Feb 24th Hurst says there may be more downward pressure.
But just another data point, watching the price action for confirmation.
David,
I believed in that with full heart as well and I wanted that alt count too as my primary pick.
That was my first pick to be honest!
They say when you take a test and pick your first answer that is the best answer. If you change it then you are more likely to get it wrong.
I am trying to figure out symmetry here but not sure if that is even helpful to be honest!
Thanks for that information David – very useful. As you say it is just another data point but the more pieces of the jigsaw we see, the more chance we can guess the picture.
Price for me is also the sole deciding factor, but info like that is great for assessing probability of alternates.
Looks like it’s time to slap around the eager beaver bear cubs…don’t worry, Big Momma Grizzly waiting in the wings.. 🙂 🙂 🙂
O.K. Let’s see what the bulls have got left in their tanks. If UVXY clears 46.60 it would appear they are running on empty, so to speak. I do expect a pop to the upside…
Sorry a pop on UVXY or SPX?
SPX…
o.k. You made a point of Mr. Market tricks people which I accept now after all this market action. You still sticking with 1960-1970 to fool the mass and then terminate?
If that is going to happen, the bulls better pull it off starting soon…markets acting a bit skittish. We should expect a bankster cash dump to get things rolling; they don’t want this thing to get out of control to the downside I would wager…. 🙂
Dueling gaps in UVXY 45.55, 44.27
Almost green. I will wait for the close…
Vern,
I expect to see UVXY pushed below 44 level as a lot of congestion between 46-48 area when I look at PnF chart. TQQQ is another one to watch as it is reflecting the lack of fear now. 🙂
Yep! 🙂
The inflection point for my little canary in the coal mine (UVXY) is 50. If it goes over that number at any time today , although not expected, I think it would be significant…know whadda mean? 🙂
Another early clue would be SPX surrender of 1900, even if DJI lags….
I think we have several stages of the day that should give us the direction. It sure stinks when they slam it green in the last couple hours!
So far it looks bullish for UVXY!
RSI clean, 2nd doji on the daily at the moment…..
Closed my UVXY Mar 04 positions and now waiting to see if Mr. Market will provide me a gift. Someone is pumping the markets(QQQ) as they are trying to initiate another short covering rally…
Agree on PCLN but not looked at WYNN. Premiums on PCLN options are unreal
Oil is continuing to pushing lower but now we are not getting a big reaction from the SPX?
Ris
You made a good point about Mr. Market. Everyone is so convinced we are going to 1980 or 2000+. It will definitely be interesting to see how we close this month!
Insane! Stink bids open on March 4 1180 puts…. 🙂
Vern,
I see it going to about 1270 -1280 zone before any resistance so I am guessing your stick bids have that factored in.
Yep! 😉
Vern,
I want to see if QQQ gain some traction later into close before putting any stink bids in…
Any thoughts on TQQQ?
Chart a bit of a mixed bag. Most prominent feature seems to be resistance at 21 day ema. Fast stochastics also rolling so it looks like it may be ready to head lower..
The UVXY gap open today ahead of what should be a corrective wave is a bit unusual. If that gap is filled today, it is a gift horse…if it is not….well, need I say more? 🙂
It looks like it is doing a V Shape recovery on UVXY heading north?
It actually met an important trend line as Barry posted…
Looks like for now we have 2 things going for us on the down side SPX.
1. MACD – cross over down still on the 1hr SPX.
2. Huge open gap at 1860-1870.
Rodney
I noticed you wrote about the MACD separation and distance and not being near the 0 line which I share the same view but I am 50/50 on it and not confident that means we are still marching higher? Are you still concerned about that?
I base my analysis on a number of things. MACD is only one tool. Like all sentiment and other oscillating indicators, it can move to an extreme and stay there for some time. So those indicators are just guides. What I said earlier this week was that I took “note” of the fact that the daily MACD was at a relatively low position and I expected it to go higher before any sustained move down. That has happened.
Your question on the chart is “Does MACD have to go to zero before the next leg down?” The answer is “No”. The 200 point drop in the SPX from January 1st to mid January began with MACD just below zero.
While I would like to see it move above zero before I enter my next short position, that may not happen. I am still looking for a move to about 1980 or so. When we get there about, I will review the situation and decide what to do. Until then, I am just waiting and watching letting the market tell us what is happening. As I previously said, if the market breaks down before it reaches 1980, I will enter short positions as it is dropping. The move to 1500 and below, will present many opportunities to go short.
Lara has done a great job in presenting the possibilities and probabilities to us based on EW. The comments on this forum have also presented great wisdom. Patience is critical imo.
Thanks. I agree I need to exercise more patience…
I am a bit conflicted about whether to scalp the final upside move or wait for a UVXY pullback and load the truck….hmmmnnn….!!
I think I wait…. 😀
Oil down over $1 and more to come..cause traders wouldn’t want to hold on to the open position into the weekend.
Yep. Futures suggesting folk already starting to get a bit nervous. This is in keeping with my expectation for a quick decline this morning to complete a B wave, then a final whipsaw up to confound any quick trigger fingered eager beaver short sellers.
I plan to unload my short term positions at the open and stand aside for the final pop up. There are some fat pitches in the markets now with a few things trading at the upper end of their ranges and about to get hammered, like PCLN and WYNN….
If UVXY puts in a green candle today even with a market run higher I would not want to be long the market over the weekend.
Vern,
You mentioned yesterday or on Tuesday that Mr. Market likes to surprise the majority of investors. So just as we have the access to EW analysis, other around the world have similar tools and technical analysis access. I am more concerned about the BIG boys, hence wondering if everyone is waiting for the rebound to go short, maybe Mr. Market doesn’t want to give that opportunity or rather limit the opportunity somehow.
In the media it is now being reported that China selling US treasuries, Oil looking to dive again, earnings not looking good, I see a very good possibility for markets to crash sooner than waiting till end of month (it is not the end of Q so no big deal) to flush out the access before the real crash late fall or so. What are your thoughts?
I agree completely. I take Lara’s admonition about surprises being to the downside very seriously so don’t mind being temporarily underwater on a few short term positions. While I did leave a bit of money on the table by not making that UVXY B band trade with the same gusto that I have many times, these are not normal times and great caution is warranted. While I still expect one final wave up, I am sure so do many other observers, so Mr Market pulling a fast one would not surprise me in the least. The trading environment I think calls for mid and long term short positions to be firmly in place. Once the break to the downside gets going, sky-rocketing premiums make it tough for option traders to get a real advantage, even if price meets the anticipate target. Buying the inverse ETFs outright once the carnage begins is probably wiser (meaning more profitable!).
Agree on inverse ETFs vs. options UVXY 45 looking good after testing the 42-43 range 🙂
That is why I am here. Tons of experience and people that share knowledge. Hard to find that out there in those other subscriptions.
I did notice you mentioned grabbing a few. It will probably pull back a bit before heading North… 😉
Ris I don’t know what your expiration date is but you should be seeing a nice pop and may want to consider a timely roll… 😀
Picked a partial position in this drop, waiting now cause I want to see mid 50s to 60s next week 🙂
Volatility is going to unseen levels before this is over my friend. I backed up the leaps truck at around 26 awhile back…looks like another opportunity’s a’ coming… 🙂 🙂 🙂
Options Traders are keeping puts very tight, I guess they want to sell more CALLS first..
Anyone else been noticing this–when the markets go up, gold goes up; when the markets head south, gold goes up then too. Looks to be on a rocket.
Yes. I’ve noticed.
I’m expecting Gold is currently consolidating in a fourth wave. When it is done I’m expecting a sharp strong fifth wave up.
I see Gold within an impulse unfolding upwards which is incomplete, it needs two fifth waves to end third waves, and for Gold those can be long, strong and very surprising.
Hi
All
Does anyone here have experience with Bradley Turn dates?
Jack
The song of the week:
Eagles – Hotel California
https://www.youtube.com/watch?v=puHoadtIivc
Appreciate you Ace…
Jack
Np, Actually quick question since you are around at this time:
Is price target of 1,511 doable in March based on what you understand about middle of third waves? I am waiting for the next 4 days to see how high this goes. But I am also trying to understand am I looking for something that is to far out for March drop?
Ace anything is possible…1511 end of March…Maybe (if a big third hits)
1700s to 1800s is more like it.
Ace, you have got to take the market one point and one decision at a time. Daydreaming about 1511 at the end of March is a big mistake. You’ve got to take the price action, resistances, sentiments…all into account, and everything is subject to change. So, talking about end of March…
See, I am 99% in cash. Been there since Wednesday when I took profit off of that oil spike. So, I’m not gonna assume a number and jump into something till I see a good tradable and profitable setup. Remember bear markets are more about capital preservation than loosing money on long/medium/short term short options trade.
I think next week is gonna a big week. We just have to see how these markets are behaving.
Thank you!
I really am a novice to bear markets!
It is definetly different.
Hey King,
Keep this in mind–if you buy March puts with a strike at 1511 and the market actually falls to that level by the expiration date, you will make nothing. If you are not in the money by expiration, you don’t make one thin dime. Lot of guys don’t understand this.
Thank you I get that!
Saudi killed the oil output deal, down goes oil and markets along with it.
I’m not seeing the headline
http://www.theglobeandmail.com/report-on-business/international-business/african-and-mideast-business/saudi-arabia-not-prepared-to-cut-oil-production-report/article28798164/
thanks for the link,, Saudi is saying they will not cut production,, but agree to a freeze, which is apparently at highs. So essentially the agreement is just a bunch of BS
I think it was really the Iranian oil minister that did it in. He told the Russians and the Saudis he was all for THEM capping their oil output …..he! he! 😀
Can you blame the poor guy? After 35 years of sanctions, they’ve got a lot of catching up to do and would only be too happy to take market share from anyone willing to surrender it.
Well, I’m content to wait. Its still a downtrend and I don’t like betting against it.
Joseph or Thomas or docbax or Verne,
Based on your understanding. Do you think it will be a sharp move down once we tag the last most likely possible upward target here at 1987?
For example: when we went down from 2080 to 1812 it took only 14 days.
As an estimate only – How long will the next move take from oh say 1960-1980 to “that level”? 1511??
See my point ?
sharp down,, third down ,, March down
Thanks Doc.
I am curious. Are you really a Doctor by profession given your name?
DC Doctor of Chiropractic
Oh nice!
I did the math again for 2008:
1255 to 839
Total 4 week damage from peak to end -34%
//
1440 to 666.79
-54%
Based on past history, I expect primary three down to arrive in the fall of this year, as this is the time of the most memorable market crashes. That means that between now and then we need to complete primary one down, and have a deep primary two second wave correction, which I expect to coincide with a new round of FED spiked punch, namely Q.E. Since we are just about in the middle of primary one down, I think a good rough estimate is that we finish primary one down this Spring, say around May after intermediate three down, four up and five down completes, then we spend the Summer in a last hurrah of a monstrous three wave move back up that takes us close enough to all-time highs to convince every one happy days are here again….AND THEN….!!!!
farewell, Spanish ladies… 🙂
Just my two cents…that’s the way I plan on trading it…
So what is your estimate of price target range for end of month March?
You see I am new to waves. So, I understand 5 subways within the 3rd wave.
If we are approaching the middle soon. Wouldn’t that be the most fastest part of it?
That is where I am not sure since I thought when a top is put in the market never looks back to backtest it. March 2009 to March 2016 is already enough.
2015 we spent 1 whole year putting a top in. This thing is toast.
Am I misunderstanding what your saying with close enough to all time highs? You mean 2134.72?
Look at Lara’s analysis. She has the various wave targets clearly indicated on the chart. The proper target to anticipate would be the one at the end of the current wave. It is impossible to say how early or late it will arrive but I think it is reasonable to assume that the current subwave (at minute degree) would complete by then. All the questions you keep posing could be answered easily if you take the time to carefully read the analysis and make reasonable assumptions. 🙂
The US Fed can’t do QE. No reason to imo. For what? They just started raising interest rates. The Bond market is reacting. The policy makers wont allow it. They have run out of tools!
Your Highness,
More than running out of options, it is now a matter of losing the trust and faith that investors have in the FED. So if you look at their track record, so far after pumping trillions of dollar, what have they achieved? Not a whole lot to justify pumping more into the markets.
True, but it is all about psychology, not reality. As soon as the lemming crowd hears “Q.E”, of course there will be an initial pavlovian response, no matter the abundant evidence of diminishing returns of the strategy the past several years. This last time it will not take the crowd long to get it. It could very well be that primary two up may depart from tradition and come to a swifter end than is usually the case.
Never underestimate the hubris of banksters…!
Very true!
I agree on the final target lower by end of year in general.
I was trying to understand what level is price for 1511. What is that in Primary 1?
See my point?
I do. The target for the end of intermediate three of primary one is 1428, so the target for primary one (the end of intermediate five) should be lower if there is not a fifth wave truncation. Lara posted on earlier charts that the 1511 target was for the end of either minute three or minor three I don’t recall, but I know she did indicate which one in her analysis. It really does not matter very much at this juncture. She generally provides more precise targets as the waves develop.
oh o.k. Thanks a bunch!
you all can post now.. 1st.
no way ,, a dead heat 8:48
Verne is on the bottom, so looks like I am just a loozer,, but I should still qualify for the hall of fame dont you think?
No doubt! You are consistently the fastest gun in the west so far 🙂
Good Evening! 🙂