
Downwards movement was expected but did not happen.
The alternate bear Elliott wave count is now switched to the preferred Elliott wave count.
Summary: The outlook must change today after three days of upwards movement on increasing volume. Volume is still light, and this movement is still expected to be a bear market rally. The target is now about 1,987 which may be met in another five trading sessions / days.
To see how each of the bull and bear wave counts fit within a larger time frame see the Grand Supercycle Analysis.
To see detail of the bull market from 2009 to the all time high on weekly charts, click here.
Last published monthly charts can be seen here.
If I was asked to pick a winner (which I am reluctant to do) I would say the bear wave count has a higher probability. It is better supported by regular technical analysis at the monthly chart level, it fits the Grand Supercycle analysis better, and it has overall the “right look”.
New updates to this analysis are in bold.
BULL ELLIOTT WAVE COUNT
DAILY CHART – FLAT
Click chart to enlarge.
This wave count is bullish at Super Cycle degree.
Cycle wave IV may not move into cycle wave I price territory below 1,370.58. If this bull wave count is invalidated by downwards movement, then the bear wave count shall be fully confirmed.
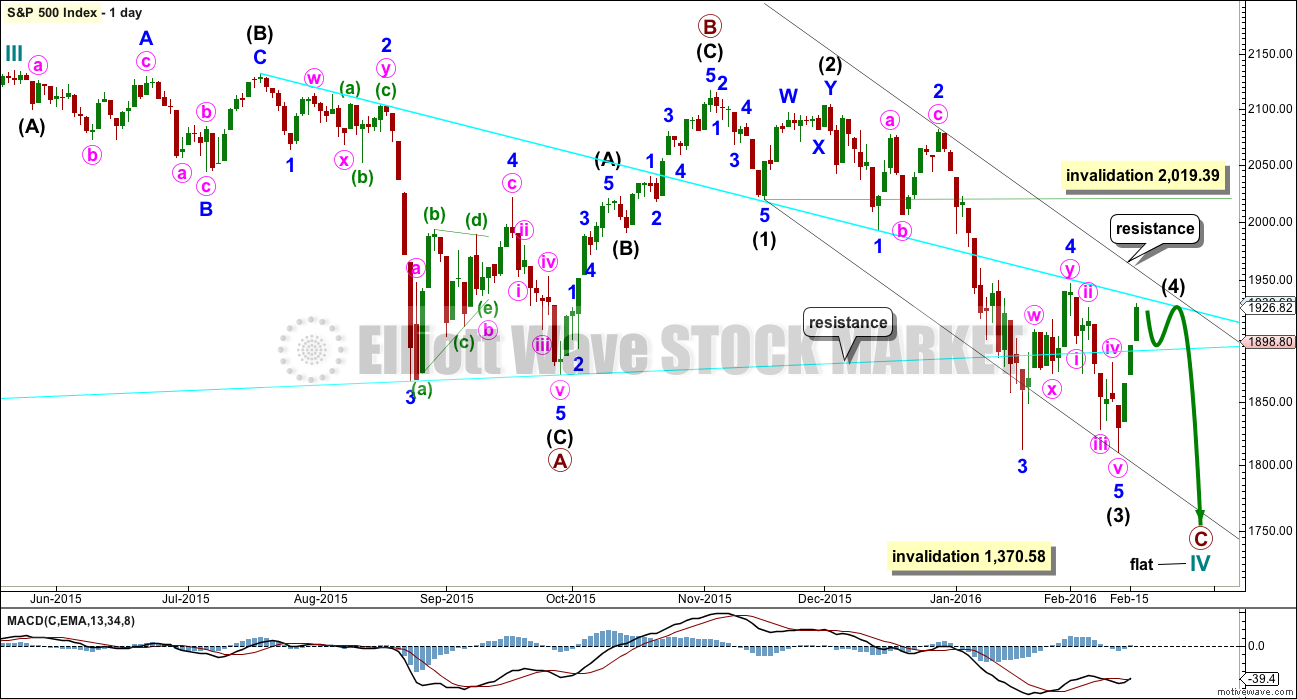
Cycle wave II was a shallow 0.41 zigzag lasting three months. Cycle wave IV should exhibit alternation in structure and maybe also alternation in depth. Cycle wave IV may be a flat, or combination. This first daily chart looks at a flat correction.
Cycle wave IV may end within the price range of the fourth wave of one lesser degree. Because of the good Fibonacci ratio for primary wave 3 and the perfect subdivisions within it, I am confident that primary wave 4 has its range from 1,730 to 1,647.
Primary wave C should subdivide as a five.
Within the new downwards wave of primary wave C, intermediate waves (1), (2) and now (3) may be complete. Intermediate wave (4) may now find resistance at the upper cyan trend line. This would see it end within the price territory of the fourth wave of one lesser degree.
Intermediate wave (2) was a deep double zigzag. Intermediate wave (4) may exhibit alternation, so it may be shallow. It would most likely be a flat, combination or triangle.
The idea of a flat correction for cycle wave IV has the best look for the bull wave count. The structure would be nearly complete and at the monthly level cycle wave IV would be relatively in proportion to cycle wave II.
HOURLY CHART
Click chart to enlarge.
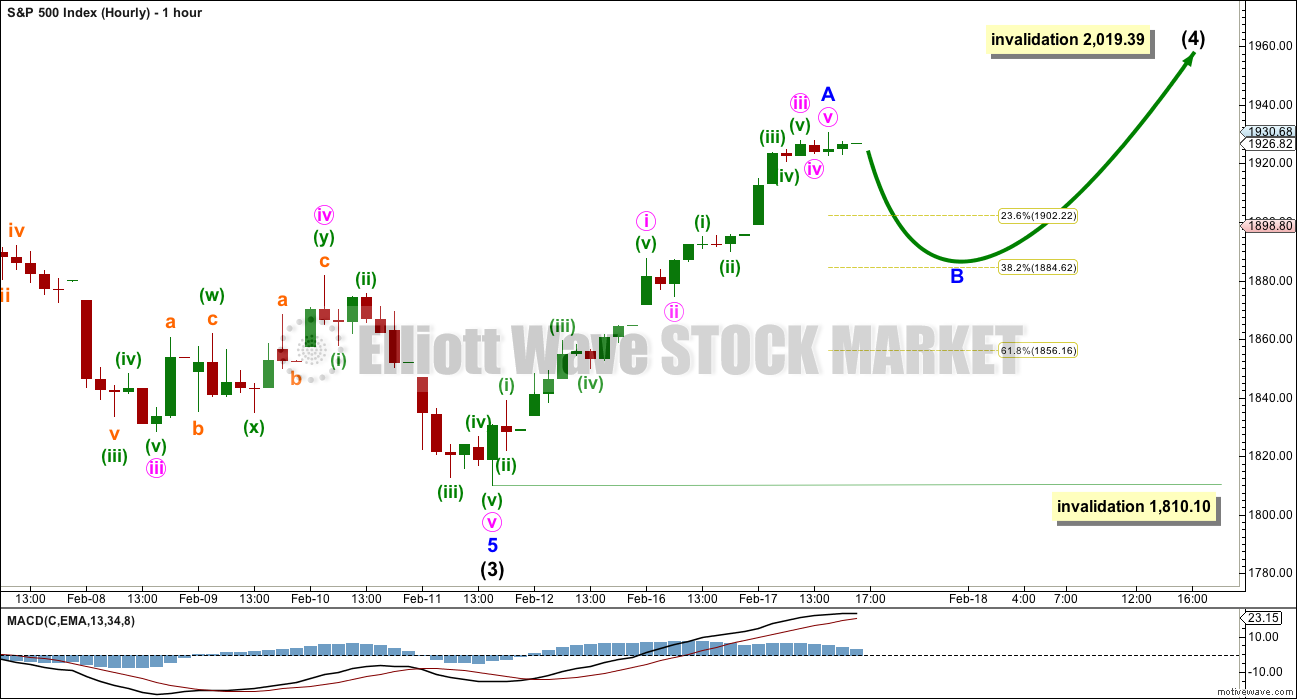
The first five up may now be complete. Minor wave B may correct to about 0.382 or 0.618 the length of minor wave A. It may not move below the start of minor wave A at 1,810.10.
DAILY CHART – COMBINATION
Click chart to enlarge.
This idea is technically possible, but it does not have the right look. It is presented only to consider all possibilities.
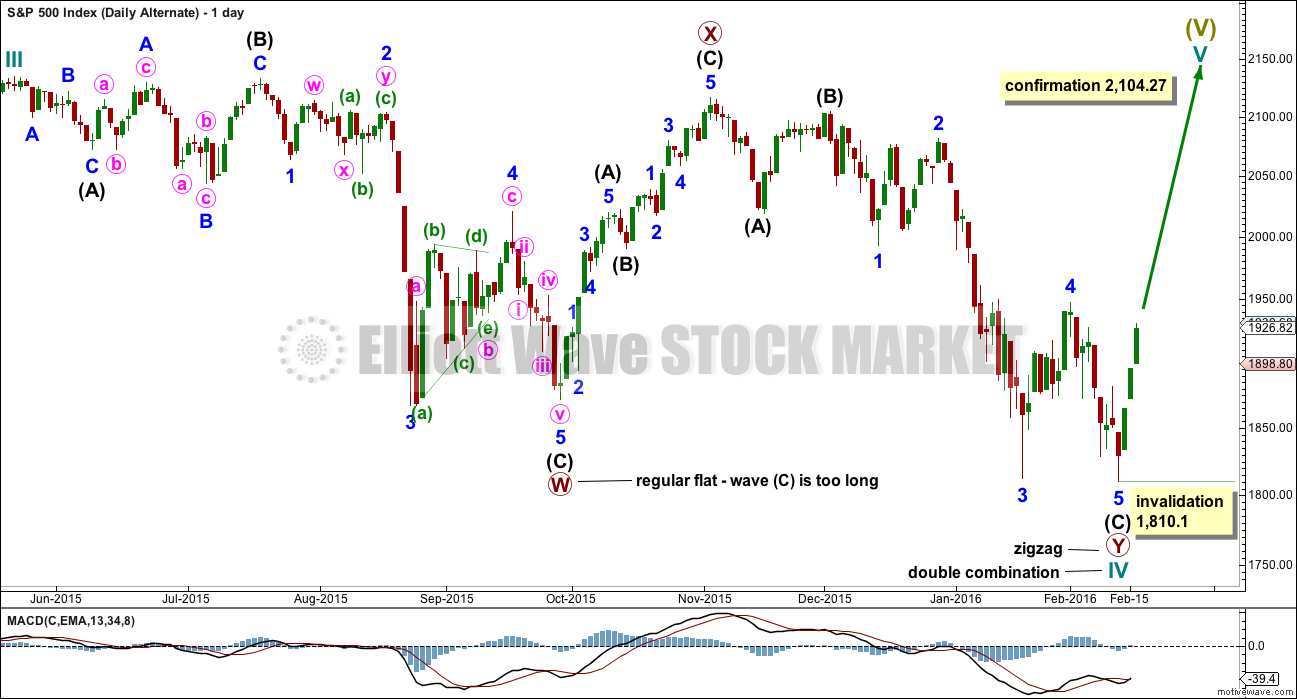
If cycle wave IV is a combination, then the first structure may have been a flat correction. But within primary wave W, the type of flat is a regular flat because intermediate wave (B) is less than 105% of intermediate wave (A). Regular flats are sideways movements. Their C waves normally are about even in length with their A waves and normally end only a little beyond the end of the A wave. This possible regular flat has a C wave which ends well beyond the end of the A wave, which gives this possible flat correction a very atypical look.
If cycle wave IV is a combination, then the first structure must be seen as a flat, despite its problems. The second structure of primary wave Y can only be seen as a zigzag because it does not meet the rules for a flat correction.
If cycle wave IV is a combination, then it would be complete. The combination would be a flat – X – zigzag.
Within the new bull market of cycle wave V, no second wave correction may move beyond the start of its first wave below 1,810.10.
I do not have any confidence in this wave count. It should only be used if price confirms it by invalidating all other options above 2,104.27.
BEAR ELLIOTT WAVE COUNT
DAILY CHART
Click chart to enlarge.
This bear wave count fits better than the bull with the even larger picture, super cycle analysis found here. It is also well supported by regular technical analysis at the monthly chart level.
Importantly, there is no lower invalidation point for this wave count. That means there is no lower limit to this bear market.
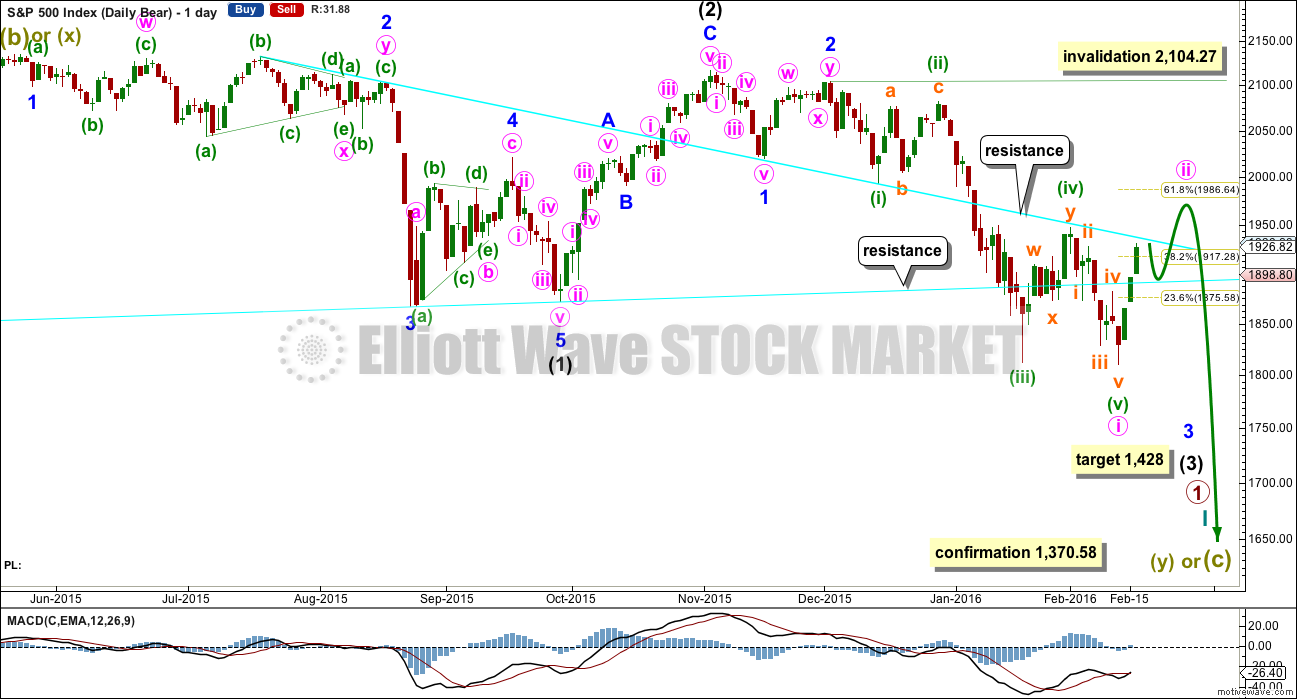
Downwards movement so far within January still looks like a third wave. This third wave for intermediate wave (3) still has a long way to go. It has to move far enough below the price territory of intermediate wave (1), which has its extreme at 1,867.01, to allow room for a following fourth wave correction to unfold which must remain below intermediate wave (1) price territory.
Intermediate wave (2) was a very deep 0.93 zigzag. Because intermediate wave (2) was so deep the best Fibonacci ratio to apply for the target of intermediate wave (3) is 2.618 which gives a target at 1,428. If intermediate wave (3) ends below this target, then the degree of labelling within this downwards movement may be moved up one degree; this may be primary wave 3 now unfolding and in its early stages.
Intermediate wave (2) lasted 25 sessions (no Fibonacci number) and minor wave 2 lasted 11 sessions (no Fibonacci number). If current upwards movement is a correction for minute wave ii, then it is likely to be more brief than minor wave 2 one degree higher. A Fibonacci 8 sessions would be most likely. So far it has lasted 3.
Minute wave ii may not move beyond the start of minute wave i above 2,104.27.
The most likely structure for minute wave ii is a zigzag, and the most likely target for it is the 0.618 Fibonacci ratio of minute wave i at 1,987.
HOURLY CHART
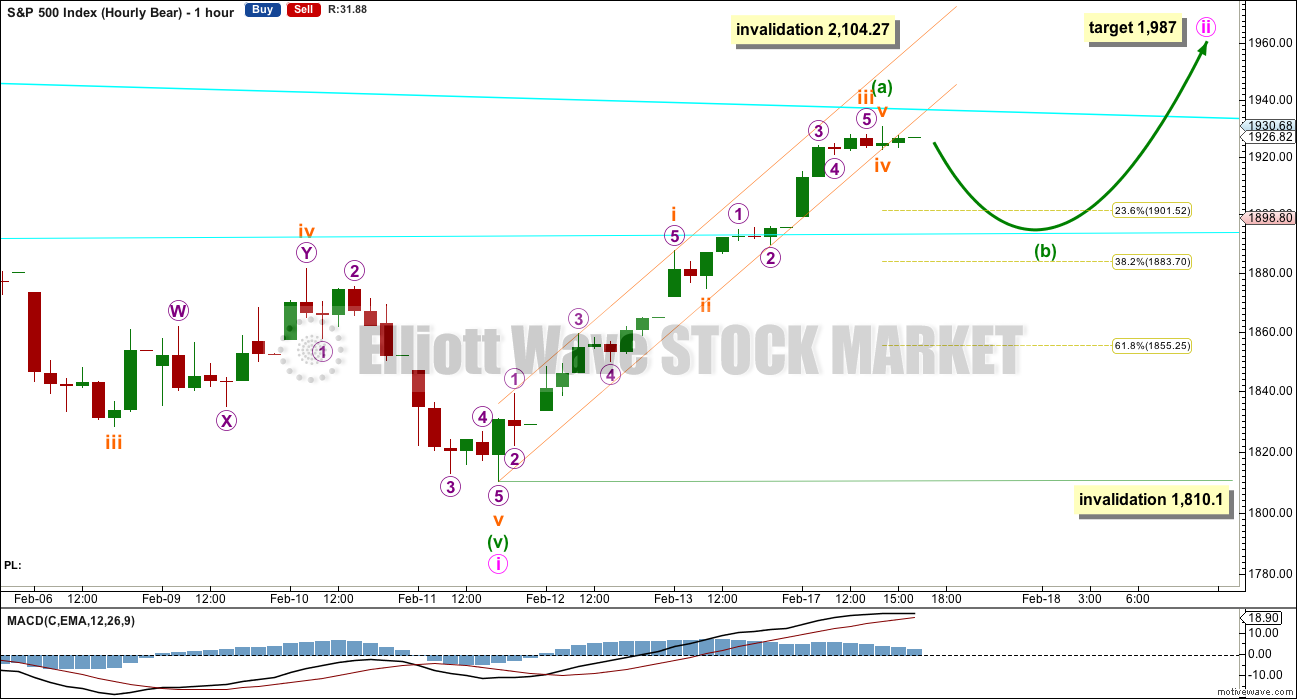
Click chart to enlarge.
Minuette wave ii is most likely to subdivide as a zigzag and most likely to end about the 0.618 Fibonacci ratio of minute wave i at 1,987.
Within the zigzag, minuette wave (b) should move lower. It may show on the daily chart as a red candlestick or a doji. If this analysis is correct in seeing minuette wave (a) as a five wave structure, then minuette wave (b) may not move beyond its start below 1,810.10.
Minuette wave (a) may end here about the upper cyan trend line.
Minuette wave (b) may move lower and find support at the lower cyan trend line.
When minuette wave (b) is complete, then a channel may be drawn about this correction. Minuette wave (c) upwards may end at the upper edge. When the channel is breached by subsequent downwards movement, that should indicate an end to the correction of minute wave ii. The channel cannot be drawn yet.
The narrow orange channel is drawn about minuette wave (a) only. At the end of Wednesday’s session, it looks like the orange channel is beginning to be breached. When that breach is clearer, then it should indicate minuette wave (b) is unfolding.
FIRST ALTERNATE DAILY CHART
Click chart to enlarge.
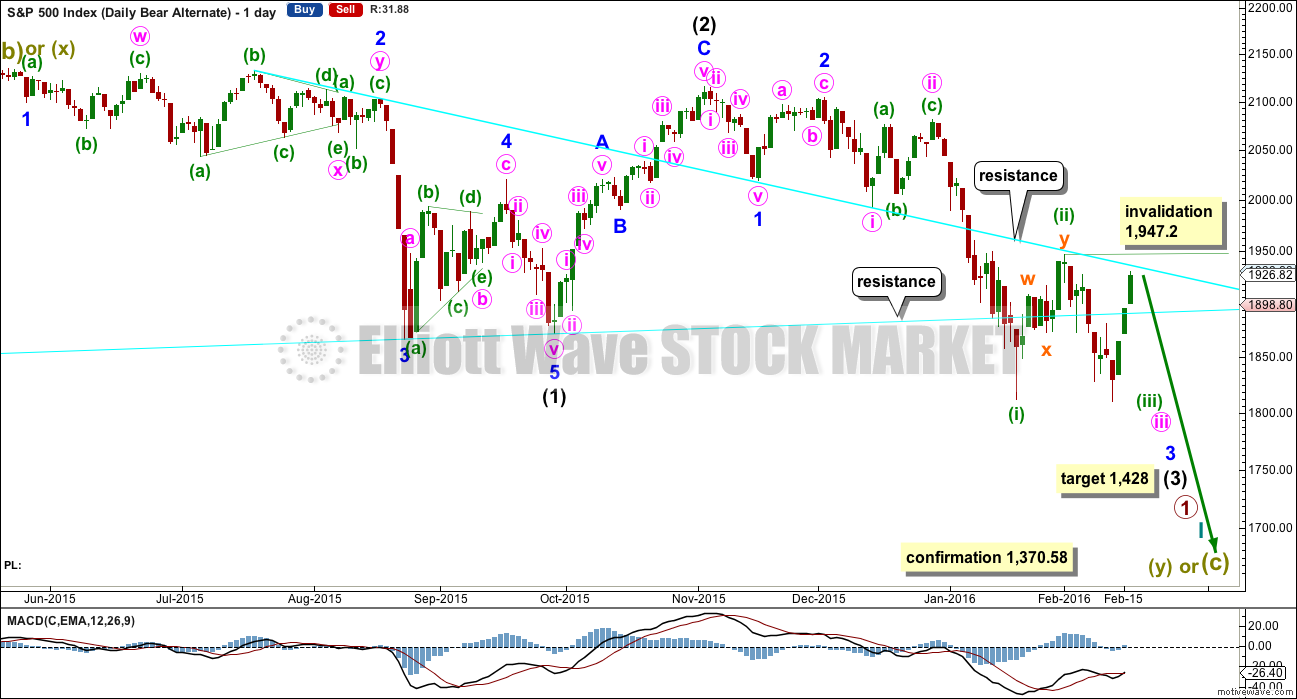
This was the main bear wave count up until today. With the last three days of upwards movement, price is no longer behaving as expected for this wave count, so it has reduced in probability.
It is still technically possible, but less likely today, that the middle of the third wave of intermediate wave (3) is imminent. Subminuette wave ii may not move beyond the start of subminuete wave i above 1,947.2.
Price absolutely must find resistance at the upper cyan line. This second wave correction should end here.
SECOND ALTERNATE DAILY CHART
Click chart to enlarge.
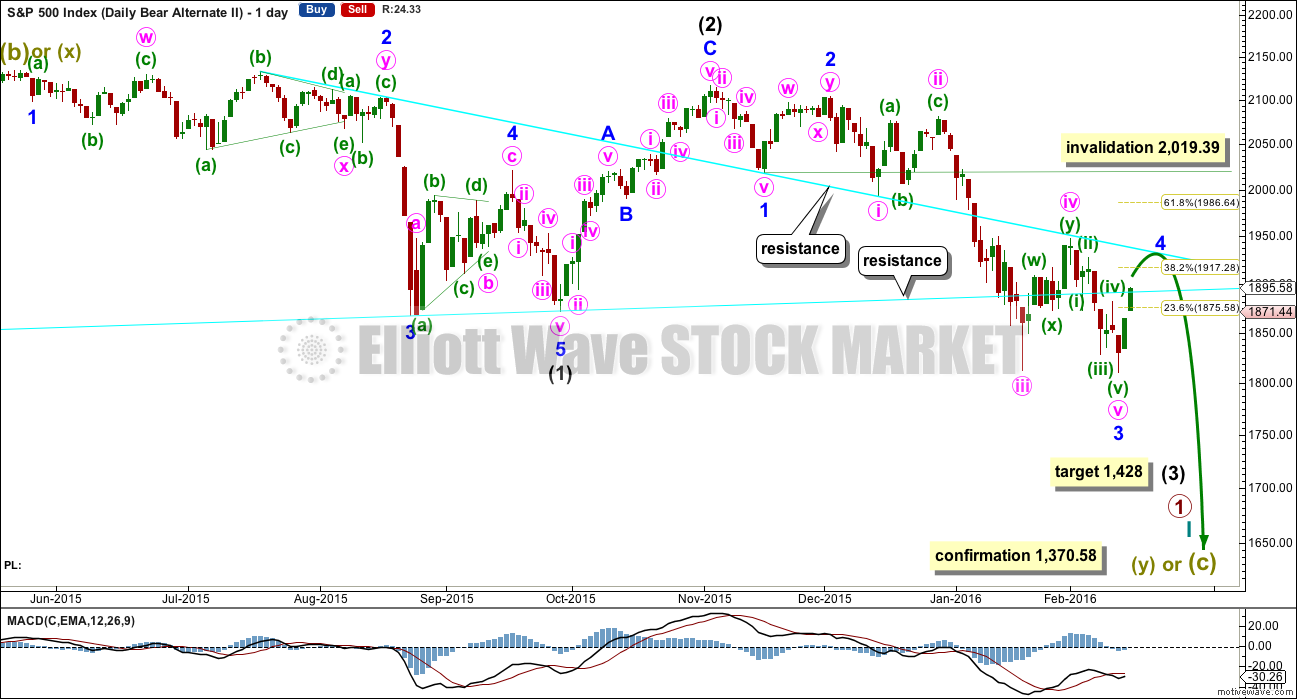
I have previously noted this idea in the text and now it is time to chart it, so that the implications are clear.
Within the downwards impulse unfolding, it may be that intermediate waves (1) and (2) are complete and now minor waves 1, 2 and 3 may also be complete within intermediate wave (3).
This wave count expects minor wave 5 to be extended within intermediate wave (3). Minor wave 5 should also show a strong increase in momentum, so that at its end intermediate wave (3) has clearly stronger momentum than intermediate wave (1).
There is no difference to the target for intermediate wave (3). This wave count makes a difference to the invalidation point. Minor wave 4 may not move into minor wave 1 price territory above 2,019.39.
This wave count also has a lower probability than the main bear wave count. It is possible that a fifth wave is the strongest extension within a third wave impulse, but this is less common for the S&P than the third wave being the strongest extension. This wave count would be more typical of commodities than the S&P.
Minor wave 2 lasted 11 days. Minor wave 4 may last a Fibonacci 8 or 13 days, so that the proportion between these two corrections is similar and the wave count has the right look.
Minor wave 4 would most likely be shallow and would be very likely to find strong resistance at one of the cyan trend lines.
TECHNICAL ANALYSIS
DAILY CHART
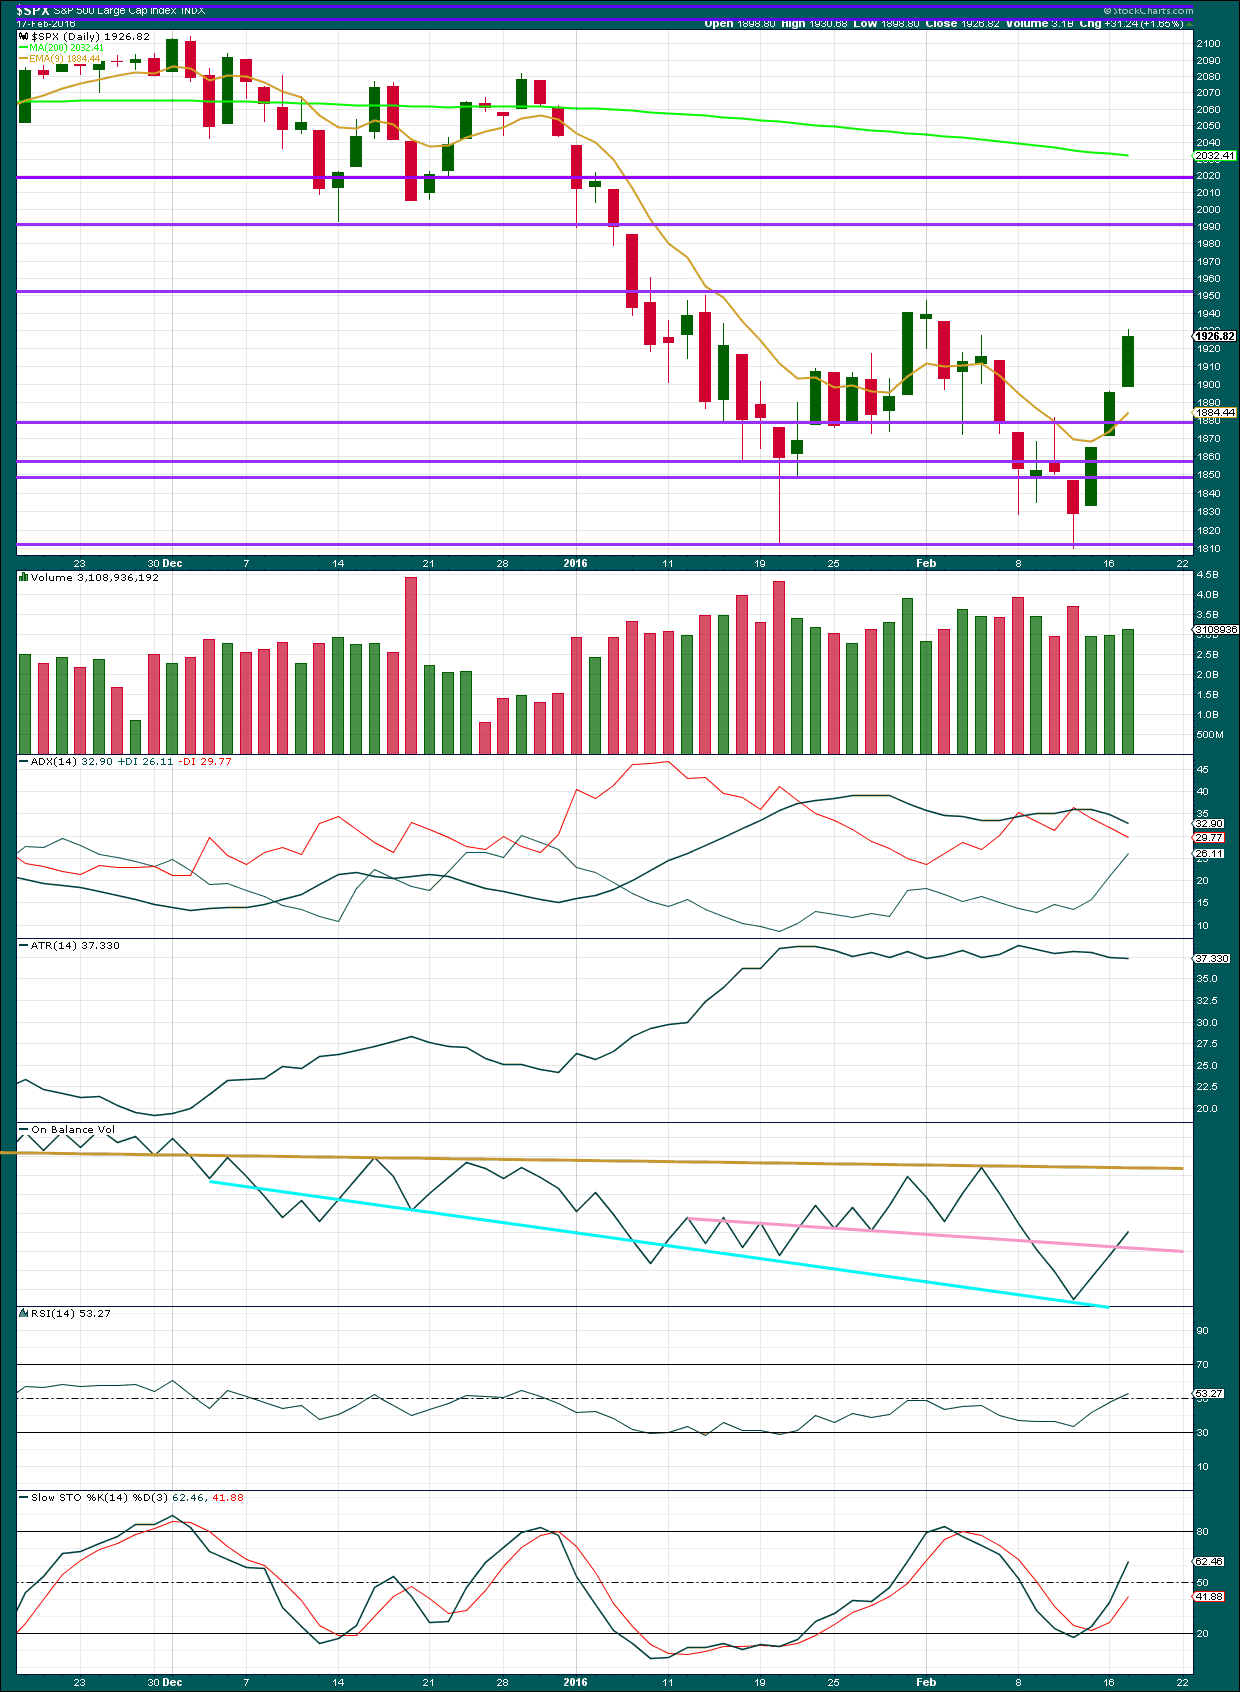
Click chart to enlarge. Chart courtesy of StockCharts.com.
Three days of upwards movement on slightly increasing volume is bullish for the short term. Volume for these upwards days remains lighter than prior downwards days, so this bullishness is short term only.
Price may find resistance at the next horizontal purple line just above 1,950. The next resistance line would be about 1,990.
ADX is declining indicating the market is not trending; it is consolidating. ADX has not yet indicated a trend change; the -DX line remains above the +DX line.
ATR is still flat indicating the market is not trending; it is consolidating.
On Balance Volume has breached the point line. The next line for resistance that I can find for OBV is some distance away, which allows reasonable room for price to move further upwards before OBV may help to stop the rise.
Stochastics is not yet overbought. RSI is close to neutral. There is room for more upwards movement in price.
There is slight bearish divergence between RSI and price: from the high of 1st February price has not yet made a higher high but RSI has made a higher high. This indicates some weakness in price. This divergence is a weak signal only though. It is not always reliable.
DOW THEORY
For the bear wave count I am waiting for Dow Theory to confirm a market crash. I am choosing to use the S&P500, Dow Industrials, Dow Transportation, Nasdaq and I’ll add the Russell 2000 index. Major swing lows are noted below. So far the Industrials, Transportation and Russell 2000 have made new major swing lows. None of these indices have made new highs.
I am aware that this approach is extremely conservative. Original Dow Theory has already confirmed a major trend change as both the industrials and transportation indexes have made new major lows.
At this stage, if the S&P500 and Nasdaq also make new major swing lows, then my modified Dow Theory would confirm a major new bear market. At that stage, my only wave count would be the bear wave count.
The lows below are from October 2014. These lows were the last secondary correction within the primary trend which was the bull market from 2009.
These lows must be breached by a daily close below each point. So far the S&P has made a new low below 1,821.61, but it has not closed below 1,821.61.
S&P500: 1,821.61
Nasdaq: 4,117.84
DJT: 7,700.49 – this price point was breached.
DJIA: 15,855.12 – this price point was breached.
Russell 2000: 1,343.51 – this price point was breached.
This analysis is published @ 09:23 p.m. EST.
Verne
I am just stopping by also to ask you as well a very technical question:
“Does this indicator for the MACD have to goto the 0 line first and then grind there for a while(2 weeks) before the next leg lower?”
Also, do you suspect that when this corrective move ends in the next few days. We would be in for a sharp move down? to 1700s? See I am trying to see if this next wave down will be like the Jan decline of 14 days from 2080 to 1812 or even faster.
See my point?
Think of what MACD means. Why would it? It is a tool, not a crystal ball, and there are nuances of HFT trading that can distort the signals. Ultimately all that matters is price action, and that imo is what you should focus on, even when using TA tools to help guide your decisions.
Thanks…
If any members are customers of Euro Pacific Bank please let me know and I’ll share some information about them I found out today (from them) which raises significant counterparty risk issues.
I realise that counterparty risk is a huge problem with any bank account (as well as numerous other risks) but given that they sell themselves almost soley as an ultra safe bank (they don’t loan out your deposit – they are a transaction only bank), all is not at all what it seems. Needless to say I cleaned out my account with them today and intend to put it into PMs during the current correction – there is no bank out there now that I would trust with any significant sum.
I realise this is not about trading but think it is very relevant to a possible wave 3 scenario so hope nobody minds.
By the way – this bank was setup by Peter Schiff post 2008, apparently to eliminate the risks faced when banking with other banks. On the surface it seemed like that was the case and it took me quite a while to get my probing questions answered directly. That on its own made me suspicious.
Schiff is quite respected in financial markets as far as I am aware, but he is certainly not being very transparent when it comes to his own bank imho
Thanks so much for your heads-up Olga. I am quite surprised to hear that about Peter, as I have bought precious metals from him myself. His dad fought a long battle with the US government over so-called “structured withdrawals” and lost, eventually dying in prison of cancer. So glad you were able to get your funds out safely. I am looking into banks in Andorra, Hong Kong and Indonesia where capital ratios are many times that of most Western institutions. Most folk don’t realize what is dead ahead. That goofball Larry Summers just wrote an opinion piece about getting rid of 100 dollar bills to get the “bad guys” engaged in “money laundering”. Believe it or not, the world’s safest banks are in Iran! Go figure…
Yeah – I’ve got my eye very much on the ‘ban cash’ cheerleaders. Personally I don’t think they will get away with it. When a few banks start to fail, the population will not agree to have everything they have in a bank – there will be riots imho. The best they might hope for it to stop printing new high value bills.
In any case my physical PMs should be a very good hedge if the sheeple willingly walk into that slaughterhouse. I have quite alot of physical cash (mainly USD & CHF) stored outside the banking system – I’m not quite ready to throw it away yet. Certainly can’t see Switzerland going along for the ride. The Swiss population are not quite as naive as other countries in that regard.
Olga,
Agree on Phyical PM comment and have been nibbling on both a bit.
Olga,
How about Canadian Banks of course relatively comparison to typical US or EURO bank?
The problem I have found with all banks is that you do not know who is the holder of your funds (there are usually counterparties between your bank and the Central Bank of the relevant currency), and in any case you are an unsecured creditor. To a liquidator the debt owed to the window cleaner is just as high a priority as your bank deposit – and legally so.
When banks go bust in future there will be bail ins, not bails outs. You will be repaid in bank shares. The larger banks have literally trillions in derivatives on their books – this is tantamount to a nuclear bomb awaiting detonation. When one large bank fails, there will be a domino effect due to counterparty interaction with other banks. Most banks in every developed country now are so attached to each other that they might as well be one huge bank.
That’s just what you need…. shares in a bankrupt bank!
And what Verne states about Iran does not suprise me. Sanctions probably stopped their banks getting in on the stupidity of the west. No doubt N. Korean banks are similar in that regards. Quite ironic.
That said, I won’t be rushing over to N.Korea to give Kim my deposit 🙂
Speaking of bail-ins, the COCO bonds are exactly what is causing the financial community to go CUCKOO over DB. Who are the fools that bought these things??!!
The banks in Canada are unfortunately facing the same problem many US banks had just before the financial crisis. Asian buyers have really bid up the real estate market and they are in a terrific housing bubble, although they will deny it. Australia has the same problem and I think a lot the mortgage portfolios of these banks are going to implode when the bubble inevitably bursts as global deflation takes hold. I am sure there are exceptions. Even in the US there are still small regional and community banks that are sound. The looming danger I think is going to be capital controls of all kinds…
Agreed – the only way around capital controls is forward planning, and global diversification. Banning cash is of course a capital control – don’t care how they choose to spin it.
I’ve been onto this since 2010 so hopefully will be in a better position than most. I have a deep distrust (and dislike) of all banks / financial institutions and the way they are allowed to operate with very little regard to what is morally right.
I live part of the year in Isle of Man during which time I am surrounded almost exclusively by banking / financial institution. I know alot of people who work in these industries and they are all great people. I also know some of the people much higher up in the chain. They generally view themselves as much better people than everyone else – they really are not good people (to put it mildly!).
BTW – Do not put any money that you don’t want to lose in an Isle of Man bank – the government has no debt (surplus actually) but they will not have nearly enough to come good on the deposit guarantee they are promising. I only have enough to cover bills / living expenses in an IoM bank (as do the banks employees!).
Only my humble opinion of course! 🙂
So by taking out large bills, Feds are indirectly forcing people to use less cash. Euro $500 gone, $US 100 on the block…
The theory is that it makes it more difficult for the “bad guys” to easily transport large sums of cash…as if they could stay in business without the major financial institutions all being complicit…they are going to find out just how brainless the idea is when the banks all find themselves with no deposits…
The real motive is to stop people storing cash outside the banking system. No more bank runs – spend your savings or watch them get dissolved away by negative rates.
Let’s take it to the bare bones here – cash is a store (usually) of your productive life / time at work / time you put into your education etc (which is finite). Taking it away through inflation / negative rates etc is tantamount to legal slavery imho. They are stealing something you gained by giving your productive time.
If they get away with $100 bills it won’t stop there. The ‘successful’ trial will give the green light to get rid of $50 bill next, and on and on….
They do mint a beautiful Isle of Man Gold angel… 🙂
I don’t think there is a mint in IoM (as far as I am aware??), so I presume it is made outside IoM.
On the subject of gold, global diversification etc, there is a gold supplier & storage company called IM Gold in Douglas (Isle of Man capital), who I can highly recommend having bought from them numerous times. Their commission over spot is the smallest I have found worldwide (1.6% for 1Kg from memory). You can buy and take delivery or store it with them. The security on the place is like Fort Knox (crime in IoM is incredibly low anyway).
The owner is a very pleasant honest chap who ‘gets it’. He set up the company as he can see exactly what’s probably coming down the road. You can go pick up your bullion and have a coffee with him, or they will ship it to you / store it for you.
http://www.imgold.com
By the way – Isle of Man in my opinion is quite safe from a government confiscation / capital controls point of view (imho). They have no debt so no reason to ‘dip into’ your stash. They are also not part of the UK (independent like Cayman etc), and not in EU.
That said – please do your own Due Dil. and keep your eggs in a many separate baskets as possible.
you know, this has been eating at me for some time now. We all know sooner or later this financial system is going to unravel. If it is as severe as some say, wont the brokerages we use be involved? potentially halted so we cant withdraw etc.?
Yes. I expect so.
During a strong move down we may not be able to access our accounts.
And at some stage I would expect short selling to be outlawed.
The news gets even worse…brokerage accounts are not insured by the FDIC in the US…caveat emptor…!
You raise a most profound question…
Not as if the FDIC is in any position to make the insured wounded whole…and there is going to be a lot of them sadly…timely withdrawals will be of the essence…
That is exactly what I have been doing. Downside is sometime you wish you had some more powder but in the long run this is much safe.
No kidding. It is really a bit of an irony that at the exact time making power trades could be the most profitable, is exactly the time they could be the most dangerous, in that despite executing the trade successfully, you could still be prevented from walking away with your capital… 🙁
I will worry about that once the mega profits are closed out. It will be a fantastic problem to have.
The analysis will be almost the same today.
This sideways move showing up on the daily chart as a very small red candlestick looks like the B wave within this bounce.
It may be rather shallow. Which would indicate C may be short.
So far price is finding resistance at the upper cyan line. If this B wave moves lower then look for it to find support at the lower cyan line.
C should break above the upper cyan line.
The target is the same. Another 4 days would see this correction have a duration of a Fibonacci 8. That is still the expectation.
I suspect B is not done yet. We will probably see an initial strong move down tomorrow to give things a bit better proportion and the final move up on a strong intra-day reversal. Just the kind of move to keep both bulls and bears frustrated in the short term. Have a great evening everyone!
Sorry to be a pain Lara but a view on FTSE would be appreciated.
Have a very large position at 5880 and would like to exit as close as possible to that.
A break even would be great anything more would be a gift from the gods!
Kindest regards
A x
Hi Alison,
Been there many times… 🙂
For what its worth I’m seeing the FTSE as topping out at 6036 today, and now expecting it to pull back to 5780 – 5800 area before a further leg up.
I’ve also entered into sizeable short (relative to my account) based on that projection so I’m as confident as I can be this will scenario will play out.
Good Luck
Thanks Stuart, appreciate your views.
So a 50% retrace of the move by fibs or based on other TA?
This is REALLY hard at the moment. Reading lots and the swing from bear to bull is mind boggling.
Actually using Oil as my leader at the moment, which is working okay. Notice that Lara feels oil may move lower, as do I. If this is the case I expect that the markets will move with it.
That is my ‘feeling’ rather than a sound TA argument.
I expect FTSE is extremely likely to move higher overall short term. How high? So far I expect it could be as high as 6,453.
But first it is likely to move lower tomorrow.
I could be wrong.
So far I can see a five up on the hourly chart. A three down may continue tomorrow. If it retraces the 0.382 ratio that is 5,831, the 0.618 ratio is 5,704. Those potential targets for tomorrow / maybe even two more days are about even in probability, 50:50.
BUT the risk to your position is the retrace is very brief and shallow. On balance of probability I would expect FTSE to move lower tomorrow.
I had two positions on FTSE. My first closed out for a small profit. My second took a larger loss. I’m out and waiting on the sidelines for FTSE at the moment.
Oil:
WTI has given up all of it’s gains today and has just turned negative < $30.66
Oil keeps hitting a trend line and turning down. Lower highs, lower lows.
I’m waiting for a short term support line to be breached before I enter short again on Oil.
HI Lara – what price is that support line at?
Its the lavender line on this chart.
I’m waiting for a breach, then I’ll enter on a throwback.
Let’s see how UVXY reacts to this trendline
Any chance that minute wave i hasn’t completed yet and we are still finishing subminuette iv?
You mean minuette four?
yes. minuette (iv).
not subminuette. Sorry.
No, because B is a five and it made a very slight new low below the start of A.
B waves can’t subdivide as fives.
The strength of the current upwards correction does have me wondering if it could be of higher than minute degree. I do think we had a fifth wave down last Thursday to complete an impulse down and time will tell how it should be labelled.
The Chinese have decided to go all-in supporting debt-driven growth in their economy and in addition to frantic short covering, the possibility of further stimulus in Western markets is no doubt also contributing to the current bullish sentiment a la Draghi’s intimations for next month. The Chinese decision to add to their already trillions of debt to try and keep the party going is interesting. It certainly did not work for the Japanese and just means an even bigger bust when the proverbial chickens come home to roost.
SPX has an open gap around 1940 and it will probably get filled this morning before some kind of brief correction and the final move up. The banksters understand stop losses and moving averages like everybody else so I would not be at all surprised to see price spike past some of the most commonly cited points where price is expected to reverse. I plan on unloading the rest of my short term trades on the next pull-back and SOH for a UVXY reversal signal. Have a great day everybody!
IMO… the world has maxed out using debt to create growth! The worldwide debt amounts currently on the books and the hidden unfunded liabilities on the books has crossed over into COMPLETE UNSUSTAINABILITY. That is the dirty little secret that is upon us. It will all implode any day now!
That is why the Bear Counts IMO are completely supported at this point in time by the fundamentals. Also why I believe that third wave is unfolding as this service believes.
I heard last night that during the bull market from 2009 to 2015, central banks around the globe made asset purchases of 12.5 trillion US dollars. 12.5 trillion! Like you said, this is all unsustainable. Many are claiming the US now has unfunded liabilities over $200 trillion. When it all crashes, and it will crash, it will be catastrophic.
$19 Trillion in US Treasury Debt to be $21 Trillion in ~18 months. I believe from the last time I looked at it… $70 to $100T in unfunded Liabilities.
But if you think the USA is bad… It is worse elsewhere by 2 to 3 times the USA in relative terms.
The global situation is unnerving. The last time I heard unfunded liabilities for the US, it was at 100 trillion, as you also heard. But yesterday, I heard a claim as to $200 trillion (not verified by me but a very reliable source). That is why I point out it is just claimed. I should have made that more clear. In either case, $100 or $200 trillion is beyond the reach of the US or any country for that matter.
OT – The gap of a few days ago on the daily chart (1868 roughly) causes me to take note. This could be a breakaway gap that often comes at the start of a relatively sustained move. At this point, I am thinking perhaps the counter trend correction we are in will touch the 200 day moving average. Of course, we wait and watch for more clues.
avnerilan,
SPX 2000 now?
His Majesty King,
we need patience now because the price moved horizontal. See gray canal, I think the Canal break down and then view on the short, but have to wait .
Ken Ei, Gut
Ani Tzarich Lalechet Achshav
Jack,
You around? To me this is the beginning of the correction and it can not be done in 5 days. We spent 2 months selling off and now we want to see a bounce in just 8 days and then go lower? Where is the symmetry in that? Could I be missing something? Am I just not looking at things of the market properly?
I have never ever traded the start of a bear market. So – I greatly appreciate your feedback!
In a Bear Market, a rally can be sharp and swift… then resume down. I guess we shall see if this is typical.
I am sticking with the alternate Bear Count for several reasons which I will not discuss here. Just my gut feeling based on all the available information (including fundamental) and EW I follow.
Advice… at some point you just have to make a decision based on everything you analyze, follow, read, view and listen to. After all it’s your money and you need to take responsibility for it. No one method or system or person is right all the time. It is all just a probability calculation… that is the key to all this.
Thanks Joseph. I am taking the day off. See you later!
Didn’t short this morning; didn’t get a setup.
For me, the most important thing to go in short or long is the price action. Lower lowes and lower highs, on 1 minute, 5 minutes, 15 minutes, and 30 minuets charts.
Thanks Jack. I am taking the day off. See you later!
Exactly. It sounds so simple, and really it is.
Wise words.
Again, please look at the last two bear markets 2000 – 2002 and 2007 – 2009.
Look at how long the waves down lasted, and how long and how deep the corrections were.
This is a bear market. Corrections can be swift and sharp.
The answers are right in front of you in the charts. Take more time to study them.
It will lift your confusion.
And remember, markets don’t always behave the same now as they did in the past, and they may not behave the same in the future. But the past is our best guide.
This is all an exercise in probability.
In my college days in NYC 1978-1982… Historical Bear markets then were described (and I always remembered this) as low volume downward movement… day after day after day after day for months on end. Death by paper cuts and a frustration that it would never end. Also had periods of big down days on higher volume also with very sharp & deep short term rally’s. The average person in the 1960’s & 1970’s wanted nothing at all to do with the stock market. That all began to change in the early 1980’s.
Bear markets of late seem to be very different. Maybe we have yet to have a real old fashion Bear Market… maybe after this specific 3rd wave perceptions will change.
Just some food for thought I thought I’d share with you all.
Interesting. Today we had a fourth straight day of contracting volatility, even on a day the markets declined. It has been quite a while since we have seen a string of consecutive declines in volatility like this. There is a stunning absence of fear in the markets, despite the way the year began. I think what is different is that this bear market is contending with unprecedented optimism on the part of the market participants; very much in keeping with a GSC top. One more wave up to go, and judging from market sentiment, it’s going to dislodge any remaining weak shorts.
Also I just searched on the internet for a description of an old fashion bear market using a few variations and I can find nothing of what was described to me in lectures from, I might add, professors aged in their late 50’s.
That I find very interesting… I will have to look for books published prior to 1978 for some documentation.
Nice, NYU or Columbia ?
Lara,
Thanks. Now I can go back and study more!
Another Technical Chart Question:
“Does this indicator for the MACD have to goto the 0 line first and then grind there for a while(2 weeks) before the next leg lower?”
Verne
Here my market understanding for any flaws.
1. We couldn’t even close under 1,800.
2. We had positive divergence days before we even hit 1810 before the bounce on the MACD.
3. Now 3.5 days and we are up 120 SPX points. No pull back.
4. Now we are looking for 1987 to be met in 5 more trading days including today?
5. Read Thomas quote from yesterday if you haven’t – it is brilliant:
“This is it! 1987 should be a world class shorting opportunity. 5 days and here we come–only thing that has me worried is that the whole world will be shorting with us, including all the classical chart jockeys.”
6. Now based on what I know. Usually things dont happen like people want them to.
We have 2 scenarios:
A. We dont get to 1987 and we terminate and sell off from here to 1987 area.
B. We over shoot to 1987 to 2020 and then terminate.
How would the wave count look then? Because to me that is a combination of the bull and bear wave count.
You should definitely take some time off like you planned…I am today. We could all use a break, don’t you think? Take care… 🙂
Thanks Verne. I am taking the day off. See you later!
Short succeess this time ?
A small gap was closed and another gap sits below at 5683.
While I had confidence that gap would be closed yesterdays move has severely rattled me.
FTSE analysis shows that we could have a much larger correction underway.
I downloaded the stoop loss. a little more throwing me out
Lara, I’m in the camp of an intermediate flat 4 correction ending probably in the neighborhood of 1,750 soon. Under this assumption, current wave (4) could go up to the price level of the previous wave 4 correction, meaning ~ 1,950 and not 1,987. In other words, I like your first daily chart-flat, but with the only caveat that current wave (4) could go somewhat higher than indicated in your chart.
That’s fine, but you’d have to swallow the fact that the bullish wave count has no support from regular TA at the monthly chart level.
If we go by original Dow Theory we can confirm that the S&P is now in a bear market (I know it hasn’t dropped by 20% yet, I’m only speaking of Dow Theory).
And so following Dow Theory correctly we should assume that the S&P is now in a bear market until Dow Theory says its not.
DT is late. Slow. And very conservative.
That bullish wave count expects this downward move is an interruption which should end with (4) and finally (5) to new lows, but not much lower.
My head just exploded! What to do?
Holding short now. Do I attempt to get out on the possible hourly drop to 1900 level then re-enter at around 1987 OR take anti-anxiety medicine, hold shorts and ride?
Getting out (sell shorts) re-enter (buy shorts) correctly is tricky. Maybe trying to be too smart?
Are they time-sensitive? If you’re talking puts, then you might be best off taking advantage of the coming retrace to dump them and get in at a better price. Same goes if you’re shorting UVXY–its worth it ’cause its so volatile.
Speaking of options –
You think I got time ?
I got the end of month March 1700 puts!
Today I layered on out of the money March options that are in effect short the market… at a crazy bid. This is my only time sensitive position.
I hate ST out of the money options… learned the hard way years ago. But I think I am comfortable with my decision at this point. Ask me again in a week or two how I feel about them.
Ok thanks!
Yes, ST out of the money options are a big money maker–for the market makers! You are much better off with INM options ’cause there is little or no premium decay. I only go for the OTM when expecting a strong short term move.
I think March is too close for 1700 puts. Try to turn them over into June or even further out… I made that mistake August 2015.
It would be 5 months for a third wave. If it goes past March we are in something else IMO.
Thank you for speaking out loud!
It really is helpful to know other traders and investors have to worry like me!
I’m curious on this!
I’m out and on the sidelines.
I have taken a loss on the last position I had.
I will wait until this correction is confirmed as over and I have confidence that it is over before entering again.
I was only prepared to hold my position up to 1,947.
or add to lower your cost basis at the high
Lara,
The volume numbers used in the chart above that is slightly increasing… What volume does that represent? The SPX index? or some other?
Hard to read the fine print in that chart.
Thank You
The data I am using for volume comes from StockCharts. According to data from StockCharts this is volume for the S&P500 cash index. The symbol used for this market by StockCharts is $SPX
Volume for the last three days:
12th Feb 2,911,660,736
16th Feb 2,970,140,416
17th Feb 3,113,968,896
Last downwards day of 11th Feb volume was 3,690,892,872
Lara, I can’t get this volume on my SPX charting.
After speaking with tech support, they gave me this symbol for S&P $TVOLSP
and for DOW $TVOLI.
DO you think $TVOLSP matches the volume used in the SPX chart you use from Stock Charts? Because if it is then I can now get the SPX volume in real time.
Thanks
This is it! 1987 should be a world class shorting opportunity. 5 days and here we come–only thing that has me worried is that the whole world will be shorting with us, including all the classical chart jockeys.
All the TV traders have the line in the sand at 1950… their number above which they say indicates more bullish upside.
… “The bounce is real”!
I don’t think they will then say 1987 is the new point to short… They will believe the all clear has been given.
But we all know better than that.
I’m discounting the TV commentators who all work indirectly for Wall Street–almost all perma bulls.
What everybody else sees is that big fat thick 2 year long horizontal trendline at about 2040 that dominates everyone’s chart.
Joseph
You think I got time ?
I got the end of month March 1700 puts!
You should use 2 or 3 times short or long ETF’s… more forgiving than options. With options you not only need to get the direction right you have to be right on the time period.
With ETF’s You can be wrong on the minute count and wait out the next degree count which if right on that will make up for that error ++++
I only do US index contracts!
Calls or Puts
The ETF’s are on US indexes i.e SDOW, SPXS you can find one for any US Index and they trade with volume.
Trading options in one direction or the other is not easy.
You see.
If everyone is thinking the same thing it doesn’t happen!
1st,, March will be grizzzly