More upwards movement was expected. The most likely point for it to end was expected to be 1,895.
So far upwards movement has reached 1,895.77.
Summary: The trend is down. Upwards movement is now reasonably likely to be over. A new low below 1,810.10 would confirm this view. If movement continues any higher, then look for price to find strong resistance at the next cyan trend line. What is most likely is a big third wave may begin to show itself over the next few days with very strong downwards movement. Look out for surprises to the downside.
To see how each of the bull and bear wave counts fit within a larger time frame see the Grand Supercycle Analysis.
To see detail of the bull market from 2009 to the all time high on weekly charts, click here.
Last published monthly charts can be seen here.
If I was asked to pick a winner (which I am reluctant to do) I would say the bear wave count has a higher probability. It is better supported by regular technical analysis at the monthly chart level, it fits the Grand Supercycle analysis better, and it has overall the “right look”.
New updates to this analysis are in bold.
BULL ELLIOTT WAVE COUNT
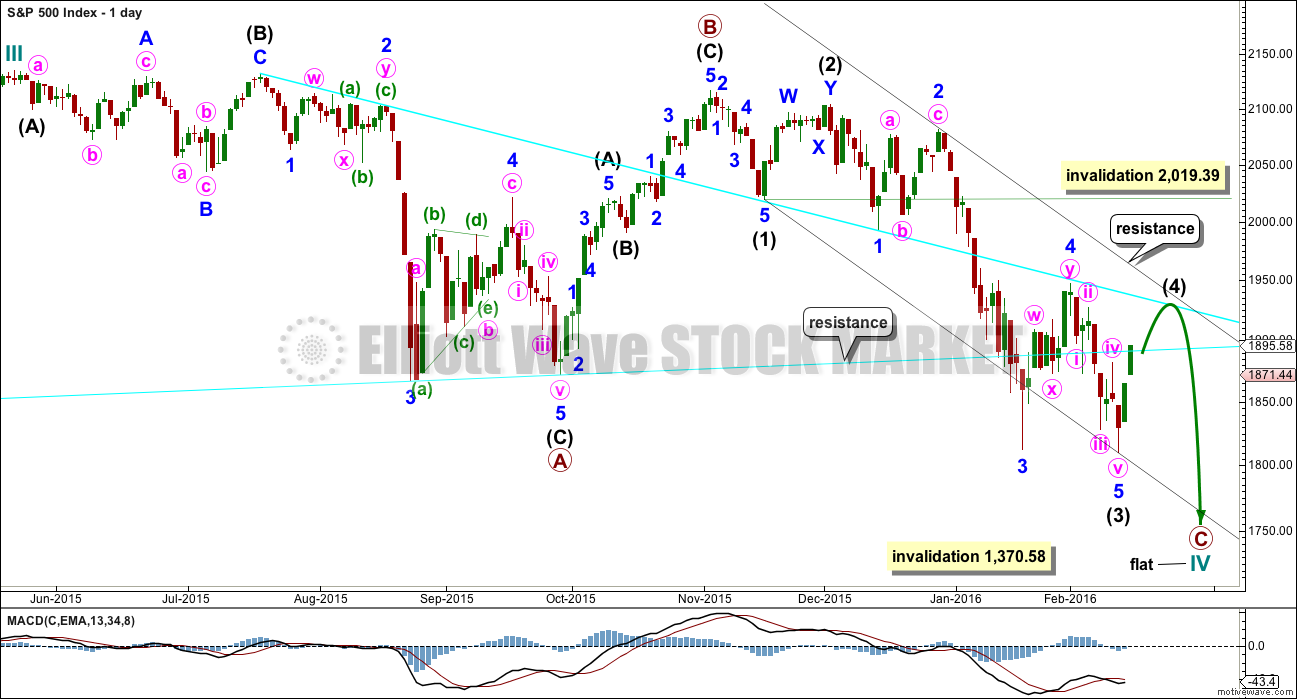
DAILY CHART – FLAT
This wave count is bullish at Super Cycle degree.
Cycle wave IV may not move into cycle wave I price territory below 1,370.58. If this bull wave count is invalidated by downwards movement, then the bear wave count shall be fully confirmed.
Cycle wave II was a shallow 0.41 zigzag lasting three months. Cycle wave IV should exhibit alternation in structure and maybe also alternation in depth. Cycle wave IV may be a flat, or combination. This first daily chart looks at a flat correction.
Cycle wave IV may end within the price range of the fourth wave of one lesser degree. Because of the good Fibonacci ratio for primary wave 3 and the perfect subdivisions within it, I am confident that primary wave 4 has its range from 1,730 to 1,647.
Primary wave C should subdivide as a five.
Within the new downwards wave of primary wave C, intermediate waves (1), (2) and now (3) may be complete. Intermediate wave (4) may now find resistance at the upper cyan trend line. This would see it end within the price territory of the fourth wave of one lesser degree.
Intermediate wave (2) was a deep double zigzag. Intermediate wave (4) may exhibit alternation, so it may be shallow. It would most likely be a flat, combination or triangle.
The idea of a flat correction for cycle wave IV has the best look for the bull wave count. The structure would be nearly complete and at the monthly level cycle wave IV would be relatively in proportion to cycle wave II.
HOURLY CHART
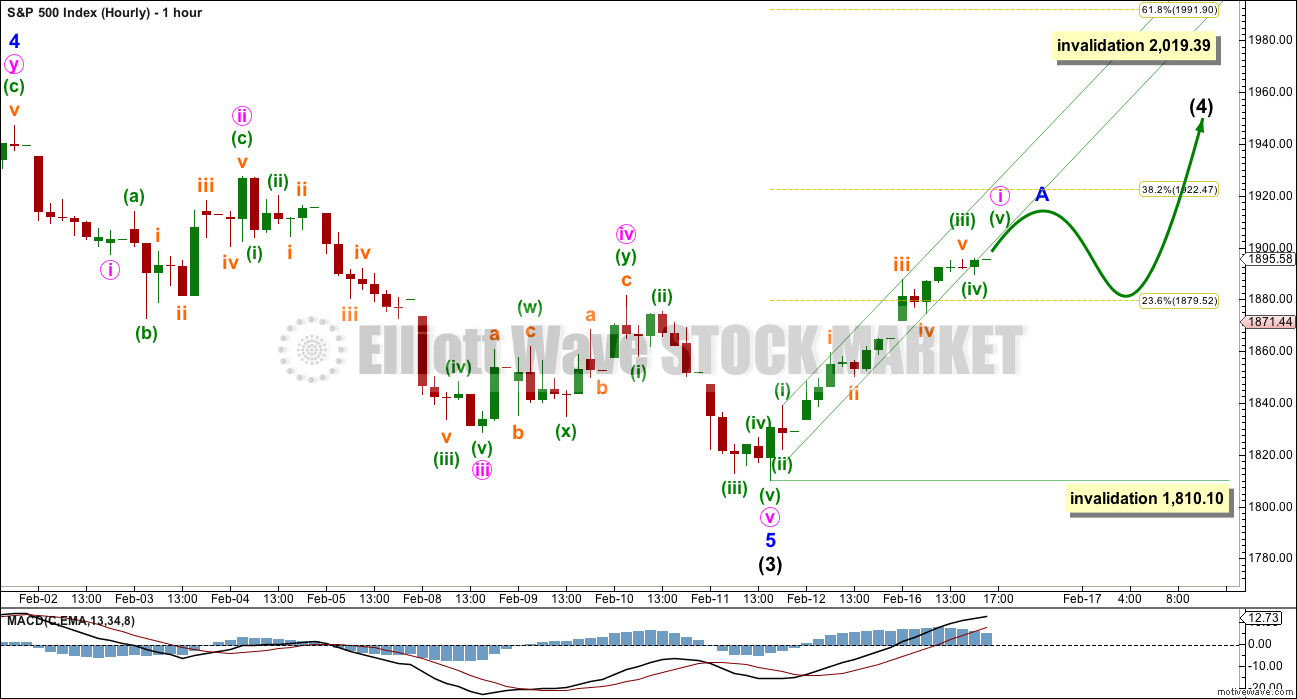
So far the first five up looks to be incomplete. Whether this be a first wave or an A wave the following correction may not move below its start at 1,810.10.
DAILY CHART – COMBINATION
This idea is technically possible, but it does not have the right look. It is presented only to consider all possibilities.
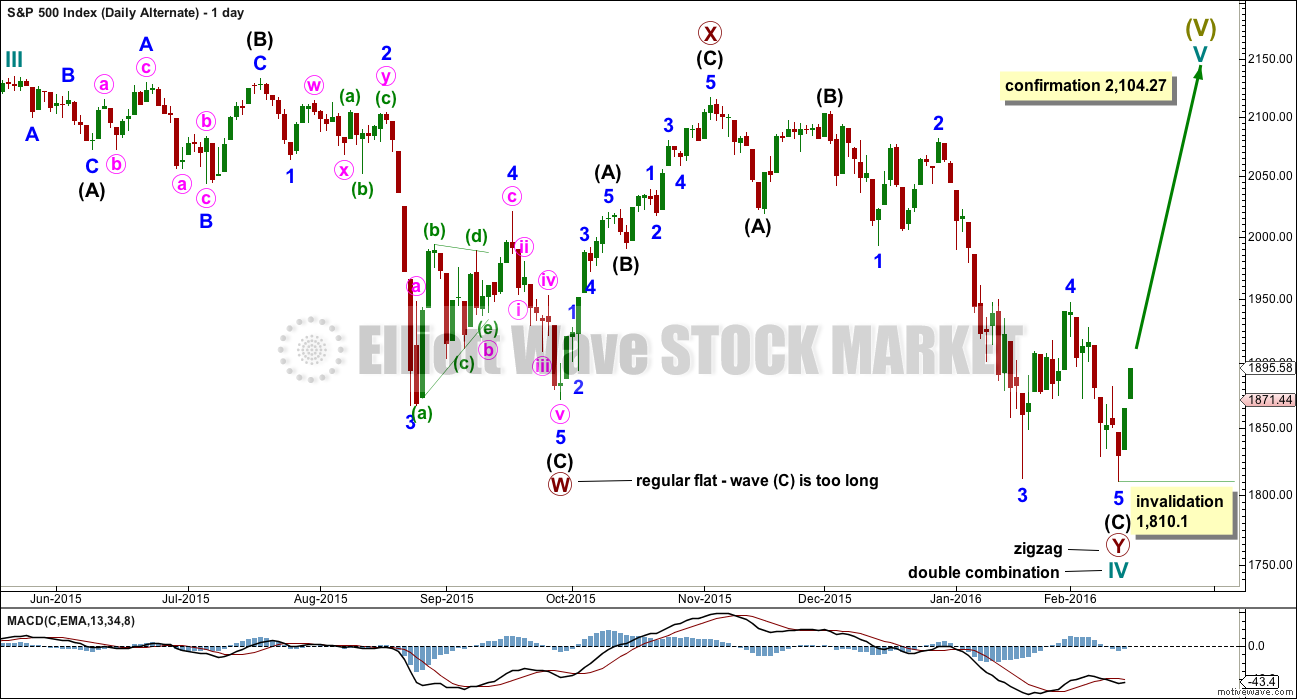
If cycle wave IV is a combination, then the first structure may have been a flat correction. But within primary wave W, the type of flat is a regular flat because intermediate wave (B) is less than 105% of intermediate wave (A). Regular flats are sideways movements. Their C waves normally are about even in length with their A waves and normally end only a little beyond the end of the A wave. This possible regular flat has a C wave which ends well beyond the end of the A wave, which gives this possible flat correction a very atypical look.
If cycle wave IV is a combination, then the first structure must be seen as a flat, despite its problems. The second structure of primary wave Y can only be seen as a zigzag because it does not meet the rules for a flat correction.
If cycle wave IV is a combination, then it would be complete. The combination would be a flat – X – zigzag.
Within the new bull market of cycle wave V, no second wave correction may move beyond the start of its first wave below 1,810.10.
I do not have any confidence in this wave count. It should only be used if price confirms it by invalidating all other options above 2,104.27.
BEAR ELLIOTT WAVE COUNT
DAILY CHART
This bear wave count fits better than the bull with the even larger picture, super cycle analysis found here. It is also well supported by regular technical analysis at the monthly chart level.
Importantly, there is no lower invalidation point for this wave count. That means there is no lower limit to this bear market.
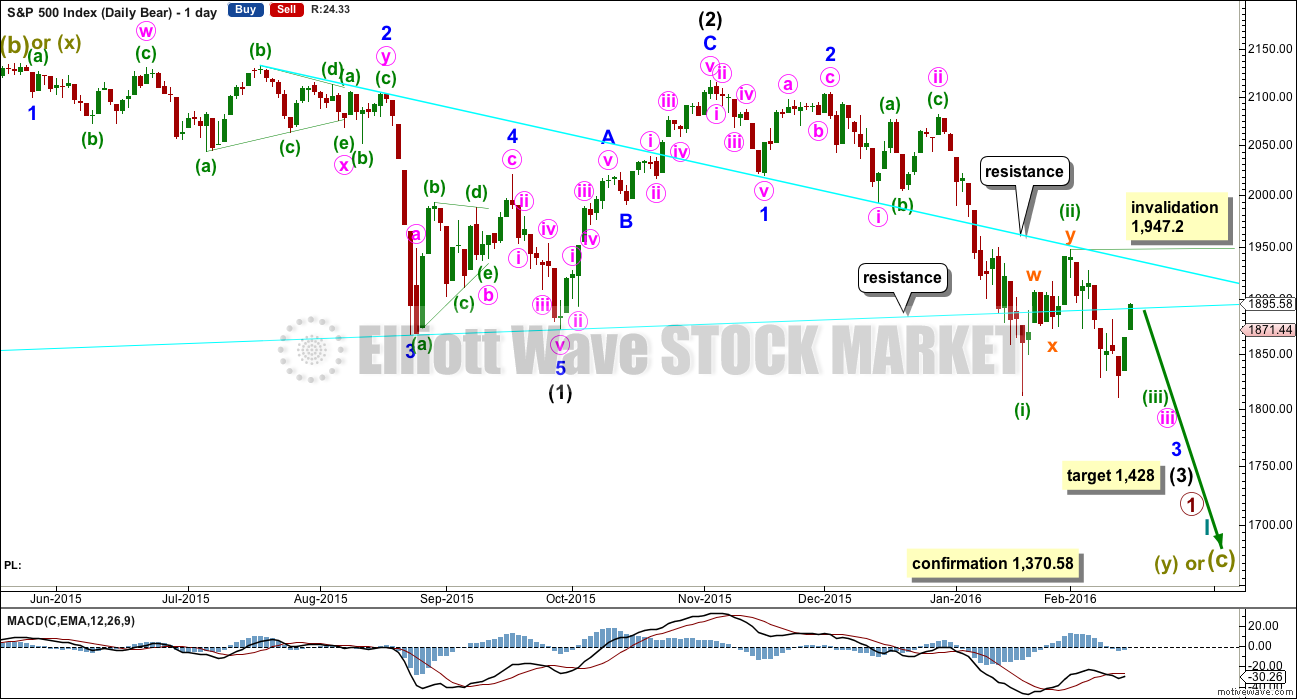
Downwards movement so far within January still looks like a third wave. This third wave for intermediate wave (3) still has a long way to go. It has to move far enough below the price territory of intermediate wave (1), which has its extreme at 1,867.01, to allow room for a following fourth wave correction to unfold which must remain below intermediate wave (1) price territory.
Intermediate wave (2) was a very deep 0.93 zigzag. Because intermediate wave (2) was so deep the best Fibonacci ratio to apply for the target of intermediate wave (3) is 2.618 which gives a target at 1,428. If intermediate wave (3) ends below this target, then the degree of labelling within this downwards movement may be moved up one degree; this may be primary wave 3 now unfolding and in its early stages.
Intermediate wave (2) lasted 25 sessions (no Fibonacci number), minor wave 2 lasted 11 sessions (no Fibonacci number), minute wave ii lasted 10 sessions (no Fibonacci number), minuette wave (ii) lasted a Fibonacci 8 sessions. Each successive second wave correction of a lower degree has a shorter duration which gives the wave count the right look, so far.
Within minuette wave (iii), no second wave correction may move beyond the start of its first wave above 1,947.20.
This first idea for the bear count at the daily chart level expects to see a very strong increase in downwards momentum as the middle of a big third wave unfolds. This first idea (of three) has the highest probability because it expects that within intermediate wave (3) the middle of the third wave will be the longest extension, which is the most common pattern for the S&P.
Third waves are most often extended for the S&P. They often feel like they begin slowly as a series of first and second waves unfold. The middle accelerates and they often end with strong movement and a spike. There is a good example on this daily chart: minor wave 3 within intermediate wave (1) began slowly and then had strong acceleration at its middle and then ended strongly.
HOURLY CHART
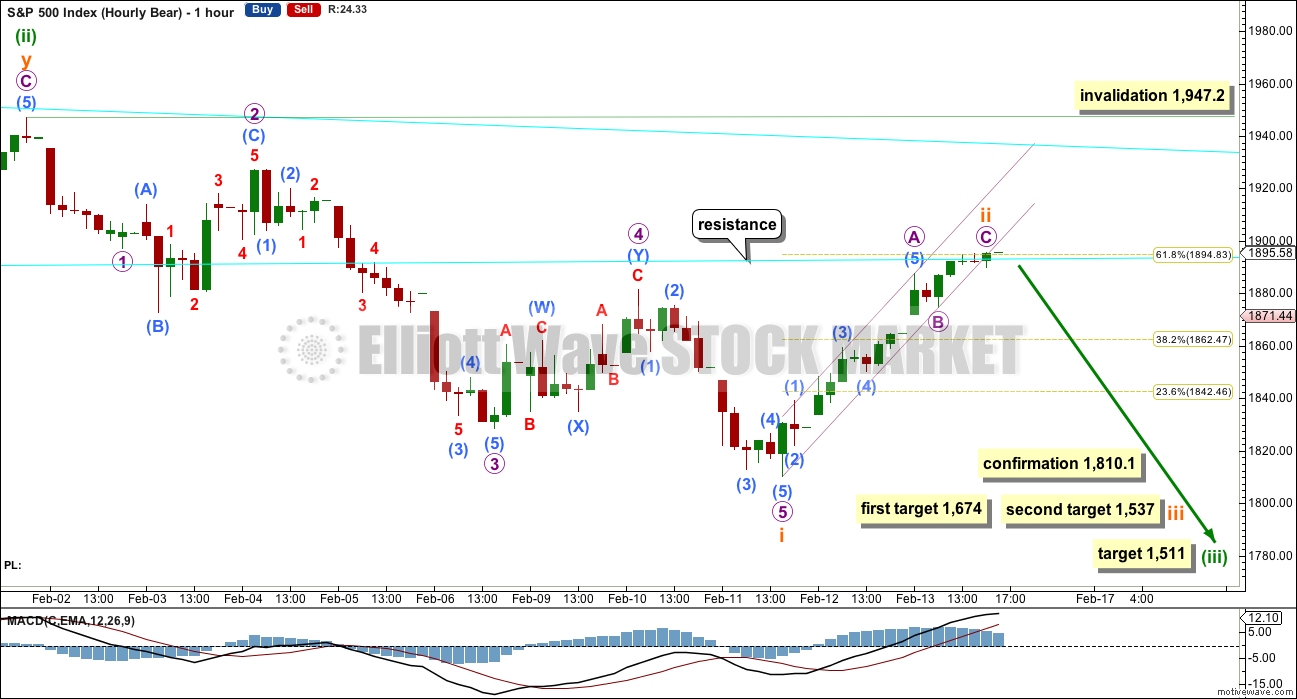
Subminuette wave ii fits as a single zigzag which may have ended at the 0.618 Fibonacci ratio of subminuette wave i which is about 1,895.
Subminuette wave ii sits within a narrow steep channel. When this channel is breached by clear downwards movement, that shall be weak indication that the correction is over.
A new low below 1,810.10 would provide full price confirmation that the correction is over. At that stage, confidence may be had that a third wave down should be unfolding.
At 1,674 subminuette wave iii would reach 1.618 the length of subminuette wave i. If downwards movement keeps falling through this first target, or if when price gets there the structure is incomplete, then the second target may be used. At 1,537 subminuette wave iii would reach 2.618 the length of subminuette wave i.
At 1,511 minuette wave (iii) would reach 1.618 the length of minuette wave (i).
If subminuette wave ii is not over and price continues higher tomorrow, then it may find resistance at the next cyan line which is copied over here from the daily chart.
FIRST ALTERNATE DAILY CHART
It is time to separate out the different possibilities for the bear wave count for clarity.
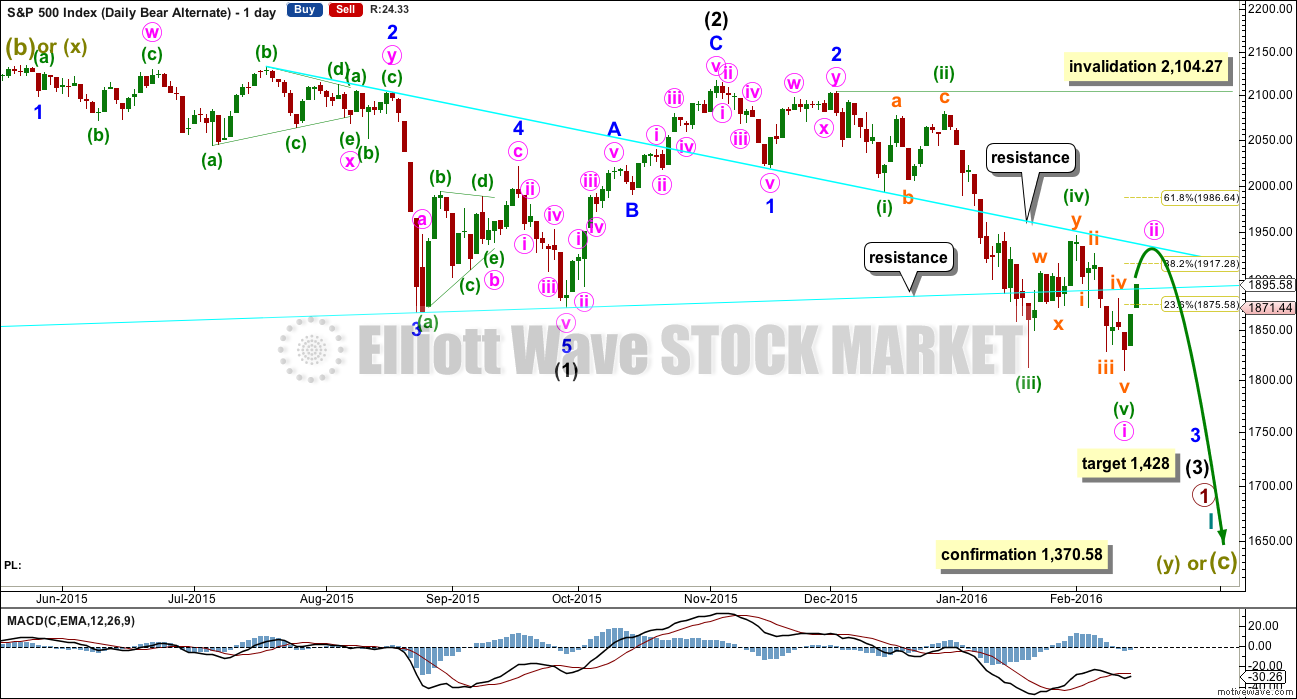
Within minor wave 3, it is possible that minute wave i was extended and is now a complete five wave impulse.
This wave count sees three first and second waves within an impulse unfolding downwards: intermediate waves (1) and (2), minor waves 1 and 2, and now minute wave i. Minute wave ii should be more brief than minor wave 2 which lasted 11 days. Minute wave ii may be expected to last a Fibonacci 3, 5 or 8 days. So far it would be unlikely to be over in just two days at the lower cyan trend line. It may continue for another one or three days and end about the upper cyan line.
Minute wave ii may not move beyond the start of minute wave i above 2,104.27. However, it should not get anywhere near that point and it should not last much longer if any than 11 days.
This first alternate bear wave count has a lower probability than the main bear wave count. It is less likely that a first wave would be this extended.
SECOND ALTERNATE DAILY CHART
I have previously noted this idea in the text and now it is time to chart it, so that the implications are clear.
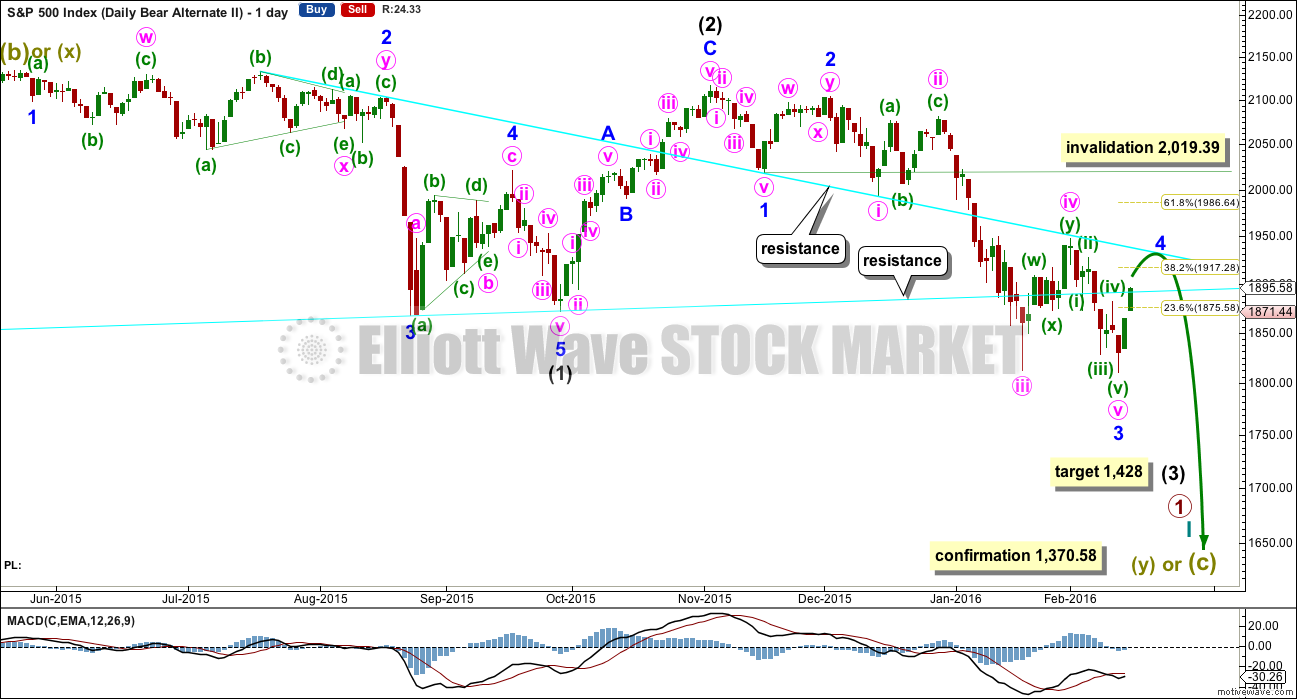
Within the downwards impulse unfolding, it may be that intermediate waves (1) and (2) are complete and now minor waves 1, 2 and 3 may also be complete within intermediate wave (3).
This wave count expects minor wave 5 to be extended within intermediate wave (3). Minor wave 5 should also show a strong increase in momentum, so that at its end intermediate wave (3) has clearly stronger momentum than intermediate wave (1).
There is no difference to the target for intermediate wave (3). This wave count makes a difference to the invalidation point. Minor wave 4 may not move into minor wave 1 price territory above 2,053.21.
This wave count also has a lower probability than the main bear wave count. It is possible that a fifth wave is the strongest extension within a third wave impulse, but this is less common for the S&P than the third wave being the strongest extension. This wave count would be more typical of commodities than the S&P.
Minor wave 2 lasted 11 days. Minor wave 4 may last a Fibonacci 8 or 13 days, so that the proportion between these two corrections is similar and the wave count has the right look.
Minor wave 4 would most likely be shallow and would be very likely to find strong resistance at one of the cyan trend lines.
TECHNICAL ANALYSIS
DAILY CHART
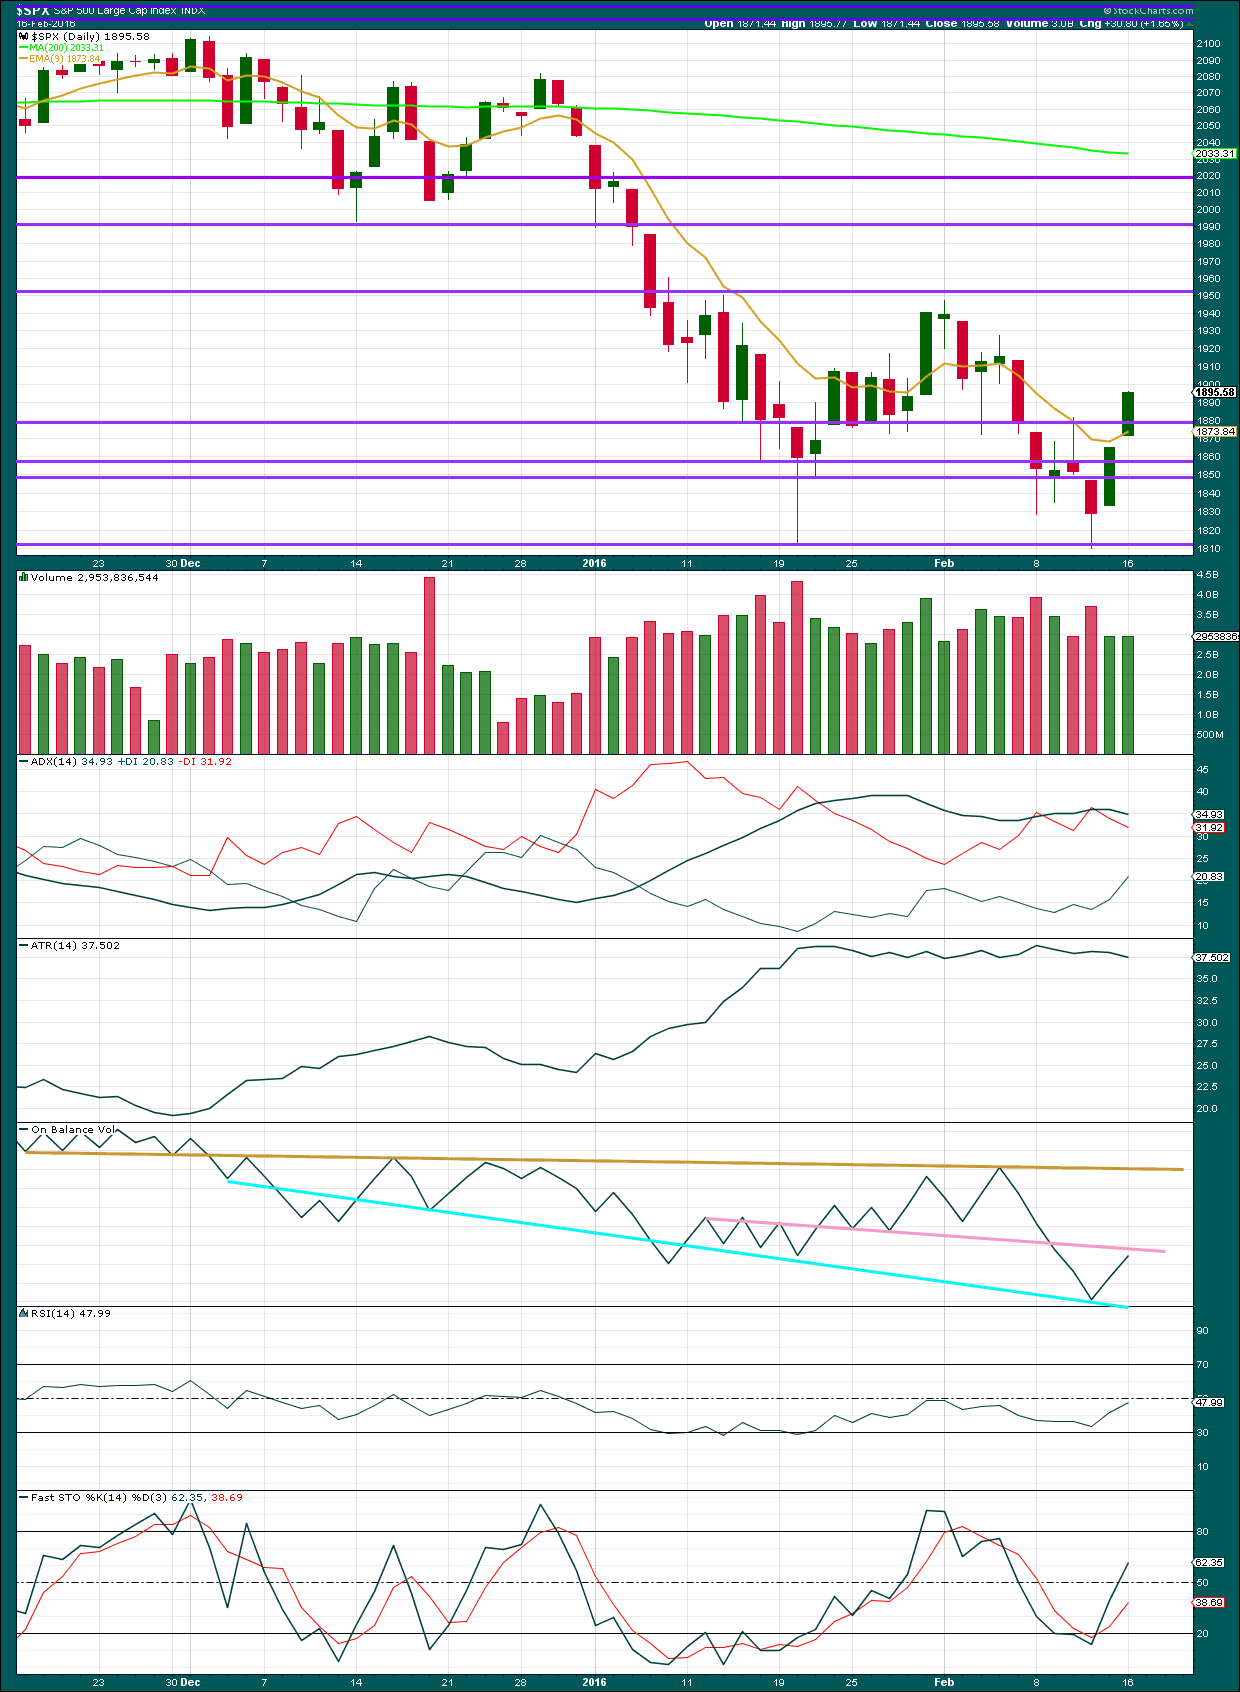
Click chart to enlarge. Chart courtesy of StockCharts.com.
Upwards movement for Tuesday comes with a slight increase in volume. There was some support for the rise in price. Volume remains lower than the prior downwards day of 11th February though, so overall the volume profile is still more bearish than bullish.
In the short term, this indicates there may yet be a little more upwards movement before this correction is over.
ADX indicates the market is no longer trending. ATR agrees. These two indicators are based on averages, so they are lagging. ADX does not indicate a trend change. At this stage, if the trend resumes, then it would still be downwards.
On Balance Volume has come up to almost touch the pink line. This may help to stop upwards movement of price here.
RSI is now close to neutral, so this allows plenty of room for the market to fall again.
Stochastics is returning from oversold. This too allows plenty of room for the market to fall again.
In the short term, I can see no weakness in this upwards movement. Volume has increased, MACD shows no divergence at the hourly chart level, and there is no divergence between price and RSI or Stochastics at today’s new high compared with the last high of 10th February. A lack of weakness today may be a warning that price may yet continue a little higher before the correction is over.
DOW THEORY
For the bear wave count I am waiting for Dow Theory to confirm a market crash. I am choosing to use the S&P500, Dow Industrials, Dow Transportation, Nasdaq and I’ll add the Russell 2000 index. Major swing lows are noted below. So far the Industrials, Transportation and Russell 2000 have made new major swing lows. None of these indices have made new highs.
I am aware that this approach is extremely conservative. Original Dow Theory has already confirmed a major trend change as both the industrials and transportation indexes have made new major lows.
At this stage, if the S&P500 and Nasdaq also make new major swing lows, then my modified Dow Theory would confirm a major new bear market. At that stage, my only wave count would be the bear wave count.
The lows below are from October 2014. These lows were the last secondary correction within the primary trend which was the bull market from 2009.
These lows must be breached by a daily close below each point. So far the S&P has made a new low below 1,821.61, but it has not closed below 1,821.61.
S&P500: 1,821.61
Nasdaq: 4,117.84
DJT: 7,700.49 – this price point was breached.
DJIA: 15,855.12 – this price point was breached.
Russell 2000: 1,343.51 – this price point was breached.
This analysis is published @ 08:59 p.m. EST.

Ace, if you don’t mind, let me know what strike price and date options you are holding; I’ll let you know what I think…
Thank you so much for being nice to me Jack since I’m new to third waves.
I got the end of month March 1700 puts!
March should be explosive down
You think I’m ok?
I’m deep in the water red!
The biggest red of my life on a trade so far.
No problem Boss! I would just like to see the Ace the technical man soon.
I don’t want the sell hope in here. And please know that I don’t know the future. You have to make your own choices, do your own analysis and homework. So, I don’t want to give anyone trading advice. Just want to share an opinion.
This uptrend rally might take up until the end of next week before it is over. It could also be over soon. I can see an ABC up so far, so I am looking for an opportunity to go in short soon (as in the morning, I am gonna watch the price action in the futures market before finalizing my decision. If I short it, is gonna be a very small position). Now whatever downturn that we might have could just be a short down wave with a larger up wave to follow (more likely). The number that I am watching is 1947. If we break 1947 we might go much higher.
So basically I’m dead in the water for March right ?
My confidence got crushed man!
I’m not being emotional I’m being human
I know charts good but I just got all flustered to be honest !
As soon as we take out 2040 we are going to be looking at the charts and saying now what.
I knew this was going to happen with the trend.
This market can’t not be trusted one bit.
Let’s see the price action in the next couple of weeks…
Jack your thoughts please
Lara, is there a way to ignore users? I’d like to remove some of the overly emotional commentary. I have been looking for a way to do this but can’t seem to find one.
Ditto – very disruptive (imho) when trying to trade based on price rather than emotion. I’ve stopped looking at comments during market hours which is a shame as most commentary is very useful with a sound basis
Dear Lara,
Yes. If you could provide some feedback on how to ignore emotionally unstable users, who shutter this wonderful privilege of being subscribed to your systematic, self explanatory, well thought-through analysis.
Your effort in making this technical analysis descriptive and backed by your years of experience is crucial for trading in any volatile markets.
Thank you very much for your effort and exceptionally well conveyed educational information about the unstable markets we participate.
Having you as our guide in mathematically proven Elliott Wave system is a reward.
PeterF
Yes, ditto as well. As someone who is routinely accessing the site from a small mobile device during the day, it is disheartening to have to endlessly scroll through post after post of emotional chatter while looking for tidbits of market analysis and trading ideas.
I am out. I will cut my loss here. Volume indicates this upwards bounce should continue further.
I’ll wait until the structure looks complete and a channel about it is breached. Then I’ll look for another short entry.
The main bear and first alternate bear will be swapped over today. The most likely scenario I expect is now a deep second wave unfolding. The target for it would be about 1,987 for it to reach the 0.618 Fibonacci ratio.
First it may find resistance at the upper cyan line, a bounce down there for a B wave. Then more upwards for a C wave. That would give it a clear three wave look.
If it is to be more brief than the second wave one degree higher it should be over within 11 days. A Fibonacci 8 total will be the expectation.
So another 8-11 more days ?
I can’t keep up with all these swift changes to time frames.
Especially with options. Time is everything.
you really need to mellow out,, nothing is etched in stone,, markets are unpredictable and deviant. March will be the month for the bears
I am
But still we keep on changing course on the targets
I’m not used to that
If you tell me we are going up I think up
If you tell me we are going down I think down
If we are stuck in a range I understand
I just don’t know what these moves are as I have never been in a third wave.
See my confusion ? It’s not emotional it’s a fact I didn’t trade a 3rd wave
you must mellow out, or this game is going to wack you out. your confusion is coming from the fact that these markets are not exact , you can be expert on all trading techniques and all chart analysis and still be on the wrong side of a trade. Laras is probably the most accurate I have seen. yet still is not exact and never will be, we are dealing with wiley coyotes and sophisticated computer programs that can manipulate the course of the markets. If there were absolutes in this market we would win every time. There are no absolutes, we are all quessing. So try to mellow out and not hyperanalyse everything. just friendly advice
Ok thank you
I am taking time off
Good bye
Yes, agreed. You must take what the market gives you.
Even if you strongly feel otherwise. Be flexible.
3rd wave avg time – And for my understanding another 89 days on top 11-13 days puts us in a third wave out to be done in July 2016 ?
Is my math wrong ?
Hi
Team Today
The king will now just take the day off…
later!
One update in all fairness please since I am new to third waves:
Before I make judgement on the uptrend I thought. I am going to study now SPX:
September 2000 to October 2002
October 2007 to March 2009
Joseph
My fear is we are not in a down trend anymore. When we close the month 1980 or near for Feb that was predicted to be red and now green. I expect more surprises to the upside.
Hi Lara
Understand that SP 500 expects more upside, but has targets in the pipeline for this.
If you could provide some targets for FTSE that would be really appreciated. No need for a full write up, but some targets and invalidation points (if they exist) would be appreciated.
We seem to be at channel resistance now and if this breaks I would imagine a fair bit more upside. Should this worry us or expected?\
thank you again for your insight here.
Ali
I will be providing a new alternate idea for FTSE today.
I’ll publish it as a separate post.
Thank you
Verne
Next couple weeks to 2 months when we take out 1987 and head to 2100+. I want you to save this. My guess at this point now is the whole bullish count is now the right one. The bull markets continues for 7 years and going.
It is my opinion that we are in a counter-trend rally that will trace out and ABC pattern. I think the A leg is almost done and we should see a B wave starting probably tomorrow, followed by a final wave up. Of course it could get back close to 2000 (invalidation is 2104.27) but I suspect it will find strong resistance in the 1950 1975 area. I could be wrong of course, and I will be the first to announce that the king was right, and we are indeed in a new bull market. We’ll talk in a few weeks… 🙂
You ever think about going into poetry? LOL
OMG, I dont know so lets see….
Volume update. 3 days volume steady increasing.
Trend is up?
2080 in 2 weeks anybody?
increasing volume yes,, however, uptrend volume is lower than the most recent downtrend volume . if there is not enough volume to bust it higher ,it will turn around and bust it lower
how long you trade the SPX?
King.. if that is what you believe, go long here! Put your money where your mouth is.
IT wont be too long before we know the outcome of this… a week at the most but may be sooner.
Why do you need validation from someone else?
I dont know what to believe.
I am confused….
I am trying to learn what technical indicators are you so confident in that keeps you short?
All technical indicators I look at says more room to the upside. I admit I am still new to third waves.
I have been messin in the market since around 1998 for the fun of it.
Hi
Jack and Verne,
I suspect we will tag 2080 soon and then 2150 and then maybe later on in 2016 go down only 20%. Just my hunch based on the intense move up the last three days.
I get the impression Sire, that thou mayest not hath seen thine share of bear market rallies? Or them covereth their shorts? 🙂
I haven’t that is why I am utterly confused.
+6.8% in 3 days up.
I dont know what to believe to compare my notes.
Is that even a shooting star on the 1 hr here?
RSI is overbought, cant stay there forever, usually an indication change of trend is just around the corner,, bullish that it got to that extreme, bearish for the future.
I honestly fold after next week. I think the decline is completed.
that’s what 2nd waves can do,, shake out the weak bears and create a feeling of happy days are here again.
You can grind the market sideways and release over bought that way.
I have to say, anyone remotely familiar with what is truly going on underneath the global economic hood and not terrified about what is likely ahead needs to have their head examined. I am not even talking about the fact that most of the large financial institutions, including the central banks, are technically insolvent. It is nothing short of mind-blowing that at this late stage the major indices are STILL trading at these levels- make no mistake about it, they are running on the fumes of a seven year, manic QE induced high that in the not-too-distant future, is about to be doused with the ice-cold water of harsh economic reality. I cannot believe we still have the ability to short this stuff from this high…again!!! Wow! 🙂
These kinds of furious rallies are the hallmarks of bear markets. They are rarely seen in bull markets so that is why people call them bear market rallies. They can be quite startling if not anticipated and can confuse the uninitiated about the true trend.
Verne or Jack or Rodney
The market took 1(about 30 days) entire month to go down only -13.54%
It took only 3 trading days to erase almost half of that with +5.4% today!
This looks like a major trend change!
Unless we break the lower levels I have to admit I have turned long term bullish now!
2008 and the 3rd wave did not do this as a reference. Something else is in the making!
2150 SPX by May 2016 probably anyone?
The weekly and monthly MACD are pointing down strong. We are in a market that is trending down and has been for several months. I call it a bear market. The daily MACD will soon be overbought and turn down. When that happens, the bear market will begin to show itself again. It will pounce on the bulls and disembowel them. That is what real bears do to their prey. Every bull who has established long positions since the 1810 low, will end up losing money if they don’t get out quickly. The bear market rally can end as fast as it started. I don’t mind getting my short positions a little later than the top. But I don’t want to get caught holding longs. Next week is going to be very different than this week.
Oh ok
Just dropped out of the channel (slightly) of the whole move up from 1810 – is it all over?
If it stays below 1927.55 would be a good start. Market currently backtesting that channel.
My comments are being moderated for some reason so by the time you see this we will probably already know 🙂 Market currently at 1924.91
Grind will probably continue another day or two. For the conservative marketeers, the next UVXY green candle in the vicinity of the 21 day ema means its off to the races!(for us bears, that is…) Have a great evening everybody…
Ok thanks! I lost track of days with this crazy move up!
My guess is we could be updating the wave count to 2080 soon if this bounce grows! I could be wrong but I am in a state of shock with this crazy move up!
Those long red candles show traders are nervous and ready to push the sell button. Just the thing for a waterfall style sell off.
What candles are you talking about ? Please explain I don’t know these things.
CNBC spx correction is over today !!!
The whole world knows but yet we still think a third wave is upon us ?
Is this part of the process ?
Yup cause CNBC is always right 🙂 this is what you want to see in the main stream media.
Art Cashin says trend is good after 1950. So, he’s got good experience?
Jack
I admit I don’t know Elliot wave good!
I do know that this does look like the correction is finally over!
Dear King of Finance,
Your name speaks for you.
Good luck in riding the learning curve; sometimes it takes years.
Best,
PeterF
Well I would say the text books so far have not all worked for me to be honest.
I will say. This is a very difficult field to be in on a day to day basis.
I really dont know how all you guys do it.
That is why I am here to learn …..
There are a few savvy traders on the forum. We can all learn from the way they trade the markets…if we pay attention…I know I am…
I agree
Hi
All
Please help me understand something:
So we started this third wave on nov 2015? Am I wrong ?
We are now only 1 week away from closing feb 2016. Only now 9% down from 2116.
That’s 4 months for a third wave!
I realize no two years are identical but how many more on average months does it take for a third wave to complete ?
6 months ?
See why I don’t understand third waves properly ?
I admit I’m a student of the market.
I suspect the first bear alternate may be correct. This may be another deep second wave correction.
For FTSE too. The first wave would have to have been a leading expanding diagonal though.
When this session closes volume will be indicative. If it remains close to yesterday or even higher then the first bear alternate will be my main wave count.
Only if volume for this session is clearly lighter would the main wave count remain preferred.
These three upwards days are deeper now than expected. Price is at the upper cyan trend line, I had expected it to stop yesterday at the lower cyan line.
If the upper cyan line doesn’t hold then the .618 Fibonacci ratio on the first alternate bear at 1,987 looks like a reasonable target.
I have been considering the leading diagonal idea too with the FTSE, the successive 1,2s have had me a little worried tbh(I will post the chart on the FTSE). This would fit better with crude where I see a expanded flat playing out, which I believe we could see $37 on WTI.
Thank you for sharing your thoughts Lara.
What is the fib days approx target for 1987 ? Would that still be within the next few days ?
I realize no two trading years are alike.
Please correct me but The 2008 third wave from August to October didn’t have these sharp moves so high as I fully understand.
Do we have an invalidation point to prove that we are not in the 3rd wave any longer?
Your Highness,
In my humble opinion markets did not replicate the August to October 2015 as an important event i.e. crash is missing. I suspect this is just to make investors feel that waters are safe before nastiness resumes.
So I am new to third waves.
Do we have a time approx for 1987? Is that within the next month or two ? Or within the next 3 days ?
At present rate before the week is over but I don’t see us getting there. Market is going to change trend at 1947 or earlier.
How can you be so confident.
I am confused I dont have any experience in Third waves.
It did occur to me when you said in last evening’s analysis that the alternate had a lower probability because of the unlikelihood of wave extension, that this is (wave extension) exactly what I would have expected with a trend change that was being fiercely resisted by either CB intervention or persistent crowd bullishness (at least according to my theory regarding banksters! 🙂 ).
Verne
What do you mean? Are you know bullish?
That I think there are good reasons why I think the alternate bear count is right..
So based on all your years of experience. Do you really see this thing going to SPX 1987 or 2040? over the next 2 weeks?
None of us really knows. We can only trade the most probably outcomes based on the wave count we are following…at least until we are proven wrong…it really IS that simple…! 🙂
But what was most probably and now least probably and now we are going higher. So my guess with this pattern is we will keep on going higher. 4 months and one 13%. That is record for the smaller 3rd wave.
Vern,
You said it perfectly.
Speaking of probabilities, both Jack and I last Friday concluded that an impulse down was complete and expected a move up. He went long SPX, I did a neutral pairs trade and shorted UVXY. He took profits on his position yesterday, I did on mine this morning. Did we know for certain the market would pop? Of course we didn’t. We made a decision based on a LIKELY outcome and that is the essence of trading imo…is it probable that this market is going on to new highs as you seem to be convinced? I’ll let you, based on all available evidence, draw your own conclusions…! 🙂
But that is what didn’t make sense
The bear count was dismissed and you switched to bull
I admit I didn’t really know
That’s why I’m here to learn
I’m taking time off
Bye
Lara,
You had stated on NASDAQ “Within minor wave 5, minute wave ii may not move beyond the start of minute wave i above 4,545.52.”, looks like it is following the script to the T for now. Any updates on NASDAQ?
I am aware that NASDAQ needs to be updated.
I just simply do not have the time today.
Just filled on a crazy options bid I placed (Thanks)… now in effect more short than my fully short.
Good Luck all…
Bye… until Sunday!
Are you kidding me??! I just got filled bid on the rest of my stink bids on UVXY…Whoa…the secret’s out!!!! 🙂 🙂 🙂
You guys are sure confident.
I guess that what experience gives.
I admit I have much to learn from the pros here.
I sure hope this all lines up no jinx
I am sure Joseph would agree- one way we learn is from our mistakes. Most traders take years to develop a system they are comfortable with and those methods can be as different as the personalities that employ them. The key is to find a method that is reliable when consistently applied, and to keep trading losses small!
It sure looks like UVXY has printed a triple bottom…
I don’t know what to believe to be honest!
My original view was spx 2000.
Here we are now marching ever so higher!
I think the correction is over! This is not what I have read a third wave does ?
I admit I could be wrong. But so far market is voting higher we could retrace the entire move down in 4 weeks chop around all year in 2016!
Based on some of the comments you have been making regarding your confusion, I get the distinct impression that you need to spend a little time familiarizing yourself with basic EW theory. Have you noticed that of all the people who subscribe to the service and who also post on the forum, you are the only one who seems to be always bewildered? Just a thought my friend… 🙂
picked some 45s
Hi
All
Is MACD even a reliable technical indicator here?
None of those are reliable. They work until they don’t work any more, usually during a big move one way or the other.
Bye until Sunday.
oh o.k. Thanks again!
Till Sunday
Verne or Jack or even Rodney,
If you guys got time. Please explain to me:
How can the SPX index even go down or even fall fast here when the technical analysis for MACD is not even back at 0?
Further, the lines are pointing straight north. So, something is not right here. Something is clearly in the pic. Is this the continuation of a bull market for a sell off later in 2017?
Am I reading technical analysis book wrong?
Just balancing out the 6 mo. head and shoulder pattern on the daily chart.
It’s almost perfect now! Next… DOWN… DOWN… DOWN!!!!!
I could not resist… Bye till Sunday.
Thanks Joseph!
Your technical explanations really inspire me to be bearish in the face of all this bullish price action….
Jack.
FEB Monthly update so far. It looks like a huge hammer. I probably don’t know where this goes. But odds are higher now…
All in all. I need to reassess everything. The bull market is back?
Jack
This is not bearish!
Hi
Jack
Are you concerned here that this is morphing into another long term up trend and the correction is really over? Seems like that now – I have a gut feeling that something is not adding up here. The market is not stopping but I am still learning so I dont really know if I know that much about price action compared to you guys. It looks like we are going back up to 2080 or even 2116 now.
We are getting fast moves to the upside and no pull backs all the moves over night. Seems bullish to me.
Three days up on light volume that has not yet made a new swing high…. does not a new bull market make.
Just because many indices are in a bear market and have dropped a lot does not mean that they must now turn upwards from here.
oh o.k. I am still learning I thought since the rest of the world turned around we should too but good point.
that brings me to the next question?
Does it matter when the rest of the other global indices drop and hit new lows that we should look for a corrective move on the SPX?
I was told that is how markets work so I got confused on what is going on in around the world. Obviously I was told wrong.
My concern is right now we are moving extremely fast up and all resistance levels are breaking non stop.
Take some time to look at the last two bear markets. The information you seek is right in front of you in the charts.
Look at the drop from September 2000 to October 2002, and then the drop from October 2007 to March 2009.
Calculate the depth of the corrections early on in those two bear markets.
You are asking me the same question about third waves more than once. My answer will now be for you to take the time to answer your own question because for you to really understand bear markets you will need to do this.
I had the wrong dates for analysis. Now I have the right dates. So, I can go look now!
Thanks!
Good luck to all… I have very little time to check in here until Sunday.
Good Luck.
A CLOSE above round number pivots of 16000 and 1900 for DJI and SPX means a few more days of grind. A short squeeze also probably firing so smart bears will SOH in the meantime.
UVXY should meander back down to support around 40-42. Puts picked up last Friday finally showing some life. Should have added a few more on the trigger yesterday but passed on the risk/reward ratio- since this is a bear market, as the lady says, “expect” surprises to the downside…have a great day everybody!
It took me a while to figure out SOH. It has dozens of meanings in internet slang. I am guessing it means the bears will “sit on hands” for a few days. Well, you pegged me correctly. That is where I am, sitting on my hands, waiting to see daily MACD at least approach zero. Right now it is at -30 and it would be difficult to sustain a long deep move down, imo. From zero and above I’ll feel much more confident in entering new short positions. I am thinking we just may go right up to the invalidation point of 1947.2 which is also the next cyan trend line.
I am having a difficult time in trusting yesterday’s micro B wave (purple). It is so very short both in time and movement down.
However, if the market breaks down, I’ll initiate shorts below the 1870 mark or so. We have several gaps at that location from about 1865 to 1880.
Futures are pointing to a decent pop up on the open. What it does after that initial move could be quite telling.
I forgot to mention that channel lines are important indicators of a possible trend change. I will also be watching them closely.
That is what I am still learning. I and confused again and it looks like the correction to the upside has just begun now with a full target of 2080 retrace. I have no idea on how 3rd waves play out over time with most of the market moves happening premarket. But with MACD and other indicators still so far away we could be waiting for another month or so to TOP out yet again before another small pull back….
Your views?
I think the next reversal is going to be sneaky. Selling this week’s UVXY 45 puts after a nice pop. Buying next week’s 57 calls for less than a buck! Imagine that! 21 day ema strong support….it may go a bit lower, but look out above…
Stay frosty! 🙂
But we keep grinding higher – non stop. What happens at 1947? What if we take it out? Then what? Back to the drawing board?
Are we over bought?
Just curious. Do you have an overall trading/investing plan, or are you just reacting to the day to day moves of the market? If the latter, believe me, it will absolutely wear you out… 🙂
I do both.
But the plan is not working out.
That market seems to be very strong.
Just look at this article on dshort.
It explains everything.
Look at the SPX. The biggest outlier.
People are thinking the market is going down but the market is going up.
So, are we really in a down trend?
Looks like the global correction is over. We are now back in an uptrend.
How will the SPX drop when the rest of the world is already done?
See my point?
Verne
I really dont know. The way it looks, higher is what the market wants. Maybe I should wait till Friday and see by then we will be at 1980 at this rate to be honest?
If your trading plan is throwing off warning flags, then you should be all means make some adjustments; either standing aside until the situation clarifies, or change your trades based on your new assessment of what the trend is. The market is uncharacteristically putting in a third day of gains today and it has not done that for quite a while so I can understand your concern. Nonetheless, nothing I have seen so far suggests the trend has changed from down to up. It remains a powerful truism that selling bear market rallies is the most counter-intuitive thing for traders to do! I think we’re headed for that second cyan line. I am not waiting to get there and have been layering into new short positions on the way up after unloading my hedges. This rally is doing exactly what bear market rallies are supposed to- rattle the cage of tentative bears and shake them out of any short term or highly leveraged short trades. It generally works! 🙂
btw market coiling like a snake-some serious whipsaw directly ahead…
Very, very well said Verne. I agree that the trend is still down. I have seen nothing yet to indicate otherwise. I also agree that ‘layering in’ is a good strategy and for some that begins now or has already begun.
King of Finance, as Verne said, you must develop you own strategy including stops, goals, risk etc. Also know that we are in a second wave and they often go right up to the invalidation point. It is common for them to retrace 62% and it is relatively common to retrace 99%, imho.
Until then, I need to see Lara’s count because I am not a qualified EW technician by any stretch of the imagination. My strategy is to be on the sidelines where my risk is less and my anxiety is absent. If we are in a third of a third etc, and I have many reasons to believe this is true, then we are going to move a long ways down. I may not get in near the top, but there will be opportunities to short into the 3rd wave after it breaks down. That strategy can also make a lot of money.
with the footsie about to lose her footing,(hee hee), the next fews days may be crazy. That Verne is a peach for letting me continue my record of being first.
If it makes you feel better, I’ve been trying to post first for a few days now…
You’re too fast!
Countless and Special thanks also to Verne and Rodney!
In 4 months I learned so much from you guys! I realized I have much to learn.
Great to learn from you guys!
Many thanks!
Have a great week guys!
You are very welcomed. I have also learned so much and continue to learn here. Great site.
Most welcome your majesty! 🙂
Thanks for the quick analysis!
I finally have a better idea now!
I admit I got totally confused today on the price action!
Special Thanks to great members – Aver – Jack and Joseph!
1st. now I can read the analysis
ROFL 🙂
Lara,
Are you using ETF to short FTSE or something else? I am wondering if anyone knows what is available on the US exchange to short FTSE 100.
Thanks,
I’m using CFD’s from a New Zealand broker, CMC.
Actually, I was here first but I left the spot open for you…. 🙂
gee thanks Verne,, looks like futures are pointing in the right direction now,, and the Asian indices are giving it up too.