
Downwards movement was expected.
The short term target at 1,800 was not met, but price has moved lower.
Summary: In the short term, we may see a bounce here to again test the lower cyan trend line. A new high above 1,881.6 would confirm that a bounce is underway. It is still possible that the middle of a big third wave could turn up at any stage; expect surprises to be to the downside in this market. The trend is down.
To see how each of the bull and bear wave counts fit within a larger time frame see the Grand Supercycle Analysis.
To see detail of the bull market from 2009 to the all time high on weekly charts, click here.
Last published monthly charts can be seen here.
If I was asked to pick a winner (which I am reluctant to do) I would say the bear wave count has a higher probability. It is better supported by regular technical analysis at the monthly chart level, it fits the Grand Supercycle analysis better, and it has overall the “right look”.
New updates to this analysis are in bold.
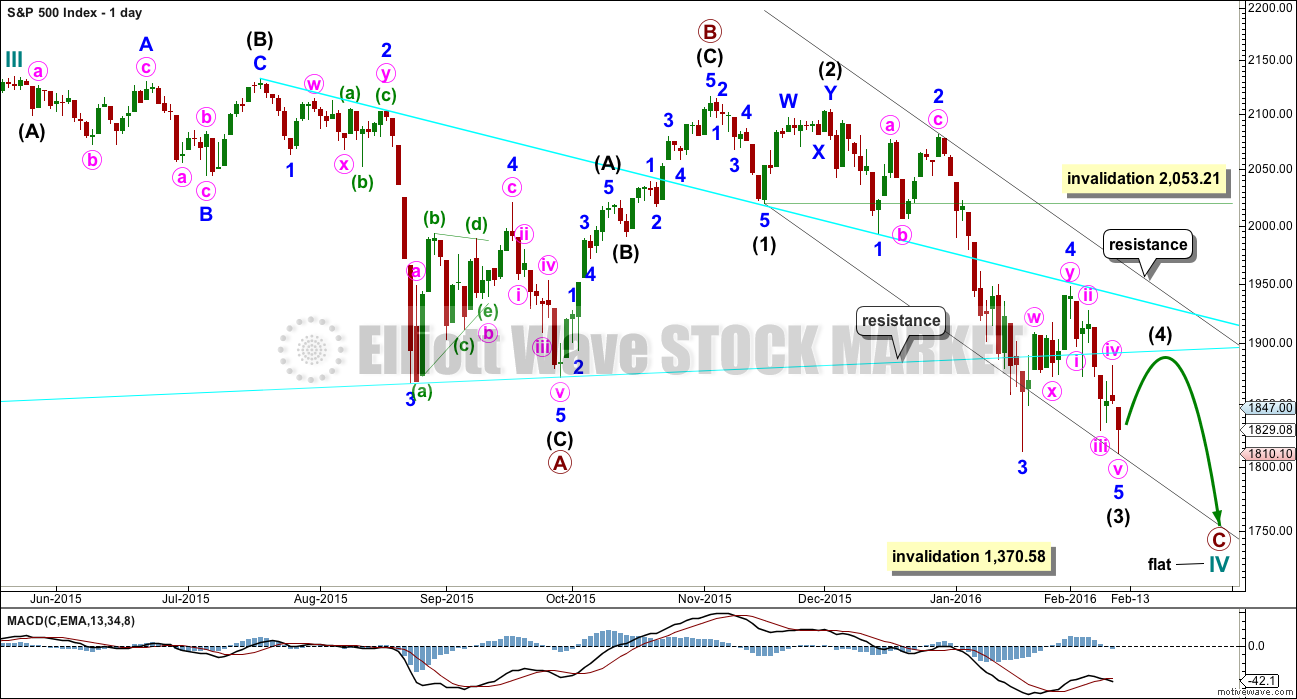
BULL ELLIOTT WAVE COUNT
DAILY CHART – FLAT
Click chart to enlarge.
This wave count is bullish at Super Cycle degree.
Cycle wave IV may not move into cycle wave I price territory below 1,370.58. If this bull wave count is invalidated by downwards movement, then the bear wave count shall be fully confirmed.
Cycle wave II was a shallow 0.41 zigzag lasting three months. Cycle wave IV should exhibit alternation in structure and maybe also alternation in depth. Cycle wave IV may be a flat, or combination. This first daily chart looks at a flat correction.
Cycle wave IV may end within the price range of the fourth wave of one lesser degree. Because of the good Fibonacci ratio for primary wave 3 and the perfect subdivisions within it, I am confident that primary wave 4 has its range from 1,730 to 1,647.
Primary wave C should subdivide as a five.
Within the new downwards wave of primary wave C, intermediate waves (1), (2) and now (3) may be complete. Intermediate wave (4) would probably find resistance at the lower cyan trend line. This would see it end within the price territory of the fourth wave of one lesser degree.
Intermediate wave (2) was a deep double zigzag. Intermediate wave (4) may exhibit alternation, so it may be shallow. It would most likely be a flat, combination or triangle.
The idea of a flat correction for cycle wave IV has the best look for the bull wave count. The structure would be nearly complete and at the monthly level cycle wave IV would be relatively in proportion to cycle wave II.
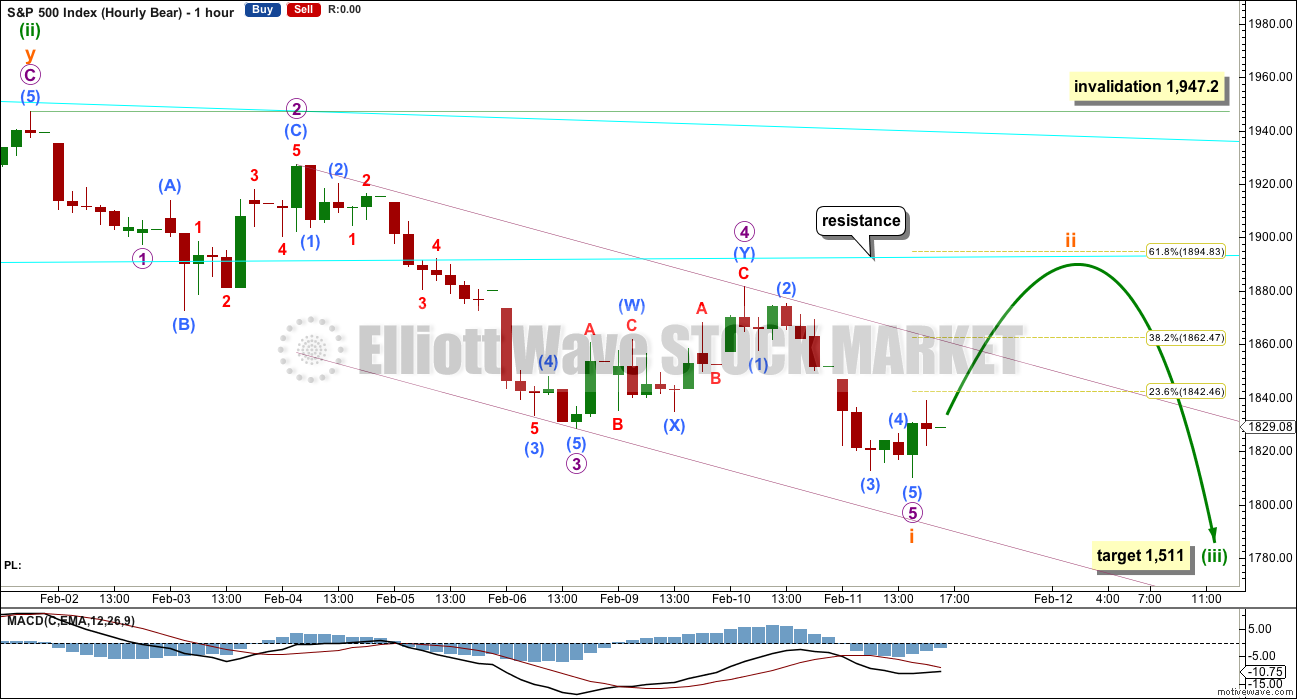
HOURLY CHART
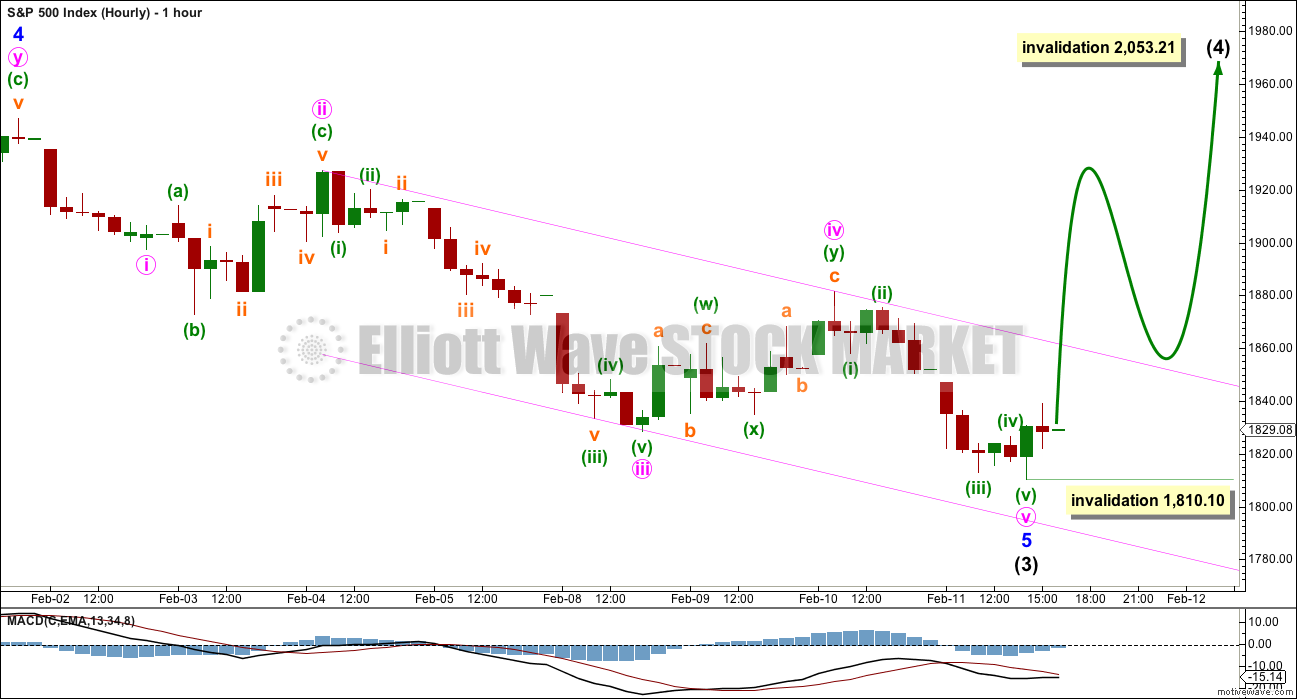
Click chart to enlarge.
Intermediate wave (3) is likely now to be over for the bull wave count. If intermediate wave (4) has begun, then within it no second wave correction may move beyond the start of its first wave. A new wave at intermediate degree should begin with a clear five up at the hourly chart level.
DAILY CHART – COMBINATION
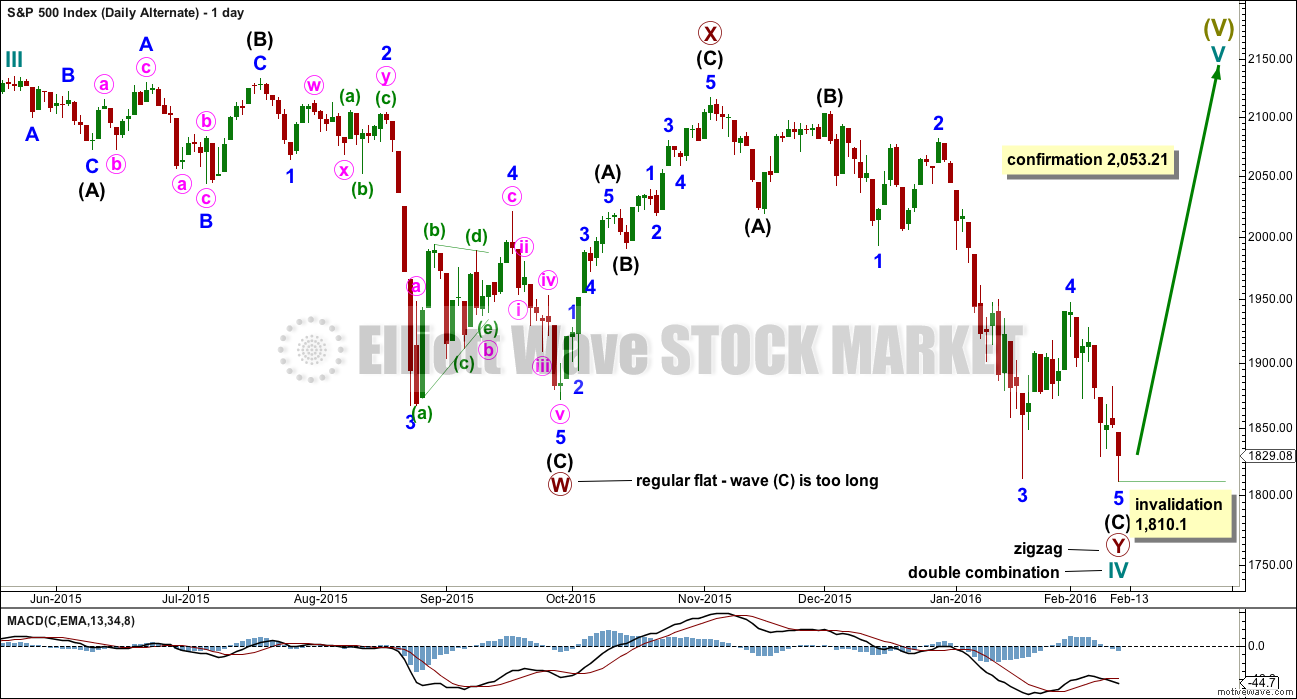
Click chart to enlarge.
This idea is technically possible, but it does not have the right look. It is presented only to consider all possibilities.
If cycle wave IV is a combination, then the first structure may have been a flat correction. But within primary wave W, the type of flat is a regular flat because intermediate wave (B) is less than 105% of intermediate wave (A). Regular flats are sideways movements. Their C waves normally are about even in length with their A waves and normally end only a little beyond the end of the A wave. This possible regular flat has a C wave which ends well beyond the end of the A wave, which gives this possible flat correction a very atypical look.
If cycle wave IV is a combination, then the first structure must be seen as a flat, despite its problems. The second structure of primary wave Y can only be seen as a zigzag because it does not meet the rules for a flat correction.
If cycle wave IV is a combination, then it would be complete. The combination would be a flat – X – zigzag.
Within the new bull market of cycle wave V, no second wave correction may move beyond the start of its first wave below 1,810.10.
I do not have any confidence in this wave count. It should only be used if price confirms it by invalidating all other options above 2,053.21.
BEAR ELLIOTT WAVE COUNT
DAILY CHART
Click chart to enlarge.
This bear wave count fits better than the bull with the even larger picture, super cycle analysis found here. It is also well supported by regular technical analysis at the monthly chart level.
Importantly, there is no lower invalidation point for this wave count. That means there is no lower limit to this bear market.
Downwards movement so far within January still looks like a third wave. This third wave for intermediate wave (3) still has a long way to go. It has to move far enough below the price territory of intermediate wave (1), which has its extreme at 1,867.01, to allow room for a following fourth wave correction to unfold which must remain below intermediate wave (1) price territory.
Intermediate wave (2) was a very deep 0.93 zigzag. Because intermediate wave (2) was so deep the best Fibonacci ratio to apply for the target of intermediate wave (3) is 2.618 which gives a target at 1,428. If intermediate wave (3) ends below this target, then the degree of labelling within this downwards movement may be moved up one degree; this may be primary wave 3 now unfolding and in its early stages.
Intermediate wave (2) lasted 25 sessions (no Fibonacci number), minor wave 2 lasted 11 sessions (no Fibonacci number), minute wave ii lasted 10 sessions (no Fibonacci number), minuette wave (ii) lasted a Fibonacci 8 sessions. Each successive second wave correction of a lower degree has a shorter duration which gives the wave count the right look, so far.
Within minuette wave (iii), no second wave correction may move beyond the start of its first wave above 1,947.20.
The degree of labelling within minute wave iii may also be moved up one degree. This correction may be minute wave iv. I will wait to see how momentum behaves for the next wave down to make a final decision on which degree of labelling is correct. For now I will leave the labelling as the most likely for a second wave due to the duration and the structure of a double zigzag.
If the next wave down shows a strong increase in momentum, then it would be the middle of a big third wave.
If the next wave down shows weaker momentum than minuette wave (i), then it would be a fifth wave to end minor wave 3.
HOURLY CHART
Click chart to enlarge.
I am swapping the hourly bear wave counts around today. Because there is divergence at the new low for Thursday with price and MACD, this wave count now has a better fit. It is likely now that subminuette wave i has ended at Thursday’s low as a complete five wave impulse.
If submineutte wave ii corrects up to the 0.618 Fibonacci ratio of submineutte wave i at 1,895, then it may find resistance at the lower cyan line which is copied over from the daily chart. Draw this line from the lows of October 2014 to August 2015.
Minuette wave (ii) lasted a Fibonacci eight days. Subminuette wave ii should be quicker. The expectation is of a Fibonacci three or five days, with five more likely.
The target for minuette wave (iii) remains the same. At 1,511 it would reach 1.618 the length of minuette wave (i).
In the short term, a new high above 1,881.6 would invalidate the alternate below and provide price confirmation that another Dead Cat Bounce is underway.
ALTERNATE HOURLY CHART
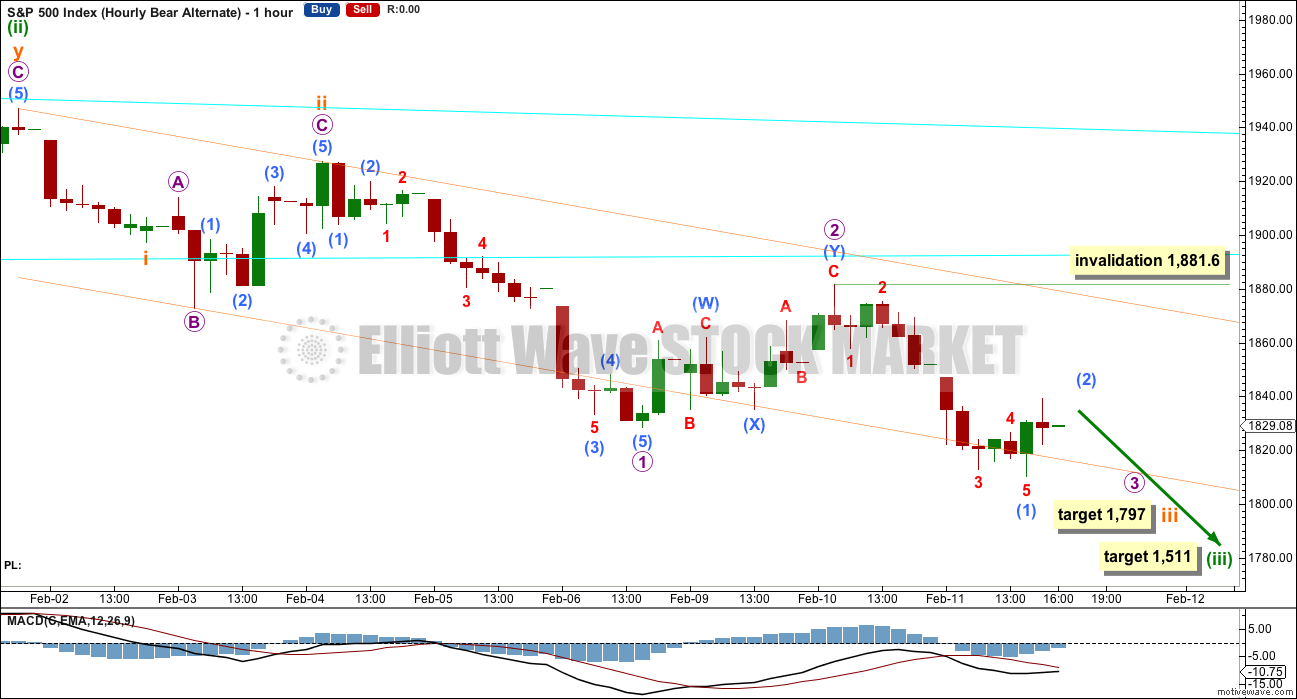
Click chart to enlarge.
It is still possible that there is a series of first and second waves complete. This alternate has a lower probability, but it must be understood that it is possible. It expects to see very strong downwards movement imminently.
At 1,797 submineutte wave iii would reach 2.618 the length of subminuette wave i.
Within micro wave 3, submicro wave (2) may not move beyond the start of submicro wave (1) above 1,881.6.
If tomorrow sees a new low with strong downwards movement, then this wave count must be seriously considered.
TECHNICAL ANALYSIS
DAILY CHART
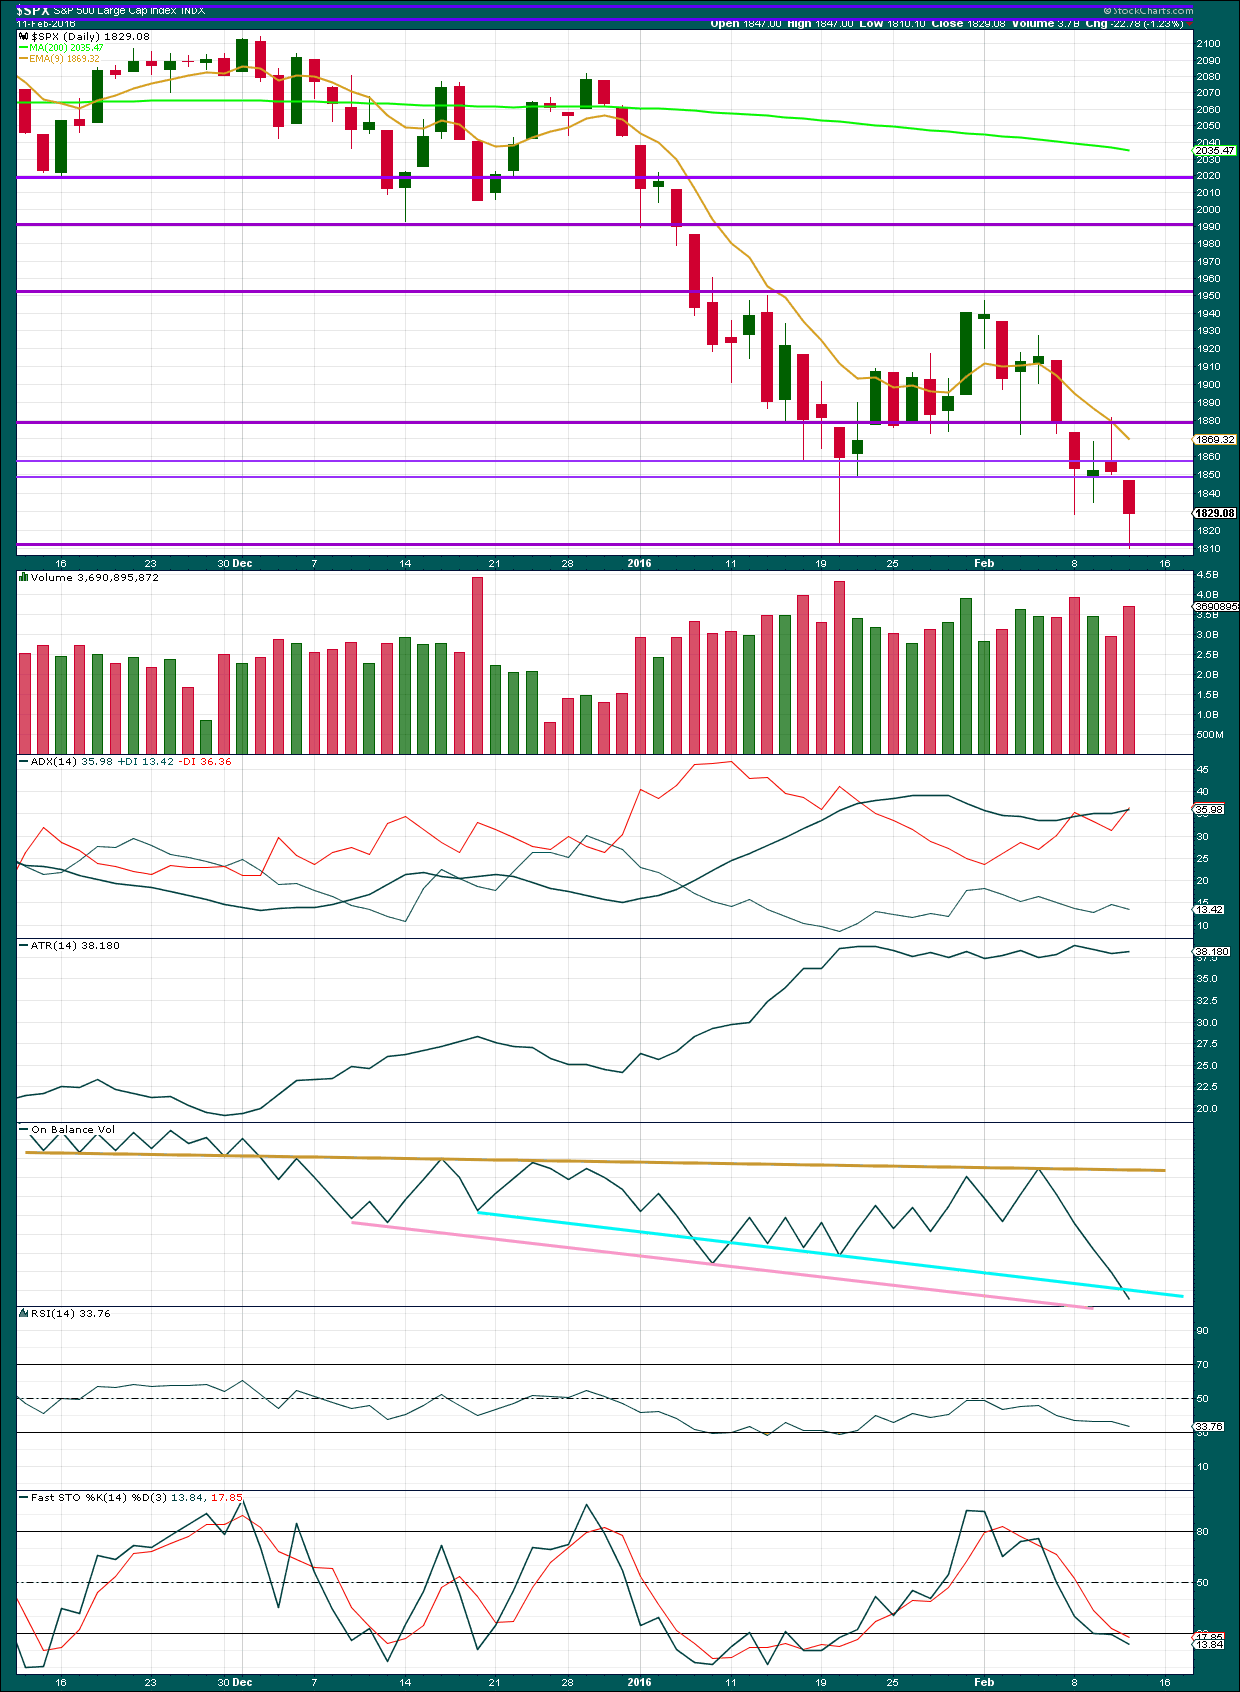
Click chart to enlarge. Chart courtesy of StockCharts.com.
Again, price moved lower on increased volume. The volume profile remains overall bearish.
The long lower shadow of Thursday’s candlestick indicates that the bears could not hold price close to the days lows; the bulls managed to rally. This is short term bullish.
ADX is still increasing and indicates there is a downwards trend in place. ATR disagrees as it is flat, which is more common for a consolidating market.
On Balance Volume has broken below the cyan line. This is a reasonable bearish indication. OBV tends to be a leading indicator and works well with trend lines. This break today means that the alternate idea for the bear wave count which expects very strong downwards movement as imminent must be seriously considered.
RSI shows no short term divergence with price (from day to day) nor does Stochastics. Neither indicate a trend change at this time. Stochastics moving into oversold is not an indication of a trend change; during a trending market this indicator may remain extreme for periods of time.
DOW THEORY
For the bear wave count I am waiting for Dow Theory to confirm a market crash. I am choosing to use the S&P500, Dow Industrials, Dow Transportation, Nasdaq and I’ll add the Russell 2000 index. Major swing lows are noted below. So far the Industrials, Transportation and Russell 2000 have made new major swing lows. None of these indices have made new highs.
I am aware that this approach is extremely conservative. Original Dow Theory has already confirmed a major trend change as both the industrials and transportation indexes have made new major lows.
At this stage, if the S&P500 and Nasdaq also make new major swing lows, then my modified Dow Theory would confirm a major new bear market. At that stage, my only wave count would be the bear wave count.
The lows below are from October 2014. These lows were the last secondary correction within the primary trend which was the bull market from 2009.
These lows must be breached by a daily close below each point. So far the S&P has made a new low below 1,821.61, but it has not closed below 1,821.61.
S&P500: 1,821.61
Nasdaq: 4,117.84
DJT: 7,700.49 – this price point was breached.
DJIA: 15,855.12 – this price point was breached.
Russell 2000: 1,343.51 – this price point was breached.
This analysis is published @ 12:51 a.m. EST on 12th February, 2016.
Any possibility that this wave count is correct? There seems to be a lot of divergence between price and indicators, which is typically seen at the end of an impulse or correction. Perhaps the first wave of Intermediate 3 is complete and we are starting the second wave of Intermediate 3 for the bear count? I hear a lot of bearishness from the guests on CNBC and at least 90% of them are permabulls. I don’t watch CNBC much but in my experience, it is better to do the opposite of what they recommend.
Possible. But the structure of the second wave gives it a very low probability.
That would have to be a running flat. They are one of the rarest Elliott wave structures. They normally only appear before very strong movements. I have one on the daily chart; it is minute y within minor 2 within intermediate (1) (it was 10th August 2015 to 18th August 2015). That running flat appeared before a very strong third wave; minor 3 was a sheer drop and fast.
That is the kind of situation you may expect to see a running flat in.
Your running flat appears before a third wave, but that third wave although strong wasn’t very strong.
I have a slight variation on your idea, I’m finishing up the analysis now. It has taken many hours which is why it is later this week.
Chris Kimble provides this perspective on where the S&P 500 is at.
The channel on the main bear hourly chart is breached at the end of Fridays session.
This gives me more confidence in the main hourly bear count.
I may not publish the alternate, I think the probability is now too low.
We should be in for some upwards movement Tuesday and maybe Wednesday… it could possibly last all of next week but I think that is less likely.
I have an order to short at 1,892 with a stop just above 1,947.2.
If price hits that cyan trend line it is most likely to be a great opportunity to enter the trend.
As always, please ensure you manage risk. No more than 3-5% of equity on any one trade. Risk management is the single biggest thing a trader can do to ensure profits over the long term. It will turn even a poor strategy into a profitable strategy.
Analysis will be done later today after StockCharts data is finalised for the session. As is usual.
Have a fabulous holiday weekend to all our members in the USA.
What is the mid term target ? 1511 or 1428
What happened to the 21 day session on micro I that was 8 days yesterday?
Where are we with the 89 days that started on nov 3, 2015 at spx level 2116 – the famous well published approx for this “third” wave ?
As I have said before, time estimates are rough only.
I am sorry, I don’t know what you are referring to regarding a 21 day session for micro wave 1? It was over within one day. Not 21.
Micro is the violet numeral with a circle.
So far from the end of intermediate (2) price has moved overall lower and has so far lasted 69 days. That leaves 20 to total a Fibonacci 89. At this stage unless it makes a swift end (possible) it may not be able to do it in 89.
I can’t hurry the market up. And I can only make the best estimates with the information I have to date.
I am getting the impression from your tone that you are not happy with this analysis so far? because the strongest part of this third wave is taking its time?
In on mobile so I can only type so much.
Sorry – It’s not that I am upset with the analysis.
The statement was literally removed that was present yesterday for the 89 days so I was seeking clarification.
Also the mid term target was removed? For a week or so we had it and now it’s not present on the open statement? What is the criteria for the opening statement?
I’m comparing my notes and other analysis.
Literally the few days back we had been in a third degree six something – Are we in a “third wave”?
I thought for piece to break higher and tag 1947 it would negate the wave count ?
In your Elliot wave count ? Did we just complete 5 waves down from 2080 to 1810
Or did I read something wrong ?
Please clarify.
Further I in fact posted a chart with the 9 days decline that ended yesterday at 1810.
I questioned this decline limits in the last post.
So – I’m just only seeking additional Elliot wave confirmation that we could be in a bounce that would last another several weeks to the upside.
That is all I’m trying to understand. No tone here just facts. Quotes used to emphasize the importance point of 3rd wave.
If we are in the middle of the third wave then is there any criteria for length of it ? I’m concerned that we have been in this middle third wave for quite some time. Is there an estimate for
Fib days on middle
Of 3rd wave ? That is all I need to know. I don’t have motive wave I just count after the market closes!
Opt…. reviewing comments. I don’t see what your concerned about?
She said “up to 1892… where she plans to go short”.
+
“This gives me more confidence in the main hourly bear count.”
Then down to 1511….
She didn’t say anything about it lasting weeks and going higher… only that she plans to place a stop at 1947.20 to exit short.
Hope this helps in the meantime. Look closely at the main hourly bear chart above.
I was generally accustomed to the opening statement!
Thank you Joseph – that does clear up my misunderstandings.
Thank you Lara!
I understand now…
It’s a big wave, so it will take time.
I’ll address your points in order:
For now there are multiple possibilities and so I’m removing the 89 day expectation for intermediate (3). It would still need just 20 days. I don’t think it can do it at this stage.
The mid term target for 1,797 is removed from the main hourly bear because it was a target for subminuette iii. The main hourly bear changed. It now sees only subminuette i complete and subminuette ii unfolding upwards. I can’t again calculate a target for subminuette wave iii until subminuette ii is confirmed as over. Because I don’t know where it begins for that wave count.
The two bull wave counts I do not have confidence in. They are presented to consider all possibilities.
The first bull sees a bounce which could last a few weeks, yes. It could move above 1,947.
The second bull count I have no confidence at all.
The bear could also see another complete five down in the same way as the first bull… where the bull has intermediate (3) the bear could see that as a complete minor wave 3. I have not published that idea because it’s just getting too confusing with too many charts and I have made a judgement that it has too low a probability.
You have asked several questions about what do third waves look like, and expressed some doubt that a third wave is unfolding. So I’ll address the EW points of that.
This is a big third wave. It will take time to unfold. It will be extended in price and time. The smaller corrections along the way will therefore also be extended, or amplified.
The psychology of this is that while we have not passed the middle there is much doubt, that is normal. Only when we pass the middle should the weight of opinion / sentiment shift to believing what is happening.
We have lower highs and lower lows.
My analysis has concluded that this bounce which began on Friday should last most likely 3 or 5 days and should find strong resistance at the cyan trend line.
I could be wrong. But that is the highest probability outcome in my judgement.
Thank you!
That clarifies all my concerns!
I’m just a viewer at this stage! I don’t believe in day trading!
Lara,
Further, to expand with a chart as well to explain what my understanding of third waves are with some points.
1. I fully and completely agree that this is huge huge third wave and it will take time.
2. What I find very interseting is if this all started on Nov 2015 we are now comming 4 months total with barely any progress into the early stages of the 3rd wave and the SPX only dropped 11.9% from 2,116 to 1,865(Friday’s close).
3. I realize there are no lower limits and it is very hard to predict. I was even looking for a conservative target of just 1,700 or 1650. I would take 1,500 but we can’t even take out 1,800 for some peculiar reason. Its almost as if some massive support is there that just wont move.
4. What I also am fighting with is if the SPX is so resilient and the mysterious dip buyers keep on showing up then we could be in a ping pong range for quite sometime before we get to the lower target.
5. This was exactly and precisely my point the few days back of how 1,800 could not be taken out decisively. Even after 6 attempts (2014 to 2016 ranges are): 1815,1820, 1867,1871, 1812 and finally 1810. The SPX held. Just unbelievable really!
We need to keep in mind that Lara does not control the market. She simply analyses it. It is the responsibility of each trader/investor to use the information provided as he/she best sees fit and accept responsibility for his/her own decisions without carping about the results. The market is ALWAYS right. (and more often than not so is Lara!). Just my two cents… 🙂
Thanks for the quick update Lara- greatly appreciated!
Do have an awesome, restful week-end!
You make very good points Vernecarty. One of the lessons that took me some time was that EW like other technical analysis is always adjusting to the actions of the market. It is not wise to assume that today’s count will not be modified. Certainly we do not expect major changes. But from day to day as the market reveals itself, we must adjust our expectations. We look for clues and you, vernecarty, are a master of deciphering the clues with regard to VIX and options accumulation and distribution and probable moves.
Once I began to understand this and adjust my trading strategies, it was greatly helpful. Like you said, Lara and no one else can force the markets to move one way or the other.
You have hit on the key Rodney. The biggest difference I have found between traders who fail and those who succeed is between those who think they can tell the market what it ought to do, and those who simply accept what it does. The current dust up I find a bit of a mystery as there were a number of traders on the forum who clearly called for an interim bounce and traded accordingly so why anyone would be taken by surprise or confused by the current market action is more than strange. Just look at the various posts from Thursday. Furthermore. what happened was exactly in keeping with the published EW analysis so there is absolutely no mystery here. One of the ways we improve as traders is being willing to admit that we were WRONG. Thanks for the kind words Rodney- greatly appreciated!
One of the criticisms often levelled at myself in terms of how I do Elliott wave is that my wave counts change.
I see it this way.
At the start of a new movement there will be many different possible wave counts. If my wave count were to not change then I would have to somehow know what the correct count is going to be right at the start.
That is just impossible.
And I just don’t understand how so many people can’t accept that.
As the wave unfolds I must change with the market, and the idea is to present the different possibilities in order of probability and that order may switch as the wave unfolds and becomes clearer.
It doesn’t mean that EW is only describing what has already happened and therefore is useless in predicting what may happen next. But that is another common complaint.
It’s all an exercise based in probability. Which is exactly what all technical analysis is. And why risk management is so important.
I really do prefer to have members who are experienced traders, because they understand the concepts of probability and risk management in relation to markets and trading. And they accept that markets change and our analysis must change with it.
All I can say is thank heavens your wave counts do change! When I first started to learn about EW, I had a subscription (which I still do!) with analysts with a remarkable penchant for insisting on erroneous bearish wave counts not for simply days or weeks or months but YEARS….literally. It really started to become kind of tragi-comic watching them be so completely wrong about the trend for so long. The ultimate irony was that after the market topped in May of last year these hapless folk starting publishing the first BULLISH wave count I had ever seen them put out. It was outrageously funny and I sent them an e-mail telling then they had become the ultimate contrarian indicator!
The sad thing about these folk is they seemed entirely incapable of admitting when they were wrong and I think they cost an awful lot of folk quite a bit of hard-earned capital because of their market bias.
The first thing I noticed about Lara’s analysis is that she always provided alternative counts. How refreshing! A truly objective analyst!
What others intend as a criticism, is in my humble opinion a wonderful COMMENDATION!!!! Don’t change anything Lara….I don’t care what they say… 🙂
Many thanks for your early thoughts Lara – very much appreciated!
Have a great weekend 🙂
The 21 day EMA is at 1894.28. I have a buy stop to go 100% short available trading capital at 1893.5. In all the years I have been trading the markets, this has to be just about the fattest pitch I have ever seen. Many thanks again to Lara for the incredibly sharp analysis that has brought us to this critical juncture. Best of luck to everyone and see you at the bottom!
Got filled on a “stink bid” for a few more SSO puts. Not too shabby. Gotta sell the rallies! I’m outta here! ‘Bye all… 😀
Premiums on next week options a bit rich. They tend to do that on Fridays.
I am going into weekend short term neutral as I don’t want to pay that kind of premium for near dated contracts. We’ll take what the market gives on Tuesday.
Have an awesome weekend everyone!
Trading next leg down by padding short side of pairs trade. Much more comfortable biased short going into a long week-end.
Volatility basing so end of this move up may be close. Looking for UVXY pop….
We’re close to the 38.2 fib – anyone layering on shorts here? Or waiting for a stronger entry?
A b wave correction probably on the way.
If you are trading options, the market makers are up to their usual tricks with ludicrous bids. As is so often the case, what you see, is not necessarily all you are going to get. They are willing to be reasonable, but you have to know that… 🙂
Thanks for the tip Verne–I’ve been there too. If I have time, I sometimes walk down my bid from somewhere near the bid price, toward the ask price, pausing for awhile at each step, to figure out what they are willing to take.
The voice of experience! It took me a while to learn not to be too much of an eager beaver! 🙂
1st time I have closed everything in 2 years. Managed a decent profit on the up today and quite happy to stay on the side lines until the next set up
Will sleep well tonight
Hey Paresh. So happy to hear you made some profitable trades bud. One day at a time my friend. Hang in there. What’s coming is going to make 2008 look like a block party and I know you will be ready…. 🙂
Thanks for sharing that. Like Vernecarty, I am happy for you and glad you are pleased. Sleep well.
The main hourly bear looks again to be more likely. That will be my preferred count and the one I’ll trade on.
This green candlestick fits that wave count nicely.
So far at the hourly chart level this upwards move looks like it may be an unfolding impulse… maybe for an A wave of a zigzag? The problem is of course there are 17 possible structures if its a second wave (total possibilities 23 – triangles 6 = 17). It is way too early to try and figure out what it is, that way leads to madness in my experience 🙂
It looks like its not over. It should break out of the channel on the main hourly bear at least. Its finding resistance there right now.
This is probably wave A up. Then there will be wave B down. Then wave C up.
Or this could be wave W up (first zigzag in a double). Then X down. Then Y up (second zigzag).
It does look like leisurely impulse underway. If we last a fib three days in this correction I think we may end at highs day with a B correction on Tuesday. I am cashing in upside hedges and trying to get a decent bid for my UVXY puts. Adding a few short term trades for possible B down…
Cool! Got filled on my stc SSO calls! Thank you berry much!
With the US stock markets closed on Monday, does anyone have expectations of the markets selling off into the close, ahead of a 3 day weekend?
If we are still in X (or B) right now and that wave continues into the close, the final wave of X (or B) would likely impulse downward in 5 waves, which would fit your scenario of a sell off into the close. If that happened and the count is correct, the market would likely gap up on Tuesday to finish Y (or C) wave up.
That would fool quite a few bulls and bears so is quite possible imo but it is forseen by EW so really has nothing to do with selling into a long weekend (though it would be viewed that way by market participants).
Needless to say, if that plays out I’ll be on high alert as to it being a bear trap.
Looks like the opposite may be happening…
Yeah – or that might have just been b of (b) with 5 waves down still to go.
I’d rather we blast higher tbh – would provide more clarity and get this thing over sooner. I’ll discard the above idea if possible B up gets longer than 2x A
Prefer rockit ships to boring sideways moves! 🙂
Lara
Is there any way the comments can be put in chronological time order? They seem to be all over the place and it is difficult to follow the train of comments sometimes.
They are.
Except replies to a first comment go underneath that comment.
If replies went at the top and the whole thing was in chronological order… then you wouldn’t know what the reply was to and it wouldn’t make sense.
I agree it does get messy.
We do have some flexibility in how it works I think (this is Cesars domain) though so if we can figure out how to make it better we will.
And so, to be very specific, how would that work? Do you mean replies to go at the top? Is the nesting not working as well as it could?
Lara–my suggestion, a more significant indent of reply under original comment makes visually following a thread or scanning thru the forum much easier.
I think we’re well conditioned to the way Twitter and StockTwitts implement their service. That idea will work well and keep Cesar very busy implementing it! 😉
Yes, I agree. A bigger indentation would make it clearer.
I will pass this suggestion onto Cesar.
Thank you Davey.
Bull flags or bear wedge?! A move back below 1840 and I am going to assume b wave underway…
We’ve moved sideways out of the channel of the move up from yesterdays low, so I think we are probably in (x) now. Prob still got a 5 down to go to complete it. Move above 1858.30 right now would prove this small degree move down from todays high is corrective.
We are currently just sitting on top of the channel down from 1927 – it might now provide support for (x)
Looking at the bigger picture this move up from yesterdays lows looks corrective (to me) so should be fully retraced, but we still have some way to go before price confirms that atm. Falling out the channel this early in the game certainly does not give it an impulsive look and alot of the moves up overlap previous waves (though that could be a load of 1,2’s – but just like previous corrections, it looks very suspicious to me)
If this is (x) unfolding, then going below wherever it ends after another zigzag higher would probably provide that confirmation, but that might not happen today. If it works out like the last correction, the market will not provide confirmation – it will just gap straight through the confirmation points.
Key short term important price pivots for me atm are 1838.53 and 1828.40, but if this move down right now proves corrective, that will likely become my new pivot
Olga are you deriving those targets from FIB retracements from yesterday’s low to today’s high? Thanks
No – they are swing lows of this wave up from yesterdays lows.
They are not really targets – they are price points which would provide me more confidence that this move up will be fully retraced back down (move up is corrective). Though they will not tell you if the entire correction is over – the structure of the move down would possibly do that.
Does X subdivide as a 3,3 5 normally? I am lousy at spotting double zig-zags….
I think X can be any 3 wave structure – reason I said it will probably end in a 5 is because the first move down from todays high looks like a 3 so looks like it might be a flat (or expanded flat in this case).
Poss b of x down also retraced alot of a (looks like 90% but not sure exactly as viewing on my mobile phone).
Its worth noting that we didn’t go above 1858.24 so this move down is not necessarily corrective (it could be a new move down with that first 3 wave structure a 1,2)
BTW – corrections aren’t my strong point either. That is pretty much what seperates EW experts (Lara) from EW students (me), especially B waves. 23 different patterns is too much for me to think about!
I am hoping it just takes a little time and dedication looking at the markets everyday to get better at analysing corrections. I presume it took Lara a bit of time before she could spot what was going on, and presume there are times she knows EW well enough to just let things clear up rather than go mad trying to follow a crazy complex correction.
Only about eight years 🙂
And I still get it wrong often enough to be annoying
Despite 8% move down in UVXY, MM very stingy on bid for puts. Dirty, Rotten, Scoundrels! I’m holding ’em!
😀
Placing “stink bids” to start reloading short positions. Keep an eye on DJI 16000 as it is rare for these pivots to be given back so quickly. A close above means more bullish implications for the short term. It also means cheaper puts for the medium and long term! 🙂
Any thoughts on how to count today’s move up? We’ve already moved almost 50 points off of yesterday’s low, and I am wondering how much further we might have to go?
61.8% fib re-tracement is as good a bet as any. It coincides with formidable resistance at the horizontal cyan line. Target is 1894.63
This also in step with my theory for a re-challenge of the 1900 pivot where I think upward movement will stall.
The move in crude is crazy,good opp presenting itself there
Stock markets seem to be highly correlated during this phase of the bear market. The TSX Composite has a series of waves that overlap, suggesting that the last rally on the daily chart for the S&P 500 is minuette wave (ii) instead of minor wave 4. This adds support to the bear wave count.
FTSE count suggests the same. S&P count much more sneaky – not moving into wave 1’s so keeping us guessing whether wave 4s or 2s. Times like that I always look at other markets.
Thanks for posting the chart – very useful info.
Another bearish wedge for what may be A leg of ABC upwards correction….will go for a small scalp at the end of B…
Slick MM lowers bid/ask on puts as UVXY declines. Lowered cost basis to gladly oblige… 🙂
The neat thing about a pairs trade is, while market neutral, one of the positions will give you an early clue as to what the MMs think is in the works… 🙂
Ordinarily a move above upper BB for UVXY a set up for short trade with second close below BB being the trigger- these are not ordinary times by any means!
Does anyone know a good crude oil bull 2x or 3x etf?
My broker does not allow UWTI or USO.
Thank you,
UCO
Thank you Vern.
Most welcome… 🙂
Jack
Change your broker — USO is a widely used /CL proxy
Thank you sunny. I’m gonna shop around for a better broker.
You can also short SCO, which is an 3x inverse with good volume
Thank you ari.
Doing a short term (one week out) pairs trade- short UVXY and short SSO; very light position…
Rebound looking rather weak. Unless we get a bankster cash dump to motivate the bulls, UVXY suggesting this thing could witness an early demise… 🙂
Just added to SPX long position
Long DUST is doing well. Will sell this position at gold $1140
Great analysis, Lara! You give us all the critical points to watch.
Thank you. Working well so far for S&P… here’s hoping it offers us all another sweet opportunity on a plate about 1,895 next week
It clear that new money is coming into the market and the reason I say this is based on the following observations on the S&P behavior over the last 20 days or so.
1. Majority of the drop happened outside the normal market hours thus limiting the participants. so a controlled walk down.
2. If you bought S&P every morning at the market open and sold at market close, you would come out positive as per my numbers. I believe the net difference over the 20 or so days is +3 i.e. close was higher thus making it profitable.
Overseas markets are in flux and money needs to go to the strongest market, I think ARI mentioned the foreign money yesterday on this board and that got me thinking
US based members might be interested in this commission free stockbroker. I have heard good things about them but never used them so please do some due dilligence.
https://robinhood.com/
good evening,,,,
I’m pulling for alternate hourly bear
Good morning 🙂
Good evening 🙂
I have decided to take my profit. I have set an order to open another short position at 1,892. If it gets up there it will probably be while I’m fast asleep.
Good luck everybody!
Woo Hoo! Lara’s first!
Very wise decision to take the money an run. A bounce is a coming. 🙂
Third actually.
Not big ones, I didn’t position myself correctly higher up.
But still more profit than loss so far on S&P by a fair margin so I’m happy
The way Mr. Market is acting, we might hit 1890’s today around noon and be negative by market close. This market is very choppy, but can’t say its unpredictable having your analysis as a guide 🙂 Thanks again, and again!
Yep. I think the reversal is going to strike like a snake. It may even run up into the close and trap bullish folk over the holiday weekend with scary futures Monday night. I might take an intra-day stab at upside; no way going into the weekend long this market except for a very light hedge. Just my two cents…