
A new low below the August low of 5,768.22 was required and expected.
This week’s FTSE analysis is for members only. To subscribe click here.
Summary: FTSE has most likely recently ended a correction. More confidence may be had that the downwards trend has resumed when the orange channel on the daily chart is clearly breached. The short term target for the next interruption to the trend is at 5,023. The mid term target is at 4,296. If targets are wrong, they may not be low enough. Expect surprises to be to the downside.
To see monthly and weekly charts and the bigger picture see last analysis here.
New updates to this analysis are in bold.
WEEKLY WAVE COUNT
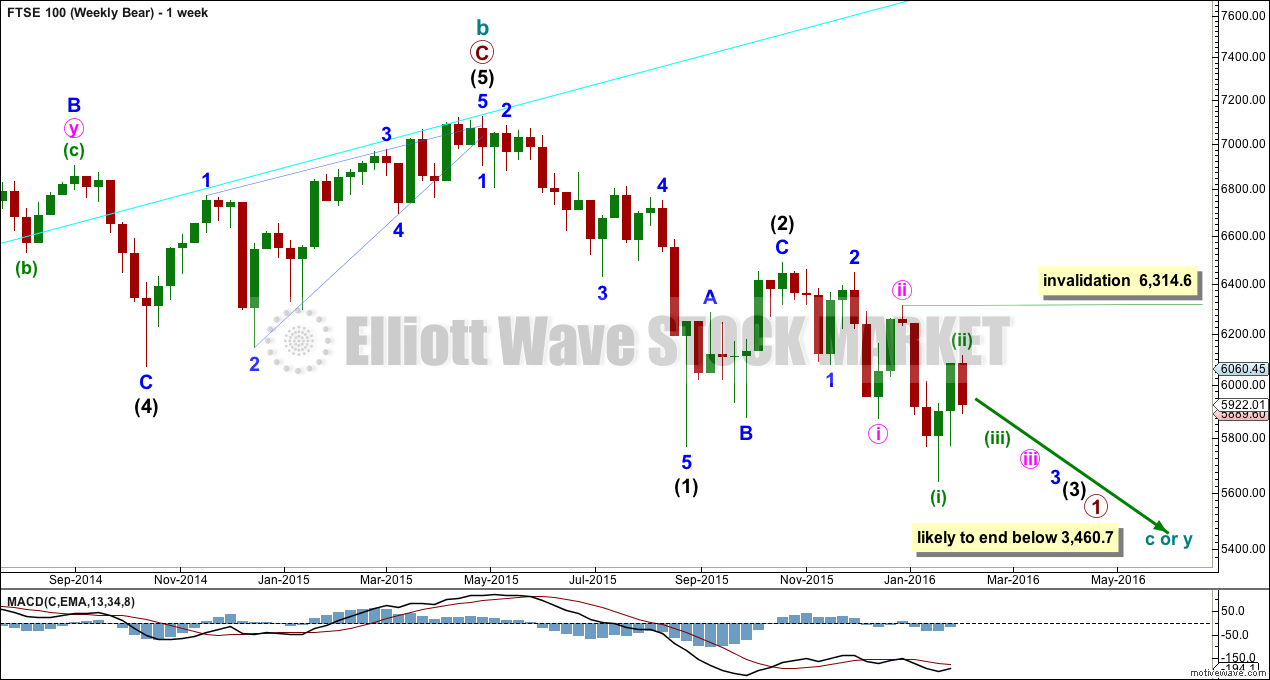
Click chart to enlarge.
From the all time high in April 2015, FTSE has a five down and a three up. This current fall should move well below the end of intermediate wave (1) at 5,768.22 and then remain below that point. Intermediate wave (3) must move beyond the end of intermediate wave (1), far enough below to allow room for a subsequent fourth wave which may not move back into intermediate wave (1) price territory.
Price has now made a new low below the August low at 5,768.22. Downwards movement should continue.
DAILY WAVE COUNT
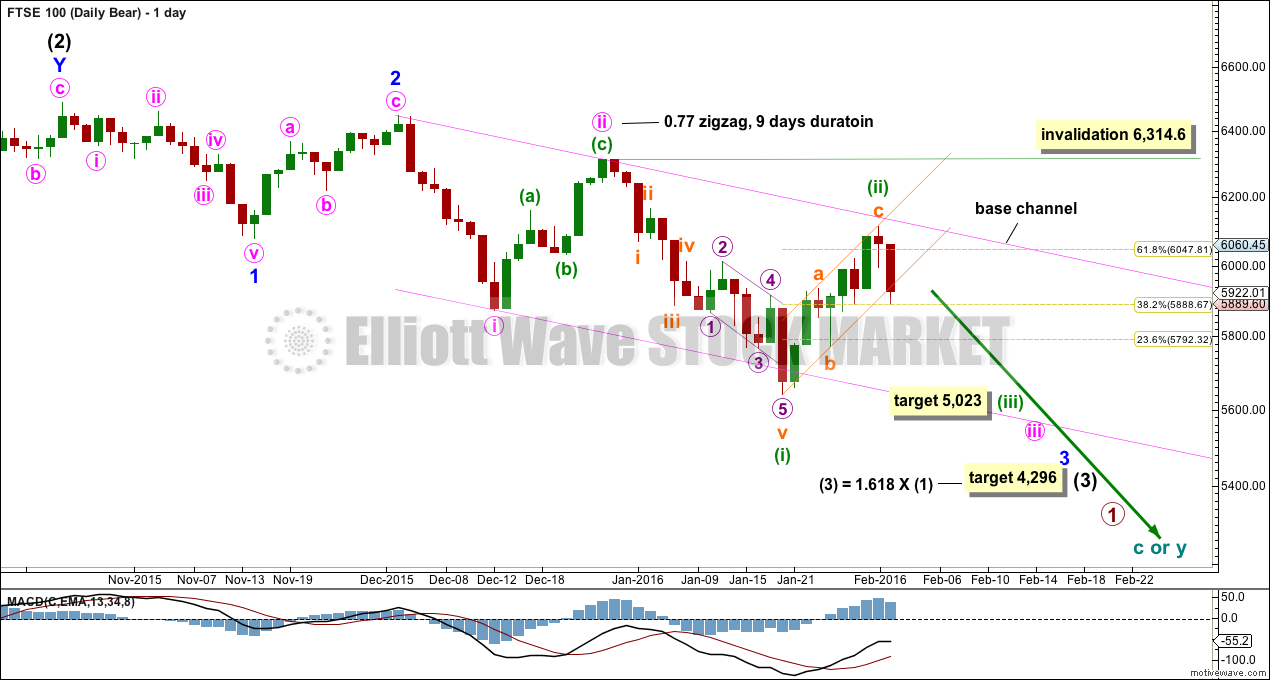
Click chart to enlarge.
So far the middle of the third wave cannot have passed for FTSE. Upwards movement labelled minuette wave (ii) is back in minute wave i price territory. This cannot be minute wave iv, so it may only be yet another second wave correction if this wave count is correct.
Intermediate wave (2) lasted 42 days. Minor wave 2 lasted 11 days. Minute wave ii lasted 9 days. Each subsequent second wave is shorter in duration than its predecessor giving the wave count the right look. None of these waves are exhibiting Fibonacci durations.
Minuette wave (ii) may have completed in a Fibonacci 8 days total, reaching a little above the 0.618 Fibonacci ratio and finding resistance at the upper edge of the base channel. A lower degree second wave correction should not breach a base channel drawn about a first and second wave one or more degrees higher.
When the small orange channel about minuette wave (ii) is breached by a full daily candlestick below it and not touching it, then that would provide trend channel confirmation that minuette wave (ii) should be over. At that stage, the invalidation point may be moved down to the high of minuette wave (ii). For now the risk will remain that minuette wave (ii) is not over and could continue higher, although that looks very unlikely.
Minuette wave (ii) may not move beyond the start of minuette wave (i) price territory above 6,314.6.
The target for intermediate wave (3) remains the same at 4,296 where it would reach 1.618 the length of intermediate wave (1).
A shorter term target is calculated for minuette wave (iii). At 5,023 it would reach 1.618 the length of minuette wave (i).
If targets are wrong, they may not be low enough.
Of all the indices I follow with Elliott wave counts, FTSE remains the clearest bear.
TECHNICAL ANALYSIS
DAILY CHART
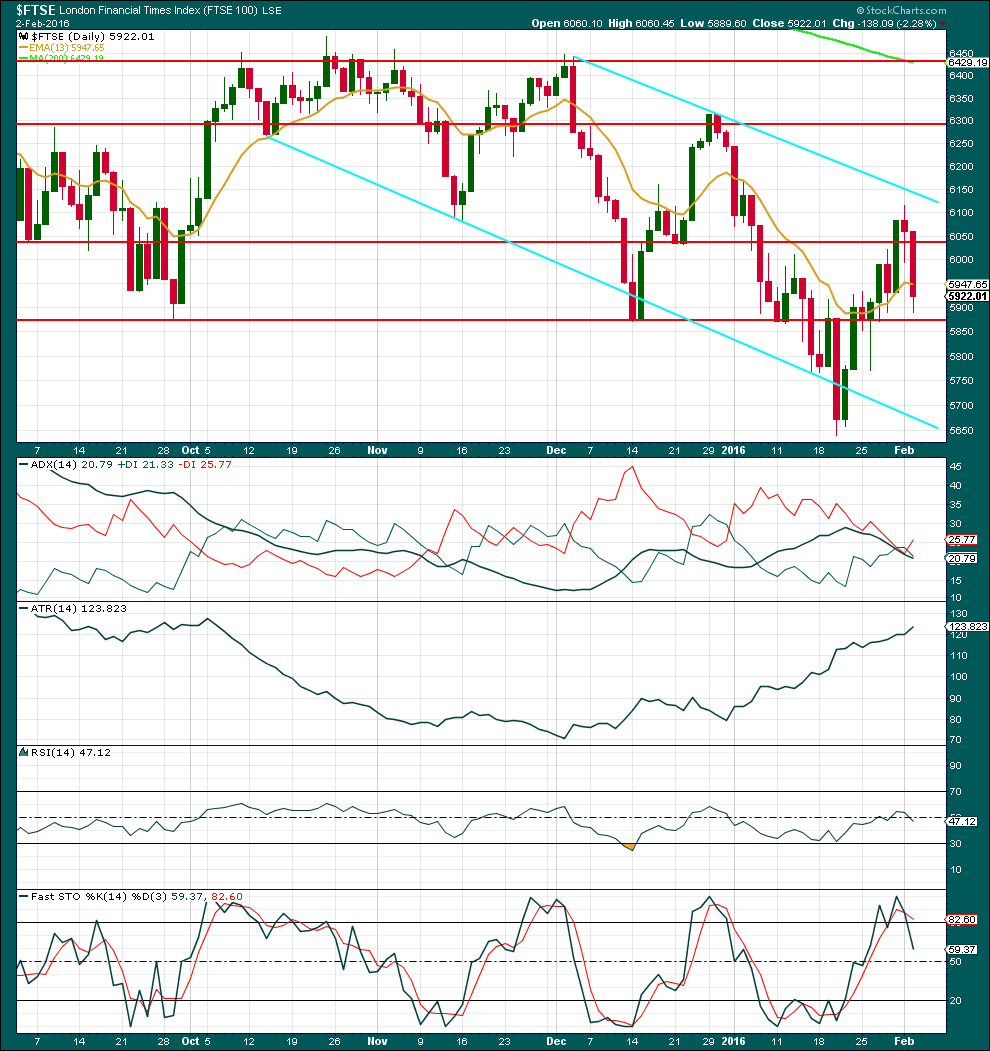
Click chart to enlarge. Chart courtesy of StockCharts.com.
There is no volume data on either the FXCM feed or StockCharts. Volume analysis is done from Yahoo Finance data.
Volume declined as price moved higher from the first day of the upwards bounce overall to the high. This supports the Elliott wave count which sees this upwards movement as a correction against the trend and not a new trend.
The strong downwards day for 2nd February comes with some increase in volume. As price fell, it was supported by volume. The volume profile for FTSE continues to be bearish: as price falls, volume increases; as price rises, volume declines. This supports the Elliott wave count.
ADX indicates the market is not trending; it is consolidating. ADX does not indicate a trend change: the -DX line is still above the +DX line. If the ADX line again turns upwards, then a trend will again be indicated.
ATR does not indicate the market is consolidating as it continues to increase. This is more indicative of a trending market.
This divergence with ADX and ATR does not make sense.
The last three daily candlesticks complete an evening star pattern. It is not ideal. There is no gap between the first and second candles, but the third candle not only closes well into the body of the first candle it closes below it. This is a reversal signal when it comes after an upwards trend.
Price may find some support about 5,870. If price breaks below this line, then it may offer resistance for a throwback.
If ADX is correct in that this market is not trending, then price may be expected to swing from resistance to support and back again. At this stage, price has overshot resistance and Stochastics reached overbought at that time. Price is now returning from resistance and Stochastics is returning from overbought. Price should be expected now to continue lower and not stop until it reaches support and Stochastics is oversold at the same time. This range bound approach to this market does not diverge in expectations of more downwards movement from price with the Elliott wave analysis.
This analysis is published @ 02:44 a.m. EST on 3rd February, 2016.
Thank you Lara – I invest primarily in FTSE and this analysis is very clear and helpful.
Am I right in believing you are also shorting the FTSE?
Yes, I am.