
Higher prices were expected for Monday.
Higher prices is what happened.
Summary: The correction may now be complete, but this absolutely requires confirmation before any confidence may be had that the downwards trend is about to resume. A clear breach of the upwards sloping orange channel on the hourly chart is required for confirmation. The risk will be that price could continue higher up to but not above 2,081.56 while we do not have confirmation.
To see how each of the bull and bear wave counts fit within a larger time frame see the Grand Supercycle Analysis.
To see detail of the bull market from 2009 to the all time high on weekly charts, click here.
Last published monthly charts can be seen here.
If I was asked to pick a winner (which I am reluctant to do) I would say the bear wave count has a higher probability. It is better supported by regular technical analysis at the monthly chart level, it fits the Grand Supercycle analysis better, and it has overall the “right look”.
New updates to this analysis are in bold.
BULL ELLIOTT WAVE COUNT
DAILY CHART – COMBINATION OR FLAT
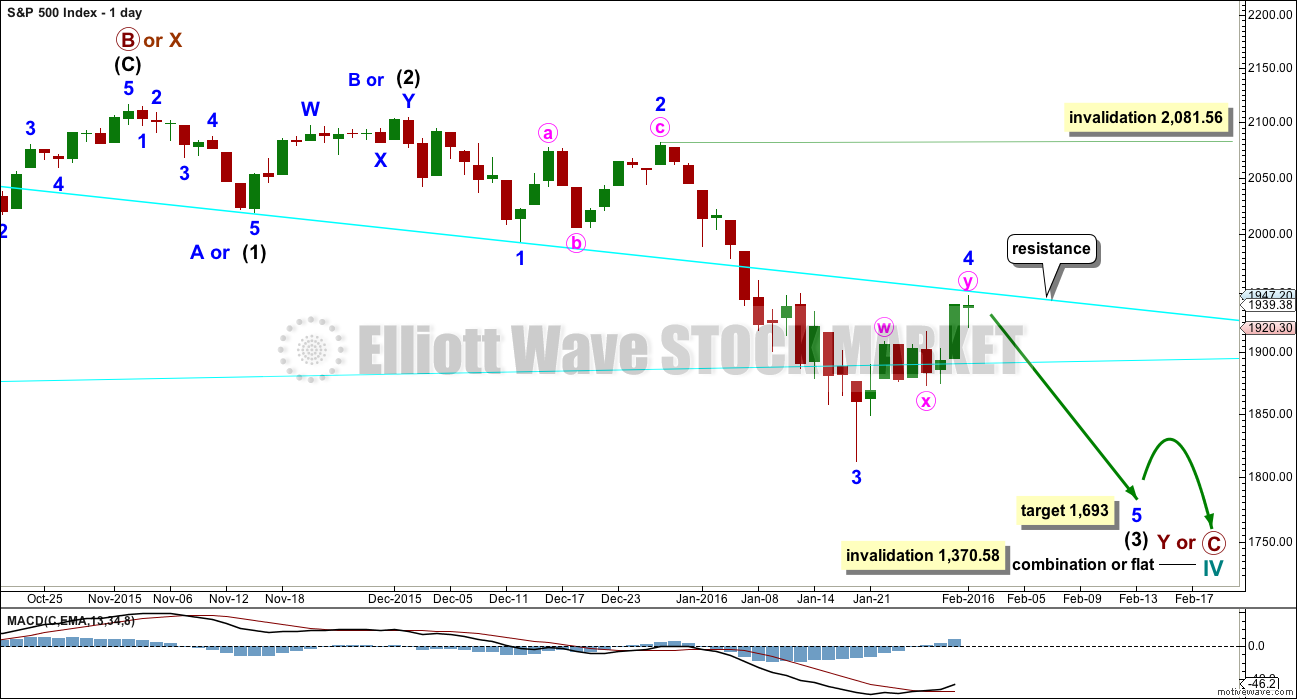
Click chart to enlarge.
This wave count is bullish at Super Cycle degree.
Cycle wave IV may not move into cycle wave I price territory below 1,370.58. If this bull wave count is invalidated by downwards movement, then the bear wave count shall be fully confirmed.
Cycle wave II was a shallow 0.41 zigzag lasting three months. Cycle wave IV should exhibit alternation in structure and maybe also alternation in depth. Cycle wave IV may be a flat, or combination.
Cycle wave IV may end within the price range of the fourth wave of one lesser degree. Because of the good Fibonacci ratio for primary wave 3 and the perfect subdivisions within it, I am confident that primary wave 4 has its range from 1,730 to 1,647.
Primary wave C should subdivide as a five and primary wave Y should begin with a zigzag downwards. This downwards movement is either intermediate waves (1)-(2)-(3) of an impulse for primary wave C or minor waves A-B-C of a zigzag for intermediate wave (A). Both these ideas need to see a five down complete towards the target, so at this stage there is no divergence in expectations regarding targets or direction. When and if these two ideas diverge, I will separate them out into two separate charts. For now I will keep the number of charts to a minimum.
Primary wave A or W lasted three months. Primary wave C or Y may be expected to also last about three months. It is now in its second month at this stage and may not be able to complete in just one more. It may be longer in duration, perhaps a Fibonacci five months. That would still give a combination the right look at higher time frames.
Within the new downwards wave of primary wave C or Y, a first and second wave, or A and B wave, is now complete. Intermediate wave (2) or minor wave B lasted a Fibonacci 13 days exactly. At 1,693 intermediate wave (3) would reach 4.236 the length of intermediate wave (1).
This daily chart and the hourly chart below both label minor wave 3 as complete. It is also possible that the degree of labelling within minor wave 3 could be moved down one degree, because only minute wave i within it may be complete. The invalidation point reflects this. No second wave correction may move beyond its start above 2,081.56 within minor wave 3. If this bounce is minor wave 4, then it may not move into minor wave 1 price territory above 1,993.26.
Price has come up to find resistance at the upper cyan trend line today. This line goes back to 20th July, 2015, (its first anchor) and is reasonably shallow, has been repeatedly tested, and has reasonable technical significance. It should be expected to offer reasonable resistance and this may end the upwards correction here.
HOURLY CHART
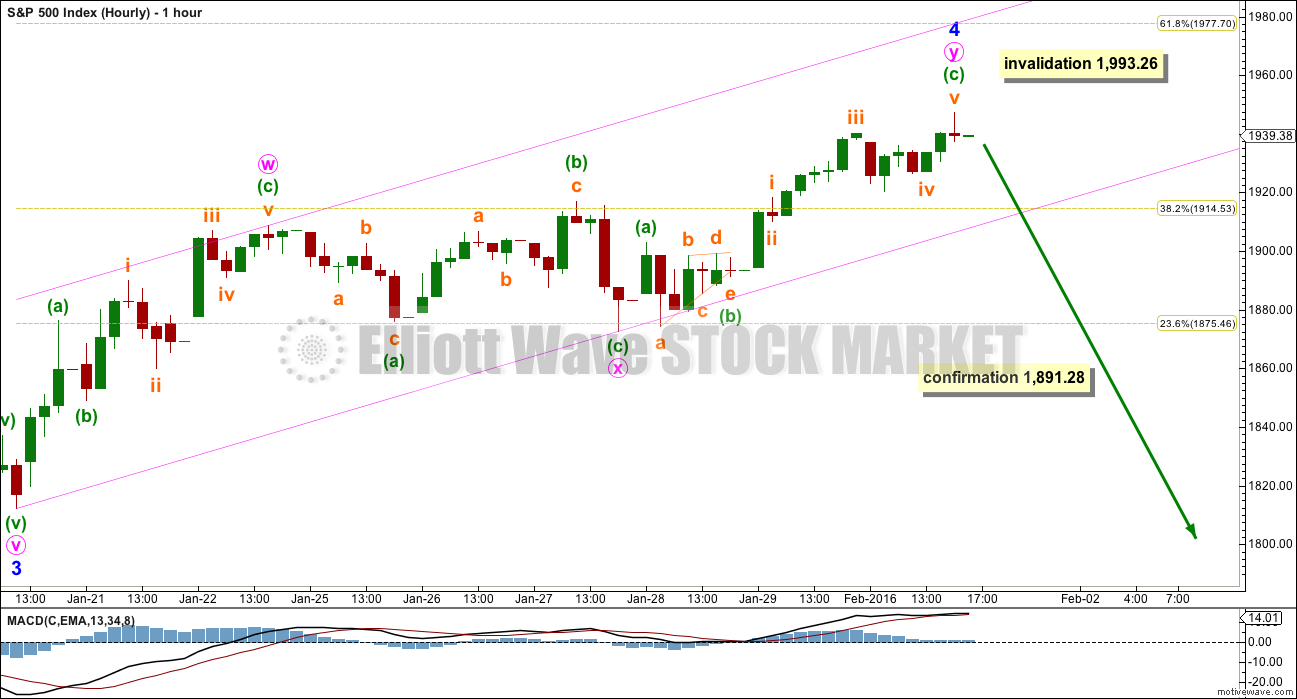
Click chart to enlarge.
At this stage, the corrective structure which has the best fit is a double zigzag. This movement now has a clear three wave look to it on the daily chart.
If this is a fourth wave correction, then the least likely structure for it would be a zigzag or zigzag multiple. That would not provide adequate alternation with the second wave zigzag.
However, alternation is a guideline, not a rule, and it is not always seen.
The probability that a fourth wave is unfolding has reduced. The probability that this bounce is a second wave has increased.
Because both bull and bear wave counts see this structure in the same way on the hourly chart, further comment will be with the bear wave count.
BEAR ELLIOTT WAVE COUNT
DAILY CHART
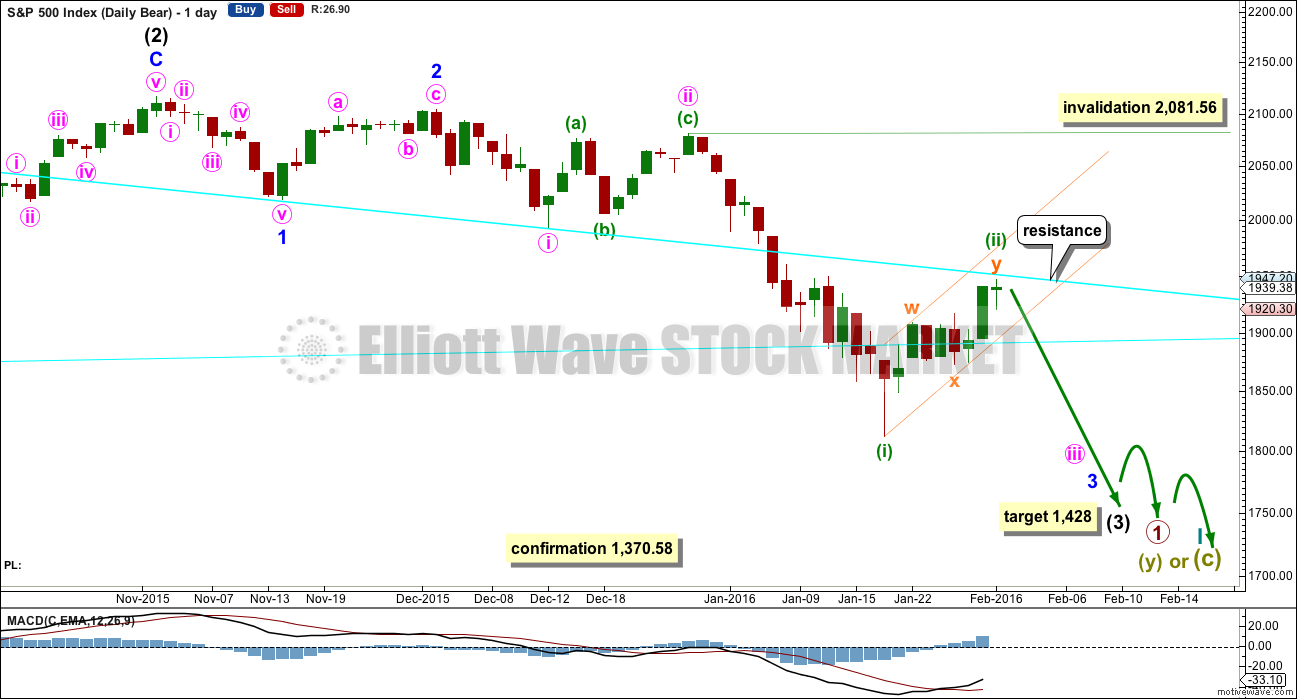
Click chart to enlarge.
This bear wave count fits better than the bull with the even larger picture, super cycle analysis found here. It is also well supported by regular technical analysis at the monthly chart level.
Importantly, there is no lower invalidation point for this wave count. That means there is no lower limit to this bear market.
Downwards movement so far within January still looks like a third wave. This third wave for intermediate wave (3) still has a long way to go. It has to move far enough below the price territory of intermediate wave (1), which has its extreme at 1,867.01, to allow room for a following fourth wave correction to unfold which must remain below intermediate wave (1) price territory.
Intermediate wave (2) was a very deep 0.93 zigzag. Because intermediate wave (2) was so deep the best Fibonacci ratio to apply for the target of intermediate wave (3) is 2.618 which gives a target at 1,428. If intermediate wave (3) ends below this target, then the degree of labelling within this downwards movement may be moved up one degree; this may be primary wave 3 now unfolding and in its early stages.
The correction for minuette wave (ii) may today be over totalling a Fibonacci eight sessions and finding resistance at the upper cyan trend line. A small channel may now be drawn about this correction. When this orange channel is clearly breached by downwards movement, that shall provide trend channel confirmation that the correction is over and the downwards trend has resumed.
Intermediate wave (2) lasted 25 sessions (no Fibonacci number), minor wave 2 lasted 11 sessions (no Fibonacci number), minute wave ii lasted 10 sessions (no Fibonacci number) and now minuette wave (ii) may have lasted a Fibonacci 8 sessions. Each successive second wave correction of a lower degree has a shorter duration which gives the wave count the right look, so far.
While we have no technical confirmation that minuette wave (ii) is over (while price remains within its channel), the risk will be that it could continue higher. Minuette wave (ii) may not move beyond the start of minuette wave (i) above 2,081.56.
The degree of labelling within minute wave iii may also be moved up one degree. This correction may be minute wave iv. I will wait to see how momentum behaves for the next wave down to make a final decision on which degree of labelling is correct. For now I will leave the labelling as the most likely for a second wave due to the duration and the structure of a double zigzag.
If the next wave down shows a strong increase in momentum, then it would be the middle of a big third wave.
If the next wave down shows weaker momentum than minuette wave (i), then it would be a fifth wave to end minor wave 3.
HOURLY CHART
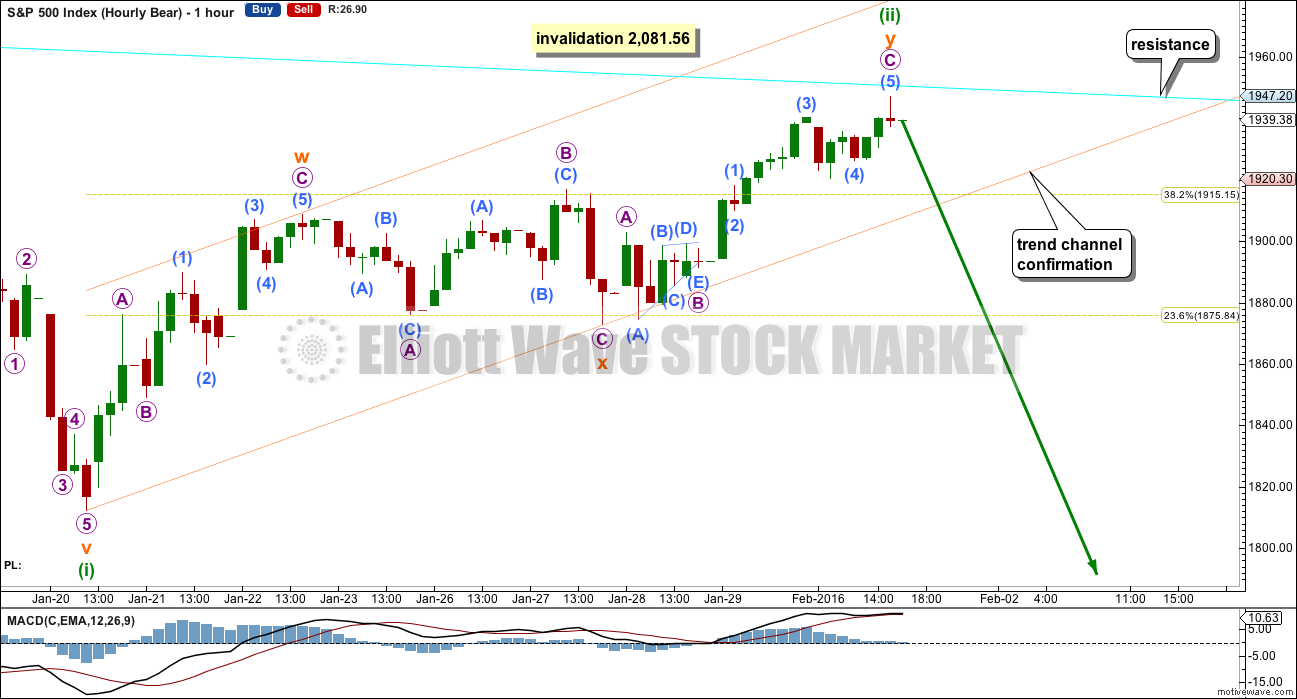
Click chart to enlarge.
The structure of this correction fits neatly as a double zigzag.
There is alternation between a quick zigzag of submicro wave (2) and a triangle of submicro wave (4) within the second zigzag of subminuette wave y.
The final wave of submicro wave (5) can be seen as complete on the five minute chart. However there is not enough downwards movement at the end of the session to confirm that submicro wave (5) is over. Downwards movement could still be a second wave correction within submicro wave (5) which could yet be extending and continuing higher.
The simplest method to confirm a trend change is a trend channel or trend line. When downwards movement clearly and strongly breaches the lower edge of the orange channel, that shall provide first trend change confirmation of a trend change. I define a breach as at least one full candlestick below and not touching the lower trend line.
A new low below the start of minuette wave (ii) at 1,812.29 on a downwards day with an increase in volume would provide classic technical confirmation of a breakout.
TECHNICAL ANALYSIS
DAILY CHART
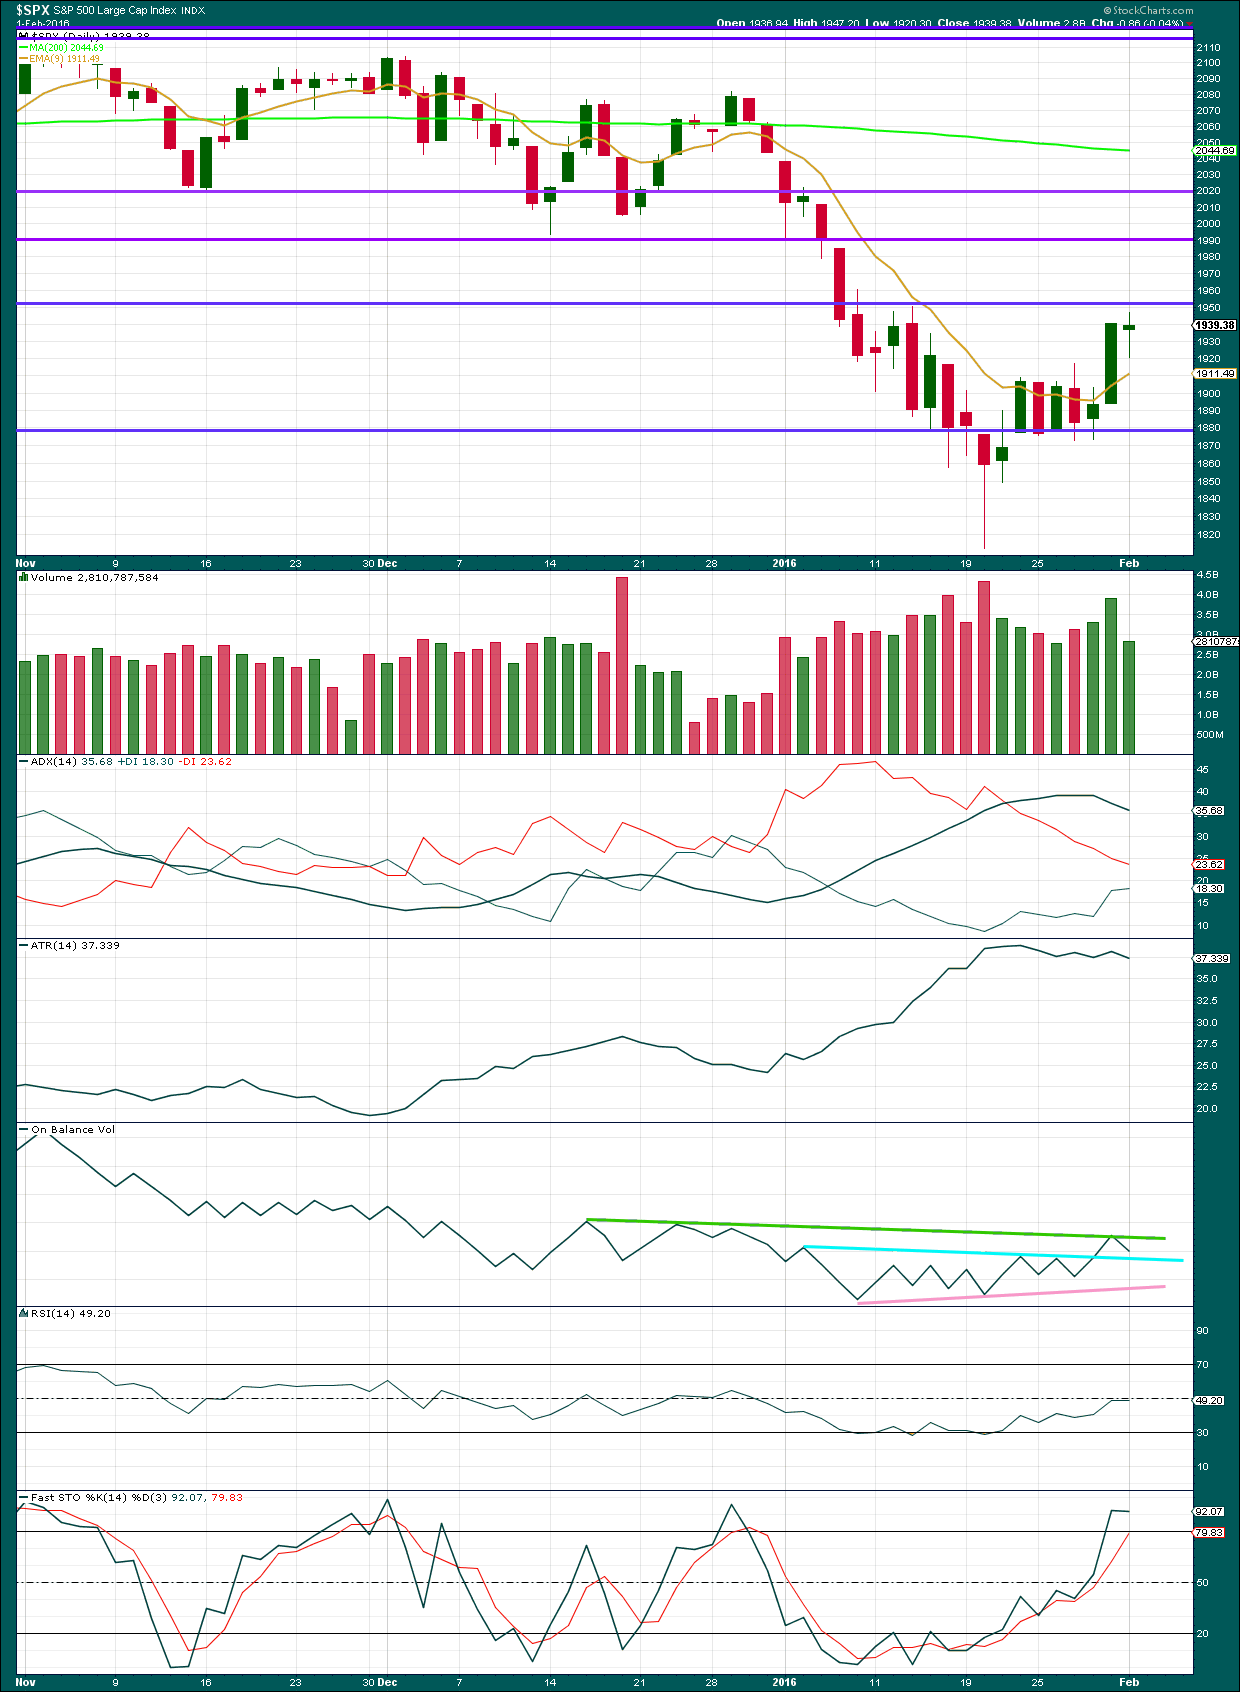
Click chart to enlarge. Chart courtesy of StockCharts.com.
A green candlestick with lighter volume for Monday alleviates some of the concern I had for Friday’s strong upwards day on high volume. The bulls pushed price higher today, but they could not manage much and it was done on much lighter volume. The rise in price was not supported by volume.
Overall volume for upwards days during this correction remains lower than prior volume for downwards days.
However, it is still concerning that during this correction the strongest volume is for upwards days. That would indicate an upwards breakout should be more likely than downwards. If we see a strong downwards day with an increase in volume in the next two sessions, then this remaining concern would be removed.
Price may be finding some resistance about the horizontal trend line at 1,950. If price breaks above 1,950, then the next line to offer resistance is about 1,990.
The upwards week last week is enough to resolve the weekly hammer which appeared the week before.
ADX is declining indicating the market is not trending. Importantly, ADX has not indicated a trend change: the -DX line remains above the +DX line.
ATR agrees as it is flat. This market does not look like it is trending.
On Balance Volume has found resistance at the green line and turned down from there. Price made a new high but OBV turned down. This is a weak bearish signal. The cyan line on OBV is adjusted today. This may offer support. If OBV breaks below that line, it would be a stronger bearish signal. To the upside, if OBV breaks above the green line, that would be a reasonably strong bullish signal.
Stochastics has reached overbought. A range bound approach would expect a downwards swing from here, if the market remains range bound as price has reached resistance at the same time.
DOW THEORY
For the bear wave count I am waiting for Dow Theory to confirm a market crash. I am choosing to use the S&P500, Dow Industrials, Dow Transportation, Nasdaq and I’ll add the Russell 2000 index. Major swing lows are noted below. So far the Industrials, Transportation and Russell 2000 have made new major swing lows. None of these indices have made new highs.
I am aware that this approach is extremely conservative. Original Dow Theory has already confirmed a major trend change as both the industrials and transportation indexes have made new major lows.
At this stage, if the S&P500 and Nasdaq also make new major swing lows, then Dow Theory would confirm a major new bear market. At that stage, my only wave count would be the bear wave count.
The lows below are from October 2014. These lows were the last secondary correction within the primary trend which was the bull market from 2009.
These lows must be breached by a daily close below each point. So far the S&P has made a new low below 1,821.61, but it has not closed below 1,821.61.
S&P500: 1,821.61
Nasdaq: 4,117.84
DJT: 7,700.49 – this price point was breached.
DJIA: 15,855.12 – this price point was breached.
Russell 2000: 1,343.51 – this price point was breached.
This analysis is published @ 10:14 p.m. EST.
do we have a global crash brewing? Japan, Hong Kong both down over 3 %
Well negative interest rate 10X as dangerous.
IMHO…
Cash in accounts are base currency that gets leveraged 10X in debt markets. So, in a situation with negative interest rate on deposits, base currency gets taxed (disappears). The problem is now you have less and less base currency to leverage. So 10X of the disaster. Hence in effect, Japan by setting their interest rate at -0.1% just practically raised their interest rate by 1%. Liquidity squeeze…
Above is 100% my theory/opinion.
Jack–interesting. I wondered if negative deposit rate was intended to drive money out of deposits and into treasuries and stocks, thus proping up those markets?
I am sure that is what they are thinking…
Some prof is gonna get a Nobel prize a few years down the road by “figuring out” how the CBs thinking were backwards and how the negative interest rates accelerated a bad situation.
I just don’t see a good ending in this. At some point my best guess is CBs are going to print money and find their national governments without buying government bonds.
(Majority of) the world is in debt…
Fund* their national governments
It is my opinion (based upon my technical analysis) that the global crash has been brewing for some months, since about May last year.
I concur since May 20, 2015 at SPX 2134.72….
Ok
All
Have a great Tuesday !
Futures sinking btw…
Bye!
Nothing less than a hundred point overnight decline is going to impress me as long as we are above that 1900 pivot. NEVER underestimate the banksters folk…the health of your portfolio depends on it… 🙂 🙂 🙂
Ironically (or not) SPY bounced off the low of $189.54 – 1 penny lower than the 10 day moving average.
just to recap the day!
Just some food for thought for those that look to moving averages as part of their analysis. The 10 month MA has crossed over the 20 month MA (monthly chart level). The last 2 times it has done that in the past 15 years was May of 2008 and January of 2001. After those crosses the markets had their largest selloffs. Hopefully that pattern continues.
Lehman Brothers goes bust in 2008
SPX in 15 days -33% down, down and down!
Vern–I asked this question below but pull it forward as I am startled to see you, the guru of volatility, switch.
Why switch to SDS, it vey closely tracks VXX, almost no short-term variance to VXX?
I still love volatility and that is definitely my bread and butter for short and mid term trades. SDS options however do offer slightly better spreads and are less prone to the wild swings common to volatilty instruments when you are sitting on a large position. Sill sitting on lots of vol calls….I am curious to see how high some of these things are going to go in a super cycle bear market decline…can they possibly exceed the credit crisis performance??!! I think the firms making a market in some of these leveraged ETFs are going to absolutely blow sky high…how can they not? It makes trading ’em kinda dicey… 🙂
Vern–thanks. Yes the issue of leveraged ETFs in major market moves will be interesting. How and when they reset against their parent index is probably complex and I will guess very profitable for fund management.
Thanks for that info… Had not realized that…
I have tons of research on how many days sell offs took!
15 years of sell offs from 10% or more!
I use stock charts frequently..
Laters.
So far as moving averages are concerned, the 20 month ema is the grand-daddy of them all when it comes to identifying long term trends….it has loudly spoken but apparently not a lot of folk are paying attention…amazing isn’t it??!! They will eventually… 🙂
It looks like a great set up for a big correction. Thanks for posting the chart. Just gives confirmation to my general sentiment… sometimes we can get lost trying to predict daily stuff. Lol
Indeed! Nothing so important as keeping the BIG PICTURE in mind…As you can see, there is also a lot of bankster desperation evident in that chart…. 🙂
http://www.bloomberg.com/news/articles/2016-02-02/rates-less-than-zero-is-bank-stress-fed-wants-to-test-in-2016
They are playing with FIRE!
They will face a revolt of mass proportions if they go down that road!
Negative interest rate is going to accelerate liquidity squeeze…
Most Americans have either no savings or very little saved, so the revolt is not going to be because of negative interest rates…hunger maybe.
http://www.marketwatch.com/story/most-americans-have-less-than-1000-in-savings-2015-10-06
Many have 6mo., 1 to 2 years of their income in savings. Older Americans (The Baby Boom Gen) have hundreds of thousands spread in several banks).
So I disagree with that statement.
Those under age 35 maybe not!
I don’t know which America you are talking about. The America that I live in most people live paycheck to paycheck…not a statement…just facts.
http://www.startribune.com/most-americans-don-t-have-enough-money-to-cover-a-500-emergency/366277561
http://money.cnn.com/2013/06/24/pf/emergency-savings/
I have many clients over my 25 years and have talked to 50 times more prospects. This is what the older baby boom generation have.
Under age 35… no.
It be good if you can site your sources…because as you know anybody can make up stuff.
The danger is in the capitilisation rate. Most banks have less than 3% of their depositors money on hand. If those numb-skulls start charging people to hold their money, there will undoubtedly be a stampede to take money out of the banks and keep it under mattresses. Many people are already doing just that. Only a complete fool would let the banksters STEAL their money in this deplorable fashion. With so little of depositors money actually available, negative interest rates in the US would have to be one of the most suicidal blunders on the part of clueless banksters. For that reason alone I doubt they will try it.
They have their lackeys putting trial balloons out there… to gage reaction.
Europe is doing it and so is Japan. Here there will be a rebellion.
30 Year Treasury Yield is at 2.667% at the moment….
That is a sign of something… for SURE!
Switching to less volatile short instrument pro shares ultra short S&P 500
(SDS). Placed contingency order to buy at SPX close below 1900. I am a bit wary about the way they are hanging on to this pivot. Never underestimate the banksters…. I will breathe easier when I see futures down 150 handles…I guess that is what they are (unwittingly or not) engineering! Yikes! 🙂
Looks like someone does not want this to close below 1900. From an EW perspective round numbers mean absolutely nothing to me, but I cannot deny that something ‘fishy’ seems to be going on around 1900 today.
Why 1900? Why not 1891? Is the market that simplistic?
If we close above 1900 are things that much more rosy than closing above 1897? Just can’t get my head around it!!
Is 1900 important in some other TA maybe?
They are going to play the rest of this out overnight!
I have a theory that round pivots are places a lot of people put in stop orders, which in turn triggers millions of buy/sell orders… Maybe that’s why markets usually stall at these places before gaining more momentum???
Just an idea. I don’t think “market manipulation” answers 100% of every fishy phenomenon.
The banksters make money if market is going up or down anyway. So why would they care about some arbitrary number? Why would anyone think they’re loosing money if markets crash? They MAKE the market… They make trillions no matter what happens.
Good points Ari. I imagine if someone had an interest in propping up the market, obviously defending these pivots would give would-be short sellers pause. It certainly does in my case…!
Interestingly enough, once the pivot is broken, all they have succeeded in doing is amplifying the subsequent selling as folk watching pile in with a vengeance… 🙂
While it does not have EW significance, and old FX mentor taught me a lot about the psychology of round number pivots and over the years I have definitely noticed a significant influence on market action. Paying attention to it has kept me from making a lot of bad trades…I wish I had a sounder technical reason, other than crowd psychology for why it is important.
Yes. I do think the market is that simplistic 🙂
Vern–why switch to SDS, it vey closely tracks, almost no short-term variance to VXX?
The spread is a slightly better on the options, and the volatility on big positions not as extreme. It can be a bit unsettling watching six figure swings in your position on volatile days! Still holding lots of volatility calls though. Those are my short and medium term bread and butter trades! 🙂
These banksters are completely nuts! Do they really think they are ultimately going to be able hold these pivots??!! I hope this IS a third wave down. The problem with this kind of stupidity is then the market falls too far too fast…they are really screwing up proper price discovery and then the whole thing blows up…
If I was gambling with someone else’s money, and all my bad decisions were forgiven, bailed out and such like – no doubt my risk appetite would also be a tad higher.
The market stopped being a market when they decided to use it as their main propoganda.
Without too much fanfare and little reporting by the so-called press, the US congress recently give them the go-ahead (revocation of provisions of Glass-Steagall) to just that with clients’ deposits.
The last great Bull attempt by the PPT now in play.
They are drawing a pattern to suck in more suckers!
paging Kevin Henry….
1917.04 is the mark (Lower trend channel line in bear chart above by Lara)
through 4PM on the hourly chart in real time.
Now at 1901.21 3:07PM
1898.45 new daily low 3:10PM
S&P just cut Ratings of 20 Oil Companies
Banks down 5%+ today… a sign?
yes – down, down and down!
financial sector exposure to the oil sector cold be the killer blow imo
Just an opinion I share nothing more – I think it is time to clean up the house.
I think Deutsche Bank Group should come crashing down in the near future with $70 trillion of outstanding notional derivatives (no way you can off set that) and then coin toss between JPM and Citi.
They are all toast!
They will keep the derivatives issue in Super Secret Status until nothing is left standing. BTW: I believe the number is a lot higher.
Have you ever seen anything like this??!! Neither side seems prepared to take any prisoners. One thing is for certain, today’s close is HUGE…yikes!!
The analysis won’t change much at all today.
If we have higher volume for todays down day that will add confidence.
We have a clear breach of the channel on the hourly chart. A breach on the daily chart would add more confidence.
A new low below 1,812.29 on a day with increased volume would add full and final confidence that the downwards trend is resuming.
And so depending upon your risk appetite you may choose one or more of those conditions to be met before you have enough confidence in a downward trend to act accordingly.
I’ll be watching for a throwback to the lower orange trend line now, and if price does that I’ll look for an entry short there. A second wave correction may do that; now that this line has been breached it may offer resistance.
Now remember, this may be the very start of the very middle of a big third wave, or it may also be the very start of a fifth wave to end the big third wave. Both options remain viable. If momentum of this next wave down is weak then its a fifth wave. If momentum of this next wave down is stronger then its the middle of a third wave (most likely, but still could be a fifth if it’s behaving like a commodity).
For FTSE it absolutely can’t be a fifth wave. FTSE has a different wave count than S&P, but they are moving together at this time. And so I do lean towards the third wave scenario rather than the fifth partly for this reason.
FTSE is down hard too. I will take the time to update that later today.
Lara, the bulk of this move lower occurred overnight… so how do we read volume on a move like this? Only 10 points in the SPX occurred after the 1st 10 min. of trading.
I can see on the 5 minute chart that most of this move occurred in the first 10 minutes of trading, down 20 points.
And it gapped open down 4 points. The gap of 4 points won’t have volume recorded and I think that’s okay. The gap itself is part of the TA.
So I would assume that the volume for that big 20 point move in the first 10 minutes will be recorded as part of todays session.
Is that a fair assumption?
Am I missing something? (serious question Joseph, I respect your knowledge and experience and I don’t make digs)
Yes there is volume 1st 10 min.
If I remember correctly the ES was projecting SPX down 20 at the open.
After 1 min. 1925.66
2 min. 1922.52
3 min. 1920.24
I never understand (maybe you can explain) if projected down 20, why does it show trades for less than that at the open?
When the same is projected in NQ you get the full gap down on chart for NDX of 20.
My understanding would be that ES and S&P (cash market) are two different markets.
Although obviously extremely closely related.
The groups of people trading them would have a big overlap, many people may trade both, but the’ll also have some in each that don’t trade the other. So from an EW / psychology point of view they will have slight differences in the people so slight differences in the wave counts.
So what happens in ES while NY is closed is not exactly replicated when NY opens and the S&P begins trading.
I don’t follow ES but I have in the past done a wave count for that data and there are slight differences between ES and the S&P.
I have not done any analysis at all of NQ and so I cannot make a comment there.
Bears rejected at 1900.35 with hammer. They are having trouble breaking the pivot. This is a cautionary note for the near term bearish case IMO…
its all about crude right now, equities just following the leader
Too small to be a rejection… + not much volume.
i agree. #bearishalltheway down, down and down!
Drawback of looking at small time frames….I find the back and forth fascinating! , as Spock would opine…. I fully expect the bulls to keep fighting as if their lives depended on it (it does!)…. 🙂
1915.38 is the mark (Lower trend channel line in bear chart above by Lara)
through 3PM on the hourly chart in real time.
Now at 1903.79 2:21PM
Looks like they may move big move down into the over night futures market. Best way for no one to play at optimal price.
That’s why I have been positioned and holding!
down, down and down!
lets get this sell off started already!
this pic is awesome man!
Avnerilan has a count for a minuette 2 C up that I would have to consider very seriously if 1900 not broken today…the bears really should have punched thorough it by now…
That particular count has very low probability imho, but there are others with higher prob which will get very serious if we go above 1918.61 short term
Below 1891 the odds get better but there are still alternates. Below 1872 they all get invalidated so that level is most conservative imho.
I’ve lightened up here a little as I don’t like this lack of momentum. If we go below 1891 with a bit more steam I’ll get fully back on board
Me too…
Verne
o.k, well I think this pic sums up holding short here if you are long term positioned that is….imho
I Love that Hand!!!!
Keep you poker face though.
I used to goto the casino. Markets are more fun….
Blackjack is more fun than the markets and so is certain poker games. Even fun when you lose.
Especially these day’s when very few things make sense in the markets. You have to throw out everything you have learned over the years.
Create some new rules to play by and hope you have the timing right.
Sitting tight medium and long term dude…target 1500.00 with tight stops to trigger below 1600.00. Let’s blow those round number pivots already!!!!!
.
API inventories coming out later, that could be a real driver in crude, thus the indices. Cant say about the SP500 but energy accounts for 12% of the weighting in the FTSE, bad news there will hammer it big time and the trend there favours the bears.
Bears line in the sand 1904.50 If the bulls take it, may be a short term bullish sign…
Blood feud underway…the bulls know what lies just beneath…I don’t blame them for fighting tooth and nail…
Vix bull flag?
You betcha! It’s gonna make a run at 100! (UVXY that is) 🙂
Bit concerned about momentum (or lack thereof) atm
Me too. Looks like it is stair-stepping down but if pivot not broken by close I am going to lighten up a bit. It could still sell off into the close. The persistent bullishness is quite remarkable…!
Verne
Bollinger band looks busted imo…
last week at 2100+.
early this week at 2000+
now losing 10 points in 1 day at 1991.
tomorrow and the next few days 1970 ish on the upper band level..
be careful!
if crude retest day lows its going break imo
Bears making another run at 1900 pivot. Let’s wish ’em Godspeed…if we break it, DJI goes down another 100 points in short order…UVXY blows past 50…
I have the lower orange trendline on the hourly chart as providing support, followed by a retest, followed by (currently) a break below not touching it.
We’re just missing a bit of momentum atm to allow myself to fully commit. Now 75% short
Thank you Olga for the chart. I also agree with Rodney’s post earlier. SNP 1873 is the biggest support we need to break through… I’m hoping this will occur in the next 1-2 sessions. Bounces at whole numbers ar expected as Vern mentioned as well.
So 1915, 1900, and 1873 seem supportive right now.
Hope all are enjoying today’s down move (so far anyway) as much as I am…
The protracted tug-of -war around these round number pivots can be really annoying. We are either going to see another ridiculous bounce if they are not soon taken out or we get 100 SPX points to the downside in short order. *sigh* 🙂
1914.20 is the mark (Lower trend channel line in bear chart above by Lara)
through 2PM on the hourly chart in real time.
Now at 1907.85 1:12PM
I hate when this happens but I have to leave my desk / computer for the rest of the day. I have my stops in but expect to see the market lower than now (SPX @ 1909) at the close. I look forward to reading all the comments this evening. good luck to all.
“Luck is opportunity met with preparedness”
George Allen former coach of LA Rams and Washington Redskins.
The price go up to build minuette (ii)
Agree this needs to be taken into consideration, but with such a huge relative time difference (proportion) between your wave (2) blue and wave (4) blue they would appear (to me) to be different degree waves labelled as the same degree – so I would personally consider this count very low probability (which doesn’t mean it’s not possible).
If market can move below your wave (1) blue high it would put this alternate count to bed.
If we move above 1918.61 short term, I’ll be certainly looking more closely at counts like this.
Technically possible… in that you can force anything you like pretty much.
Highly unlikely.
This idea and others that may actually have better proportions would be invalidated with a new low below 1,872.7. And so depending upon your risk appetite waiting for a new low below 1,872.7 before having confidence in a trend change and acting accordingly might be a good idea.
UVXY flying a bullish pennant. First clue of an ambush reversal would be a fill of the gap open from yesterday’s close. If that happens, it would be smart to take the money and run and go neutral for the near term.
The 401K’s of Individuals are left holding the bag… Again! That’s the largest home of Buy and Holder’s and dollar cost averaging holders. + others who do this.
Here is the headline of a popular blog that was just posted:
”
The Numbers Are In: Hedge Funds Furiously Dumped The Rally; Selling Was “Biggest In Nearly Two Years” ”
That is the rally from last week!
Tyler’s stuff is always insightful!
That explains the Volume on those up moves.
The dirty little secret is that a lot of pension funds are holding “mutual funds” loaded with high yield junk bonds. The geniuses at the SEC relaxed the rules to allow this idiocy. 🙁
High Yield have been in duress for months. I am amazed how quiet they are keeping this. Business media doing a disservice to their listeners and readers.
I herd some dumb ass on CNBC yesterday say… Buy high quality… “High Yield”.
An unbelievable statement! All High Yield are by definition Non-Investment Grade Bonds.
I am jumping the gun with the rest of my dry powder. The banksters seem to be willing to let ‘er rip…. I still want to see a CLOSE below those pivots or I am taking profits intra-day… 🙂
ps Here are some goro coins
Bear is correct! Why? One word, complacency!
I am jumping the gun with the rest of my dry powder. The banksters seem to be willing to let ‘er rip…. 🙂
Will there be a short-term bounce up now (how high) for a short entry point.
Very tricky to find a intraday bounce in a down trend. Last move up was around 1918 but as you can see it could pick up speed heading down.
Bouncing above the last bounce at around 1918.61 would make this downward move from yesterdays high look corrective, so I’m hoping we don’t bounce higher than that.
That’s my line in the sand atm
hi
verne and joseph and jack and the rest of the guys!
have a great day!
Bear flag broken to the downside projecting another 35 point move down to about 1873 which is a stronger support the bears need to take out.
Another shooting star but in the middle…..
Strong break of 1908.85 and that’s all she wrote!
1912.06 is the mark (trend line in bear chart above by Lara)
through 12PM on the hourly chart.
Thinkorswim TD Amer is accurate
1910.40 has been breached to 1909.31. The 1st hour mark of 1909.43 has also been breached. 1912.06 is breached by 1 hour increase in Trend Channel Line.
Now we need a clear break on hourly with some down volume. That may not happen until this afternoon. Or it cold happen at anytime… who knows???
You want to use 1908.85 from Olga fine… but if you are using Lara’s Bear Count hourly chart 1912.06 is now the mark in real time.
Each hour the mark moves higher. I will post where it is each hour.
1913.25 is the mark (trend line in bear chart above by Lara)
through 1PM on the hourly chart.
Sadly my powder dried up, have a few small positions but not sure I will be able to ride this wave down as I did in 2007-2008.
Just shows what greed does, leverage makes it easy and hind site is wonderful
A lot of lessons learnt
Genuinely wish you all good well and hope the most vertical 3rd wave appears very soon
Stick with it Paresh – an acorn grows into a tree buddy.
We’ve all learnt those lessons the hard way – unfortunately it’s probably the only way to learn them properly.
I learned the hard way in 1987 and again in 2000.
Did not trade 2008-2009 (wish I had the powder then because I had that right) but I did move all my retirement funds into a Fixed Index Annuity in late 2006. So I took zero losses during that one.
I am not going to miss this one!
1904.76
Totally off topic (hope nobody minds) but I would be very interested in hearing how different members are planning wealth preservation in the very likely crazy times ahead.
Initially I had much of my wealth in Zurich Kantonalbank as the Canton provided a 100% guarantee (for what that is worth), but they kicked me out a couple of years ago due to ‘me not being one of the few nationals they now concentrate on’.
I’m now mainly in physical cash (mainly USD & CHF, small amount of GBP) and physical gold stored in a non- bank institutions.
I still have far too many ‘bank digits’ in different banks for my liking, but changing all into actual physical cash is getting more difficult by the day. I intend to convert much of my ‘bank digits’ to physical gold but I’m still awaiting another drop in price to new lows.
Many thanks in advance for your ideas! 🙂
Definitely a good idea to have possession of your assets and cash has surprisingly posted a better return than anything else the last 24 months.
There is also a strong case to be made for diversifying across several jurisdictions. Banks in Hong Kong, Singapore, and Andorra are better capitalized than most. The big multi-national banks are technically insolvent because of their derivatives exposure and huge portfolio of non-performing loans. People keeping their money with these guys are in for a rude surprise. Anybody looked at DB’s chart lately?!
ps. Don’t wait too long to get your gold. There may soon be a big disconnect between price and availability.
Yeah – re: diversification I agree. I live in a few different countries so that was quite easy for me (if you have a local address it is slightly less hassle). Given the choice I would rather not have *any* money in any banking institution other than very small amounts for paying bills etc.
Re: gold – again, I hear you and accept the risk. That is the reason I have steadily been accumulating,
But I can’t help but think we are heading for severe deflation where gold will suffer, unless the war on cash really takes off and everyone wants (needs!) gold. That would be something entirely different.
I think wealth preservation is an interesting subject that is not talked about nearly enough. It’s fine making money in the markets, but how do you keep it.
What broker accounts will go belly up taking all your profits with them? What is the best way to protect yourself against all this? All questions that need answers!
Over the years I have found this is a much tougher subject than it first seems. It is obvious that Central Banks intend to trap as much of peoples hard earned cash in the system as they can.
Harry Dent thinks Gold will hit 700/oz and he may be right. I plan on continuing to steadily accumulate all the way down. Also trying to build long term positions in the miners with proven reserves ABX, NEM, GOLD, SA. I really like GORO as well as they will actually pay your dividend in the yellow metal. Obviously you need a huge position to be able to take physical delivery of your dividend so I bought a ton of call options as far out as I could and plan to keep rolling into the future. At some point after the commodity cycle bust concludes, I hope to exercise the calls for a few hundred thousand shares and take physical delivery of my dividend. They mint a beautiful bullion coin with an eagle’s picture on it.
If your broker went bust, would you still be able to get your hands on your gold / shares? (BTW – this is an honest question – not a dig)
This is another major concern of mine – counterparty risk. I presume all assets (inc your shares) would goto the liquidator as they are not bought / ringfenced in your actual name, and even if they were, despite you having a legitmate claim it could still take years to resolve everyones claims.
Now times that by 10 brokers all going bust along with a couple of major banks and governments and it could possibly be a problem. i realise this is a very gloomy picture, but if we believe what EW is possibly telling us is around the corner, then this picture could become very real.
That’s my understanding – if I have got the wrong of the stick on this, please let me know.
Did you know that you can STILL request your certificates for your shares directly from companies? You can make arrangements for the paper to be sent directly to you even if your broker remains the intermediary OR you can buy shares directly from the company and have them set you up with a dividend re-investment plan. If the brokerage goes belly-up you presumably would still be covered. A lot of folk don’t know that brokerage accounts are NOT insured by the FDIC. You really are trading at your own risk.
I realise for shares this is possible (albeit mileage probably varies drastically by each company), but thought you had options?
I don’t really understand options that well, but thought they were simply a contract in effect written up by a financial insitution with no claim on the underlying shares if that financial institution went bust?
Again I could be way off the mark with my understanding of that.
You are definitely onto something there. I cannot help but think of what happened to Jon Corzine’s clients at MF Global. Isn’t it amazing that the justice department did absolutely nothing about that scandal? They quietly bought off all those folk who lost millions. I think there is definitely a danger of borkerage accounts being frozen during primary three down. I think as much as it means missing the sweet spot of the decline, it would be smart to have cashed out a good portion of your positions early and put the cash in a drawer at home. It makes my head spin just thinking how bad this thing can really get. Yikes!
Absolutely bang on the money!! That is my thoughts exactly.
I’ll be trading the first few fairly big waves down but after that I’m out!!
Keeping my eye out for a nice place to purchase in New Zealand for that very same reason, albeit the market there has plenty of falling to do first.
I can’t think if many places in the world other than there that will be far enough out of the way to be worth living in.
Again – sorry for the gloom, but I think it is a very worthwhile conversation.
Not directly related to technical analysis, but not off topic in terms of the bear wave count at all.
And thanks for bringing the subject up Olga. It is definitely something that we all need to consider and plan for.
I am going to look into the possibility of buying some NZ Government bonds. Our government debt to GDP ratio is relatively low in New Zealand.
In NZ I think the risk in the crash will come from household debt which has fuelled our property market bubble. It is unsustainably high, back about 160% of disposable income, which is where it was in 2007. I suspect the banks operating in NZ may be at risk of failure.
But I don’t think the NZ Government is at risk of failure. And so I am considering the possibility of our Government bonds.
When I’ve taken a closer look I’ll let you all know what I find.
As I’ve said before NZ property is a horrible buy right now, I see it at the peak or close to the peak of a bubble. Wait until it’s burst and then pick it up at really cheap prices!
And if any members are considering coming to New Zealand email me and I’ll give you the local insight into which areas are best for your needs. I’ve lived all over the North Island in my lifetime, I have family all over and in the South Island too (Dunedin).
Many thanks Lara – please do keep us posted. I have a feeling this topic will come up more and more if Mr Market is going down the bear route!
Not that it is required, but your insight into NZ provides me with a huge amount of added value.
Had a quick look at NZ gov (kiwi) bonds. You can buy them from ‘registered’ NZ banks, but unfortunately (for most of us), non NZ residents (inc non resident NZ passport holders) cannot buy / own them from what I read.
https://www.newzealandnow.govt.nz/investing-in-nz/practical-info/buying-bonds
https://www.anzsecurities.co.nz/directtrade/static/kiwibonds.aspx
Okay, thanks Olga.
The good news is that our citizenship is pretty much up for sale. If you buy a property here (not that I recommend it at current prices) it counts towards your application for citizenship as “investment”.
If you have enough money you can become a NZ citizen.
We also allow dual citizenship.
A legitimate concern. I doubt there is a perfect solution as any currency, gold coin, bitcoin, etc can be confiscated or outlawed by government. Diversification across assets class and institutions probably the only reasonable solution.
It is my opinion we are in a macro deflationary environment, the USD will continue strong as “best of the worst” for some time, so, while diversification is important, allocate a significant percent to USD, when everything deflates, move USD into assets.
While it sounds crazy, 3 months of USD cash buried under a favorite tree or rosebush can’t hurt.
Thanks Andrew – I totally agree. I once commented on here that the trade of the century will most likely be moving from physical cash to physical gold at just the right time (which I agree is most likely USD – albeit I am diversified approx 30% CHF 70% USD just in case!).
It seems the keyword with everything on this subject is ‘physical’
My Gold analysis expects it may be in a huge zigzag to the downside, and the a wave isn’t finished.
I do have an alternate bull count, but still a larger correction and still not yet halfway through.
And so overall I’ll still expect Gold price to keep falling.
But in the middle will be a cycle degree b wave. That may be very confused, choppy overlapping, lasting one to several years of upwards movement.
Then c down.
Yeah – I’m a big fan! (EW Gold subscriber) 🙂
Many thanks also for your updates on that site re: USD:NZD and NZ housing. As you can tell from my above comments – Gold, NZD and NZ housing is very much a part of mine (and probably quite a few others) future wealth preservation strategies.
Nice pop on UVXY calls. Rolling half into next week…. 🙂
I would be convinced with a CLOSE below 1900….
1908 is the top of orange wave w. Below that this move could not be a 4th wave correction of a 5 wave impulse up from 1812 (as in that case what is currently labelled orange wave w would be (a very suspicious looking) wave (i)).
All extra clues.
Inventories soon on crude likely to create volatility
The banksters in the US are going to furiously buy this decline in an attempt to intimidate the bears despite what is ahead. SHORT ‘EM! 🙂
It looks to me like we are about to break out of the lower upward sloping channel line which is a clue that the trend has changed.
1909.43 is the mark through 10 AM
It’s higher each hour after 10AM… I will update each hour.
Thanks Joseph. It is sometimes difficult for me to draw the trend lines exactly as Lara. The 1 min, 5 min, and 15 min have all broken their respective short term up channels. We are ever so close on the hourly.
1910.40 is the mark (trend line in bear above)
through 11AM on the hourly chart.
Thinkorswim TD Amer is accurate
1910.40 has been breached to 1909.31. The 1st hour mark of 1909.43 has also been breached.
Now we need a clear break on hourly with some down volume. That may not happen until this afternoon. Or it cold happen at anytime… who knows???
Each hour the mark moves higher. I will post where it is each hour.
Not sure how accurate the charting is on my trading account (IB) but I don’t have any breach yet on any timeframe. I have the lower trendline currently running through 1907 about right now.
To be a little conservative I would consider a breach to be a clear break with an hourly candlestick below and not touching the line, so we will probably hit 1891 price confirmation whilst awaiting full trendline confirmation.
I am already 25% short – by the time the above plays out (if it does), I’ll be back 100% short.
If we get some 3 wave up structures above confirmation, I’ll use them to scale in.
You are correct Olga if you are extending the trend line from the hourly to your shorter time frame charts. What I often do is to draw different trend lines on my short term charts. For instance, on the 1 minute chart my trend line starts at yesterday’s early morning low then touches the 1 PM low giving a point today at roughly 1932. That has been broken. I am just looking for clues in the shorter time frames as to what might happen in the hourly time frame.
I hope I have not confused any one. Sorry if I did.
At this point I have half of my short positions filled. Waiting for further confirmation.
Ah right – yeah to follow / trade waves at lower degree I do exactly the same.
Stock Buybacks is a waste of cash and is does nothing to generate future revenue which is the life blood of a Company.
The beginning of the end of Stock Buybacks is here and to spread like wildfire…
“Exxon Halts Stock Buybacks As Oil Production Surges”
“In the first quarter of 2016, the corporation will continue to acquire shares to offset dilution in conjunction with its benefit plans and programs, but does not plan on making purchases to reduce shares outstanding.”
Two Points both related to the issue of the potential for a more pronounced decline in the markets :
1) If there is expected to be a forthcoming acceleration in movement down then it might also be expected that there will be sharper counter-trend rallies such as that on Friday Jan 29. Larger movements in both directions was a pattern that developed as the market moved into the 2008 crash.
2) With regard to the Dow Theory, the original Dow Theory sell signal in 1929 was only days before the crash. In fact the same pattern can be seen in both the 1987 and 2008 crashes, that is, there is an initial move down in both the DJIA and the DJTA, then a counter-trend rally in both lasting in the range of a couple of months and then a move of both averages below the initial low point literally days or at most a couple of weeks before the major move down in the market. This is the pattern in all three major market crashes (1929, 1987 and 2008). It is this pattern as framed using the Dow Theory that interests me most, though it is rare. This time, i.e. post 2014 I realise that most Dow Theorists have already issued a Dow Theory Sell signal as of the August drop in the markets. However if one is looking for a signal on a tighter time frame (and possibly a pattern like 1929, 1987 and 2008), the August 2015 drop could be considered as the initial decline. The subsequent rise in the DJIA and DJTA represents the counter-trend rally. The DJTA has now broken below the August closing low but the DJIA has yet to register a closing value (the original Dow theory used only closing values) below its August low closing value (15, 666.44 on August 25). This could be called a confirmation of the Dow Theory Sell signal that has already been issued if you like. I would add the the counter-tend rally (Intermediate wave 2 (black in your charts) has already lasted significantly longer than the equivalent rallies in 1929, 1987 and 2008 which is a concern I have as to the time-frame that a major decline might occur over. I am using Yahoo Finance to get the historical data).
Your wave labeling seems to indicate that the steepest part of the decline could be imminent (Bear Case). The wave count would be Minuette Wave (iii) down which would be the the steepest part of Minute wave iii (Pink) which would be the steepest part of Minor Wave 3 (blue) which of Intermediate wave 3 (black). So one benchmark that we are in Minuette Wave (iii) could be when the DJIA closes below 15,666.44. The SP500 has already closed below its August low value but strictly speaking, this is not part of the original Dow Theory.
What I like is that HYG has broken below is rising ending corrective diagonal, since it has tended to lead the SPX and other indices. It has not yet broken below its corrective trend channel yet, but I am expecting it to do so before the SPX.
Lara,
Did you mean ‘Confirmation 1891’ on the first hourly chart? You have invalidation above and invalidation below.
Thanks,
Ben
Yes, thanks Ben!
That is fixed now.
First!! first comment on the first of feb. looks like futures are gaining some steam to the downside,, we know that can change though.