
Upwards movement was allowed for as one possibility within this bounce.
Overall, this bounce is unfolding as expected.
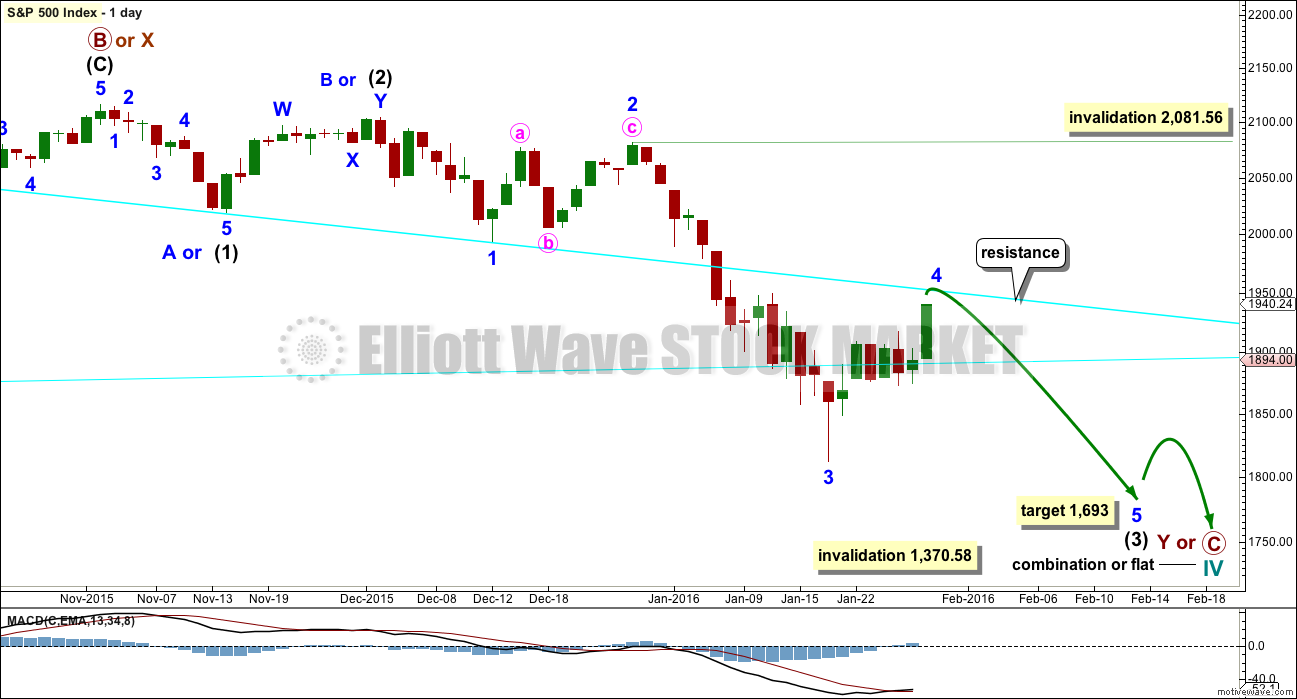
Summary: The bounce looks like a second wave double zigzag which is almost complete. If it ends with one more upwards day on Monday, it would total a Fibonacci eight sessions. Expect price to find resistance and end at the cyan trend line on the daily chart. However, I am concerned that Friday’s strong upwards day was well supported by volume. That concern would be alleviated if another upwards day comes on light volume, but for the short term it strongly indicates that Monday should see higher prices.
To see how each of the bull and bear wave counts fit within a larger time frame see the Grand Supercycle Analysis.
To see detail of the bull market from 2009 to the all time high on weekly charts, click here.
Last published monthly charts can be seen here.
If I was asked to pick a winner (which I am reluctant to do) I would say the bear wave count has a higher probability. It is better supported by regular technical analysis at the monthly chart level, it fits the Grand Supercycle analysis better, and it has overall the “right look”.
New updates to this analysis are in bold.
BULL ELLIOTT WAVE COUNT
DAILY CHART – COMBINATION OR FLAT
Click chart to enlarge.
This wave count is bullish at Super Cycle degree.
Cycle wave IV may not move into cycle wave I price territory below 1,370.58. If this bull wave count is invalidated by downwards movement, then the bear wave count shall be fully confirmed.
Cycle wave II was a shallow 0.41 zigzag lasting three months. Cycle wave IV should exhibit alternation in structure and maybe also alternation in depth. Cycle wave IV may be a flat, or combination.
Cycle wave IV may end within the price range of the fourth wave of one lesser degree. Because of the good Fibonacci ratio for primary wave 3 and the perfect subdivisions within it, I am confident that primary wave 4 has its range from 1,730 to 1,647.
Primary wave C should subdivide as a five and primary wave Y should begin with a zigzag downwards. This downwards movement is either intermediate waves (1)-(2)-(3) of an impulse for primary wave C or minor waves A-B-C of a zigzag for intermediate wave (A). Both these ideas need to see a five down complete towards the target, so at this stage there is no divergence in expectations regarding targets or direction. When and if these two ideas diverge, I will separate them out into two separate charts. For now I will keep the number of charts to a minimum.
Primary wave A or W lasted three months. Primary wave C or Y may be expected to also last about three months. It is now in its second month at this stage and may not be able to complete in just one more. It may be longer in duration, perhaps a Fibonacci five months. That would still give a combination the right look at higher time frames.
Within the new downwards wave of primary wave C or Y, a first and second wave, or A and B wave, is now complete. Intermediate wave (2) or minor wave B lasted a Fibonacci 13 days exactly. At 1,693 intermediate wave (3) would reach 4.236 the length of intermediate wave (1).
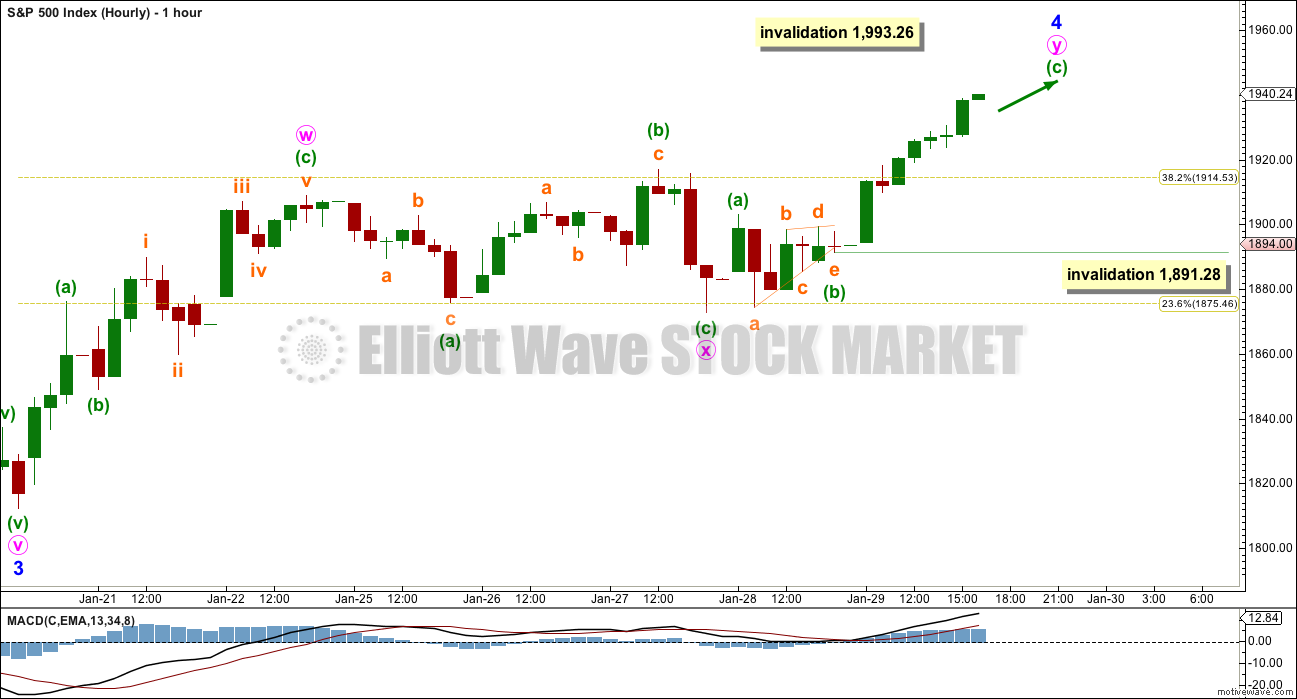
This daily chart and the hourly chart below both label minor wave 3 as complete. It is also possible that the degree of labelling within minor wave 3 could be moved down one degree, because only minute wave i within it may be complete. The invalidation point reflects this. No second wave correction may move beyond its start above 2,081.56 within minor wave 3. If this bounce is minor wave 4, then it may not move into minor wave 1 price territory above 1,993.26.
Price broke through support at the cyan trend line which is drawn from the August lows to September lows. This line is no longer providing resistance. The next line to offer resistance may be the downwards sloping cyan line.
HOURLY CHART
Click chart to enlarge.
At this stage, the corrective structure which has the best fit is a double zigzag. This movement now has a clear three wave look to it on the daily chart.
If this is a fourth wave correction, then the least likely structure for it would be a zigzag or zigzag multiple. That would not provide adequate alternation with the second wave zigzag.
However, alternation is a guideline, not a rule, and it is not always seen.
The probability that a fourth wave is unfolding has reduced. The probability that this bounce is a second wave has increased.
BEAR ELLIOTT WAVE COUNT
DAILY CHART
Click chart to enlarge.
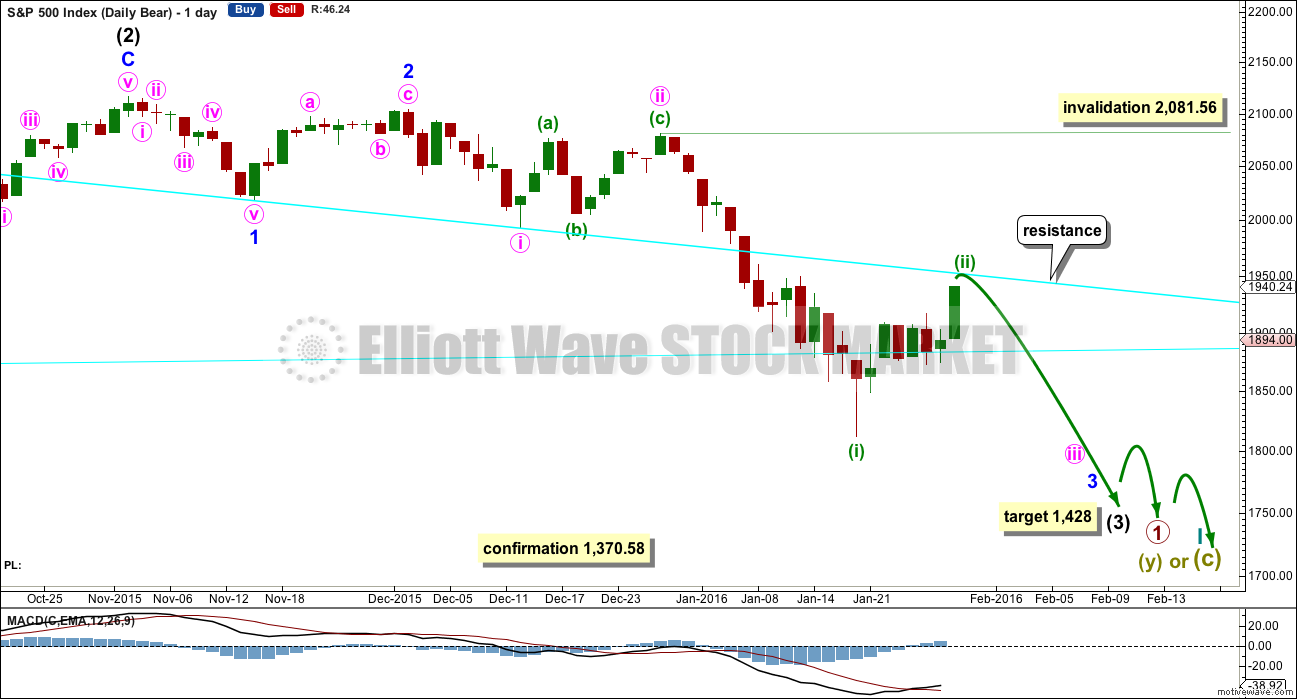
This bear wave count fits better than the bull with the even larger picture, super cycle analysis found here. It is also well supported by regular technical analysis at the monthly chart level.
Importantly, there is no lower invalidation point for this wave count. That means there is no lower limit to this bear market.
Downwards movement so far within January still looks like a third wave. This third wave for intermediate wave (3) still has a long way to go. It has to move far enough below the price territory of intermediate wave (1), which has its extreme at 1,867.01, to allow room for a following fourth wave correction to unfold which must remain below intermediate wave (1) price territory.
Intermediate wave (1) subdivides as a five wave structure with a slightly truncated fifth wave.
Ratios within intermediate wave (1) are: minor wave 3 is 7.13 points short of 6.854 the length of minor wave 1, and minor wave 5 is just 2.82 points longer than 0.618 the length of minor wave 3. These excellent Fibonacci ratios add some support to this wave count.
Intermediate wave (2) was a very deep 0.93 zigzag. Because intermediate wave (2) was so deep the best Fibonacci ratio to apply for the target of intermediate wave (3) is 2.618 which gives a target at 1,428. If intermediate wave (3) ends below this target, then the degree of labelling within this downwards movement may be moved up one degree; this may be primary wave 3 now unfolding and in its early stages.
If this correction exhibits a Fibonacci number, it would most likely complete in a Fibonacci eight or thirteen sessions total. So far it has lasted seven sessions.
I have just one structure today at the hourly chart level for this correction, but it may still be either a fourth wave or a second wave.
HOURLY CHART
Click chart to enlarge.
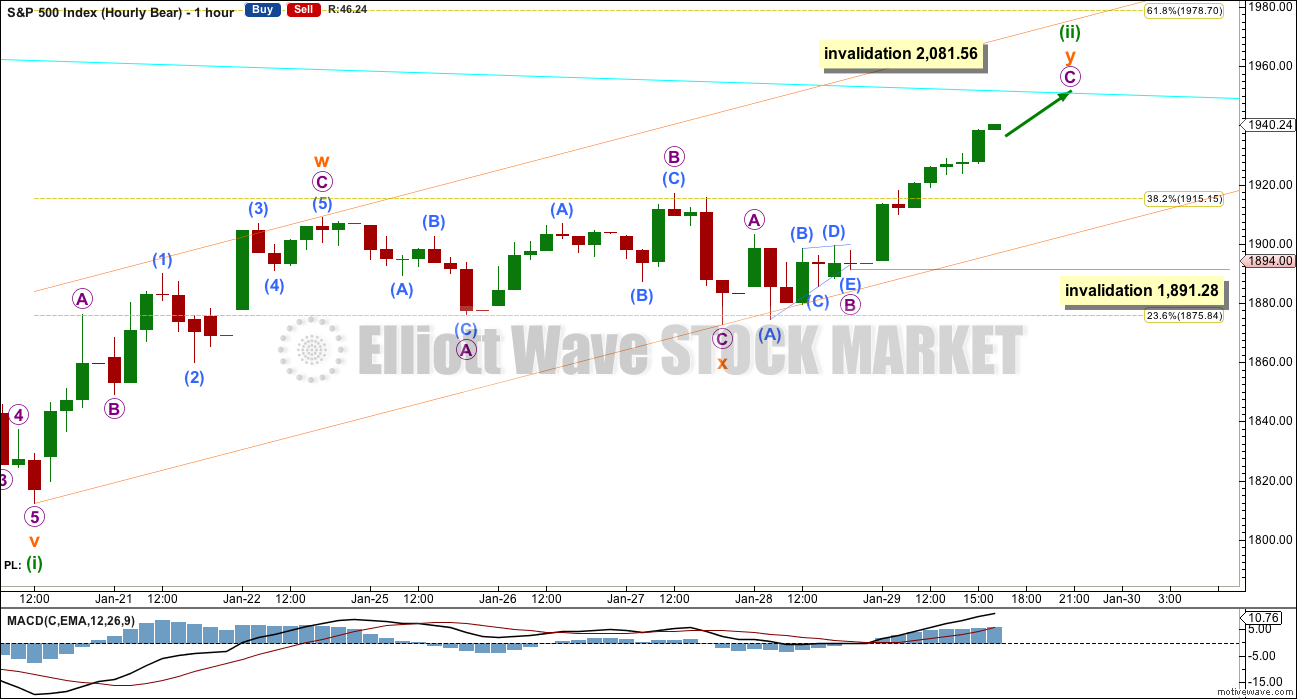
If this correction is a second wave, then it would most likely be a single or double zigzag. Because the first wave up subdivides best as a three, a zigzag, then minuette wave (ii) may be unfolding as a double zigzag.
Double zigzags normally have relatively shallow X waves that do not make new price extremes beyond the start of the first zigzag labelled here subminuette wave w.
Sideways movement ended and was followed by upwards movement; subminuette wave x was already complete as an expanded flat.
Within the second zigzag of subminuette wave y, the triangle may have been a barrier triangle for micro wave B.
Micro wave C may find resistance at the cyan trend line which is copied over today to the hourly chart. This is about 1,950, where price should also find resistance at a horizontal trend line. This target would expect to see no Fibonacci ratio between micro waves A and C.
Minuette wave (ii) may not move beyond the start of minuette wave (i) above 2,081.56.
No second wave correction may move beyond the start of its first wave below 1,891.28 within micro wave C. If this wave count unfolds as expected, then after some more upwards movement a subsequent low below 1,891.28 would confirm a trend change. At that stage, downwards movement could not be a second wave correction within the last impulse up, so the last wave up would have to be complete.
Draw a parallel channel about this correction as shown. When this orange channel is clearly breached by downwards movement, that shall provide trend channel confirmation of a trend change.
TECHNICAL ANALYSIS
DAILY CHART
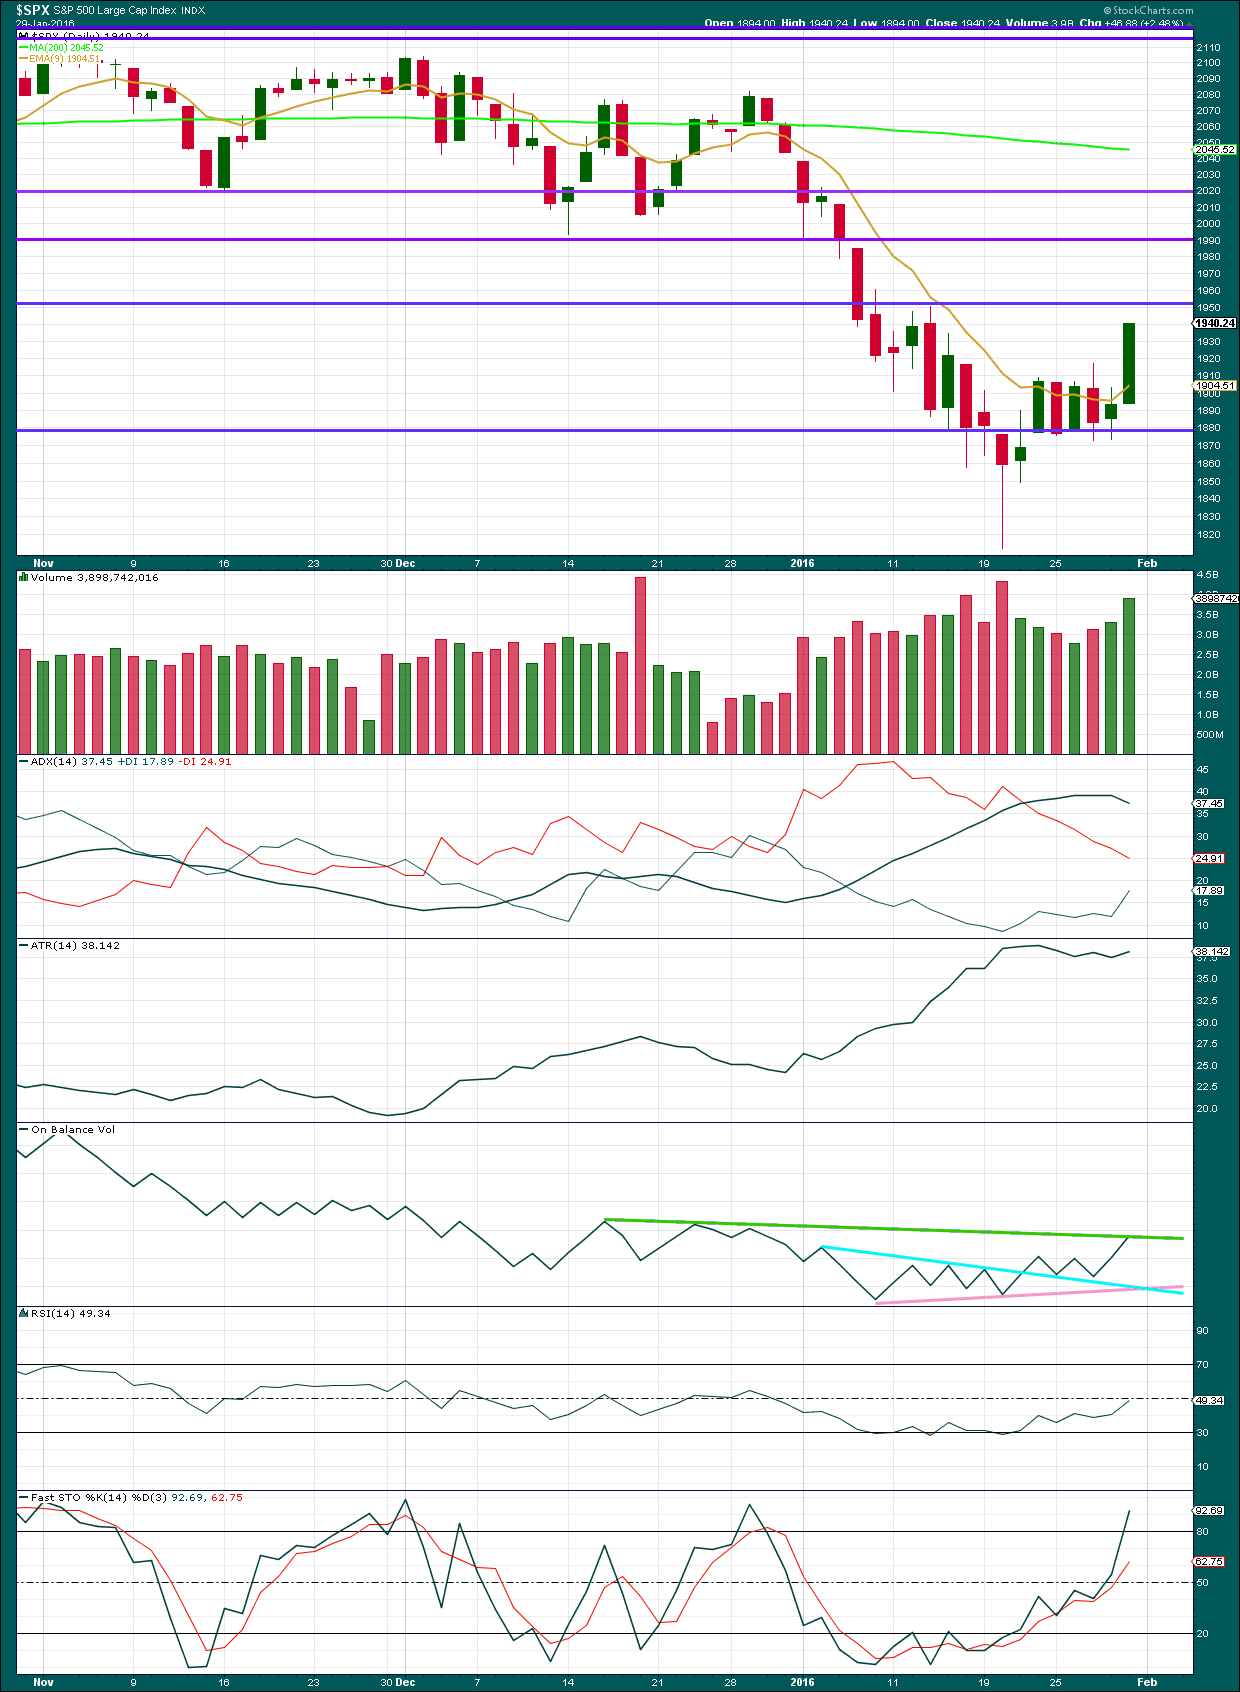
Click chart to enlarge. Chart courtesy of StockCharts.com.
It is very concerning today that Friday’s strong upwards move in price comes with strong volume to support it. If this is a correction against a bear trend, then it should not be supported by volume. This is the most bullish indication from this market since the all time high back in May 2015. Friday’s volume was the highest volume for any upwards day since that date. The rise in price has been supported by volume for two days in a row.
The volume profile short term looks bullish.
On its own, this is not enough to indicate an end to this bear market, but it does give concern. That concern would be alleviated if Monday or Tuesday continue with upwards movement on lighter volume.
ADX does not indicate there is an upwards trend and it has not indicated a trend change. The -DX line remains above the +DX line.
ATR agrees; it too is flat which indicates no clear trend.
On Balance Volume has come up to touch its green trend line. If this line is clearly breached, that shall be further bullish indication.
RSI is neutral. There is plenty of room for this market to fall again, but there is also plenty of room for price to rise.
Stochastics is now reaching overbought. For a range bound market, this would indicate an end to upwards movement either here or very soon.
DOW THEORY
For the bear wave count I am waiting for Dow Theory to confirm a market crash. I am choosing to use the S&P500, Dow Industrials, Dow Transportation, Nasdaq and I’ll add the Russell 2000 index. Major swing lows are noted below. So far the Industrials, Transportation and Russell 2000 have made new major swing lows. None of these indices have made new highs.
At this stage, if the S&P500 and Nasdaq also make new major swing lows, then Dow Theory would confirm a major new bear market. At that stage, my only wave count would be the bear wave count.
The lows below are from October 2014. These lows were the last secondary correction within the primary trend which was the bull market from 2009.
These lows must be breached by a daily close below each point. So far the S&P has made a new low below 1,821.61, but it has not closed below 1,821.61.
S&P500: 1,821.61
Nasdaq: 4,117.84
DJT: 7,700.49 – this price point was breached.
DJIA: 15,855.12 – this price point was breached.
Russell 2000: 1,343.51 – this price point was breached.
This analysis is published @ 03:37 a.m. EST on 30th January, 2016.
Hi
All
I’m early today but I wanted to ask a fib question:
2116 to 2080 was 39 days
2080 to 1940 now is 22 days
89-39-22 = 28 days.
Is that math right ??
Ace,
Over the years the SPX has shown some relationship to time based on Fibonacci numbers. However, there have also been many more times it does not show this relationship. So I take timing based on Fibonacci numbers with a big grain of salt. There are no rules in EW to timing and it is a stretch to even call them guidelines. Of course this is just my opinion based on observation.
ok thanks
Europe looking shakey ,I think crudes seen its highs.gla I think it’s lining up now I’ve taken initial positions
Lara-a most excellent analysis. Feel the force, feel the wave. Surf on!
Thank you Davey.
No surf this weekend for me. It’s an onshore mess 🙁
But I have my GoPro fixed now and it’ll be back on the nose of my board when the waves come again.
TBH I need a rest after last week. So much surf my arms and shoulders almost seized up. So happy!
Lara
Last question for the weekend – how many fib days should the decline from 1978 or 1950 last for this 3rd wave?
This is a really rough estimate and subject to change. Time is harder to predict than price.
So far intermediate (3) has lasted 39 days. I would expect a total Fibonacci 89. So a further 50 days.
It could be quicker. A total Fibonacci 55 would see it continue now for a further 16 days. That seems too quick though.
And give or take up to two days either side of that expectation.
Great thanks – wait is Fibonacci trading days or calendar days?
You mean your full target of 1428 in the next 55 Fibonacci days?
I forgot what Fibonacci days are calendar or trading days. If you can kindly explain I’ll write it down this time…
Trading days.
Count the daily candlesticks.
oh sorry that is where I got confused. So, we should be right here somewhere to the end over the next few months. April 2nd week would see this all completed with a total 89 fib days from Nov 3rd…
89-40(Counting tomorrow Monday)=49 days left for this 3rd wave to be over….
Now when you say 89 days total does that mean the target with the bounce “retrace” or just the target decline??
Lara
I got it wrong.
2116 to 2080 was 39 days
2080 to 1940 now is 22 days
89-39-22 = 28 days.
Is that math right ??
Sorry – if I’m
Counting fib trading days that’s about mid April 2016? That sound right for 55 fib trading days ??
Sorry when was the first actually date and day of current 39 days ago ? I’m still learning so I can go back and look.
It’s on the chart right there.
The start of intermediate (2) on the daily bear chart at 2,116 on 3rd November.
Lara
A daily request addition. What would really be helpful in trying to find out if bounces will happen is somehow keeping track of the red down candles on your opening statement before the next leg down. It was mysterious on the 14th day down we just reversed and that was the clue as the selling was exhausted. So, any shorts that didn’t cover lost potential gains that day but the day after got a little chunk of it.
During that period we had expected a deeper plunge but 8 days later it sky rocketed 7% higher – back once the reversal took place.
Any chance we can keep track of red down days for signs of selling exhaustion? So we aren’t waiting around for another deep plunge or corrective wave to complete?
I am not a day trader and only a position trader but it still is a problem either way you look at it.
Thanks!
On 20th January this is what I posted in my summary:
“A new high above 1,901.44 would indicate a multi day bounce has arrived. It may find resistance at the cyan line on the daily chart and may not move above 1,993.26.”
Two days later a new high above 1,901.44 confirmed a multi day bounce.
Price is now almost at the cyan trend line.
I just don’t know how I could have managed that better.
Bounces will occur. They will be deep and sharp in this bear market. I can only use specific price points to confirm when one has arrived.
And I don’t quite know what you mean by “track red candles”.
Thanks. I must have over looked that. Actually, since the beginning of the decline we had gone down with red candles for days and by the time we hit the 14th day I saw price swing very fast and reverse and USDJPY didn’t confirm for my analysis. I think that was my own observation.
I mean the actual candles from 2080 down to 1812 highlighted in blue…
Lara
Just for further clarification – Text book bear Market is 20% correction or more. How can this be considered a bear market yet technically?
How do you calculate the spx decline ? From 2116 to 1812 or 2080 to 1812 ?
Maybe early stages of bear market perhaps?
The Bear Market has not ended… January 14, 2000 to present.
oh o.k!
I used a bull market trend line as outlined by Magee in “Technical Analysis of Stock Trends” to signal a trend change from bear to bull back in June 2015.
And as Joseph says and the big downwards arrows on the bear wave count make pretty clear, it’s not over.
The targets also make that clear I think.
Thanks! I ordered that book!
I get my information from ->
Technical Analysis of the Financial Markets: A Comprehensive Guide to Trading Methods and Applications (New York Institute of Finance).
And that is another reason why my bear wave count is still an alternate.
I’m waiting for my modified Dow Theory (including S&P and Nasdaq with DJI and DJT) to confirm a bear market before I discard the main bull wave count.
Rodney
I cleaned up the Volume and pushed it below so you can see it more clearly. This could be a day or so. It is just an idea supporting the end of this “bounce” if it is – no jinx…
Lara
I just have a couple very detailed questions I am seeking clarification on. Please take a look:
1. Just this past Thursday what was more likely is pending the
market direction next Mon-Tuesday? Is that correct from your statement below? I understand markets are changing so fast and the elliot wave counts are after the fact but I am still seeking clarification:
This bounce is either another second wave correction or a fourth wave correction, and it should continue for a further two (more likely) or seven (less likely) trading sessions
2. What happened to the less likely situation? I dont see it in the opening statement that you posted? If the less likely is more likely we should be done mid Feb right? Am I missing something here?
3. Are we still due to expect surprises to the downside now or not if this in fact a down trend?
4. How do you define bounce? From the looks of this “bounce” you have it as an option to retrace 100% of the entire move down from 2080 to 1812?
Thank you!
The structure is almost complete so I don’t expect it to continue to total a Fibonacci 13 days. That was the less likely scenario.
I could be wrong, and it could yet continue to mid Feb.
For corrections it is often not until the end or just before the end that the structure becomes clear and then you can figure out when it is more likely to end and draw a channel about it.
That is what happened here.
I define a bounce as any movement against a trend. And yes, a “bounce” can be deep”. A second wave may retrace 100% of the first wave.
But it cannot make a new high. The high should be a lower high.
The trend is still down.
Thanks.
The main reason I joined this site was because you also study other markets and provide analysis!
That insight is helpful!
Because studying the spx alone in itself is not enough to draw and meaningful conclusion.
Verne
If next week we punch through 1979- Just throwing an idea ou there – On further thought we could actually only start the third wave once we get to the end of this upward move. Reason is in my experience third waves don’t stall like this.
Rodney
From a guy who has been on the street for a very very long time:
Cashin: It won’t end Prettily
https://www.youtube.com/watch?v=PKEMBSFW8m8
In review, we have a bullish hammer on the day of the 1812 low. That was also a strong reversal day. We formed a bullish flag and broke out of it on very high volume confirming the move. We have daily MACD with a bullish crossover and a long way to go to the upside.
I think we will have a number of days of upside movement which will relieve the very oversold condition and bring an overbought condition. Then the next wave down will begin. The current wave ii, minuette or green, can go all the way to 2081.56 without an invalidation. That is about 140 SPX points. I am not saying it is going to move there. But it can.
Frankly, I would much rather enter my short positions at a very overbought condition. When the last bull has invested their last dollar certain they will make a strong gain, then the Bear will devour them all. So waiting a week or so is not a problem. It is actually a gift. Like the month of January, this next week and beyond will be very interesting.
Thanks again Lara for all your excellent analysis and commentary. I have a great deal of confidence in your analysis. That has been earned by you and is deserved. I am also thankful for the way the daily blog has developed. We have a lot of wonderful contributors.
By the way, what was going on in the background while you recorded the video. Sounds like bird calls and insects sounds. Sounds like a tropical setting in New Zealand. Enjoy and catch the next big wave, both on the sea and in the market!
Rodney
Good observation. I want to add to it. Typically with a huge volume bar that marks the near term top and then we soon see a reversal. RSI on the daily is already 49. Typically when it hits 60-65 it finds resistance in a downward trend. Further, with a MACD cross over usually the following week you see the tick up move for a period of a number of days although we see it only with 1 bar this week. I find strong resistance at best at 2000 maybe 2008. It could over shoot but that is the most I think it can go. Also, one thing of interest is exactly at 1950 is the 50% fib from 2080 down to 1812. Next week will be interesting for sure…
Interesting. Thanks for the comments on RSI particularly.
I have reached the point of Looking for any clues on any time frame.
The search is very exhausting in a bear market rally to be honest!
The last leg down starting December 29 took a couple of weeks to complete on January 20. Interesting that we are seeing another run up to end the month. Volatility seems to have embarked on monthly peaking cycles and if the pattern holds, this sets up nicely for the next interim bottom sometime in mid February, which would imply resumption of the decline next week. Maybe Sunday night futures will give us a peek at the future.
Looking for the big fat engulfing candle to light the way… 🙂
I sure want to see that this. 2015 was a joke – we spent 8 months putting a top in.
Now this sideways business needs to end!
1950 is both 50% fib re-tracement and area of previous fourth wave. A stall in that area would be significant. If exceeded, next round number of 2000, the area of the 50 DMA, probably in play.
Thanks for your comment Rodney.
Yes, that is the risk. That this second wave correction could continue yet for another week… to total a Fibonacci 13 days and be very deep.
When I look at the structure on the hourly chart and 5 min chart it looks so close to completion. But that volume spike has me really concerned, so I’m approaching this with great caution.
It is vital that we wait for a channel to be breached about this correction before we can have an idea it should be over.
It’s mid summer and the cicadas are out in force. My Mac is right by the open window and we have many birds in our garden, you can hear the Tui’s singing, and they’re beautiful. Northland is almost subtropical in summer.
Have been catching good waves last week as the remnants of cyclone Victor gave us a big swell. When it calmed down for my longboard (about 3ft is my limit) I surfed until my arms were seized with exhaustion 🙂 Happy days!
Hi
Lara
So if this does go higher say 2050. Are we not in a 3rd wave? Also, does that mean feb would produce a green candle stick for the monthly ?
Still in a third wave.
Third waves must subdivide as impulses. Within an impulse there is a second wave and a fourth wave correction.
And second wave corrections can be very deep, they normally are more deep than shallow.
Second wave corrections can retrace up to 100% of the first wave (unusual but possible). The most common target for them is the 0.618 Fibonacci ratio.
Just because this is time consuming and deep doesn’t mean that a third wave isn’t unfolding.
This is quite normal, just protracted in time.
And that makes perfect sense for the bear wave count. This bear market could be slow moving, with annoyingly time consuming deep corrections interspersed with violent downwards plunges.
So far that’s what its been doing pretty much.
Expect price to find ?support? and end at the cyan trend line on the daily chart.
Thank you for pointing out the error. I’ve edited text: changed support to resistance. (Comment by Cesar)