
Sideways movement continues exactly as expected.
Summary: This bounce is either another second wave correction or a fourth wave correction, and it should continue for a further three (more likely) or eight (less likely) trading sessions. If price moves higher from here, then look for resistance at the downwards sloping cyan trend line on the daily charts.
To see how each of the bull and bear wave counts fit within a larger time frame see the Grand Supercycle Analysis.
To see detail of the bull market from 2009 to the all time high on weekly charts, click here.
Last published monthly charts can be seen here.
If I was asked to pick a winner (which I am reluctant to do) I would say the bear wave count has a higher probability. It is better supported by regular technical analysis at the monthly chart level, it fits the Grand Supercycle analysis better, and it has overall the “right look”.
New updates to this analysis are in bold.
BULL ELLIOTT WAVE COUNT
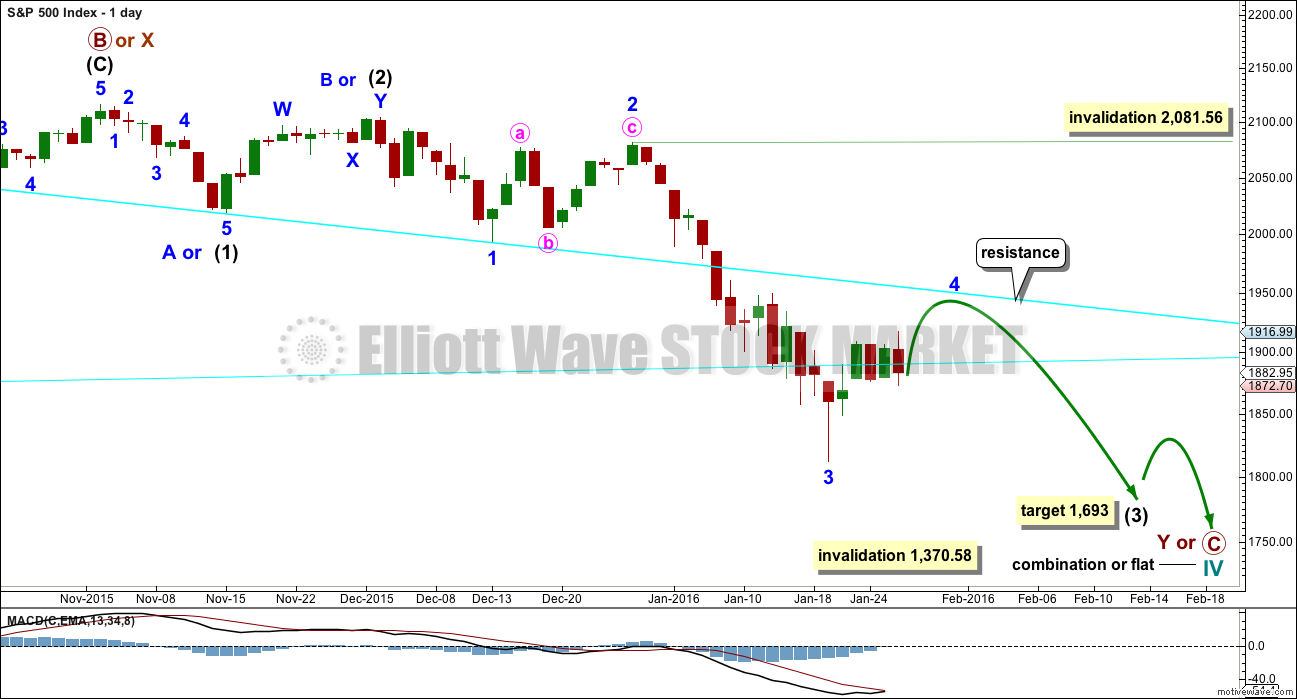
DAILY CHART – COMBINATION OR FLAT
Click chart to enlarge.
This wave count is bullish at Super Cycle degree.
Cycle wave IV may not move into cycle wave I price territory below 1,370.58. If this bull wave count is invalidated by downwards movement, then the bear wave count shall be fully confirmed.
Cycle wave II was a shallow 0.41 zigzag lasting three months. Cycle wave IV should exhibit alternation in structure and maybe also alternation in depth. Cycle wave IV may be a flat, or combination.
Cycle wave IV may end within the price range of the fourth wave of one lesser degree. Because of the good Fibonacci ratio for primary wave 3 and the perfect subdivisions within it, I am confident that primary wave 4 has its range from 1,730 to 1,647.
Primary wave C should subdivide as a five and primary wave Y should begin with a zigzag downwards. This downwards movement is either intermediate waves (1)-(2)-(3) of an impulse for primary wave C or minor waves A-B-C of a zigzag for intermediate wave (A). Both these ideas need to see a five down complete towards the target, so at this stage there is no divergence in expectations regarding targets or direction. When and if these two ideas diverge, I will separate them out into two separate charts. For now I will keep the number of charts to a minimum.
Primary wave A or W lasted three months. Primary wave C or Y may be expected to also last about three months. It is now in its second month at this stage and may not be able to complete in just one more. It may be longer in duration, perhaps a Fibonacci five months. That would still give a combination the right look at higher time frames.
Within the new downwards wave of primary wave C or Y, a first and second wave, or A and B wave, is now complete. Intermediate wave (2) or minor wave B lasted a Fibonacci 13 days exactly. At 1,693 intermediate wave (3) would reach 4.236 the length of intermediate wave (1).
This daily chart and the hourly chart below both label minor wave 3 as complete. It is also possible that the degree of labelling within minor wave 3 could be moved down one degree, because only minute wave i within it may be complete. The invalidation point reflects this. No second wave correction may move beyond its start above 2,081.56 within minor wave 3. If this bounce is minor wave 4, then it may not move into minor wave 1 price territory above 1,993.26.
Price broke through support at the cyan trend line which is drawn from the August lows to September lows. This line is no longer providing resistance. The next line to offer resistance may be the downwards sloping cyan line.
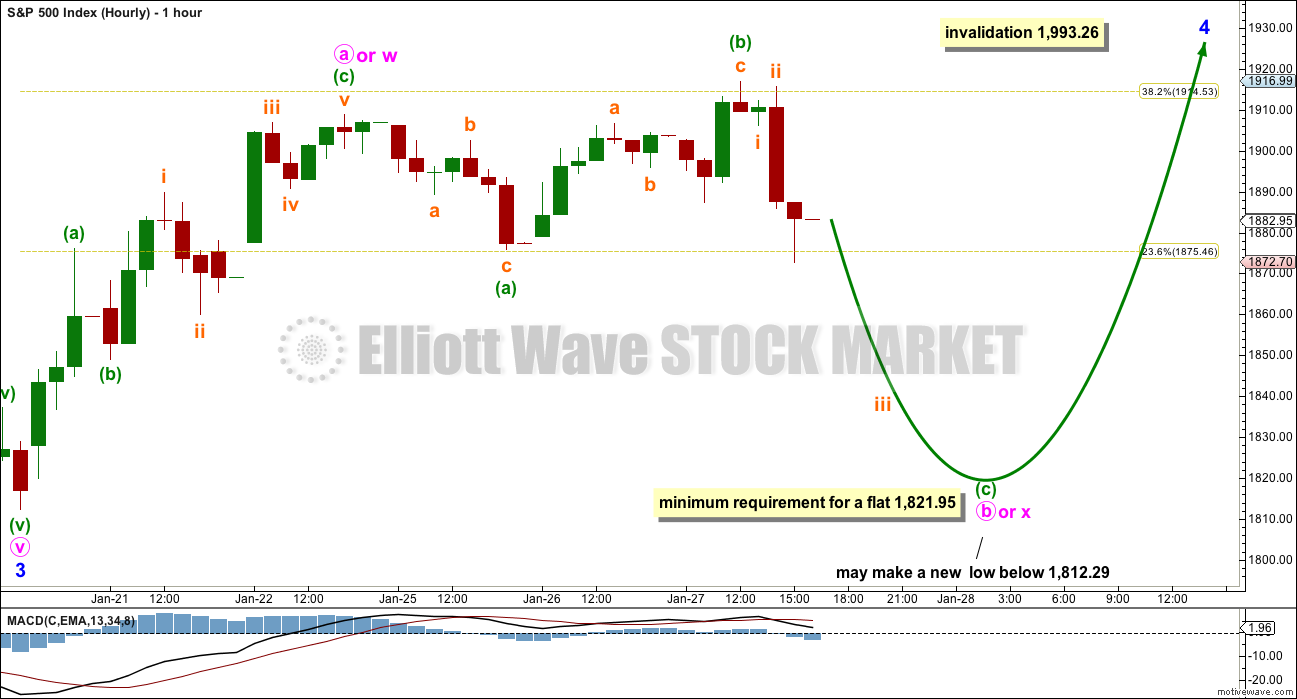
HOURLY CHART
Click chart to enlarge.
At this stage, the bull and bear wave counts are essentially the same at the hourly chart level. Commentary will be with the bear wave count.
BEAR ELLIOTT WAVE COUNT
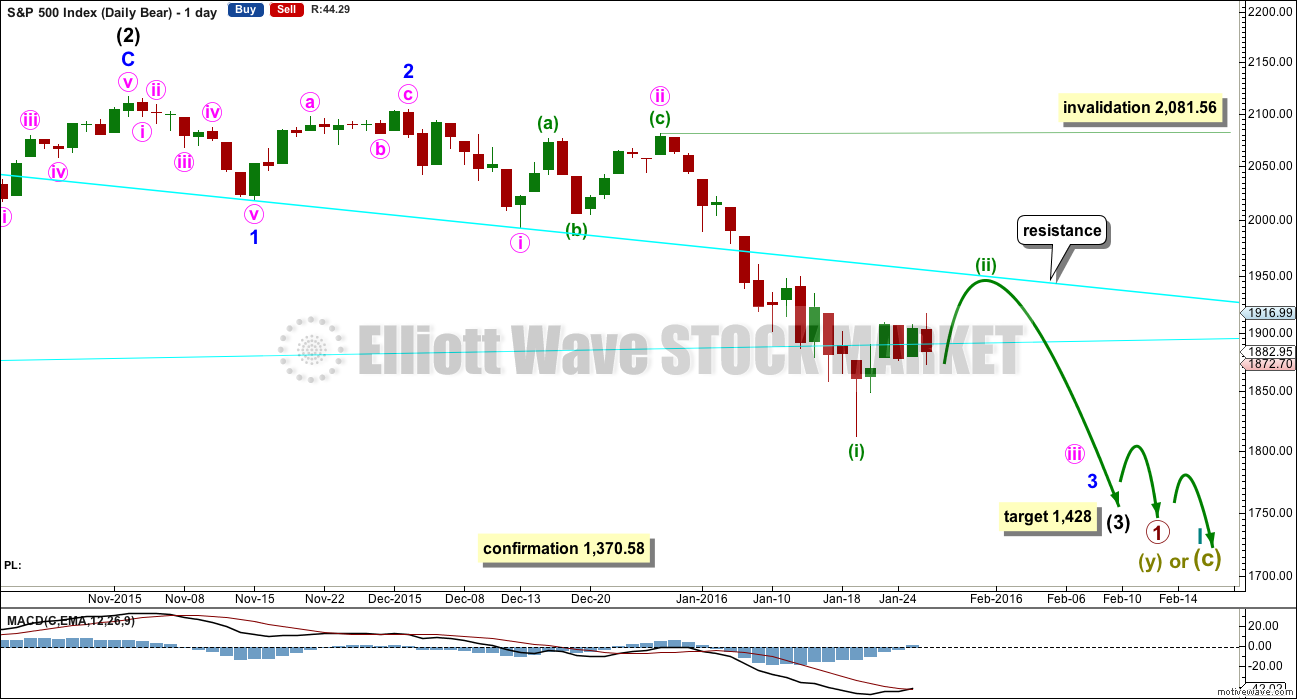
DAILY CHART
Click chart to enlarge.
This bear wave count fits better than the bull with the even larger picture, super cycle analysis found here. It is also well supported by regular technical analysis at the monthly chart level.
Importantly, there is no lower invalidation point for this wave count. That means there is no lower limit to this bear market.
Downwards movement so far within January still looks like a third wave. This third wave for intermediate wave (3) still has a long way to go. It has to move far enough below the price territory of intermediate wave (1), which has its extreme at 1,867.01, to allow room for a following fourth wave correction to unfold which must remain below intermediate wave (1) price territory.
Intermediate wave (1) subdivides as a five wave structure with a slightly truncated fifth wave.
Ratios within intermediate wave (1) are: minor wave 3 is 7.13 points short of 6.854 the length of minor wave 1, and minor wave 5 is just 2.82 points longer than 0.618 the length of minor wave 3. These excellent Fibonacci ratios add some support to this wave count.
Intermediate wave (2) was a very deep 0.93 zigzag. Because intermediate wave (2) was so deep the best Fibonacci ratio to apply for the target of intermediate wave (3) is 2.618 which gives a target at 1,428. If intermediate wave (3) ends below this target, then the degree of labelling within this downwards movement may be moved up one degree; this may be primary wave 3 now unfolding and in its early stages.
I have two scenarios for the correction which began two days ago. It may be either a second wave or a fourth wave. Looking at how far down intermediate wave (3) still needs to go on the weekly chart, I would favour the second wave scenario. That will be the main hourly wave count for that reason.
If this correction exhibits a Fibonacci number, it would most likely complete in a Fibonacci eight or thirteen sessions total. So far it has lasted five sessions.
HOURLY CHART
Click chart to enlarge.
If this correction is a second wave, then it would most likely be a single or double zigzag. Because the first wave up subdivides best as a three, a zigzag, then minuette wave (ii) may be unfolding as a double zigzag.
Double zigzags normally have relatively shallow X waves that do not make new price extremes beyond the start of the first zigzag labelled here subminuette wave w.
Sideways movement for the last two sessions may have been a continuation of subminuette wave x. It now fits as a shallow flat correction.
The first zigzag reached the 0.382 Fibonacci ratio. The second zigzag may reach up to the 0.618 Fibonacci ratio about 1,979.
So far this correction has lasted a Fibonacci five days. It is incomplete. The next Fibonacci number in the sequence is eight which would see this correction continue now for a further three sessions.
Minuette wave (ii) may not move beyond the start of minuette wave (i) above 2,081.56.
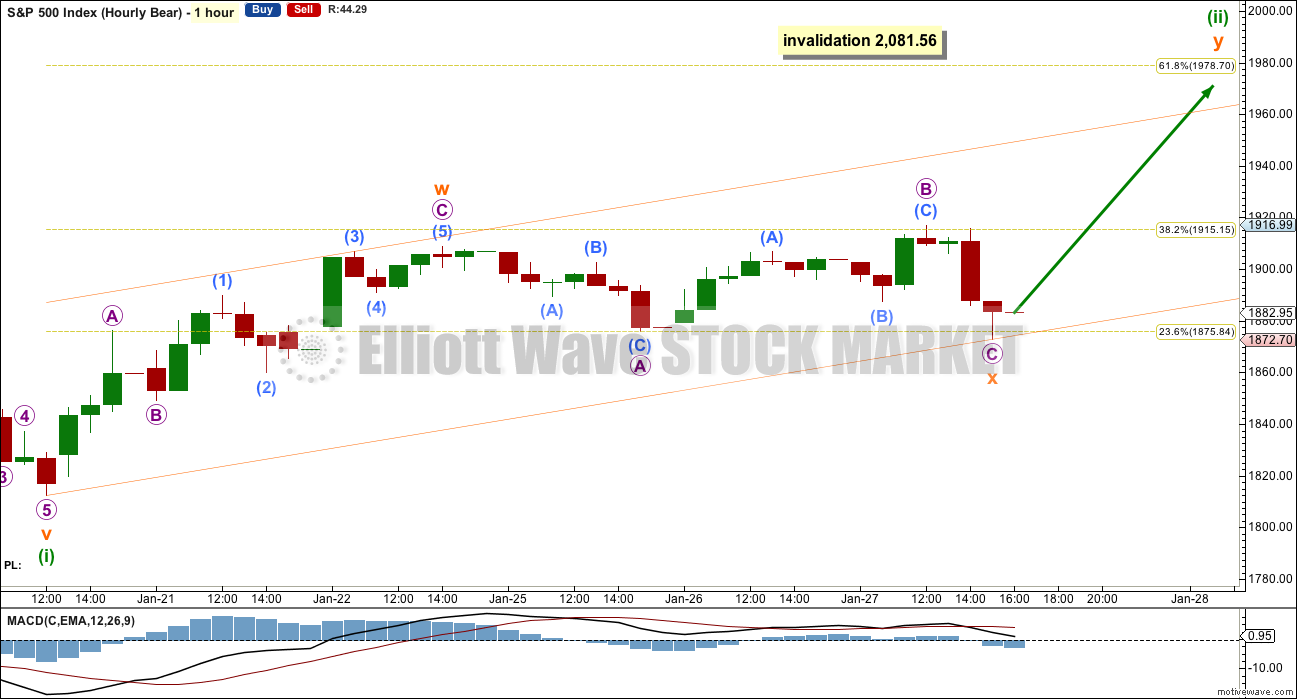
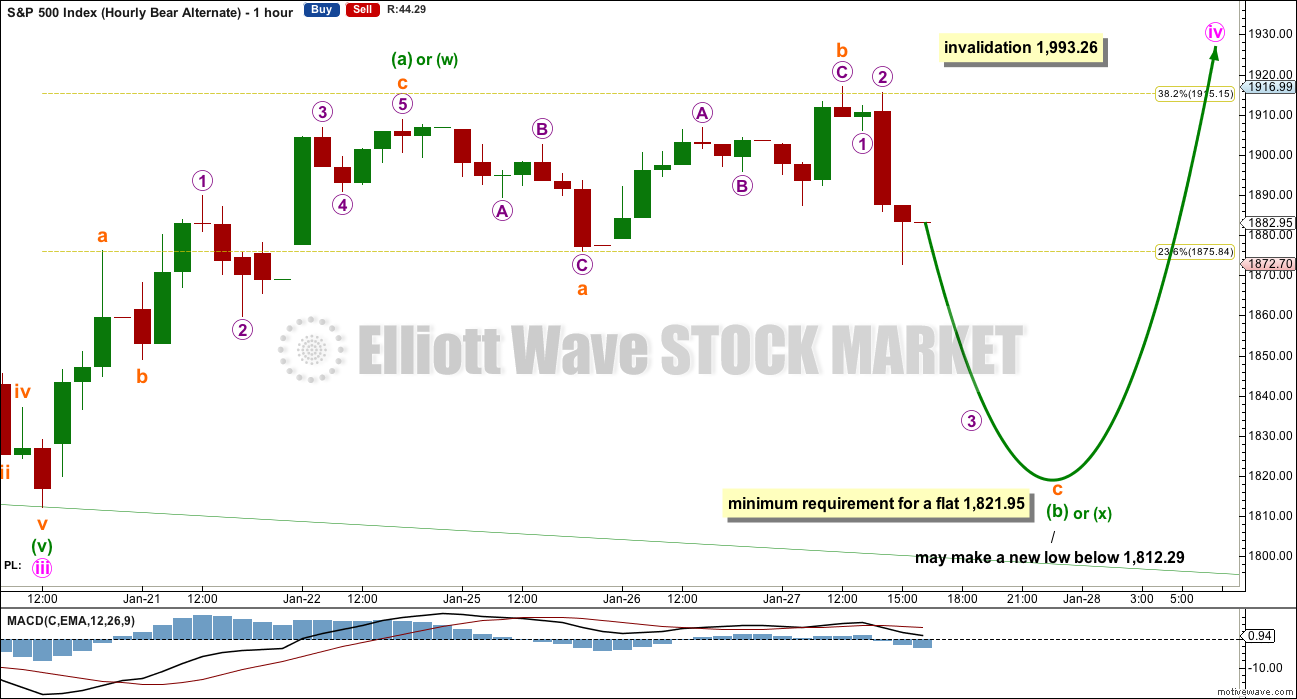
ALTERNATE HOURLY CHART
Click chart to enlarge.
If the degree of labelling within the last wave down is moved back up one degree, then this correction may be a fourth wave.
This wave count expects that the middle strongest part of intermediate wave (3) is over. This may be the case; an extended fifth wave down to follow this correction may be able to take intermediate wave (3) down to the target.
Minute wave iv may not move into minute wave i price territory above 1,993.26.
The first wave up of minuette wave (iv) subdivides best as a three, a zigzag. This means that minuette wave (iv) may be unfolding as either a flat, triangle or combination. It could also be a double zigzag as per the labelling in the first bear hourly chart.
Within an expanded flat, running triangle or combination, minuette wave (b) or (x) may make a new price extreme beyond the start of minuette wave (a) or (w) below 1,812.29. There is no lower invalidation point for this wave count.
Minuette wave (b) or may be unfolding as an expanded flat correction.
If minute wave iv is unfolding as a larger flat correction, then within it minuette wave (b) must retrace a minimum 90% of minuette wave (a) at 1,821.95.
If minute wave iv is unfolding as a combination, then there is no minimum requirement nor maximum limit for minuette wave (x).
If minute wave iv is unfolding as a triangle, then the high of subminuette wave b for today’s high could possibly be the end of an A wave within a triangle, as a double zigzag. This would expect a lot more sideways movement to last several more days. It is possible at this stage, but I judge it the least likely structure to now be unfolding.
Overall, it must be understood that when price is within a consolidation as it is now it is impossible to tell which Elliott wave structure will unfold. A fourth wave may be any one of 23 possible structures. The labelling will change as the structure unfolds. It is impossible to tell what pathway price will take during the correction due to the great variety of corrective structures. My focus will be on determining when it could be over.
TECHNICAL ANALYSIS
DAILY CHART
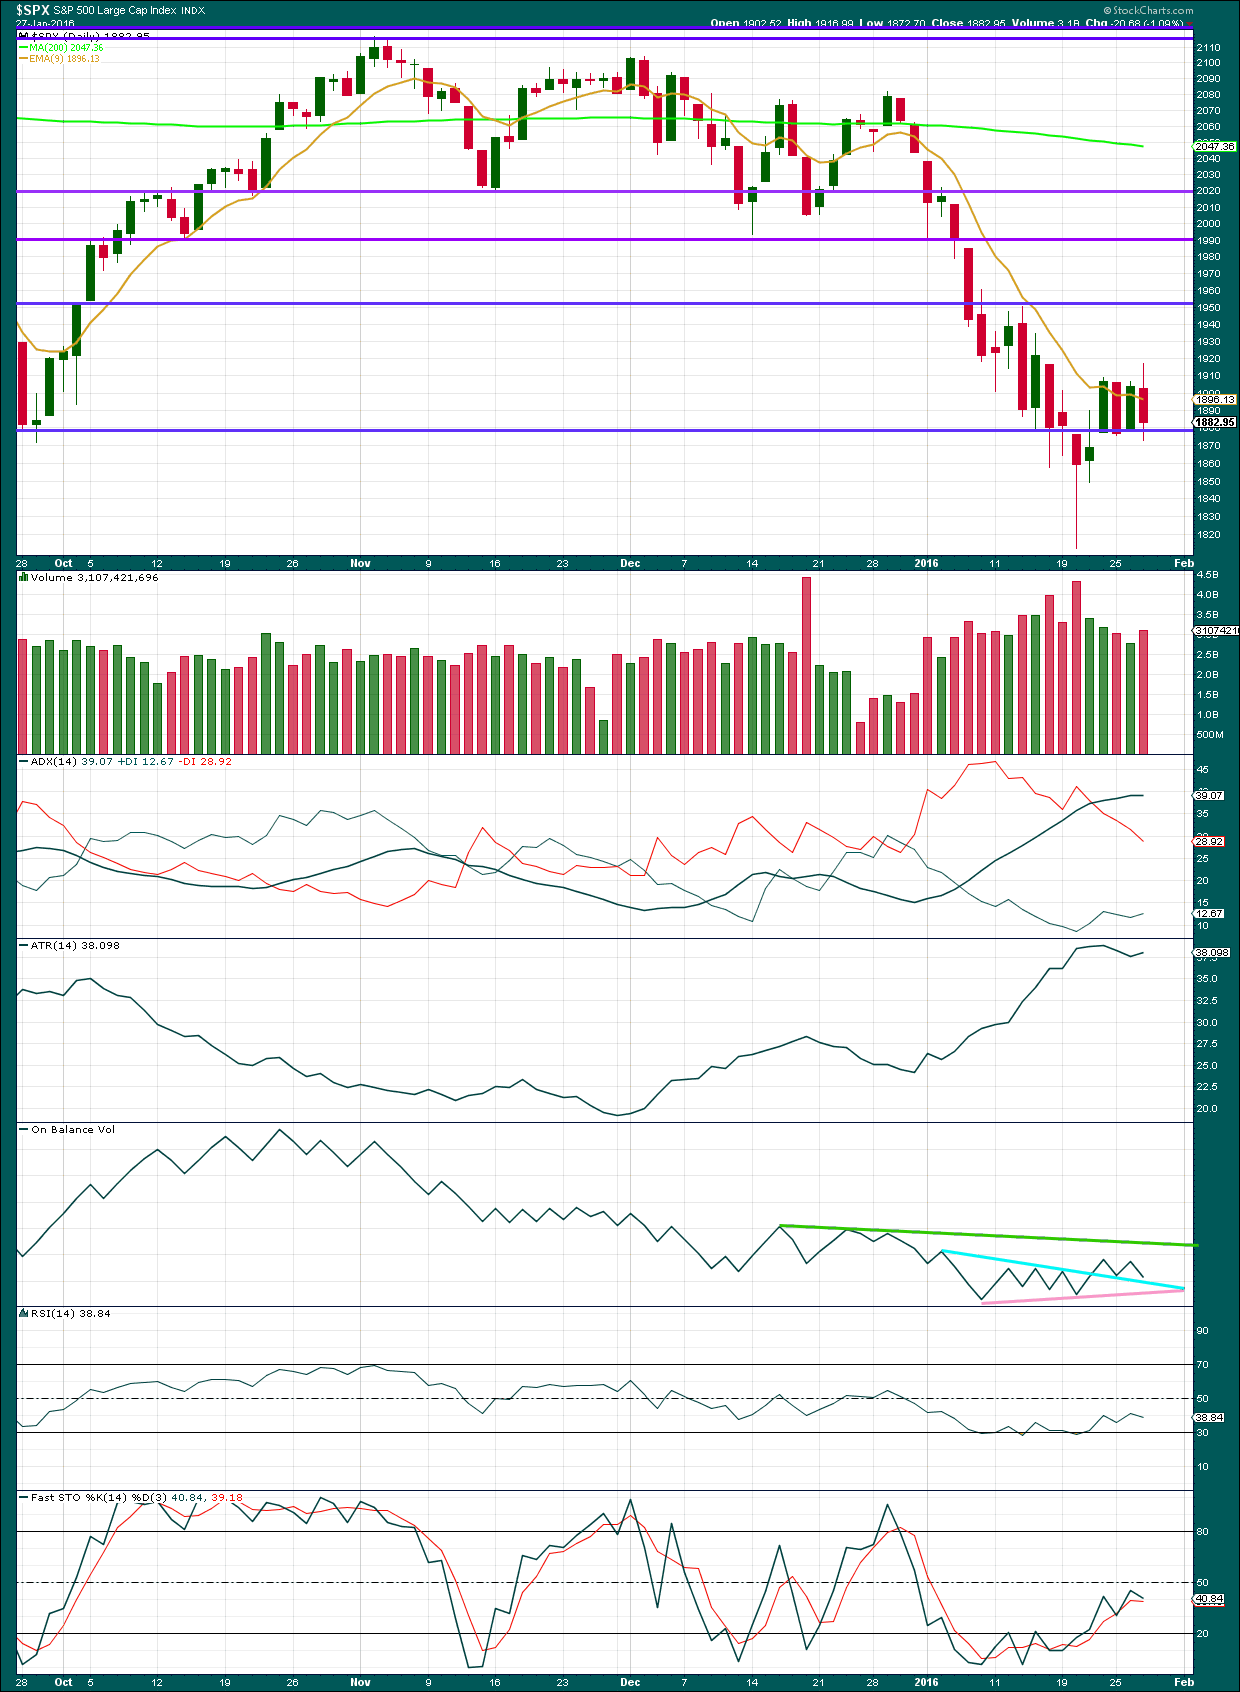
Click chart to enlarge. Chart courtesy of StockCharts.com.
As price fell to the last low, it came on increasing volume. The fall in price was supported by volume.
As price has moved higher and then sideways for the last four days, it still overall comes on declining volume. This looks typically corrective; normally during a consolidation volume declines.
ADX is today flat. Finally, it agrees with ATR that there is no trend. The market is consolidating.
On Balance Volume is turning downwards and may find support at the blue line. To the upside, it may find resistance at the green line.
If the market is consolidating at this stage, then it should be expected that price will swing from support to resistance and back again. Stochastics may be used to show when each swing ends. When Stochastics reaches overbought, then expect price to find resistance and turn down. With Stochastics not yet overbought and increasing further, upwards swings from price should be expected within this consolidation.
DOW THEORY
For the bear wave count I am waiting for Dow Theory to confirm a market crash. I am choosing to use the S&P500, Dow Industrials, Dow Transportation, Nasdaq and I’ll add the Russell 2000 index. Major swing lows are noted below. So far the Industrials, Transportation and Russell 2000 have made new major swing lows. None of these indices have made new highs.
At this stage, if the S&P500 and Nasdaq also make new major swing lows, then Dow Theory would confirm a major new bear market. At that stage, my only wave count would be the bear wave count.
The lows below are from October 2014. These lows were the last secondary correction within the primary trend which was the bull market from 2009.
These lows must be breached by a daily close below each point. So far the S&P has made a new low below 1,821.61, but it has not closed below 1,821.61.
S&P500: 1,821.61
Nasdaq: 4,117.84
DJT: 7,700.49 – this price point was breached.
DJIA: 15,855.12 – this price point was breached.
Russell 2000: 1,343.51 – this price point was breached.
This analysis is published @ 10:15 p.m. EST.
Hi
All,
This would be a nice path and would give a double bottom and good trap in my opinion!
We head lower into Feb to create positive divergence and then whipsaw most of Feb back up to near 2,000 and then sell off March – April. Just an idea nothing more!
The team feedback would be much appreciated! no jinx – 2016 crazy spx…
That makes perfect sense options and would be very much in keeping with my preferred bearish wave count. We need to see a completion of the current wave down in either a final five down, or a three, four, five. Either scenario would expect a second wave up at primary degree and it would be probably quite deep, convincing the crowd that the bear market is over. It is going to present the shorting opportunity of a lifetime. I like it dude! 🙂
ps I am also starting to think that we are in a fourth wave and will see an extended fifth to complete this leg down.
Hi
Lara
How much probability now does the alternate bearish count hold? Reason I ask is it would set a nice positive divergence on the Macd for a good bounce back to the 61.8 at 1989.
The hourly bear alternate?
I’d say about even with the first hourly bear.
It’s just impossible to tell what structure will evolve. All I can say with reasonable confidence is it’s not over.
Assuming you mean more upside?
Barry,
I think the upside could be limited for the time being and more downside before another corrective wave up. That is just my guess nothing more!
Lara,
Sorry, correct – the hourly bear. O.k, that makes sense – it is definitely tricky.
I thought it would be to easy to sell off this market that low to the 1400 just now.
From my history, it could very well just retest the 1810 lows and then run up for weeks in Feb to test the 1978ish and then fall come March-April.
This is just pure speculation on my part!
Looks like a split decision on the round number rumble. Bye all!
Have a great evening!
AMZN misses and is crashing.
The most ridiculously over-priced stock in the universe. 300 puts a year out is money lying in a corner. 🙂
Bears have come knocking to reclaim DJI 16,000.00
Can they?…will they?! There sure is a lot of fur flying around… 🙂
Lets hope the bear is grizzly and not going to take no for an answer!!
Russell and Transports do not look auspicious for the near-term bullish case. Hang tough!
The long and winding road…thaaa-aat leads…..? 🙂
For the double zigzag idea: it’s still not over. I would consider now the possibility that X is completing as a triangle.
For the flat / combination idea: still not over and getting ridiculously hard to analyse. I can see so many possibilities… I could publish several charts there. But I’ll publish one. There really is no point trying to predict the torturous pathway of a small correction, the goal should be to identify when it may be complete and what direction the breakout should be.
No change to analysis today. The correction continues.
Buying UVXY at support…stop at 40.00
Looks like a classic break from the apex. If a real break-out upwards it should keep going, if false it will be sold hard immediately…
does that Y wave on the first hourly chart have to follow a certain pattern to a high? or can it meander sideways clinging to this lower fib level? at about 1915.
The one thing we know for sure is X cannot violate the start of W and Y up has to unfold as a zig-zag.
Looks like we are approaching the apex of a rising wedge and so some kind of resolution to the meandering just ahead…UVXY suggesting break to the downside…bullish falling wedge…
Nope.
If a combination is unfolding then there is no maximum length nor minimum requirement for the X waves within them.
X waves in combinations can make new price extremes below the start of W.
But if its a double zigzag that’s a different story.
Because combinations and double zigzags are two different kinds of corrective structures.
Technically there is no maximum length for an X wave within a double zigzag either, but I really think there should be. The rule of a B wave within a single zigzag should apply. Within a double zigzag X should not move beyond the start of W.
Now you won’t find that in Frost and Prechter.
I’m not exactly re-writing the rules, I’m just adding one which is completely in line with all that Prechter has written about this structure in the book.
I stand corrected! 🙂
I am not sure why I thought I saw that in the analysis. Perhaps you said that X tended to be shallow…
Yep! You did indeed say “normally”….
Looks like the bears are content to let the bulls expend a lot of buying power challenging the round number pivots and keeping powder dry for repelling moves above. Probably waiting for signs of buying exhaustion on the part of the bulls before selling hard…
Verne
It looks like the “alternate hourly chart” is in play? Your thoughts?
Thanks,
Ace
I think none of the wave counts have been invalidated so far so all are in play…
I think the close is the best direction. The intra day swings could be mis leading here!
Wow! Some heavyweight just made a monster block short sale of SPY that drove the index down to 181.00!! YIKES!! ( Yeah, I know, it’s not going to show up on regular charts…)
Heavyweight player? Come on Verne, we know it was you 🙂
Awwww…Shucks!! You got me…!! 🙂
The bulls have now spent an entire trading week trying to surmount that cyan resistance line connecting the August and September lows.
While it did bend, it certainly did not break, and the longer it holds, the stronger it becomes. It is interesting how it has been co-incident also with round number resistance. Just as it has been a magnet for the bulls’ effort the last week, we could be about to see a reversal of polarity… 🙂
Shaking the trees… 🙂
You are right vern, fruit over at treling stop and This relationship end of
*** ??? ??? ????? ???? ????????! ***
Kol Tuv Avnerilan!
Thank you dear friend !
I buy for refreshment, even likes mainly short. line from graph lower canal vesting an hour
????????????
I think Avnerilan is not a native English speaker so you sometimes have to dig a bit to get his meaning. I think he is saying that though he is mainly short, he is making a fun, speculative long trade based on what he thinks is a bull channel on the hourly chart… 🙂
Okay… Thanks
Most welcome! 🙂
You are large… vern
Joseph, trademark short-term future contract
The market seems to be following oil prices… its been a good predictor of the market over the past few weeks. When oil opened today above 34, market was up big. Now at 33, markets coming back down. Just an interesting correlation. If the rebound in oil is over, the correction in stocks probably over also…
This gartley suggest highs are in, I’m watching very closely now highs could be in given the correlation of late
Note the volume spike with the highs and some divvy
Thanks for the post. Would love to know Lara’s take on the oil market. But I’m not subscribed to her gold analysis. It has bounced more than 25% from last week’s lows. It feels like highs are in as you mentioned
I publish US Oil analysis once a week over on Elliott Wave Gold for members there.
I’m expecting that the bounce today may just possibly be over for Oil. However, and this is really important, it needs to breach a channel drawn about it.
Oil has just completed a fourth wave correction which has slightly overshot its Elliott channel and looks like a three. It has perfect alternation with the second wave. It all looks like it should be done.
When Oil has breached a channel about the correction that shall be my signal that the downwards trend has resumed.
Not yet. But may be close.
Thanks Lara 🙂
Can you tell us what price it needs to breach to signify that this bounce is over?
Here is a chart of the double zig zag on a 30 minute chart of SPX. I think the correction is over and this market is heading to new lows.
If you are right, UVXY will take out 50 today and make a moon-shot for 100 over the next few days…
Nice work Thomas! Much appreciated!
I read a similar chart at the 15 min. level with a similar conclusion yesterday.
I had help for sure.
Looks like we both are using the same help. Hope they are both right and that it finally happens. I have everything positioned for it. I don’t want to take it off again.
Despite elevated futures, outside reversal day and failure to re-take DJI 16,000.00 and SPX 1900.00 a cautionary note IMHO. If a bearish engulfing candle is printed today I am running for dear life…!
Futures indicating a very nice pop for those upside hedges…a very nice pop indeed! Thank you banksters! 🙂
Vernecarty,
I have a question for you. Yesterday the VIX printed a bar on the 5 minute chart with a high of 27.22 and a low of 20.85. What is that all about and does it have any significance? Thanks for your response and thank you for all your comments. I find them quite helpful and a great added value to this blog.
I responded to that query from options yesterday but you probably missed it. With apologies to those who heard it before, I think what you are seeing is some traders diligently and steadily accumulating long volatility positions and others shorting the pop in a knee-jerk reaction reversion- to- the- mean trade. I suspect the latter have not taken into consideration the changing market environment. Aggressive buys and sells are generating those long upper and lower wicks.
I would not be surprised of some algos are also currently programmed to sell a certain percentage pop higher in the VIX.
Thank you and sorry you needed to repeat this. Have a great day.
No problem! 🙂
Looks like a double zig zag was complete yesterday and this market is heading to new lows.
I does look like a possibility on the 15 minute time frame. At any rate, we got that cash dump today on weak economic data and once again, those round number pivots are key. The longer we meander around them without a decisive move higher, the greater the chance that we head South of the border with a vengeance…the market continues to give ample opportunity to get positioned and this may well be the last one…
I love it when the two hourly chart options are diabolicly opposed by 100pts in either direction